Improvement Metaphor Template for PowerPoint & Keynote

Improvement Template for PowerPoint
Metaphor improvement template for PowerPoint and keynote is a growth chart that shows the business growth or organizations development over a period. The two slide template contains bar charts and line graph with PowerPoint clipart illustrating the progressive movements. You can precisely present financial growth or sales growth by this growth template. Business needs improved or innovative strategies. So, the presenter can utilize this template for graphically representing strategy and business growth as identical twins. This charts and graph shows improvement is a fluctuate phenomenon because of the decrease and increase pattern. These ups and downs pattern of growth template is perfect for financial or sales growth presentation. The bar charts and line graph demonstrates same pattern of growth by two distinct statistical tools. This style will help the audience to grasp their lessons quickly and easily.
The graphical image in the black background is incredible and visually appealing. Each bars are colored differently, hence, the irregularities of growth can be easily caught by the audience. Besides, the line graph represents financial and business icons that will support for quantitative as well as qualitative presentation. However, this is supporting slide, you can use this as it is a part of your PowerPoint collections. You can edit the improvement PowerPoint diagram such as change the color combination or resize text fonts etc. further; users can change the background color that may alter the entire appearance of the PowerPoint slide.
You can access more Improvement Templates here Grab the free ppt now!
Login to download this file

Item ID
SB00542
Related Templates

Metaphor Process Improvement PowerPoint Template and Keynote template
Keynote Templates
Premium

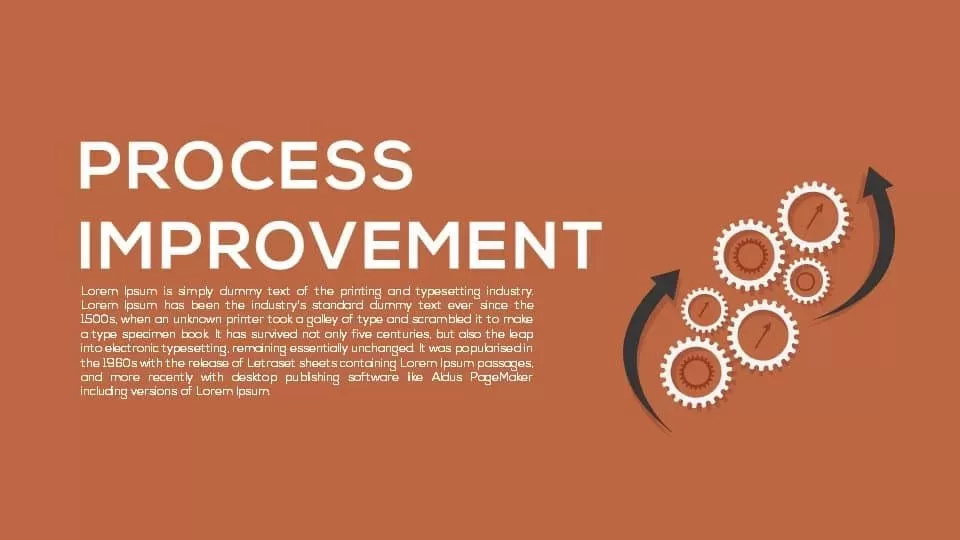
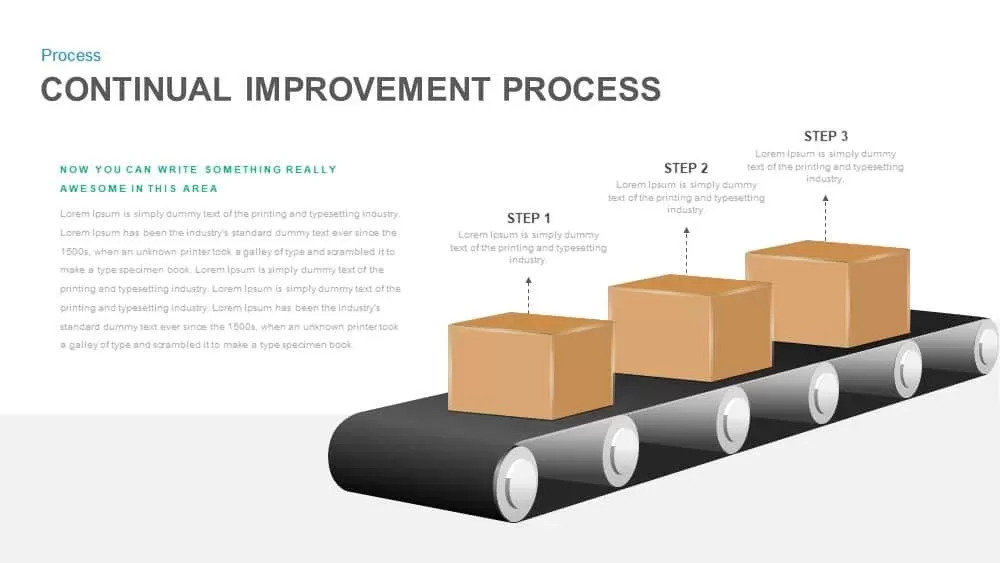
Continual Improvement Process Template for PowerPoint and Keynote
Diagrams
Premium

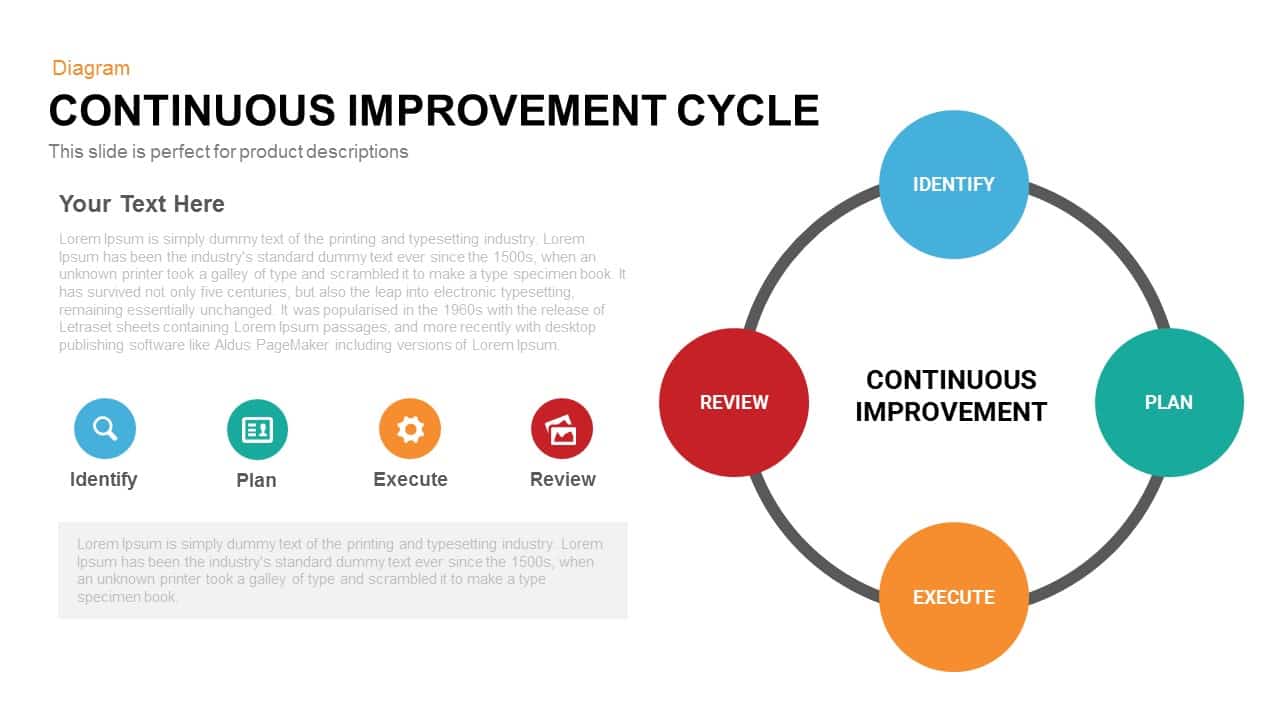
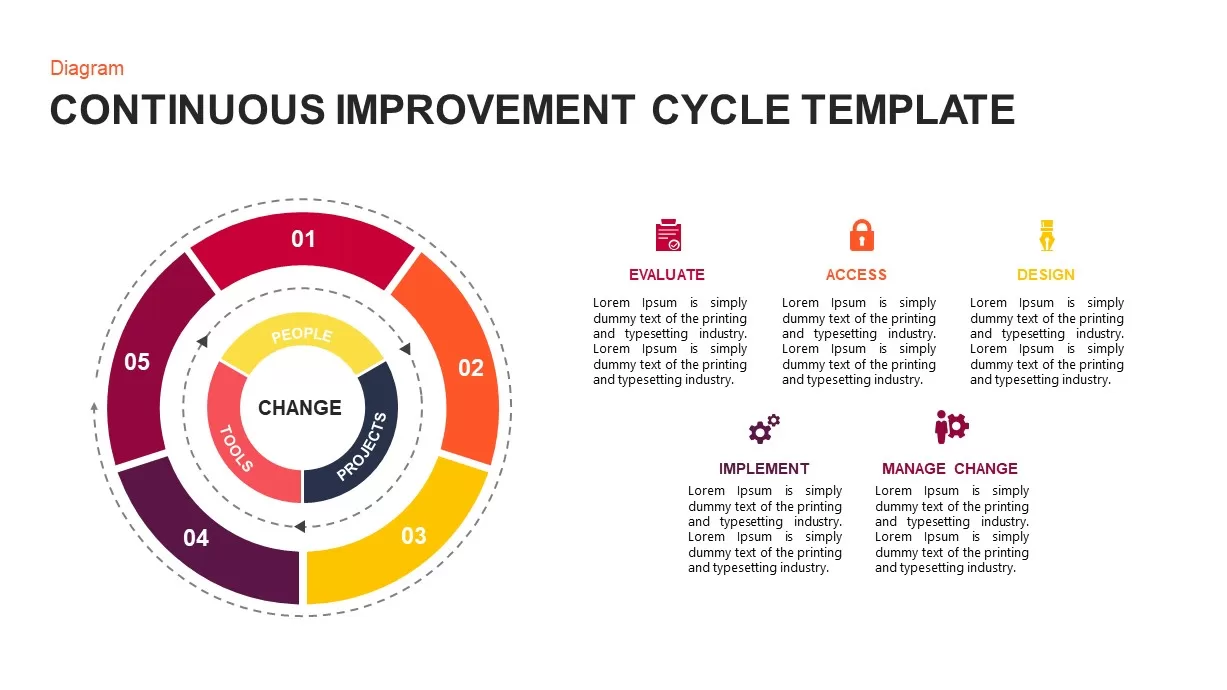
Continuous Improvement Cycle Template for PowerPoint and Keynote
Circular Diagrams
Premium
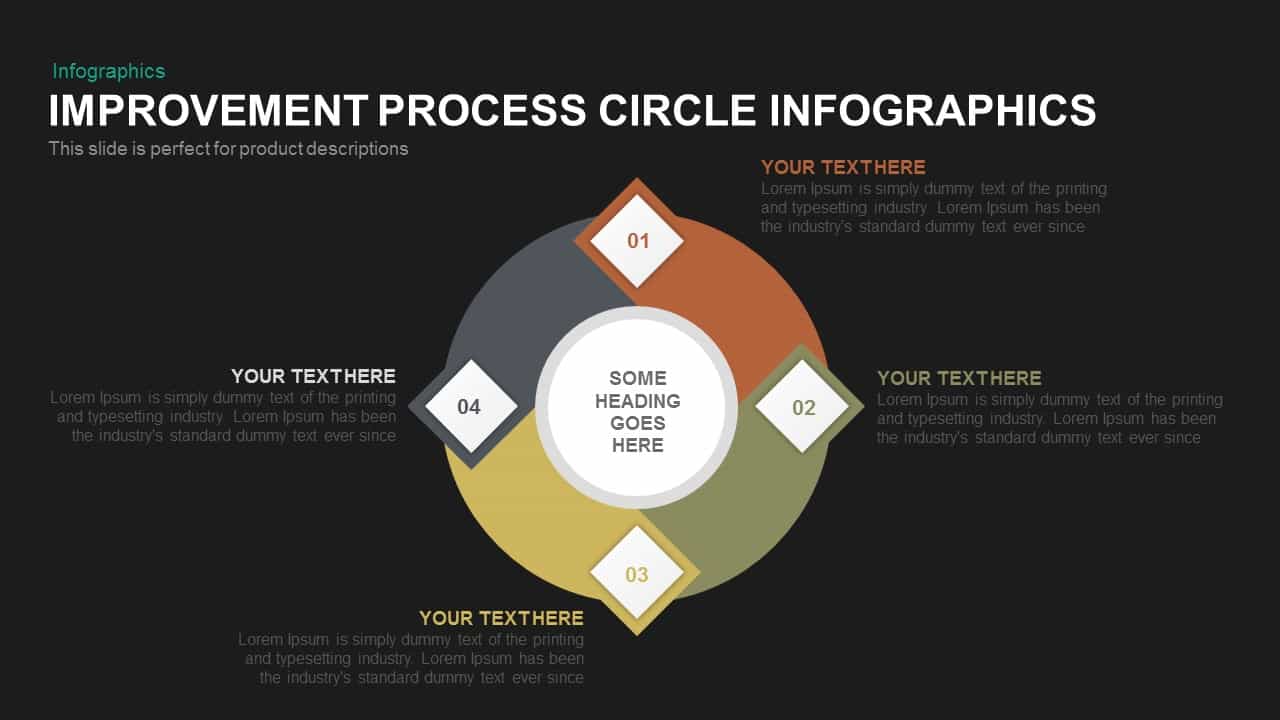
Process Improvement Circle Infographics Template for PowerPoint and Keynote
Diagrams
Premium
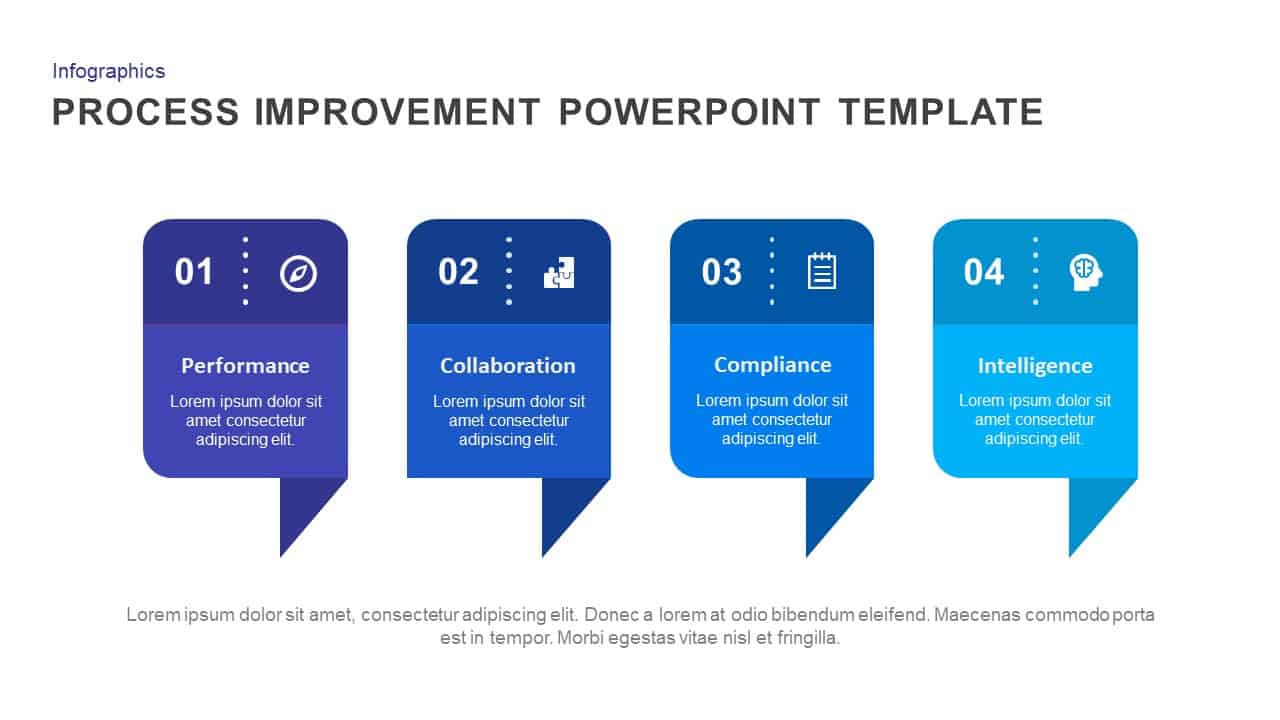
Process Improvement PowerPoint Template and Keynote Slides
Diagrams
Premium

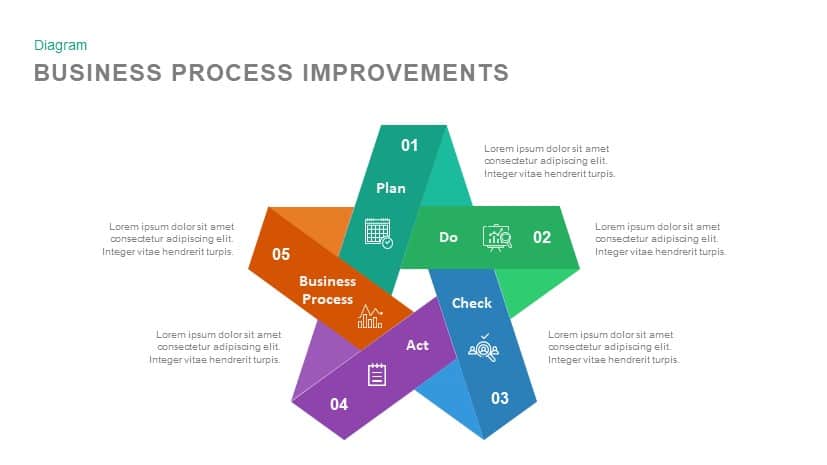
Business Process Improvement PowerPoint Template and Keynote
Diagrams
Premium
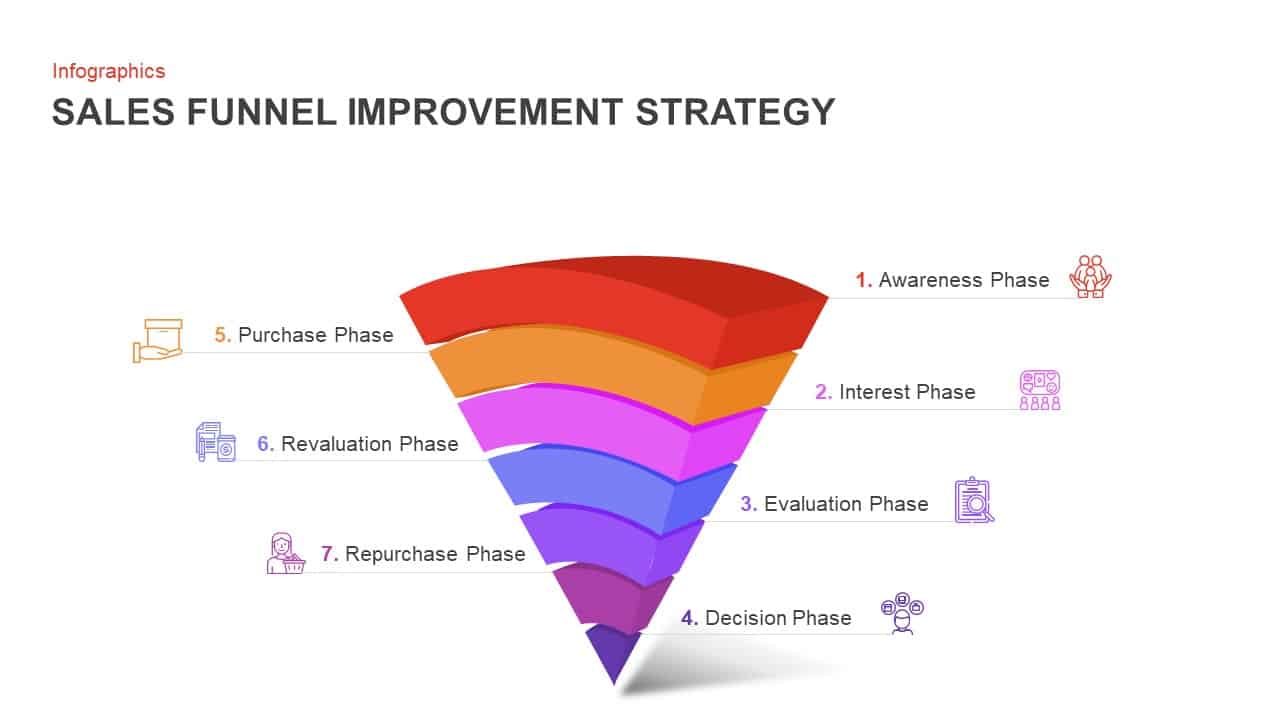
Sales Funnel Improvement Strategy PowerPoint Template and Keynote Slide
Funnel Diagrams
Premium
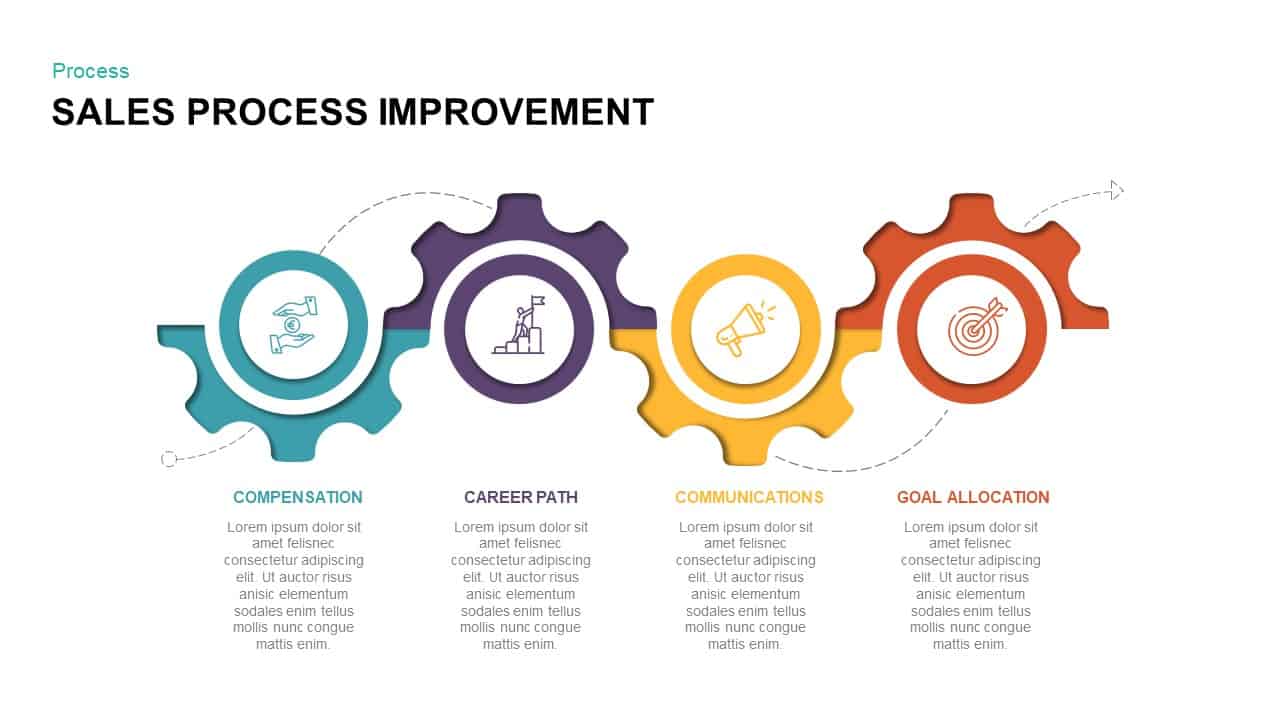
Sales Process Improvement Template for PowerPoint & Keynote
Process Flow Diagrams
Premium
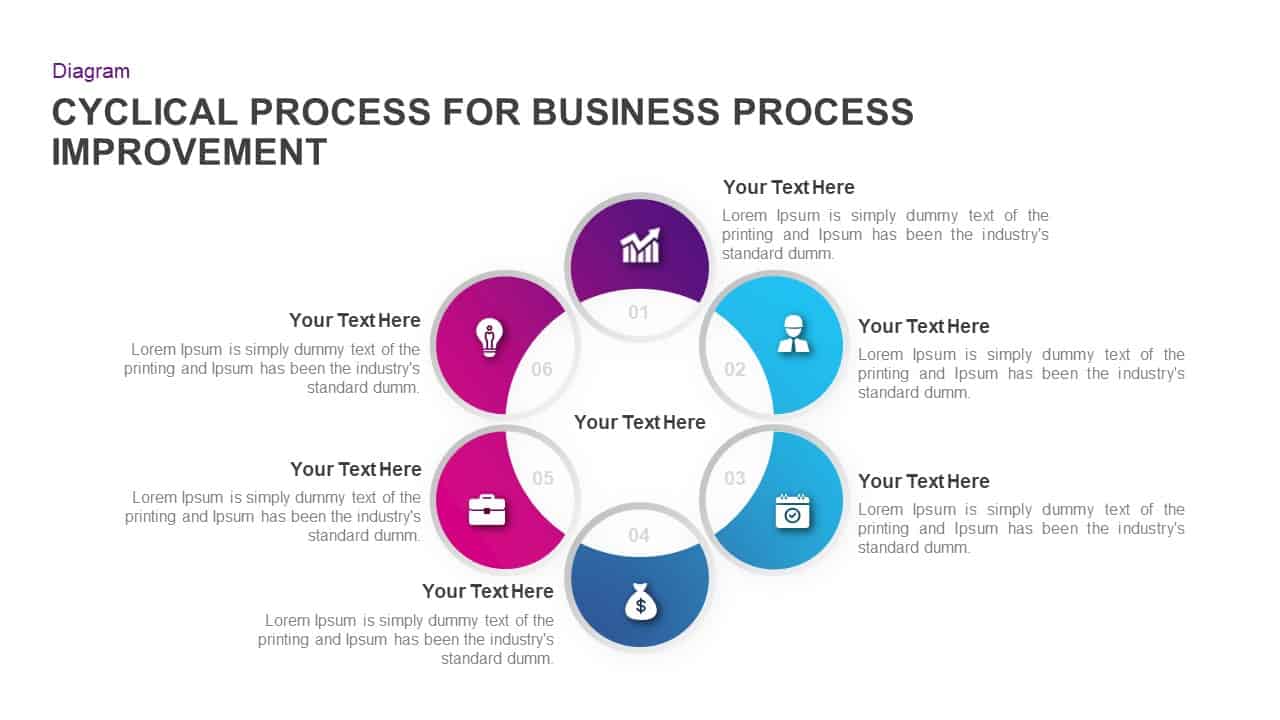
Cyclical Process For Business Process Improvement PowerPoint and Keynote Presentation
Process Flow Diagrams
Premium
Steps to Improvement Process PowerPoint Template
Process Flow Diagrams
Premium
Process Improvement PowerPoint Template
Infographic
Premium
4 Step Process Improvement PowerPoint Template
Infographic
Premium
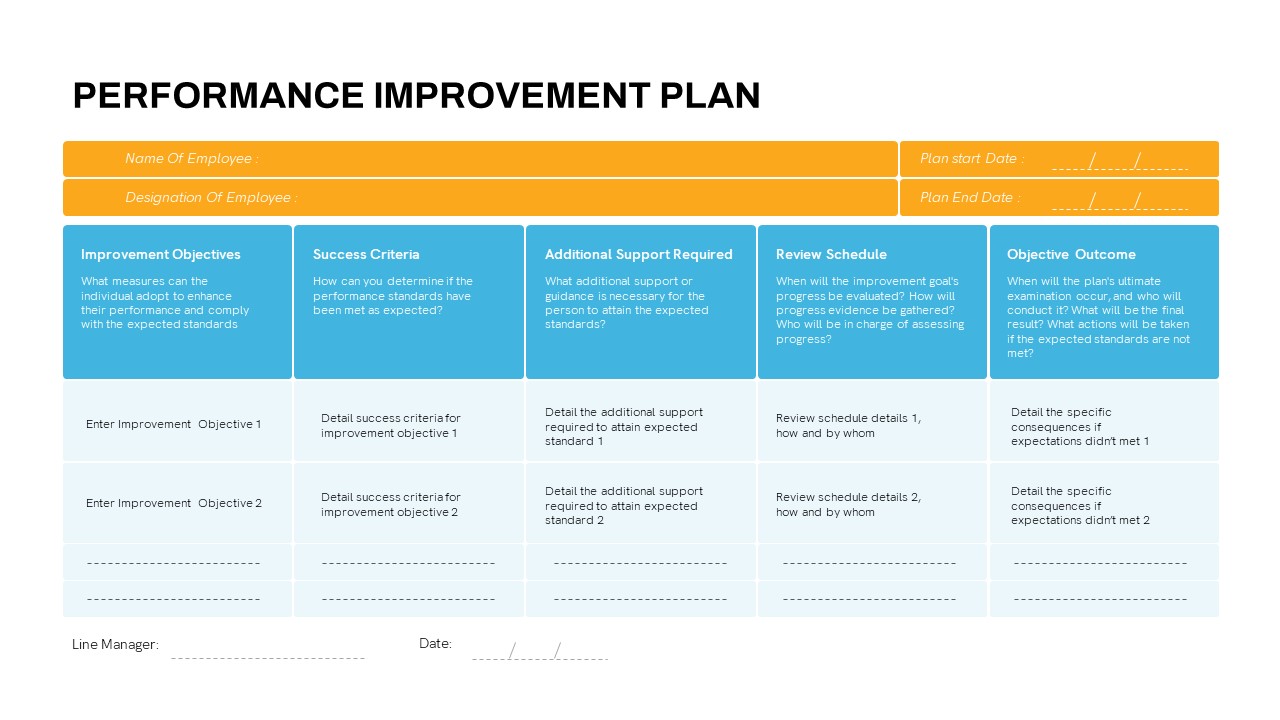
Performance Improvement Plan PowerPoint Template
Tables
Premium
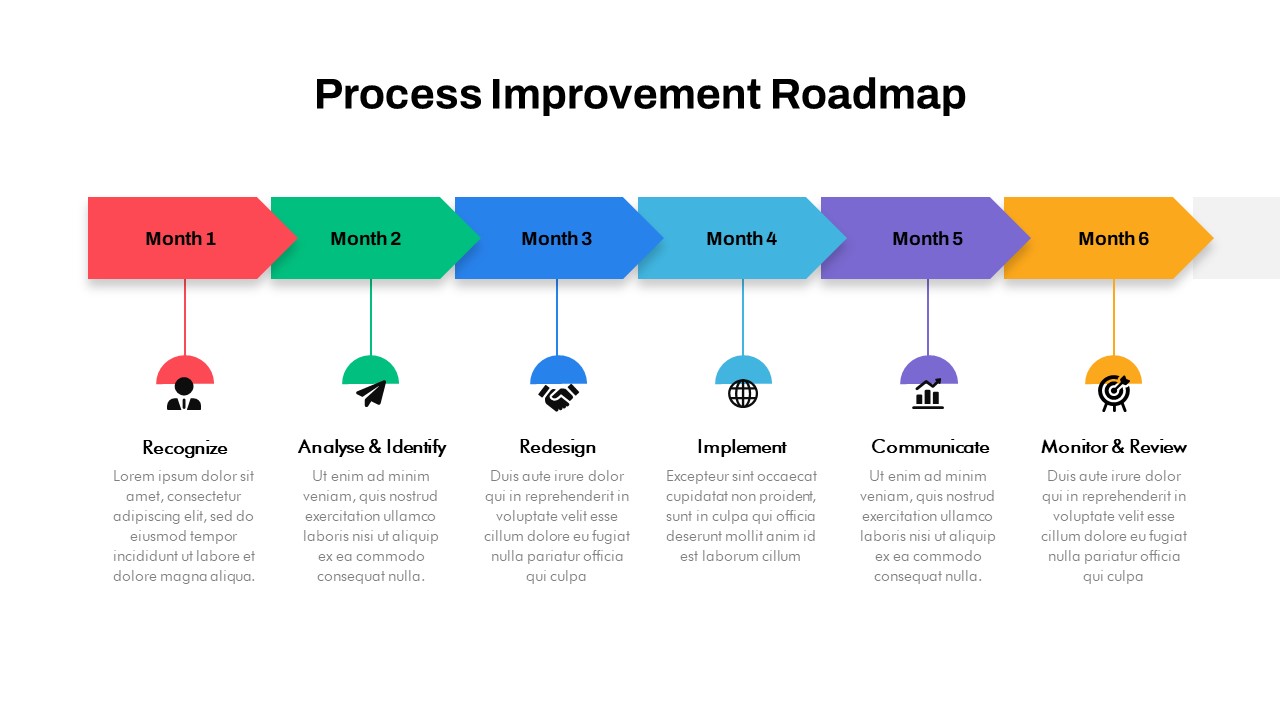
Process Improvement Roadmap PowerPoint Template
PowerPoint Templates
Premium
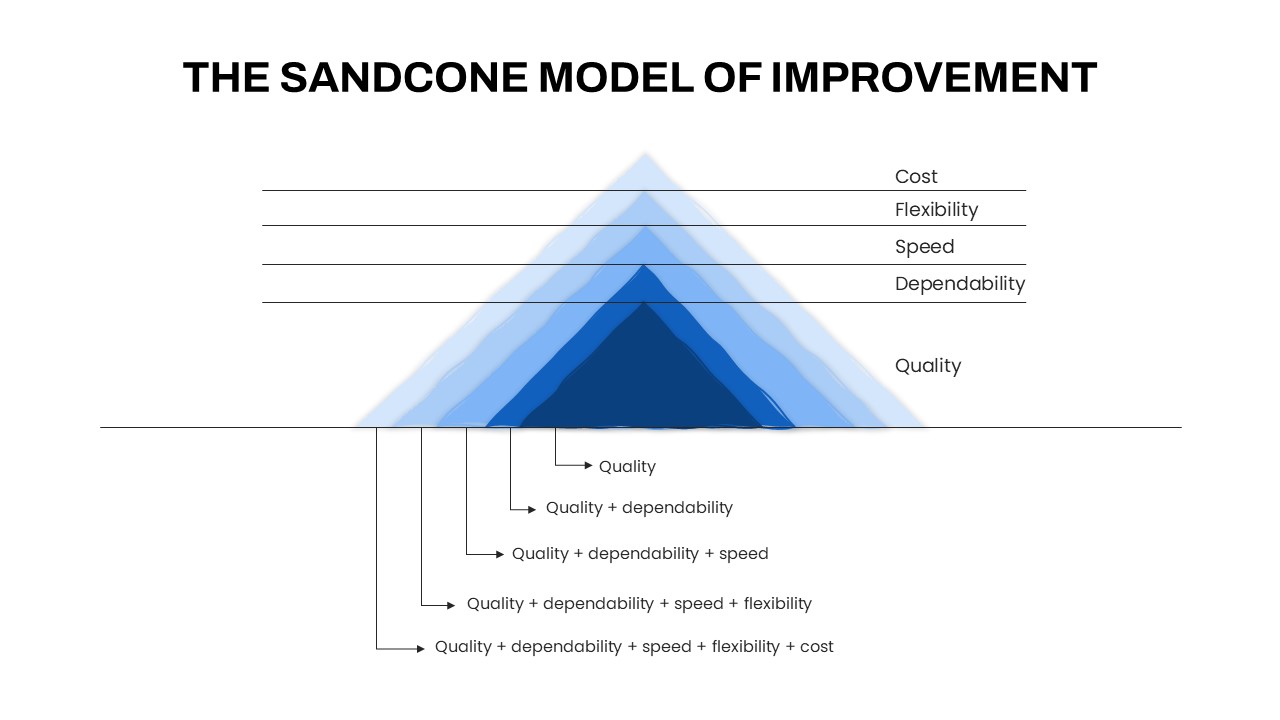
The Sandcone Model of Improvement PowerPoint Template
PowerPoint Templates
Premium

Continuous Improvement Cycle Diagram for PowerPoint
Circular Diagrams
Premium
Cyclical Process for Business Process Improvement Ppt Diagram
Circular Diagrams
Premium
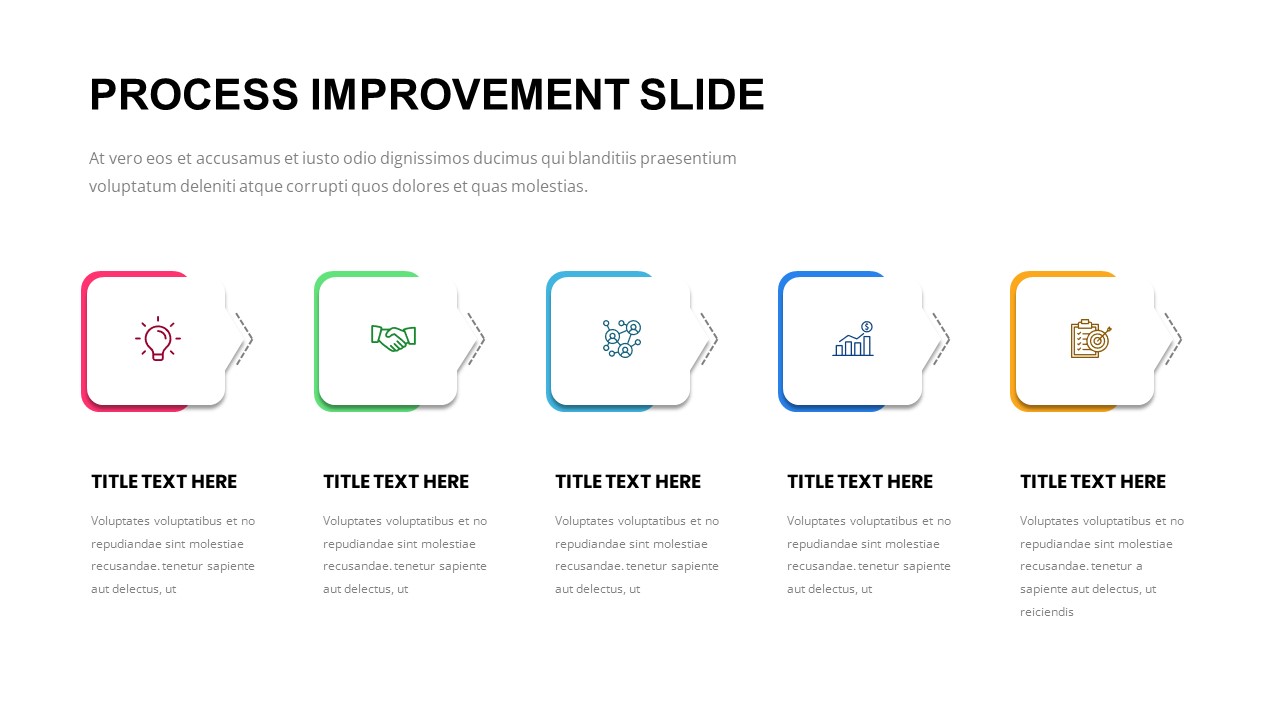
Process Improvement Slides
Infographic
Premium

Rebuild Metaphor PowerPoint Template and Keynote Template
Keynote Templates
Premium
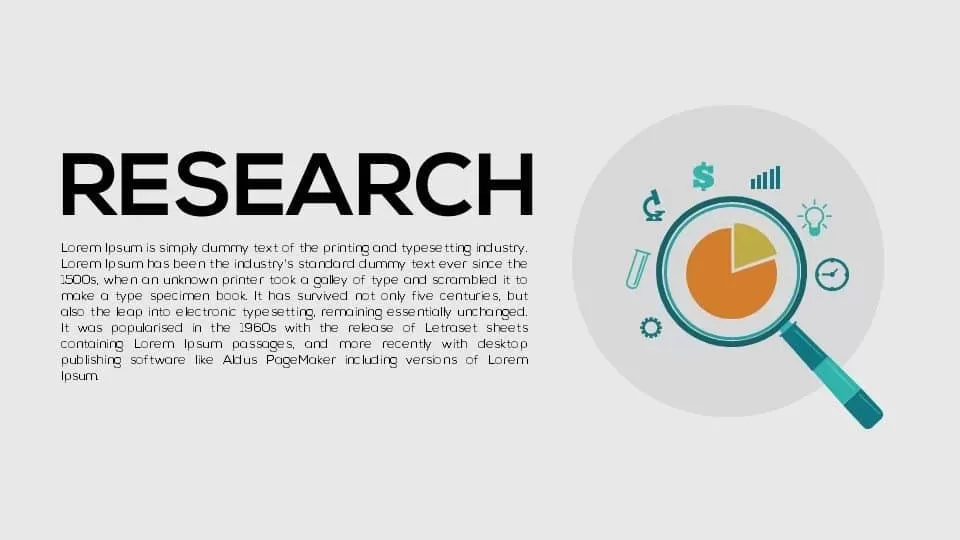
Research PowerPoint Template and Metaphor Keynote Template
Keynote Templates
Premium
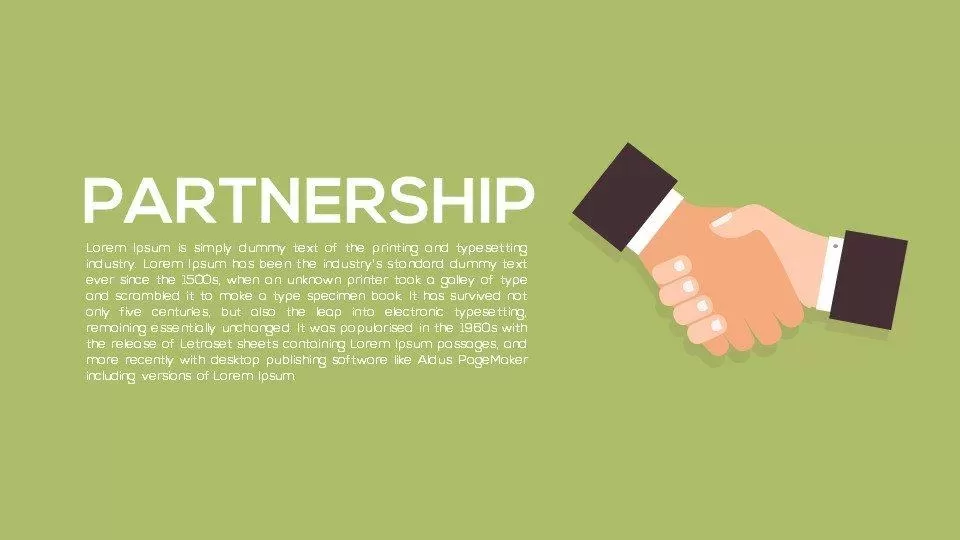
Metaphor Partnership PowerPoint Template and Keynote Template
Keynote Templates
Premium
Metaphor Planning PowerPoint Template and Keynote template
Keynote Templates
Premium
Recruitment PowerPoint Template and Metaphor Keynote Template
Keynote Templates
Premium
Metaphor Discover PowerPoint Template and Keynote Slide
Keynote Templates
Premium
Metaphor Launch PowerPoint Template and Keynote Slide
Keynote Templates
Premium
Metaphor Teamwork PowerPoint Template and Keynote Slide
Keynote Templates
Premium
Risk Metaphor PowerPoint Template and Keynote
Keynote Templates
Premium
Read Metaphor PowerPoint Template and Keynote Slide
Keynote Templates
Premium
Metaphor Light Bulb Idea PowerPoint Template & Keynote Slide
Keynote Templates
Premium
Metaphor Cloud PowerPoint Template and Keynote Slide
Keynote Templates
Premium
Lead Metaphor PowerPoint Template and Keynote Slide
Keynote Templates
Premium
Metaphor Communication PowerPoint Template and Keynote
Keynote Templates
Premium
Metaphor Multitasking PowerPoint Template & Keynote
Keynote Templates
Premium
Metaphor Cloud Computing PowerPoint Template and Keynote
Keynote Templates
Premium
Strength PowerPoint Template and Metaphor Keynote Slide
Keynote Templates
Premium
Metaphor Light Bulb Idea Template for PowerPoint and Keynote Presentation
Keynote Templates
Premium
Metaphor Efficiency PowerPoint Template & Keynote
Keynote Templates
Premium
Metaphor Destination PowerPoint Template and Keynote
Keynote Templates
Premium
Metaphor Speed PowerPoint Template and Keynote
Keynote Templates
Premium
Weighing Scale Metaphor PowerPoint Template & Keynote
Keynote Templates
Premium
Capture Metaphor Template for PowerPoint and Keynote
Keynote Templates
Premium
Metaphor Reach on Top PowerPoint Template and Keynote Slide
Keynote Templates
Premium
Metaphor Support PowerPoint Template and Keynote
Keynote Templates
Premium
Metaphor Mission PowerPoint Template and Keynote Slide
Keynote Templates
Premium
Direction Metaphor PowerPoint and Keynote template
Keynote Templates
Premium
Metaphor Key Diagram PowerPoint Template and Keynote
Keynote Templates
Premium
Metaphor Balance PowerPoint Template & Keynote
Keynote Templates
Premium
Metaphor Shield PowerPoint Template and Keynote Slide
Keynote Templates
Premium
Metaphor Productivity PowerPoint Template and Keynote Slide
Keynote Templates
Premium
Explore Metaphor PowerPoint and Keynote Template
Keynote Templates
Premium
Metaphor Guide PowerPoint Template and Keynote
Keynote Templates
Premium
Office Workspace Metaphor PowerPoint Template and Keynote
Keynote Templates
Premium
Team Efficiency Metaphor Template for PowerPoint and Keynote
Keynote Templates
Premium
Metaphor Operation Process PowerPoint Template & Keynote
Keynote Templates
Premium
Metaphor Security Template for PowerPoint and Keynote
Keynote Templates
Premium
Metaphor Navigation PowerPoint Template & Keynote
Keynote Templates
Premium
Metaphor Deadline Powerpoint Templates and Keynote template
Keynote Templates
Premium
Metaphor Leadership PowerPoint Templates and Keynote template
Keynote Templates
Premium
Product Shipping Metaphor Template for PowerPoint and Keynote
Keynote Templates
Premium
Metaphor Competition PowerPoint Template and Keynote Slides
Keynote Templates
Premium
News Metaphor Template for PowerPoint and Keynote
Keynote Templates
Premium
Money PowerPoint Template and Metaphor Keynote Slide
Keynote Templates
Premium
Accounting PowerPoint Template and Metaphor Keynote Slide
Keynote Templates
Premium
Comparison Metaphor PowerPoint and Keynote template
Keynote Templates
Premium
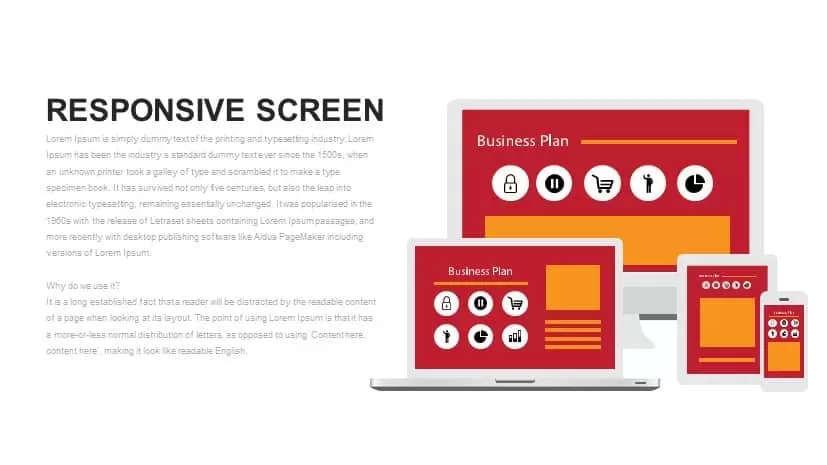
Responsive Screen Metaphor PowerPoint Template & Keynote
Keynote Templates
Premium
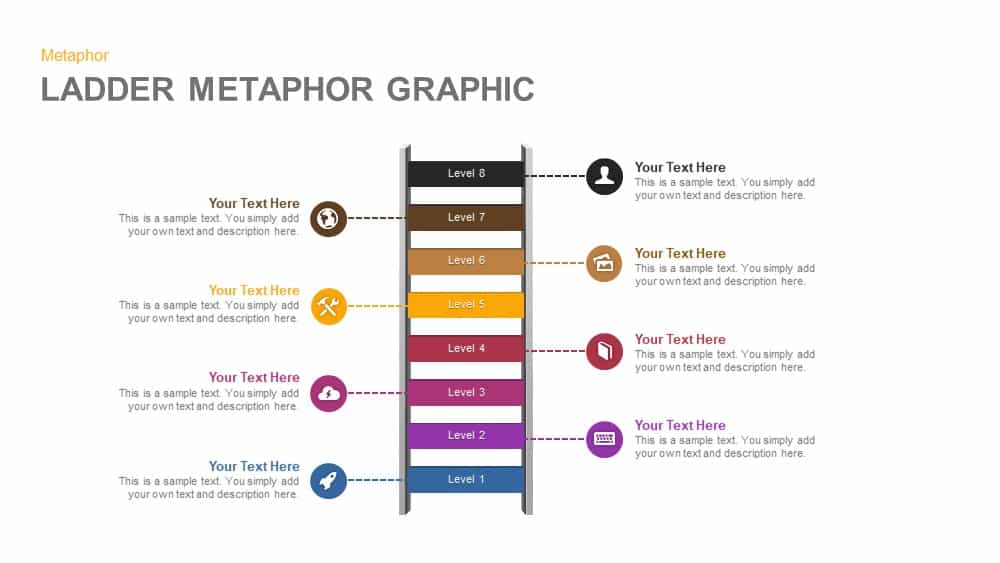
Ladder Metaphor Graphic for PowerPoint and Keynote Template
Diagrams
Premium
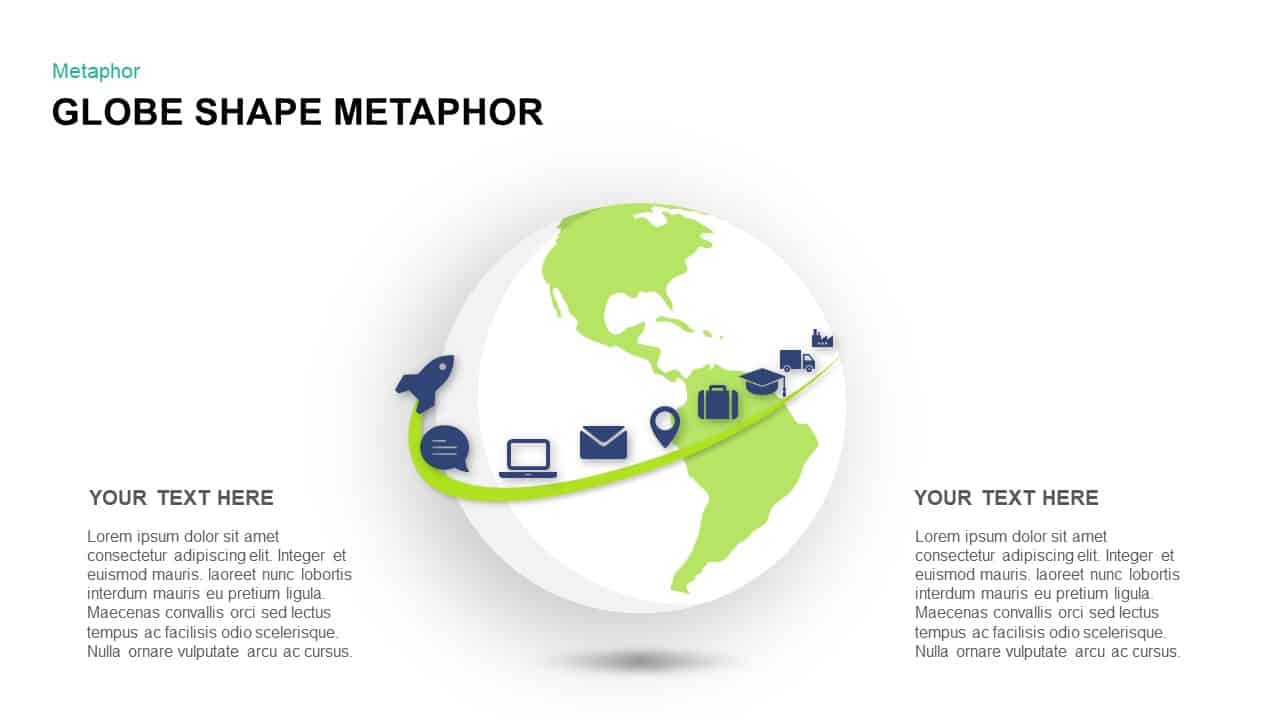
Metaphor Globe Shapes Template for PowerPoint Presentations and Keynote Slide
Diagrams
Premium
Metaphor Knowledge PowerPoint Templates and Keynote Slide
Keynote Templates
Premium
Metaphor Business Decision Making PowerPoint template and Keynote template
Metaphor, Simile & Analogy
Premium
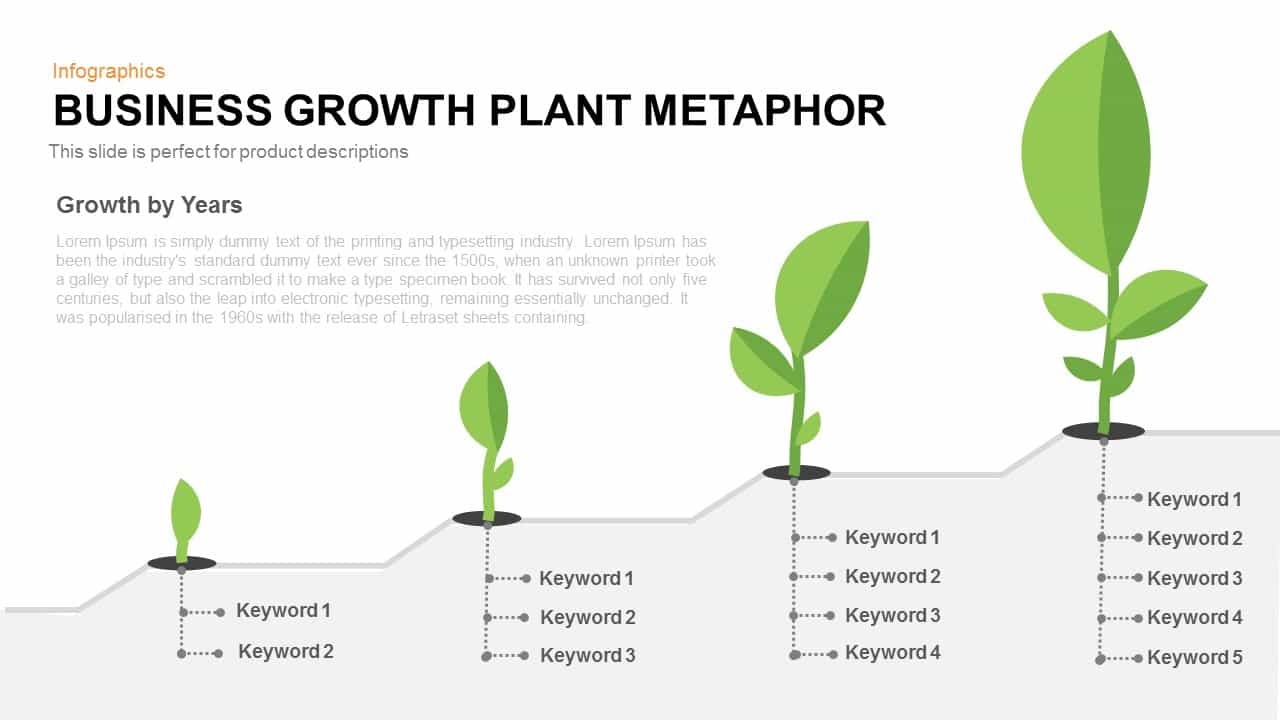
Business Growth Plant Metaphor Template For PowerPoint and Keynote
Business Models
Premium
Metaphor Cyber Security PowerPoint Template and Keynote Slide
Metaphor, Simile & Analogy
Premium
Metaphor Developers Icons PowerPoint Template and Keynote Slide
Diagrams
Premium
Teamwork Concept Metaphor Template for PowerPoint and Keynote
PowerPoint Templates
Premium

Metaphor Business Meeting PowerPoint Template and Keynote Slide
Infographic
Premium
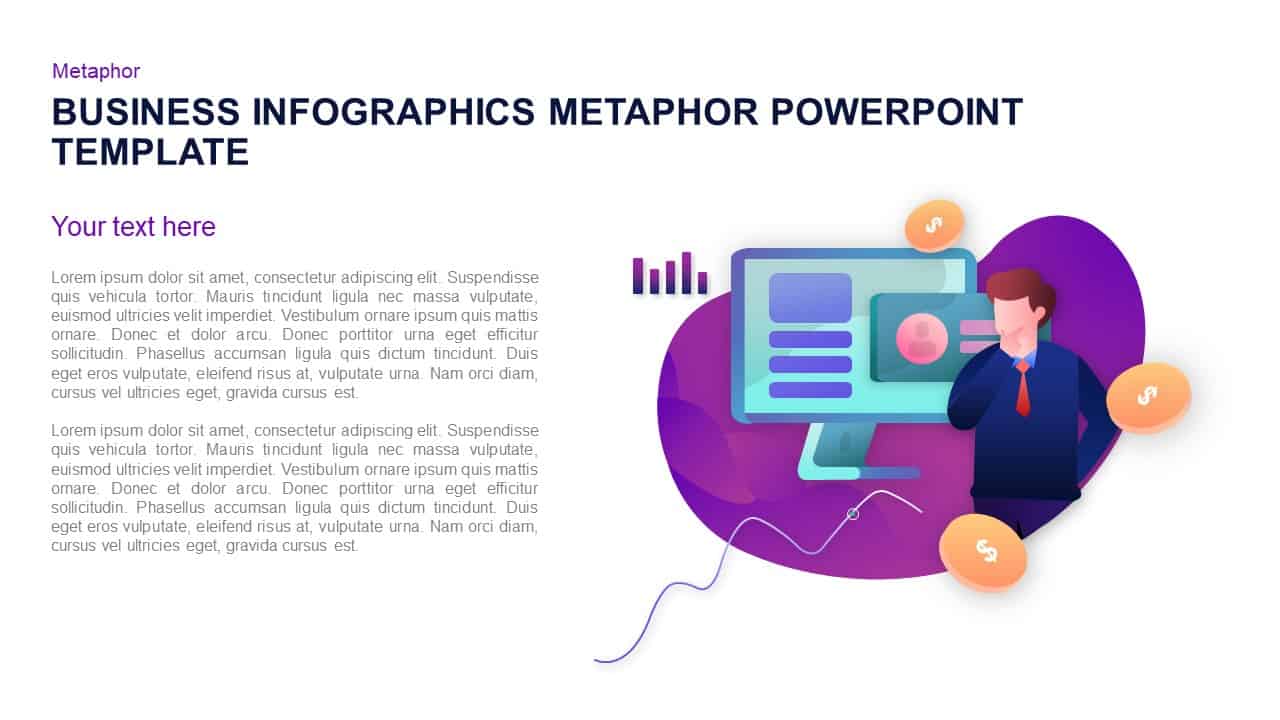
Business Infographics Metaphor PowerPoint Template and Keynote Slide
Metaphor, Simile & Analogy
Premium
Work Life Balance Metaphor PowerPoint Template & Keynote
Business Models
Premium
Financial Report Metaphor PowerPoint Presentation Template
Metaphor, Simile & Analogy
Premium
Business Growth Metaphor PowerPoint Template
Business PowerPoint Templates
Premium
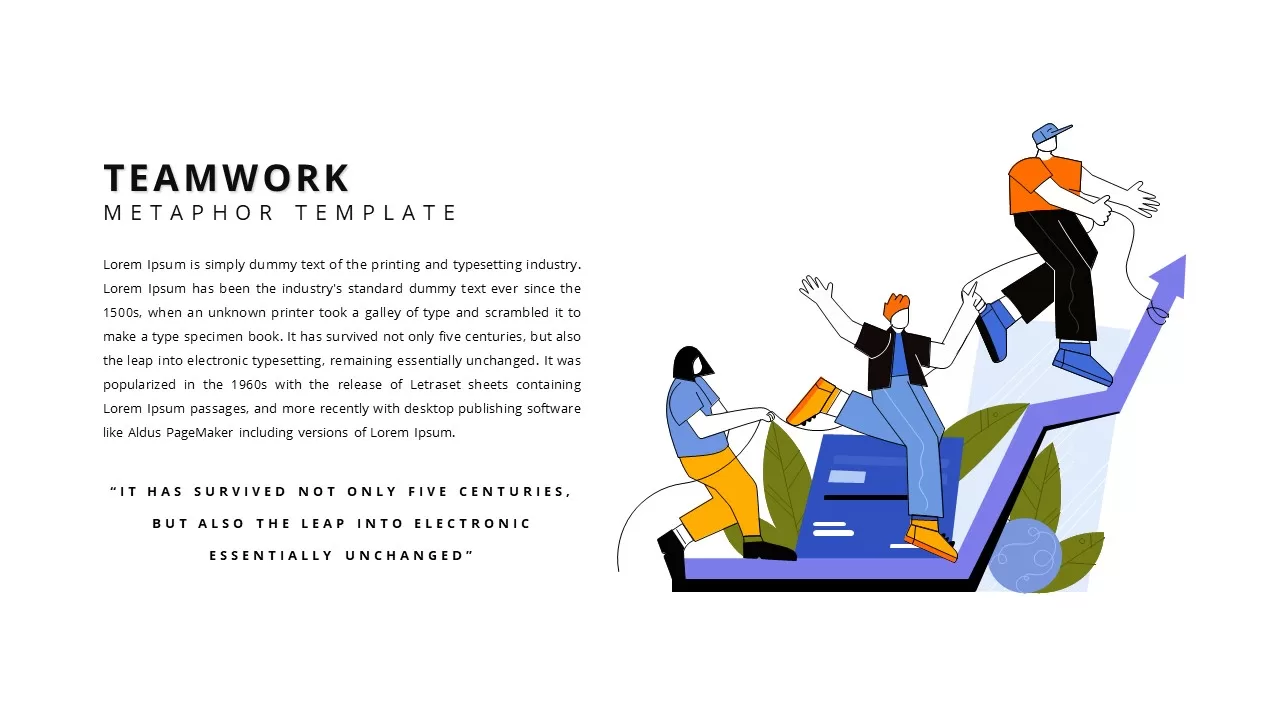
Teamwork Metaphor PowerPoint Template
Meet The Team
Premium
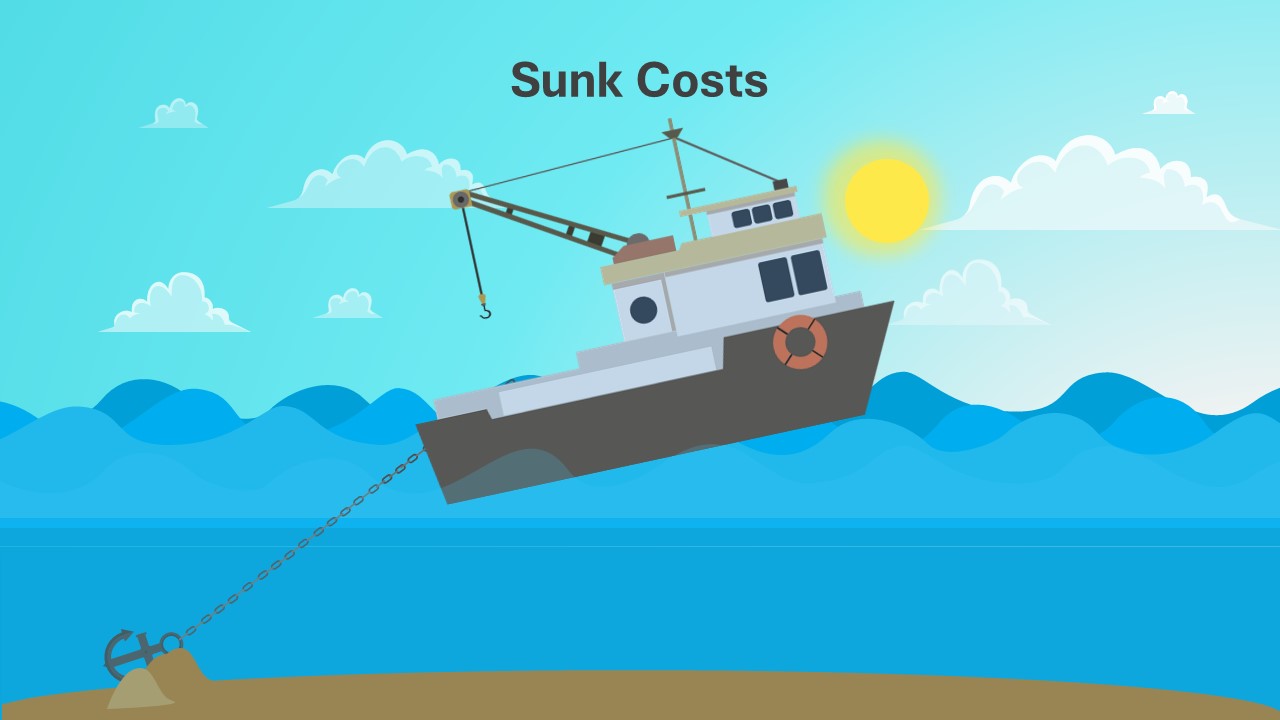
Sunk Costs Illustration Analogy Metaphor PowerPoint Template
PowerPoint Templates
Premium
Power Analogy Metaphor PowerPoint Template
Metaphor, Simile & Analogy
Premium
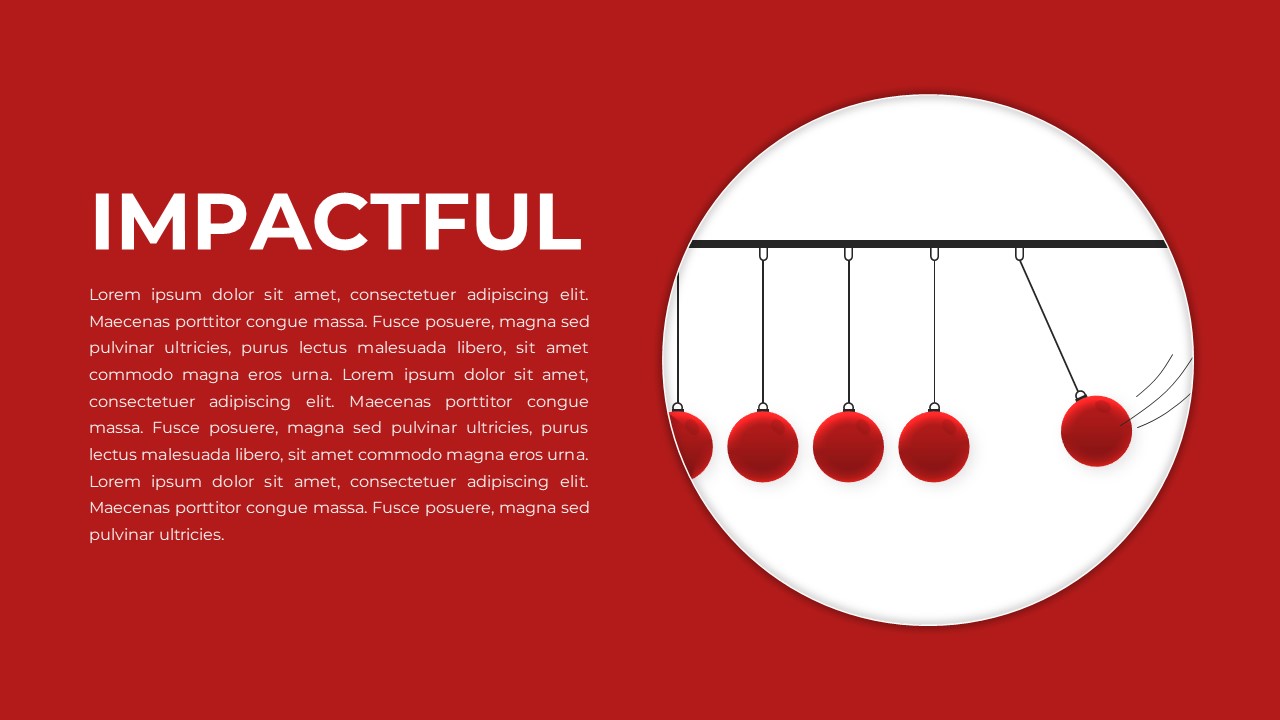
Impactful Metaphor Analogy PowerPoint Template
Infographic
Premium
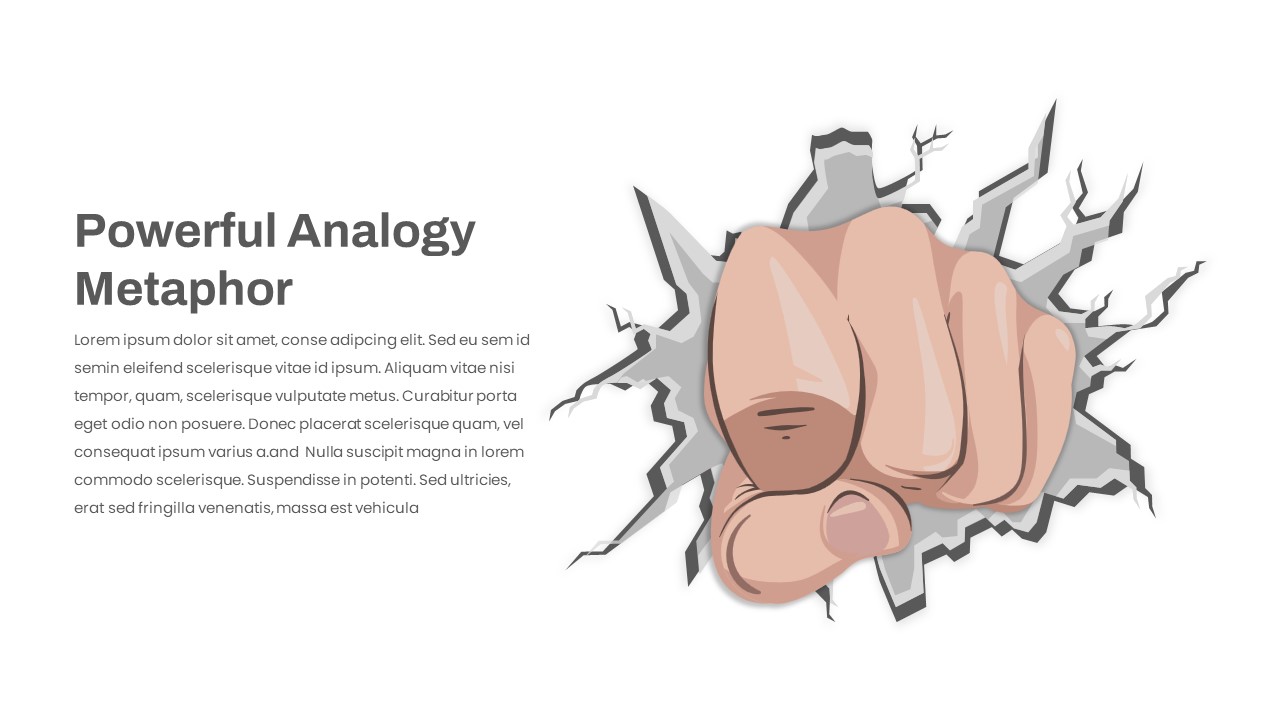
Powerful Analogy Metaphor PowerPoint Template
Metaphor, Simile & Analogy
Premium
5 Section Circular Arrow Diagram PowerPoint Template and Keynote template
Circular Diagrams
Premium
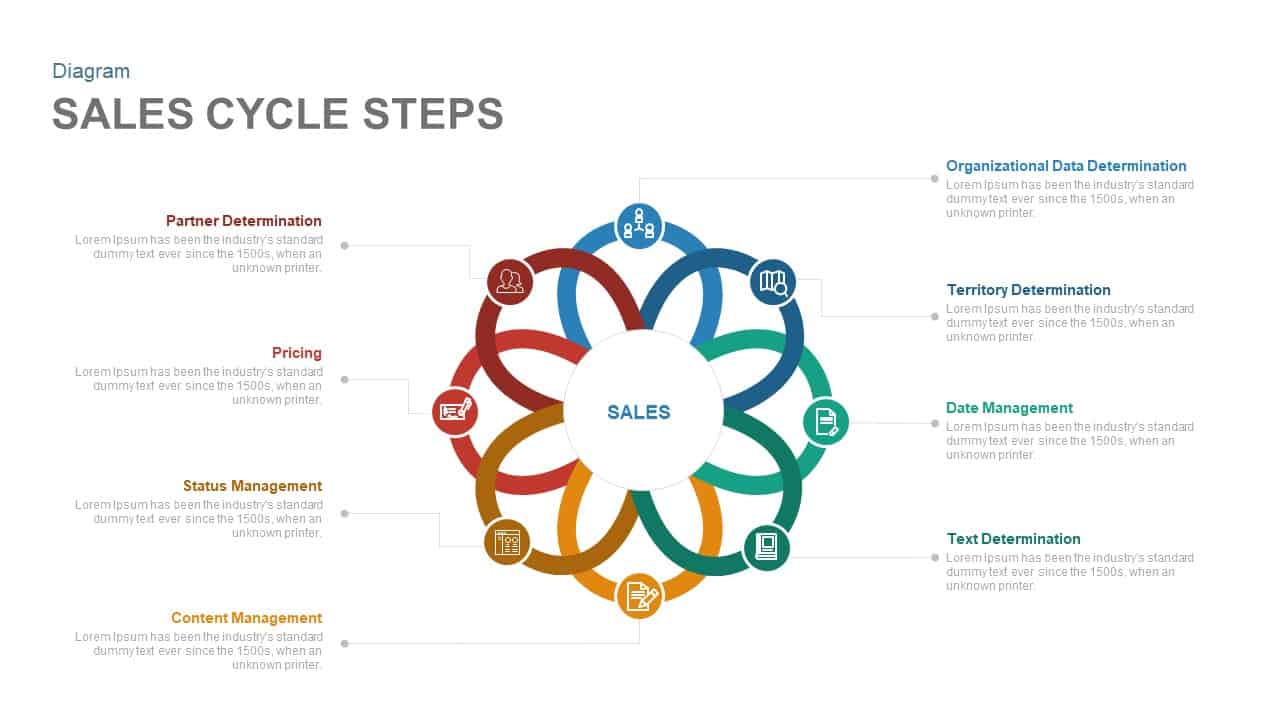
Sales Cycle Steps PowerPoint Template and Keynote Template
Circular Diagrams
Premium
Six Segment Diagram PowerPoint Template and Keynote template
Business Models
Premium
Risk Management in Marketing PowerPoint Template and Keynote Template
Diagrams
Premium
Six Staged Circular Process Diagram PowerPoint Template and Keynote Template
Circular Diagrams
Premium
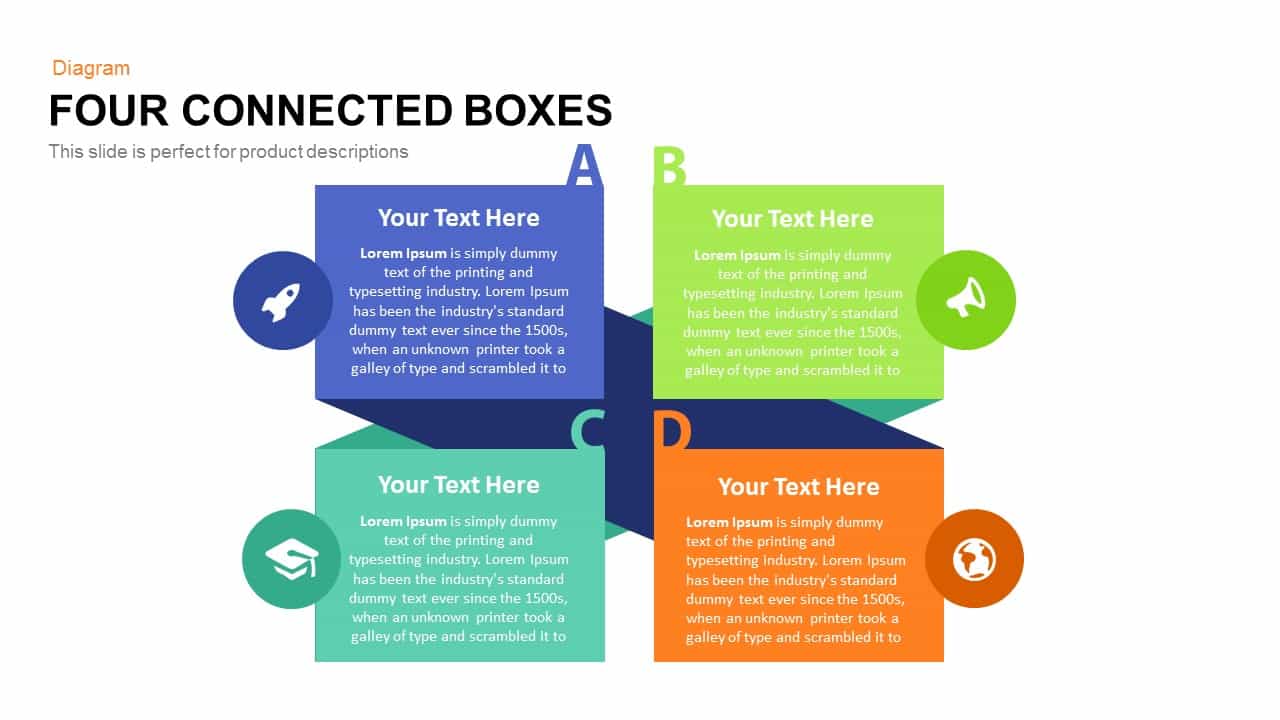
4 Connected Box PowerPoint Template and Keynote Diagram
Business Models
Premium
10 Stages Zig Zag Process PowerPoint Template and Keynote Slide
Process Flow Diagrams
Premium
7 Step Flower Diagram Template for PowerPoint and Keynote
Circular Diagrams
Premium
Overcoming Challenges Powerpoint and Keynote template
Infographic
Premium
Business Management PowerPoint Template and Keynote slide
Diagrams
Premium
Roadmap Timeline PowerPoint and Keynote Presentation Template
Infographic
Premium
8 Steps Arrow Process Diagram PowerPoint Template and Keynote
Process Flow Diagrams
Premium
Vision Mission PowerPoint Template and Keynote Slide
Business Models
Premium
8 Stage Process Diagram PowerPoint Template and Keynote
Process Flow Diagrams
Premium
Creative Infographics Star PowerPoint Template and Keynote Slide
Shapes
Premium
8 Staged Zigzag Arrow Diagram PowerPoint Template and Keynote
Arrow Diagrams
Premium
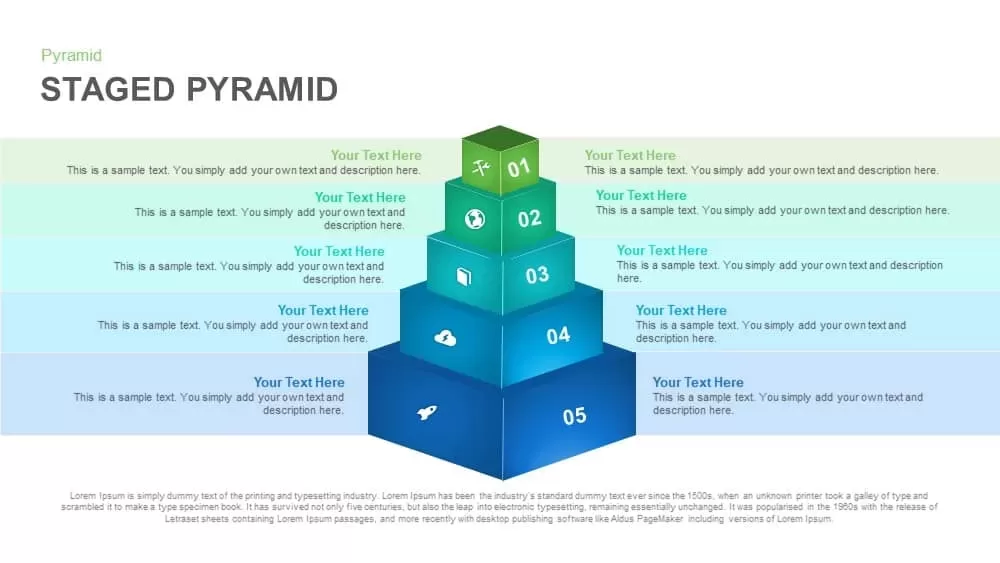
Staged Pyramid PowerPoint Template & Keynote Slide
Pyramid
Premium