Challenges & Solutions Comparison Template for PowerPoint & Google Slides
Description
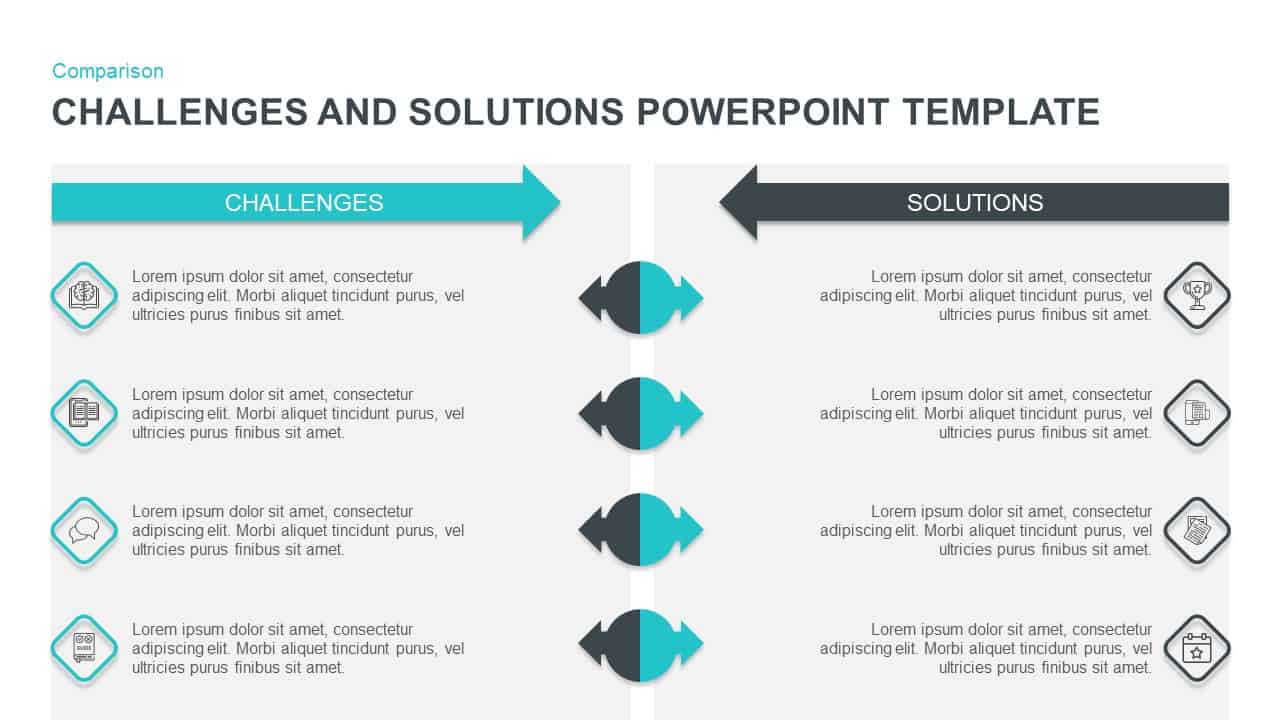
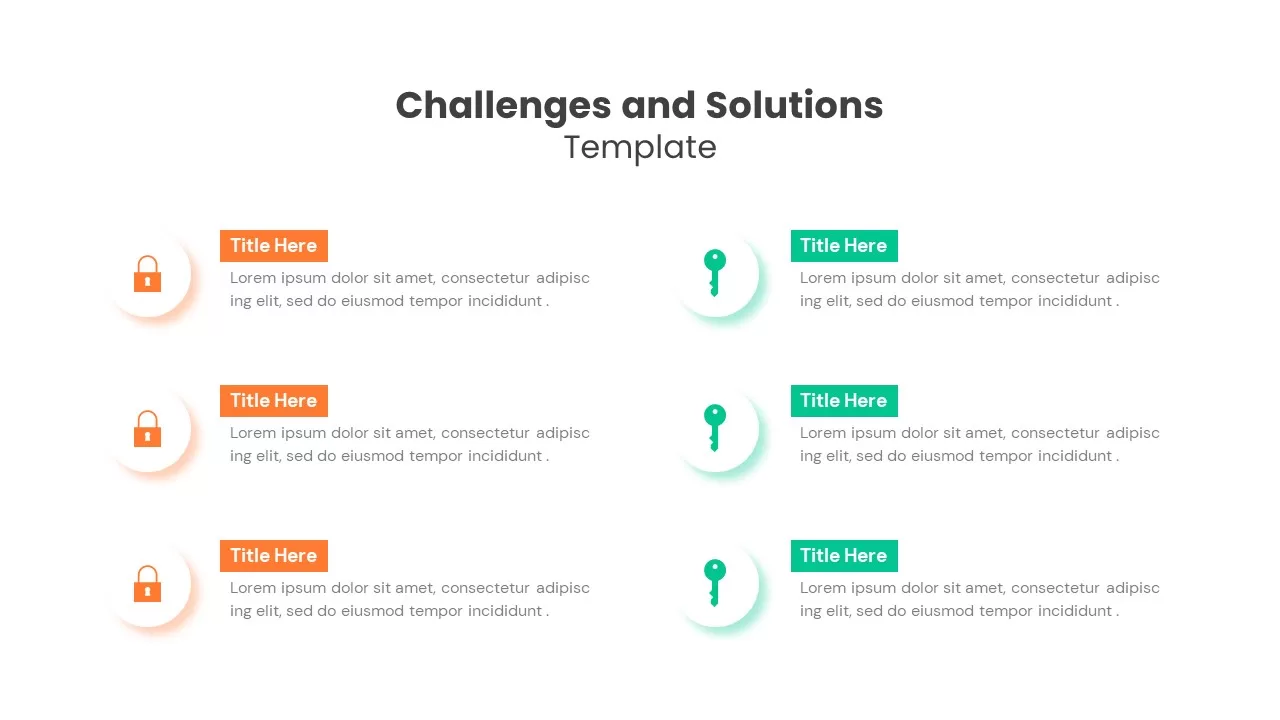
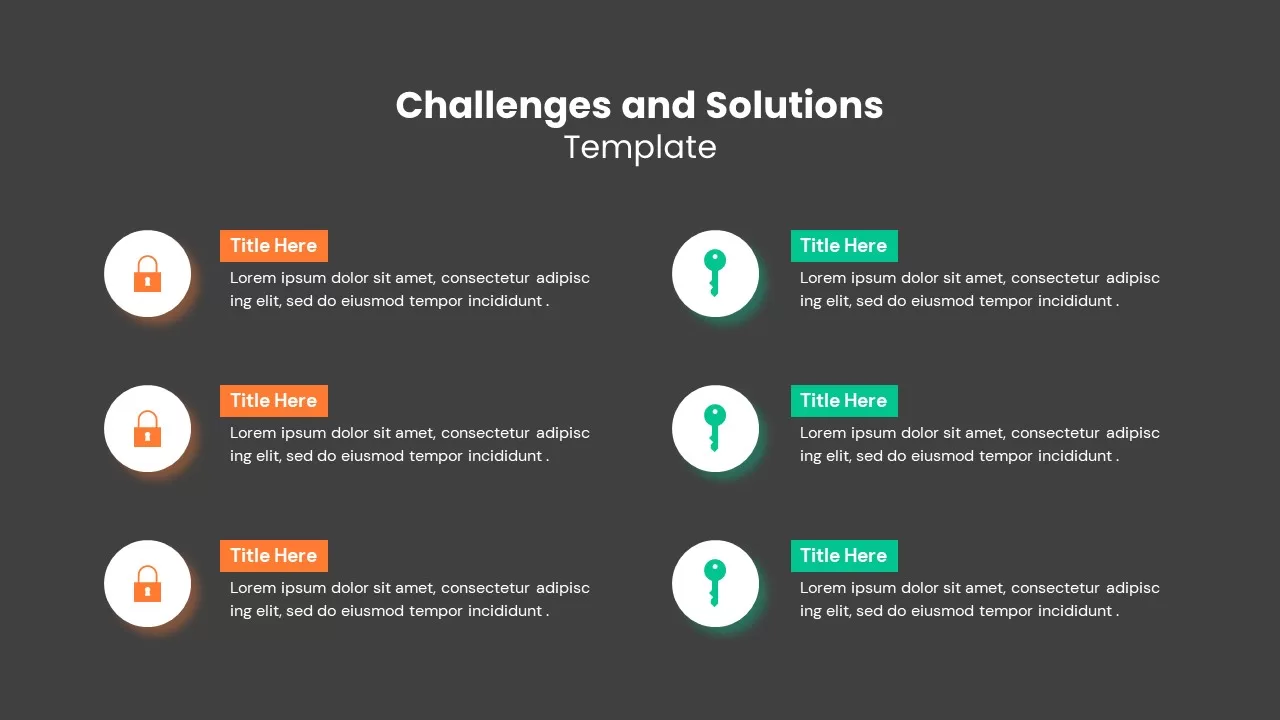
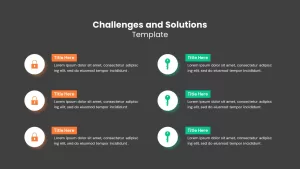
This dynamic benchmarking slide leverages a central vertical stack of four colored rectangular panels—hot pink, light blue, royal blue, and teal—each featuring a flat icon area and a bold placeholder title. Horizontal connectors with arrowheads extend from each panel to corresponding items in flanking comparison panels on the left and right, which host matching colored bullet markers and concise text placeholders separated by subtle divider lines. The clean white canvas, subtle drop shadows, and softly rounded corners maintain a crisp minimalist aesthetic that highlights data clarity and visual hierarchy.
Built on master-slide layouts for both PowerPoint and Google Slides, this template is fully editable to align with diverse brand requirements or project needs. Users can customize panel text, swap flat icons to reflect KPIs or process steps, adjust connector styles, and recolor shapes using built-in color palette controls. Vector-based elements ensure razor-sharp rendering at any resolution, while locked grouping, alignment guides, and optional number badges streamline slide edits and preserve consistency across decks. Comparison panels on the flanks can be expanded or duplicated to accommodate additional benchmarking dimensions, making the design scalable for larger data sets.
The template supports sequential entrance animations for panels and their paired comparison bullets, guiding audience focus during live presentations. Alternatively, disable all transitions for static handouts or PDF exports with full layout fidelity. A light/dark theme toggle, customizable icon libraries, and detailed template notes on connector adjustments and icon placement empower users to fine-tune styling without starting from scratch.
Additional design features include editable caption fields for metric definitions, built-in slide layouts for summary dashboards, and compatibility with Slide Zoom functionality for granular focus on specific metrics. Use the integrated color themes to switch instantly between monochrome, duotone, or full multicolor palettes, ensuring visual alignment with corporate branding. The template also includes detailed notes on grouping and layer organization for efficient batch editing.
Who is it for
Product managers, project managers, business analysts, marketing strategists, and consultants will find this benchmarking chart invaluable for comparing performance metrics, assessing competitor gaps, or presenting maturity assessments to stakeholders.
Other Uses
This template can be repurposed for feature comparisons, SWOT detail breakdowns, capability maturity mapping, risk assessment summaries, or vendor evaluations—offering a clear side-by-side layout for any comparative scenario.
Login to download this file

Item ID
SB02860
Related Templates

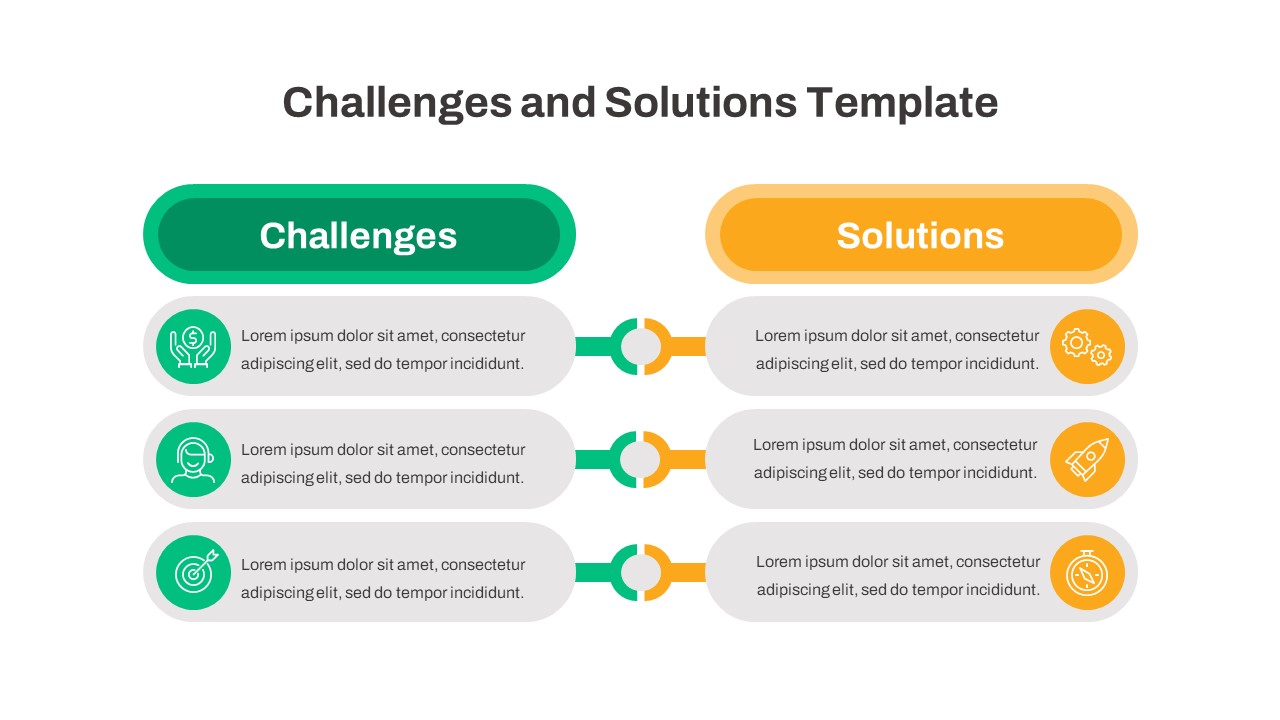
Challenges vs Solutions Comparison Template for PowerPoint & Google Slides
Comparison
Premium
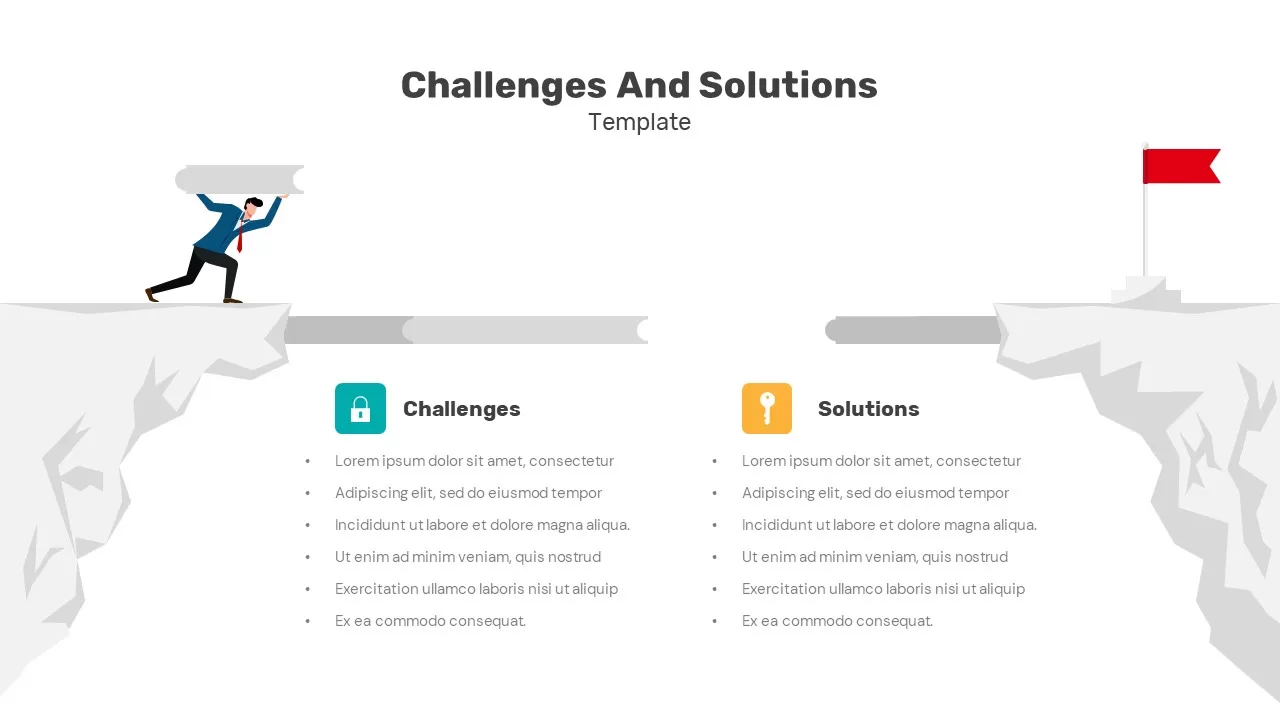
Challenges and Solutions Comparison Template for PowerPoint & Google Slides
Opportunities Challenges
Premium
Challenges and Solutions Comparison Slide for PowerPoint & Google Slides
Opportunities Challenges
Premium
Challenges and Solutions Slide Template for PowerPoint & Google Slides
Comparison
Premium
Challenges and Solutions Slide for PowerPoint & Google Slides
Opportunities Challenges
Premium
Free Challenges and Solutions for PowerPoint & Google Slides
Business
Free
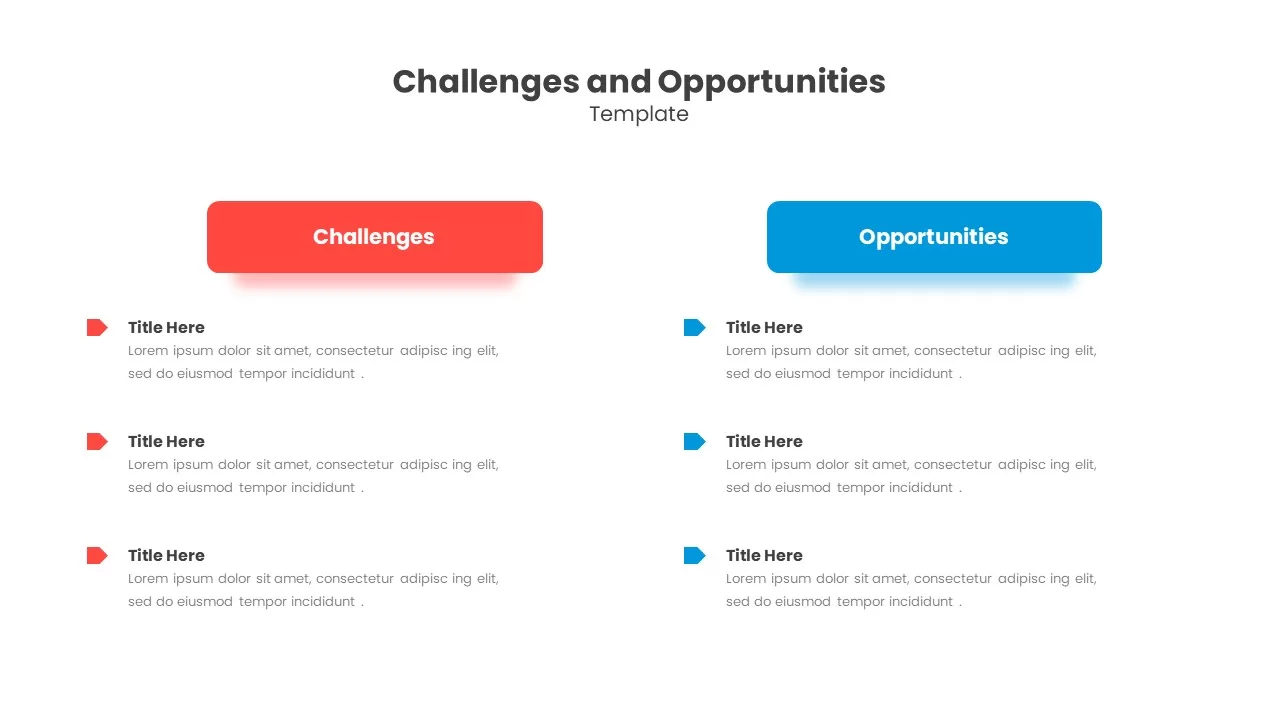
Challenges & Opportunities Comparison Template for PowerPoint & Google Slides
Opportunities Challenges
Premium
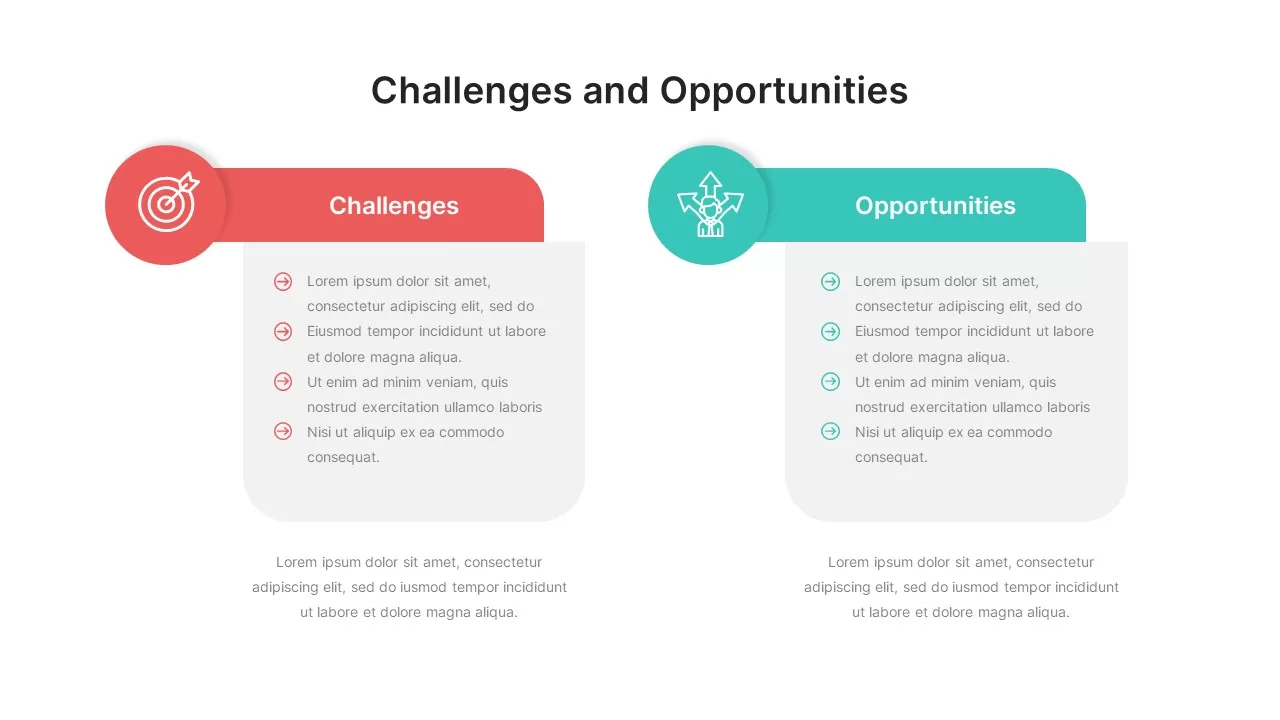
Challenges and Opportunities Comparison Slide for PowerPoint & Google Slides
Opportunities Challenges
Premium
Corporate Solutions & Company Profile Template for PowerPoint & Google Slides
Company Profile
Premium

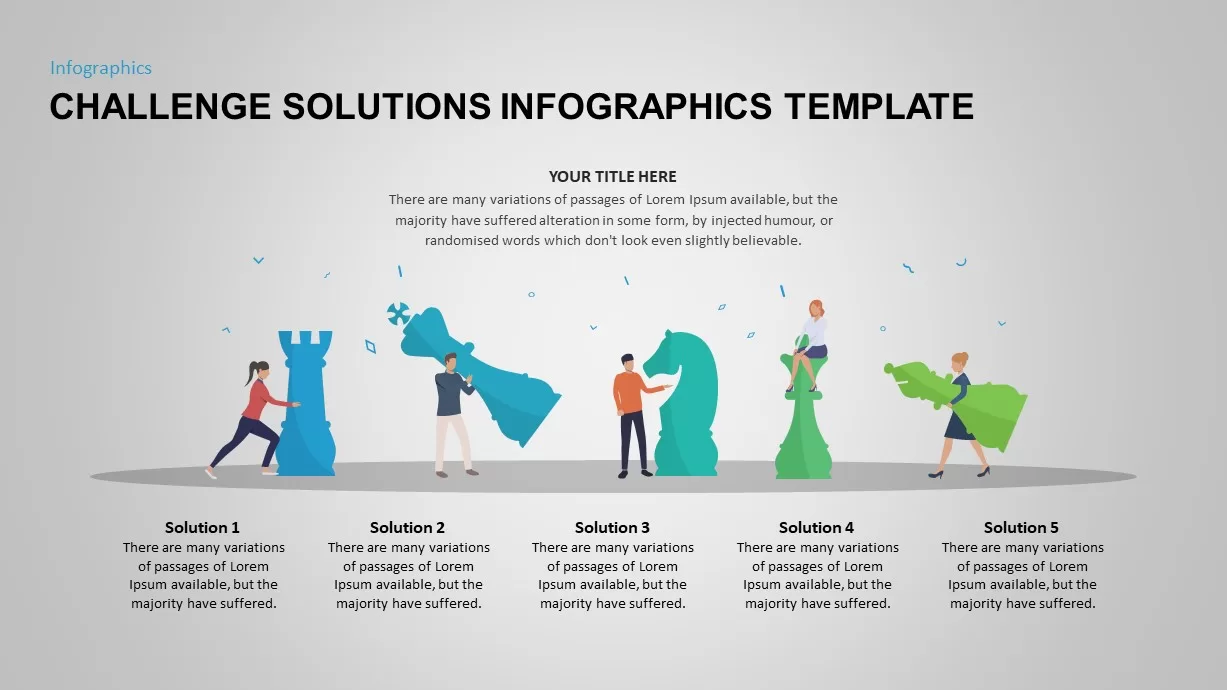
Challenge Solutions Infographics Template for PowerPoint & Google Slides
Opportunities Challenges
Premium
Modern Technology Solutions Overview template for PowerPoint & Google Slides
Information Technology
Premium
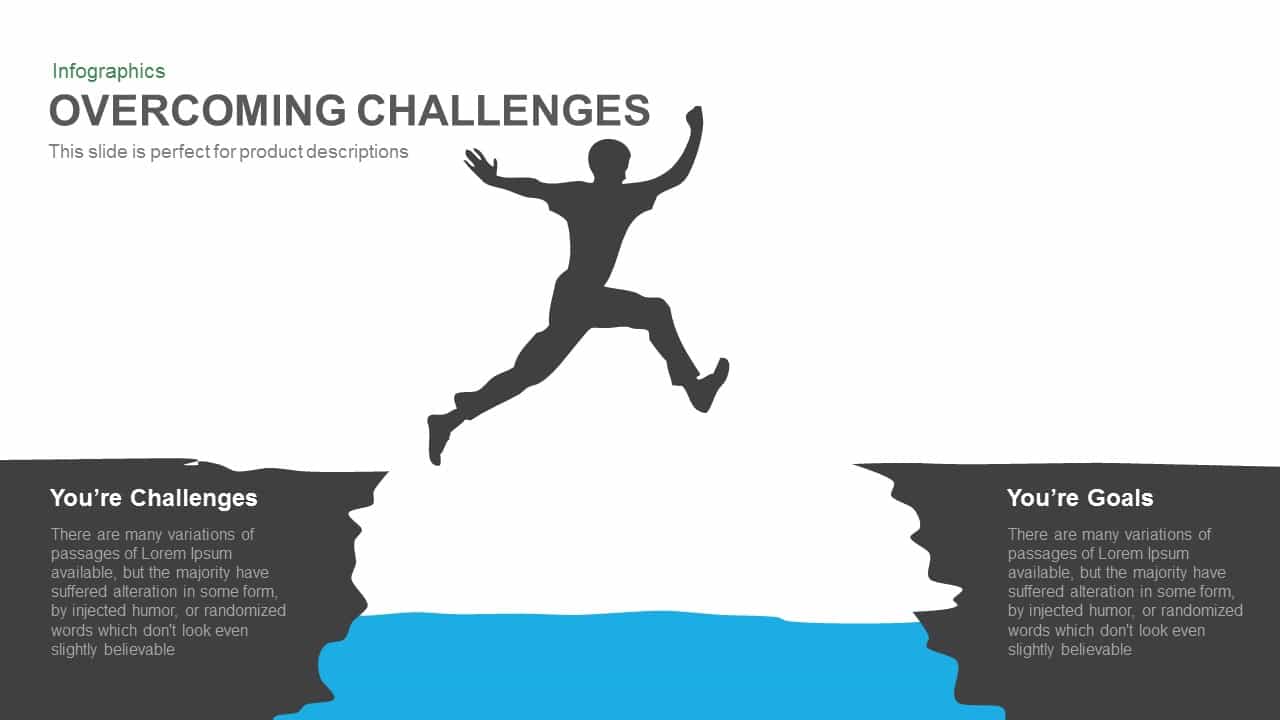
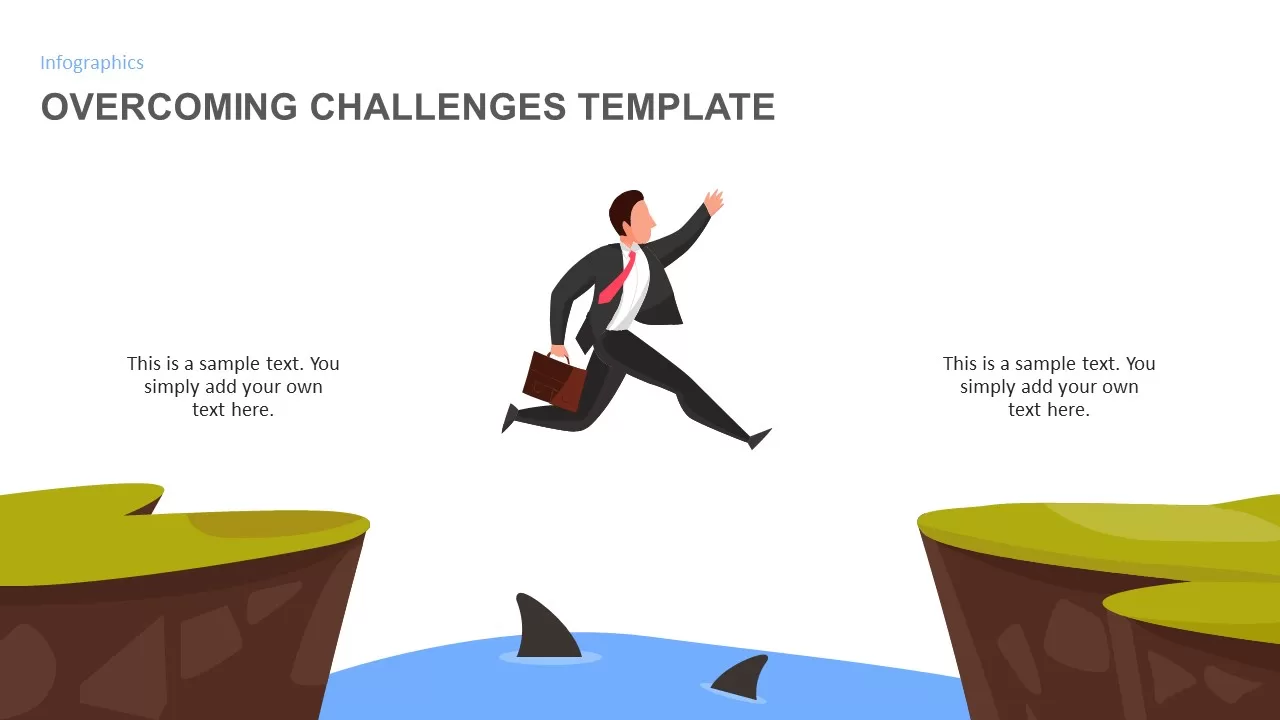
Overcoming Challenges Infographics template for PowerPoint & Google Slides
Opportunities Challenges
Premium
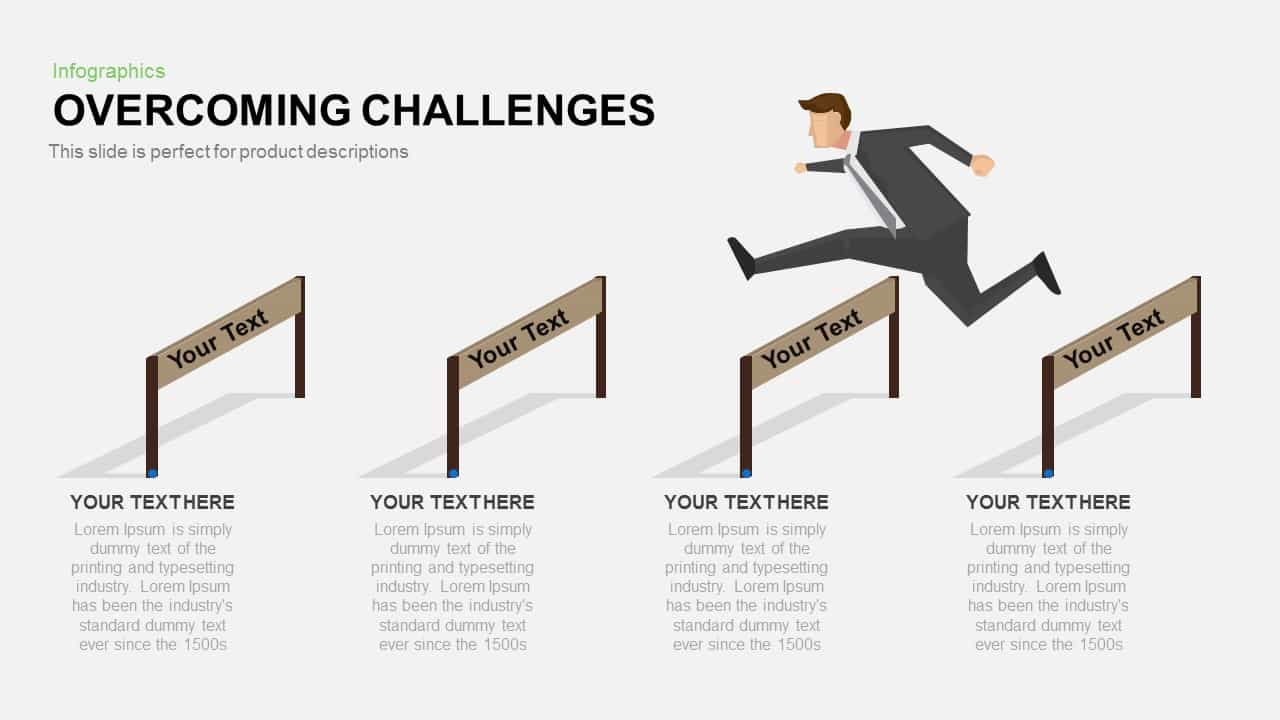
Overcoming Challenges Hurdle Diagram Template for PowerPoint & Google Slides
Process
Premium
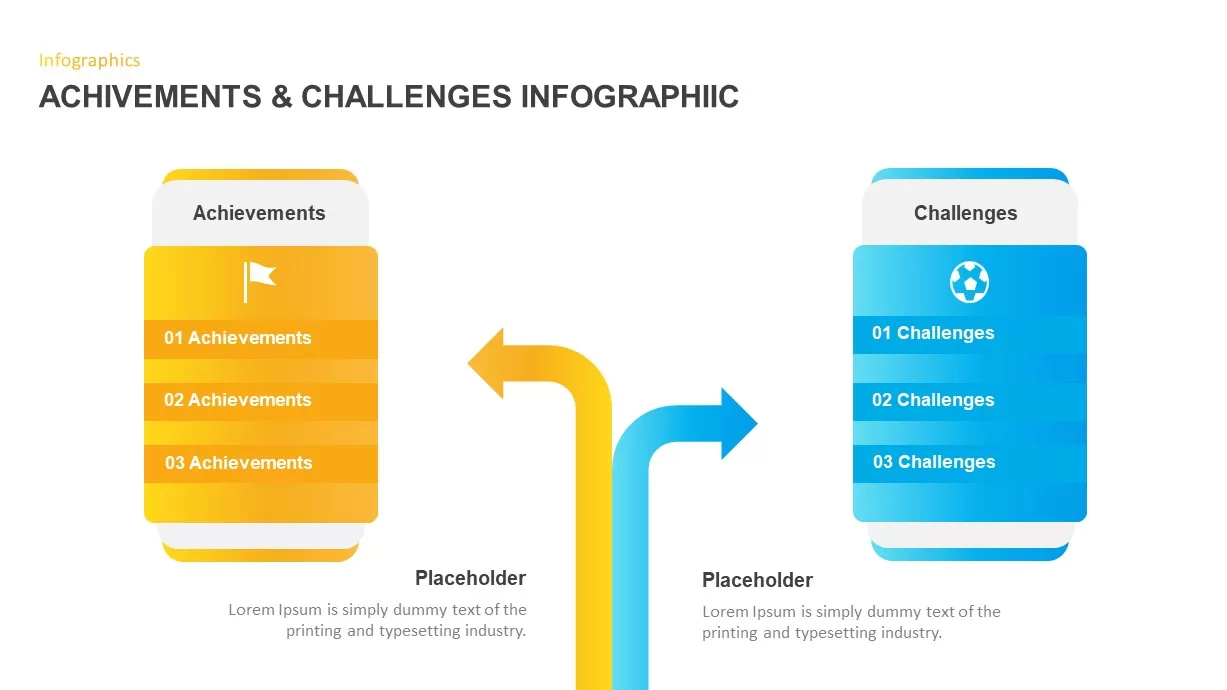
Achievements and Challenges Comparative Infographic Template for PowerPoint & Google Slides
Opportunities Challenges
Premium
Overcoming Challenges Infographic Pack Template for PowerPoint & Google Slides
Opportunities Challenges
Premium
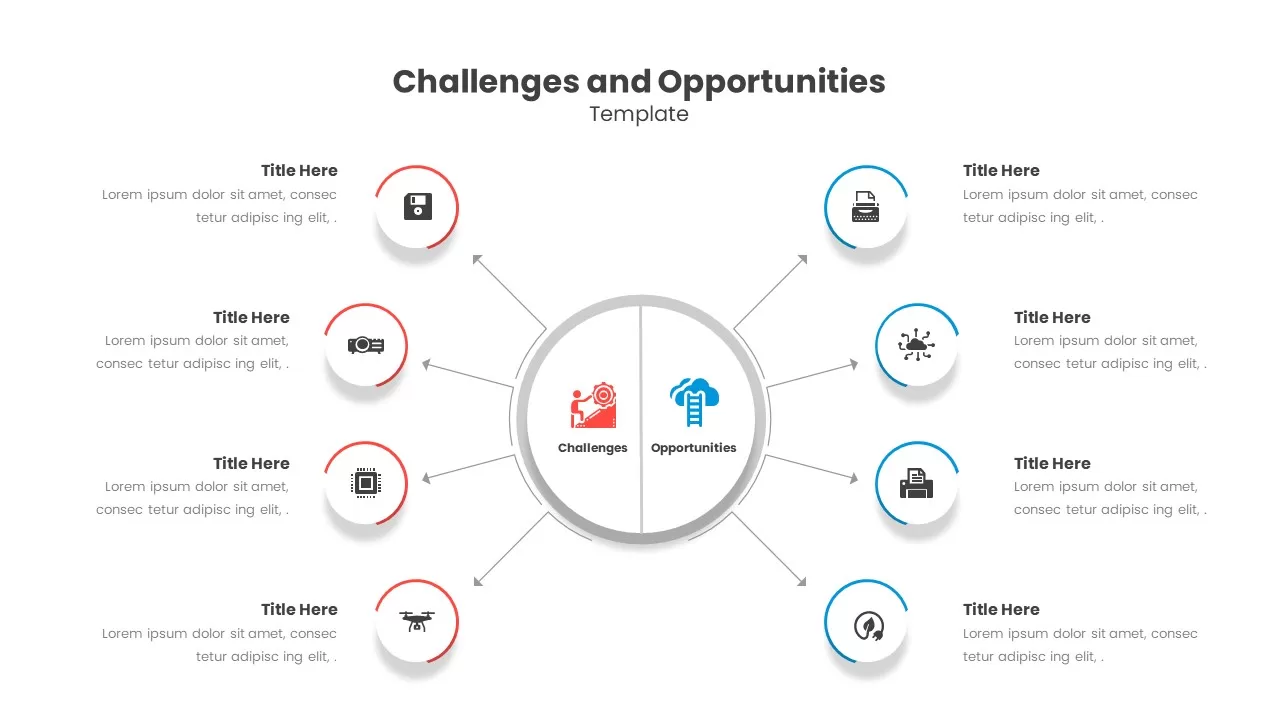
Challenges & Opportunities Hub-Spoke Template for PowerPoint & Google Slides
Circle
Premium
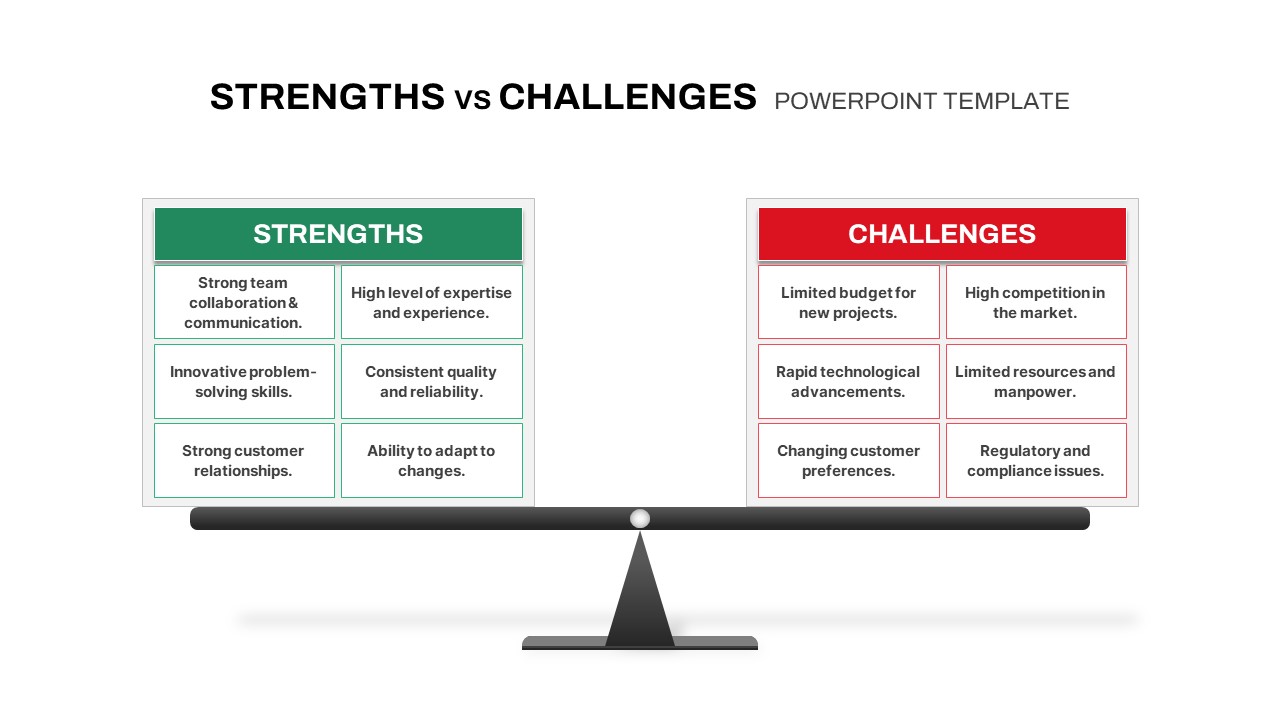
Strengths vs Challenges Weighing Scale Template for PowerPoint & Google Slides
Opportunities Challenges
Premium
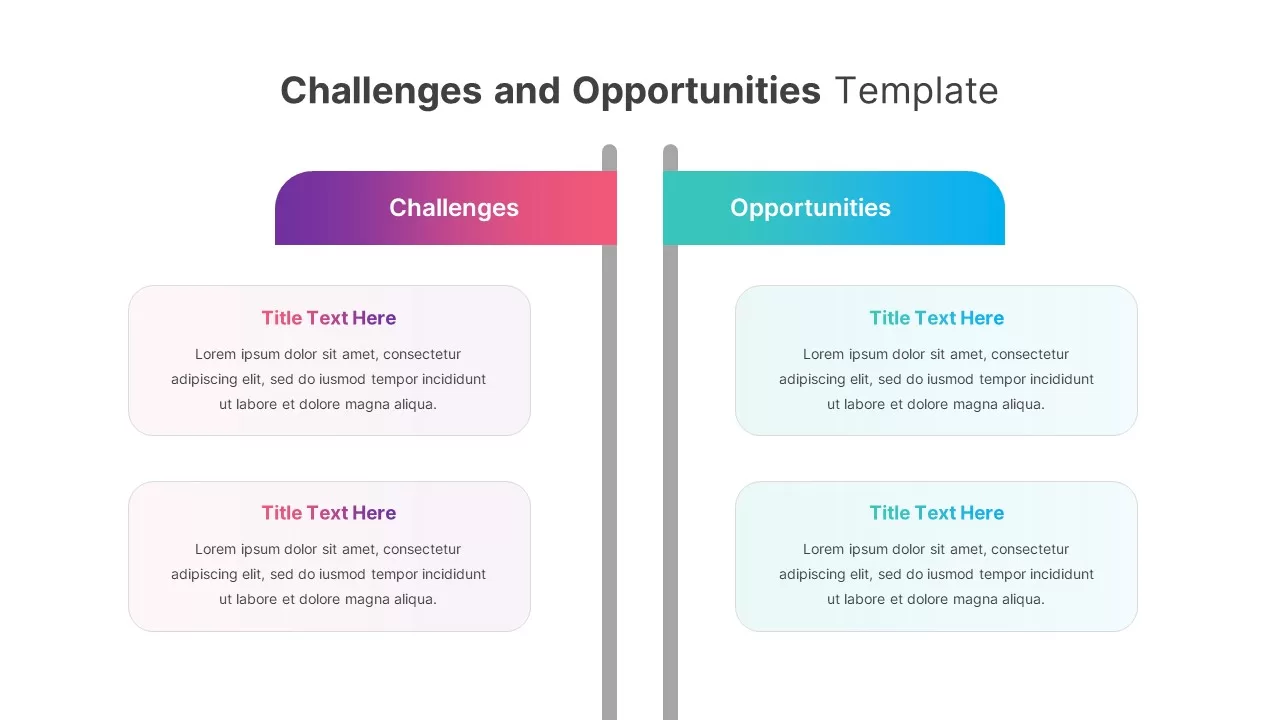
Gradient Challenges and Opportunities Slide for PowerPoint & Google Slides
Opportunities Challenges
Premium
Service Zoom Feature Slides Comparison template for PowerPoint & Google Slides
Process
Premium
Simple Comparison Table Template for PowerPoint & Google Slides
Comparison
Premium
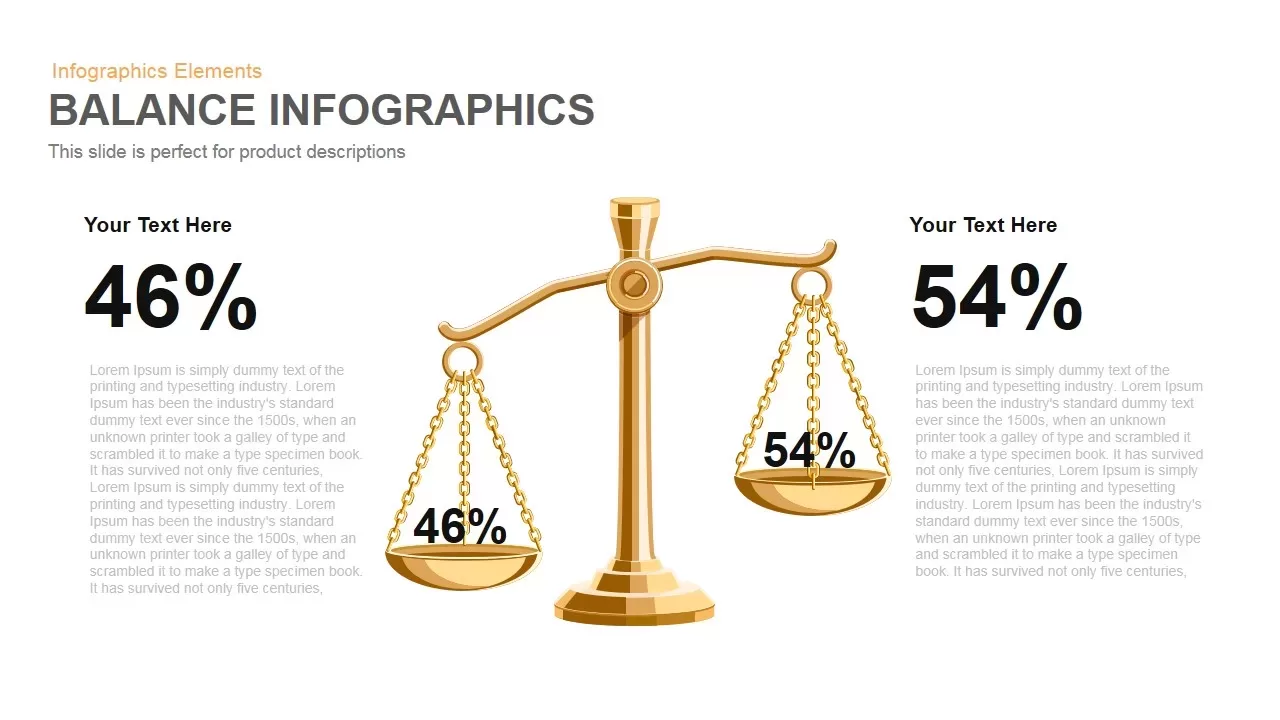
Gold Scales Balance Comparison Template for PowerPoint & Google Slides
Comparison
Premium
Comparison Bar Chart template for PowerPoint & Google Slides
Comparison Chart
Premium
Speedometer Infographic Gauge Comparison Template for PowerPoint & Google Slides
Comparison
Premium
Four Section Comparison Chart Diagram Template for PowerPoint & Google Slides
Infographics
Premium

Clean Mobile Service Comparison Slide Template for PowerPoint & Google Slides
Comparison
Premium

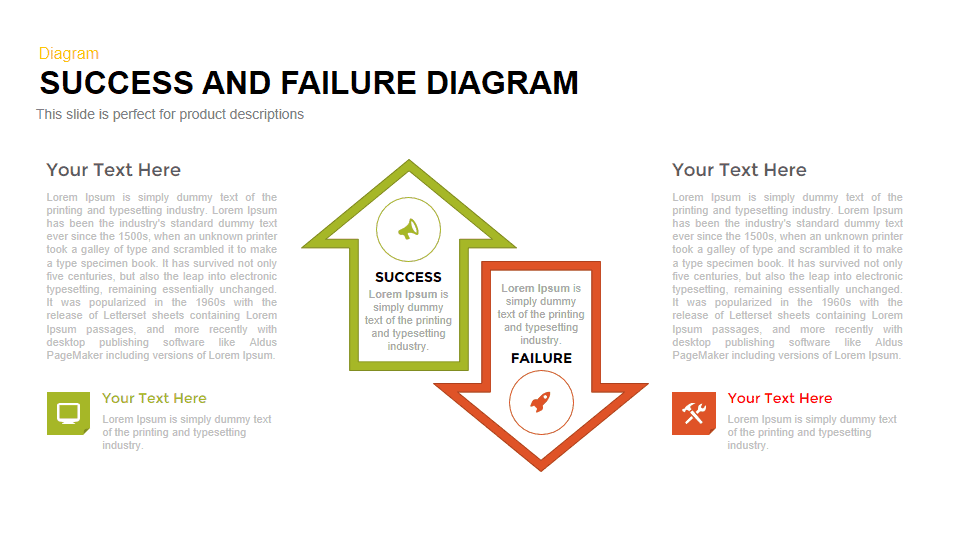
Success vs Failure Comparison Diagram Template for PowerPoint & Google Slides
Comparison
Premium
Scale Metaphor Metrics Comparison Template for PowerPoint & Google Slides
Charts
Premium
Dual Percentage Comparison Metaphor Template for PowerPoint & Google Slides
Comparison
Premium
Gender Comparison People Infographic Template for PowerPoint & Google Slides
Comparison
Premium
Comparison Chart Overview template for PowerPoint & Google Slides
Comparison Chart
Premium
Dynamic Multicolor Comparison Table Template for PowerPoint & Google Slides
Comparison
Premium
Interactive Pricing Plan Comparison Template for PowerPoint & Google Slides
Comparison
Premium
Five-Option Text Boxes Table Comparison Template for PowerPoint & Google Slides
Business Report
Premium
Radar Chart Product Comparison Template for PowerPoint & Google Slides
Comparison Chart
Premium
Six-Metric Green Product Comparison Template for PowerPoint & Google Slides
Comparison
Premium
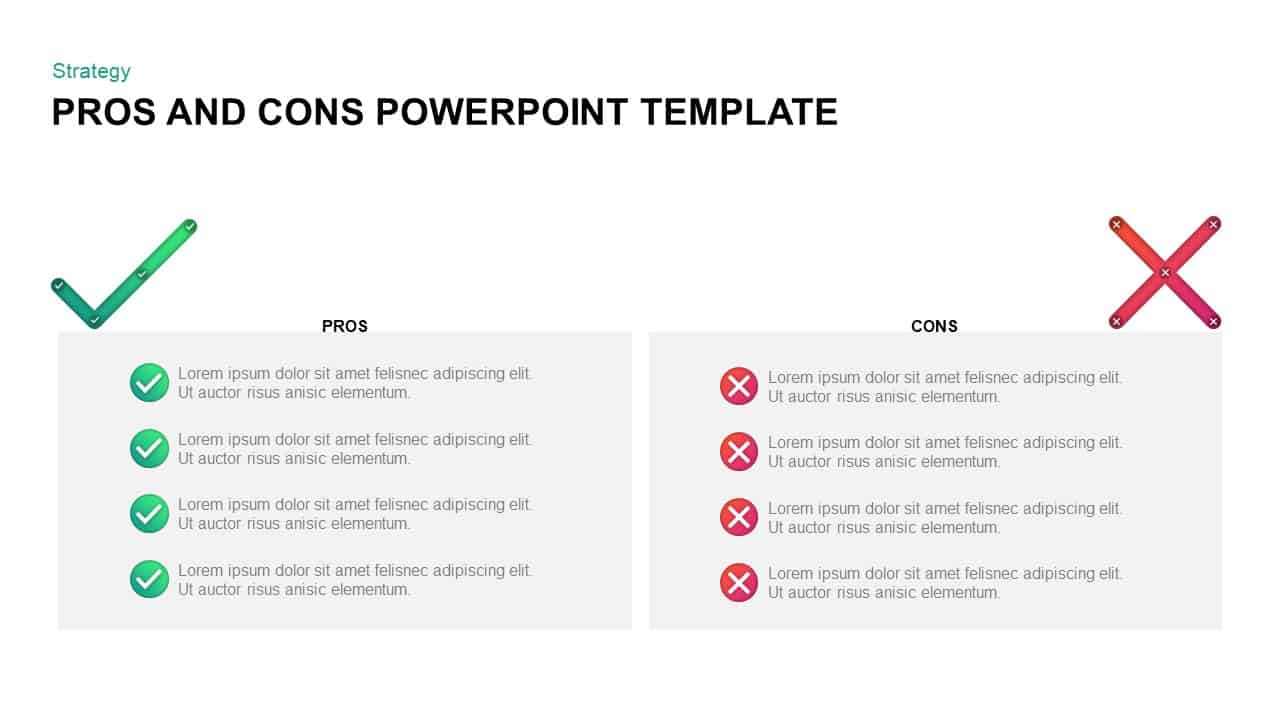
Pros and Cons Comparison Slide Template for PowerPoint & Google Slides
Comparison
Premium
Seller Portals Comparison Infographic Template for PowerPoint & Google Slides
Process
Premium
Fact and Figures Comparison Slide Template for PowerPoint & Google Slides
Business Report
Premium
Four Business Structure Types Comparison Diagram Template for PowerPoint & Google Slides
Business Strategy
Premium
Isometric 3D Block Comparison Diagram Template for PowerPoint & Google Slides
Comparison
Premium
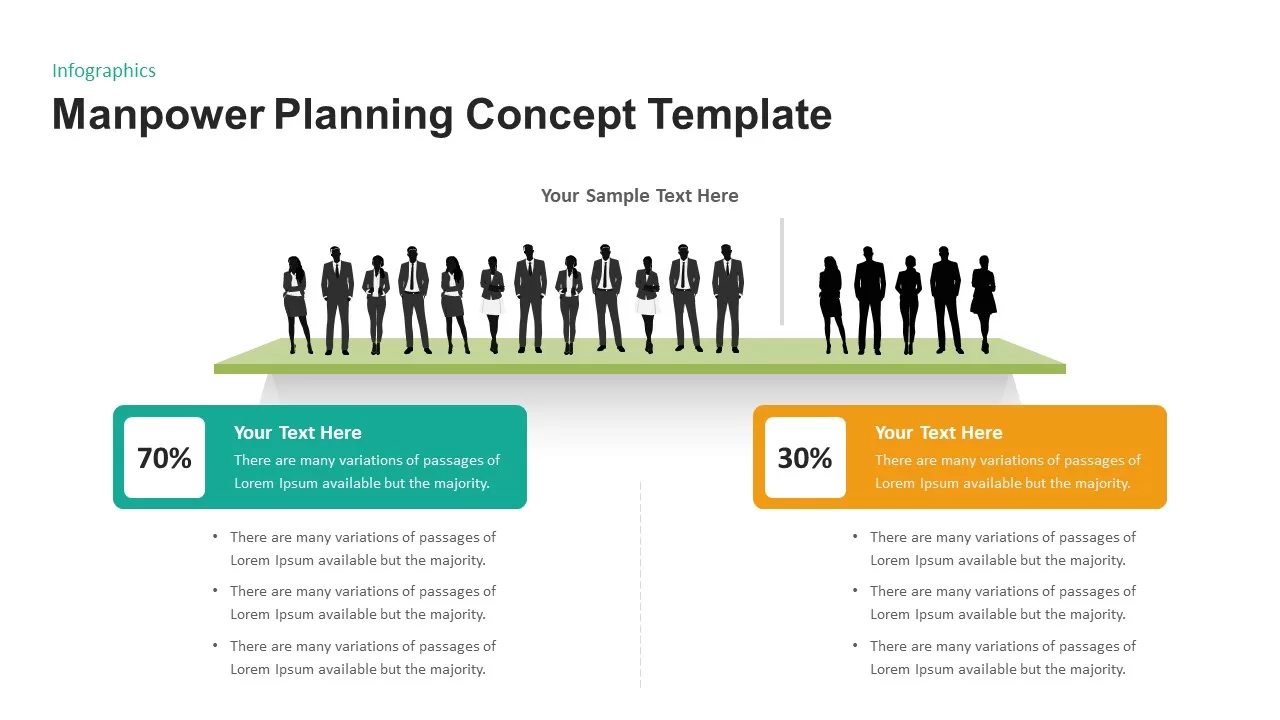
Manpower Planning Concept Comparison Template for PowerPoint & Google Slides
Comparison Chart
Premium
Circular Product Comparison Chart Template for PowerPoint & Google Slides
Comparison Chart
Premium
Internal vs External Factors Comparison Template for PowerPoint & Google Slides
Comparison
Premium
RAG Status Infographic Comparison Template for PowerPoint & Google Slides
Project
Premium
Yin Yang Comparison template for PowerPoint & Google Slides
Business
Premium
Comparison Infographic Overview template for PowerPoint & Google Slides
Business
Premium
Pugh Matrix Decision Comparison Chart Template for PowerPoint & Google Slides
Comparison Chart
Premium
Competitive Landscape Comparison Template Pack for PowerPoint & Google Slides
Comparison
Premium
Business Silhouettes Comparison Slide Template for PowerPoint & Google Slides
HR
Premium
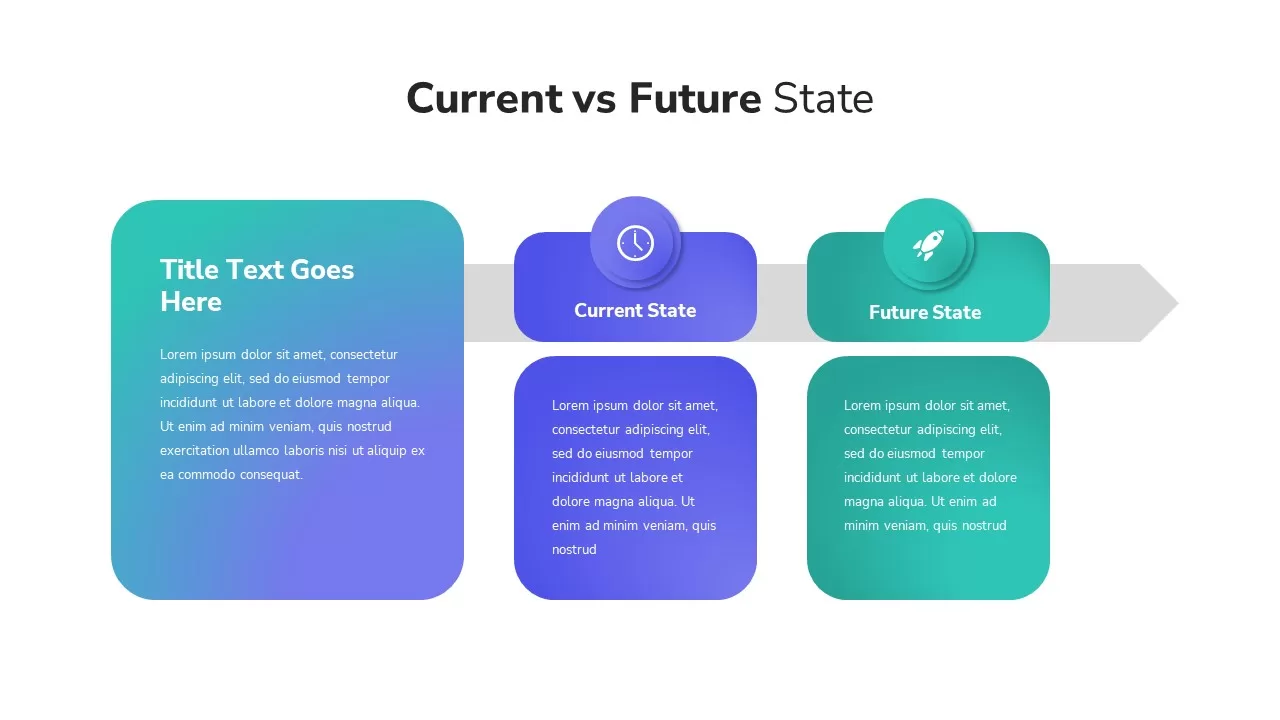
Current vs Future State Comparison Slide Template for PowerPoint & Google Slides
Comparison Chart
Premium
Current vs Future State Comparison Template for PowerPoint & Google Slides
Comparison Chart
Premium
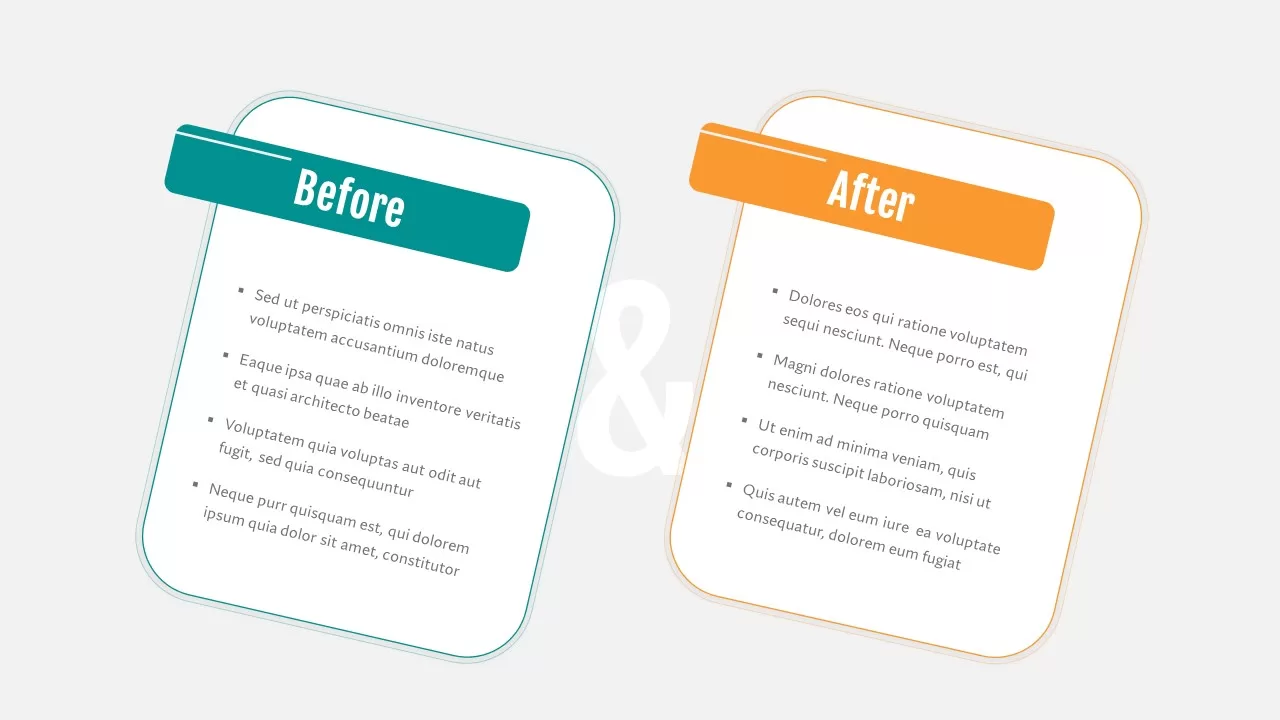
Before and After Comparison Infographic Template for PowerPoint & Google Slides
Comparison
Free
Before and After Comparison Slide Template for PowerPoint & Google Slides
Comparison
Premium
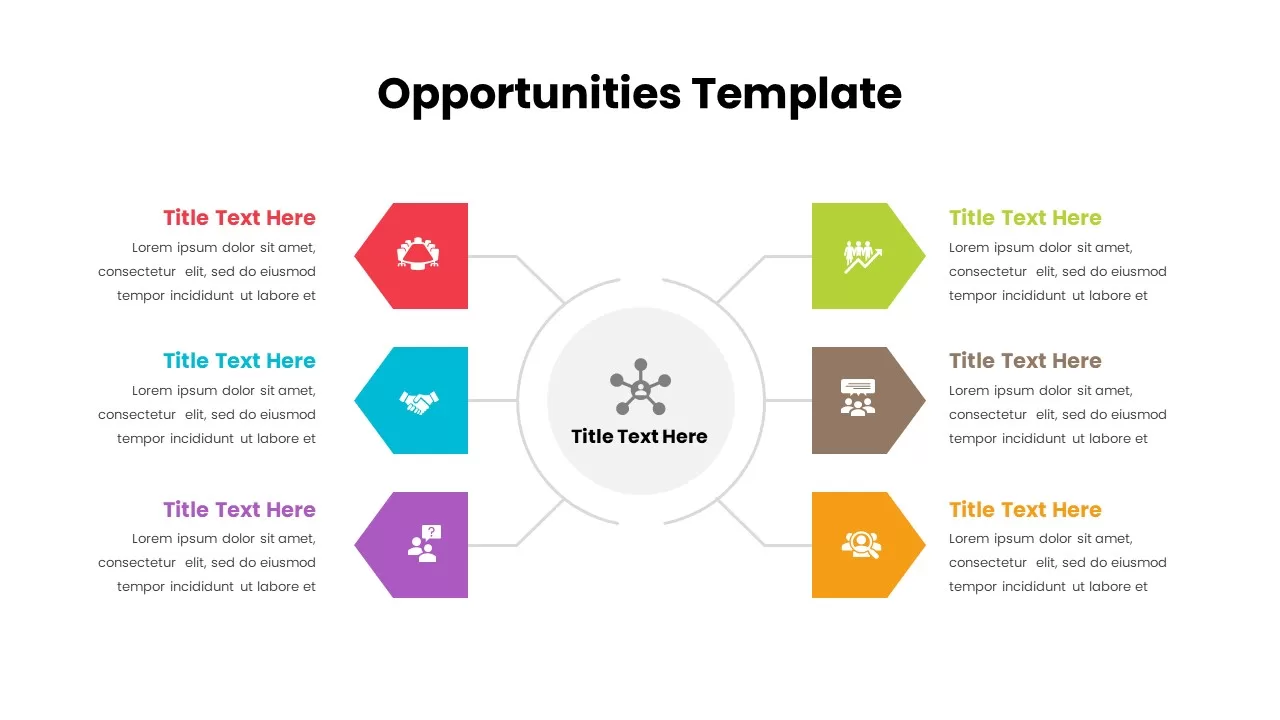
Opportunities Hub-and-Spoke Comparison Diagram Template for PowerPoint & Google Slides
Opportunities Challenges
Premium
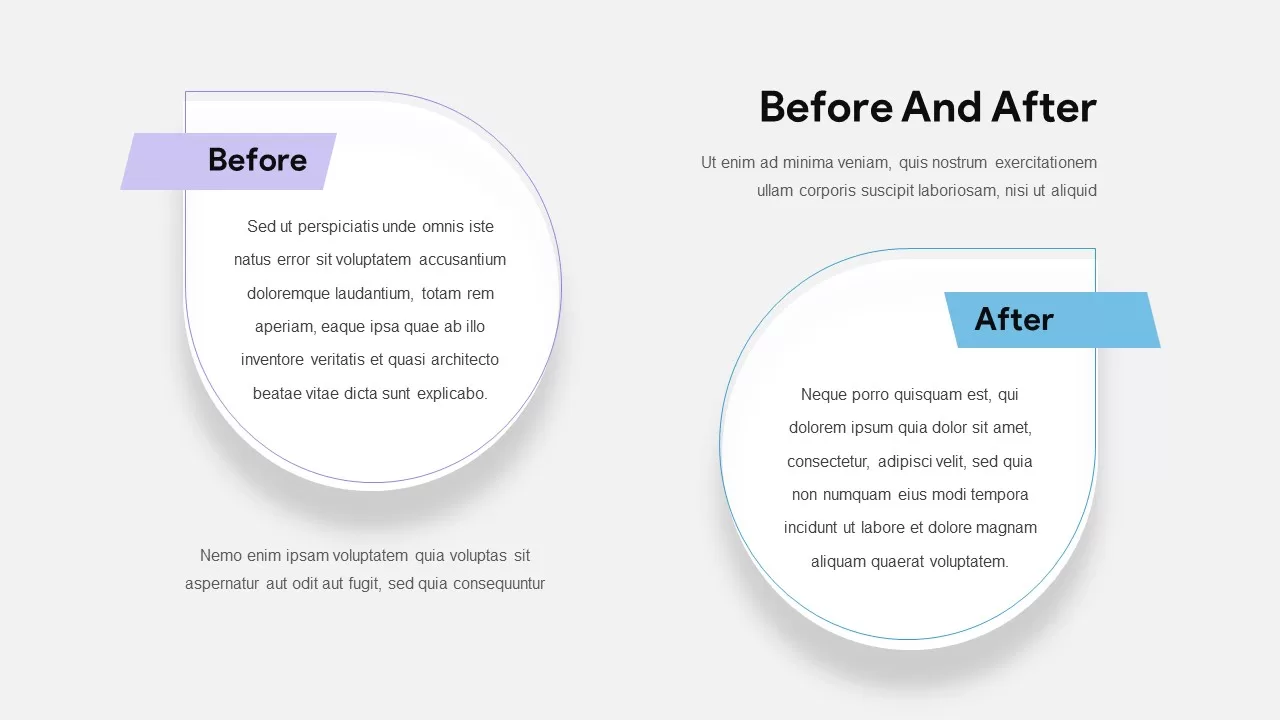
Modern Before and After Comparison Template for PowerPoint & Google Slides
Infographics
Premium
Benchmarking Metrics Comparison Slide Template for PowerPoint & Google Slides
Pie/Donut
Premium
Cost Benefit Analysis Comparison Template for PowerPoint & Google Slides
Comparison
Premium
Risk Heatmap Comparison Template for PowerPoint & Google Slides
Maps
Premium
Heatmap Comparison Template for PowerPoint & Google Slides
Maps
Premium
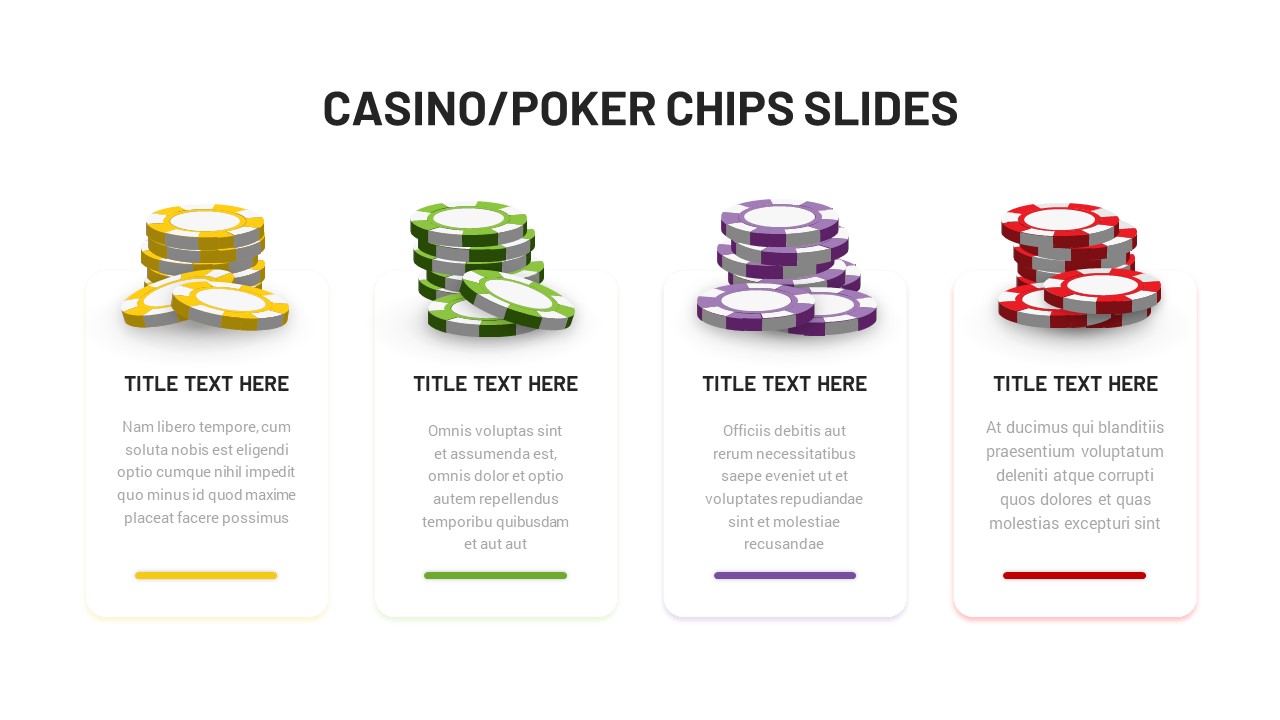
Casino Poker Chips Comparison Slide Template for PowerPoint & Google Slides
Comparison
Premium
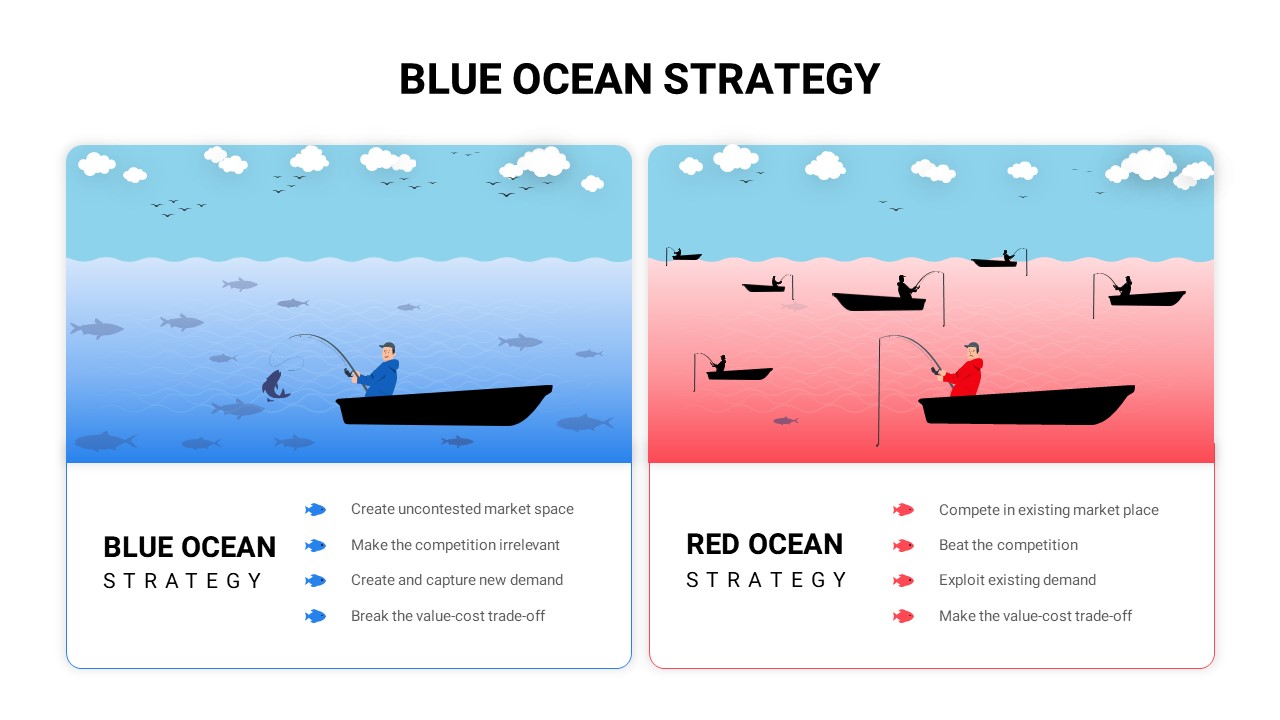
Blue vs Red Ocean Strategy Comparison Template for PowerPoint & Google Slides
Business Strategy
Premium
People Demographic Comparison Chart Template for PowerPoint & Google Slides
Comparison
Premium
Surgery Infographics Comparison Template for PowerPoint & Google Slides
Health
Premium
Clustered Bar Chart Comparison Template for PowerPoint & Google Slides
Bar/Column
Premium
Mirror Bar Chart Comparison Template for PowerPoint & Google Slides
Bar/Column
Premium
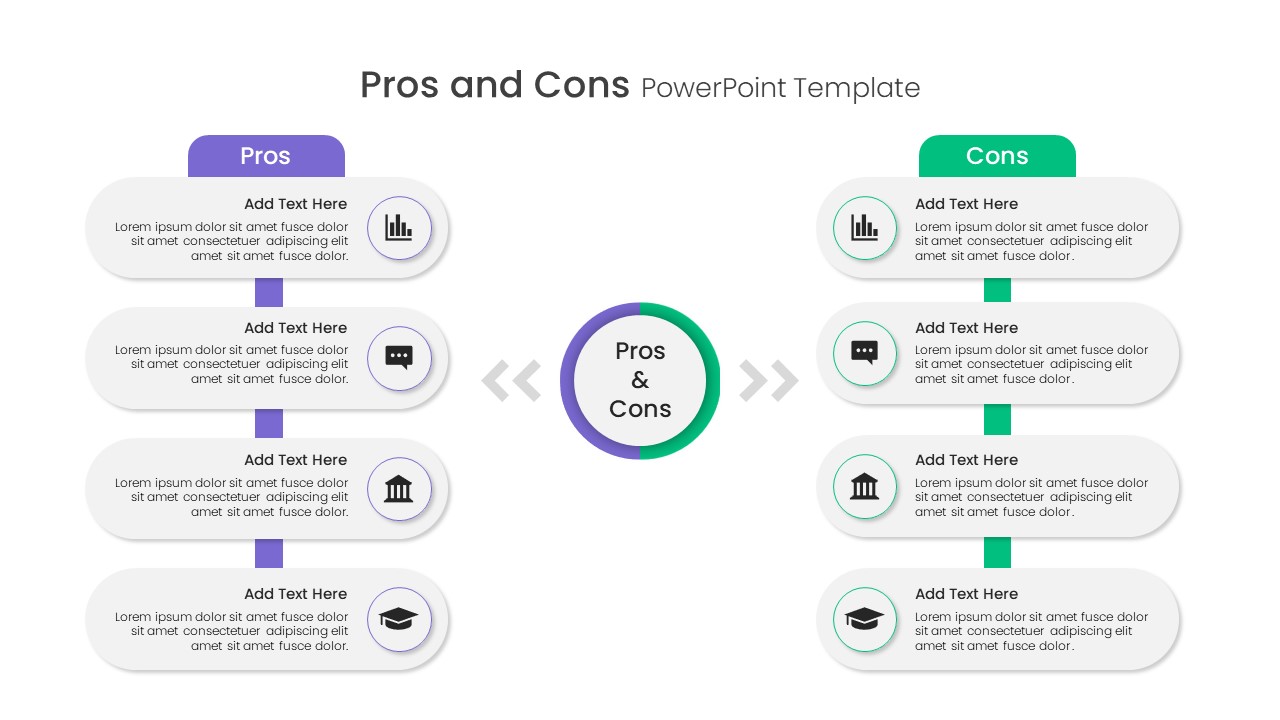
Free Pros and Cons Comparison Template for PowerPoint & Google Slides
Comparison
Free
Free Versatile Product Comparison Chart Template for PowerPoint & Google Slides
Comparison Chart
Free
Free Global Warming Infographic Comparison Template for PowerPoint & Google Slides
Comparison Chart
Free
AI vs. Human Intelligence Comparison Template for PowerPoint & Google Slides
Comparison
Premium
ESG Initiatives Comparison Chart Template for PowerPoint & Google Slides
Business
Premium
Economies of Scale Cost Curve Comparison Template for PowerPoint & Google Slides
Comparison Chart
Premium
Quarterly Revenue Comparison Bar Chart Template for PowerPoint & Google Slides
Bar/Column
Premium
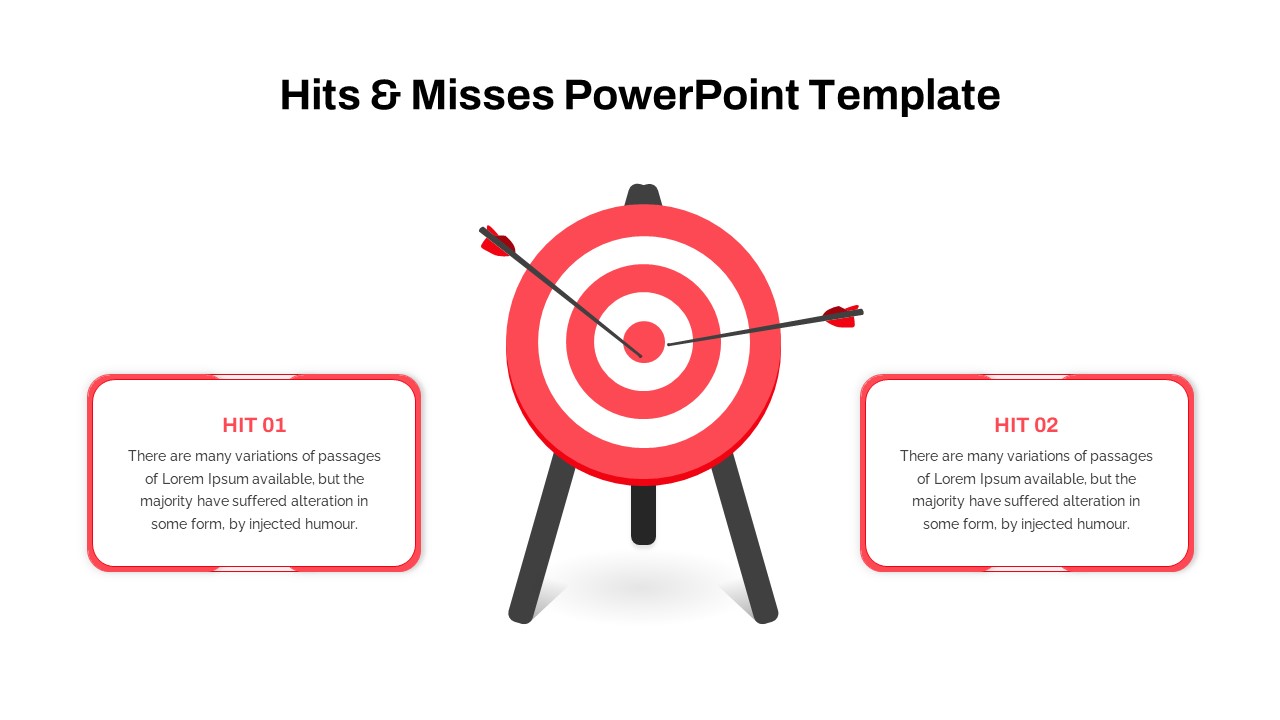
Hits & Misses Comparison Infographic Template for PowerPoint & Google Slides
Pitch Deck
Premium
Pricing Model Types Comparison Infographic Template for PowerPoint & Google Slides
Pitch Deck
Premium
Project Comparison Timeline Roadmap Template for PowerPoint & Google Slides
Comparison
Premium
Risk Level Gauge Comparison Dashboard Template for PowerPoint & Google Slides
Comparison
Premium
Competitor Comparison Chart Design Template for PowerPoint & Google Slides
Comparison
Premium
Two-Option Bar Chart Comparison Table Template for PowerPoint & Google Slides
Comparison
Premium
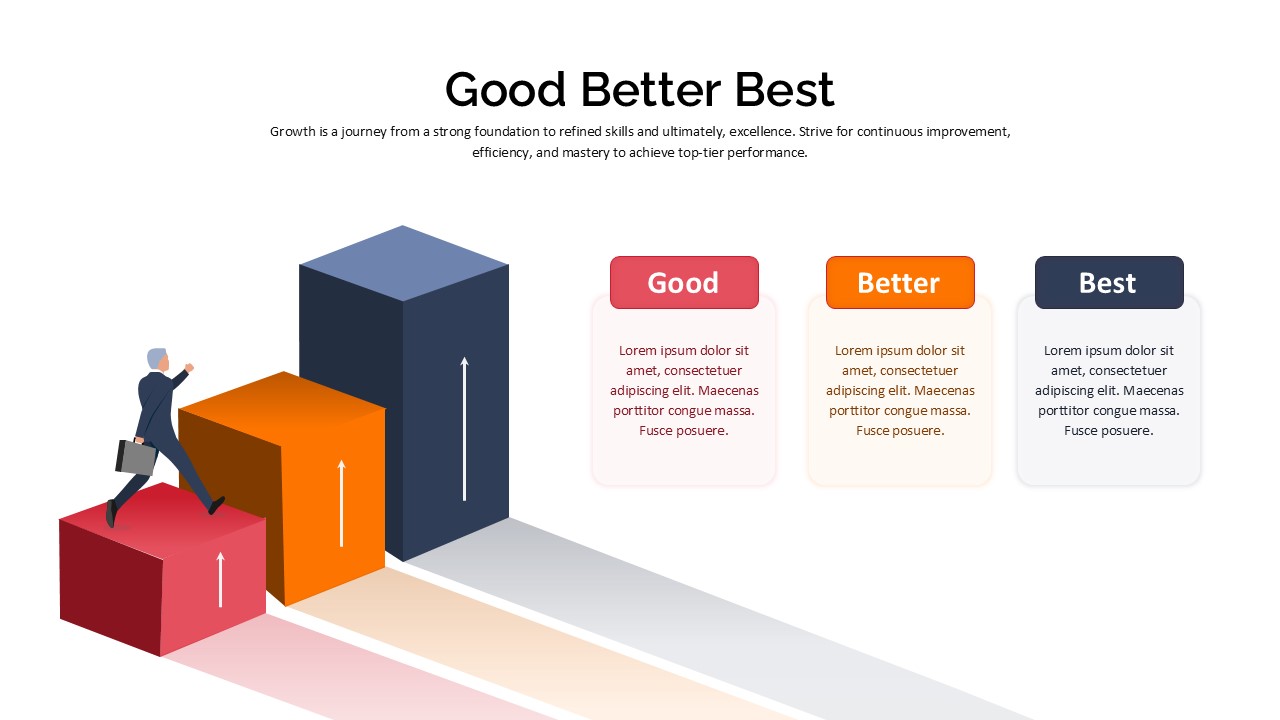
Good Better Best Comparison template for PowerPoint & Google Slides
Comparison
Premium
Cross Sell & Up Sell Strategy Comparison template for PowerPoint & Google Slides
Comparison
Premium
Integrative Thinking Comparison Diagram Template for PowerPoint & Google Slides
Comparison
Premium
Product Feature Comparison Table Template for PowerPoint & Google Slides
Comparison Chart
Premium
Market Share Comparison Diagram Template for PowerPoint & Google Slides
Comparison Chart
Premium
Competitor Profile Matrix Comparison Template for PowerPoint & Google Slides
Comparison Chart
Premium
Two-Sided Coin Comparison Diagram Template for PowerPoint & Google Slides
Comparison
Premium
Sales Growth Comparison Chart & Table Template for PowerPoint & Google Slides
Bar/Column
Premium
Two-Box Analysis & Target Comparison Template for PowerPoint & Google Slides
Comparison
Premium
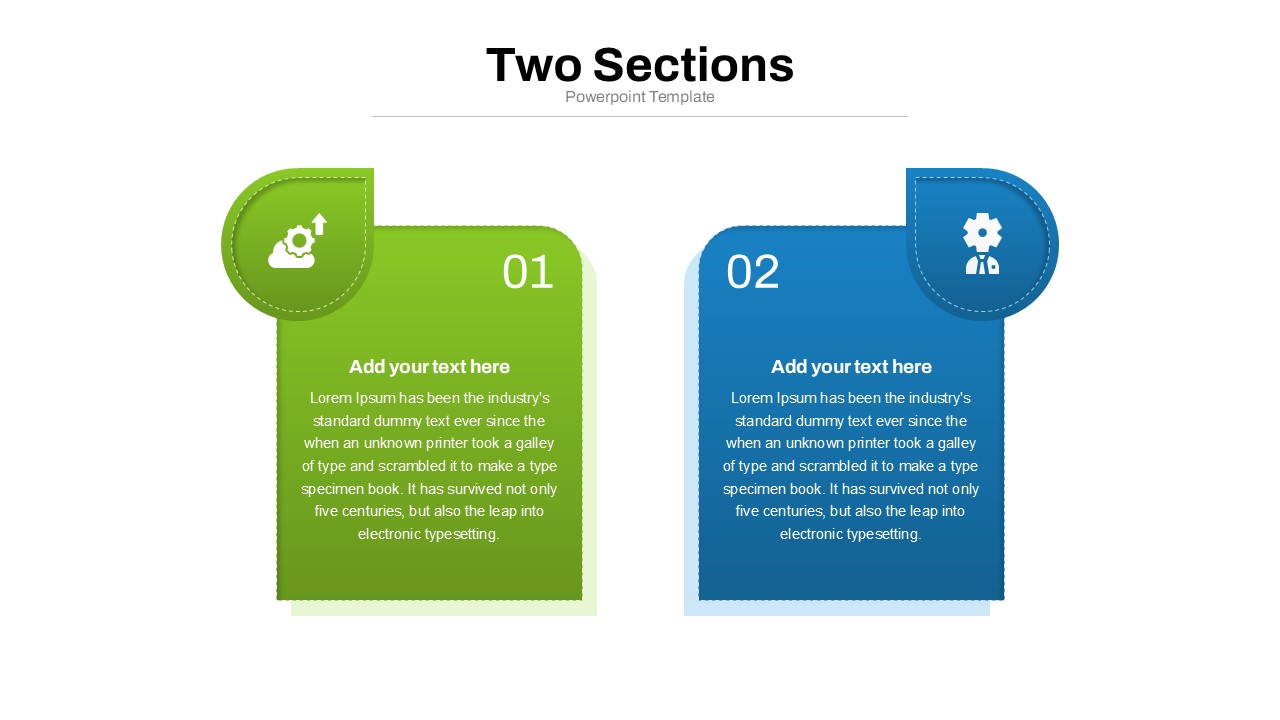
Two Section Comparison template for PowerPoint & Google Slides
Business Proposal
Premium
VUCA vs BANI Comparison Infographic Template for PowerPoint & Google Slides
Comparison
Premium
Category Analysis Comparison Infographic Template for PowerPoint & Google Slides
Comparison
Premium
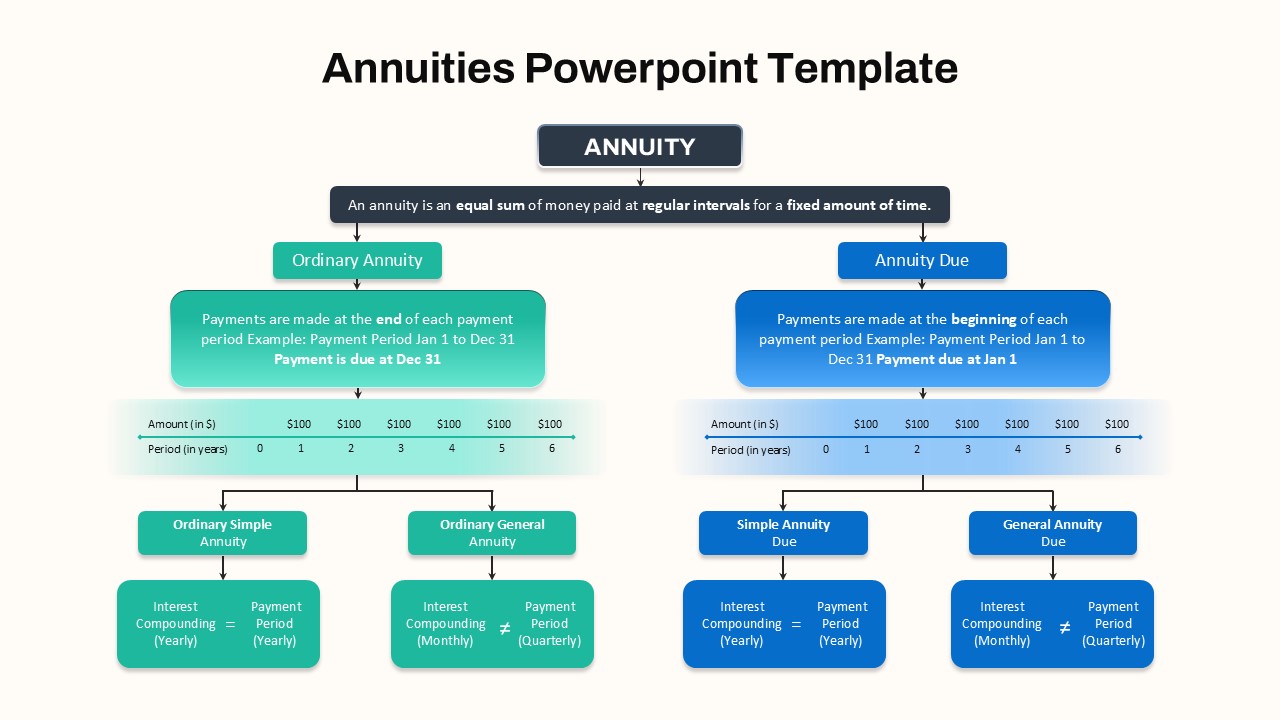
Hierarchical Annuity Comparison Flowchart Template for PowerPoint & Google Slides
Business Report
Premium
Feasibility Matrix Comparison Chart Template for PowerPoint & Google Slides
Comparison Chart
Premium
Funnel and Flywheel Thinking Comparison template for PowerPoint & Google Slides
Infographics
Premium
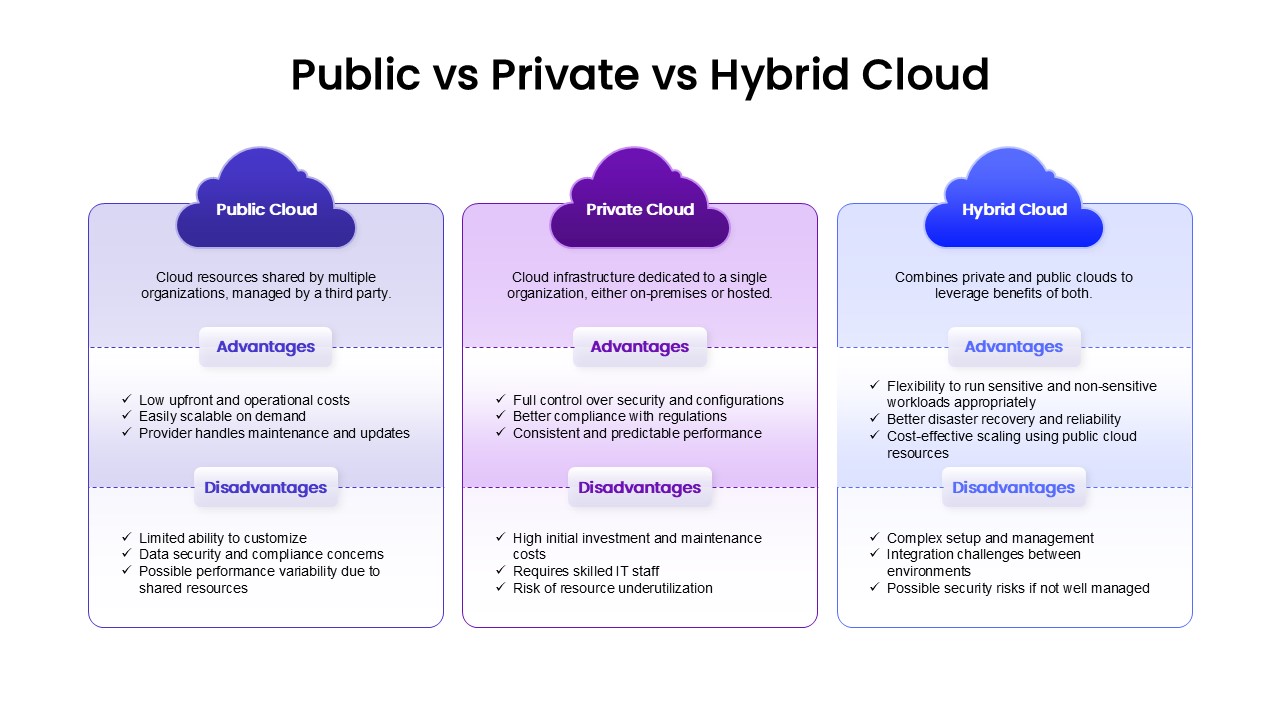
Public, Private & Hybrid Cloud Comparison Template for PowerPoint & Google Slides
Cloud Computing
Premium
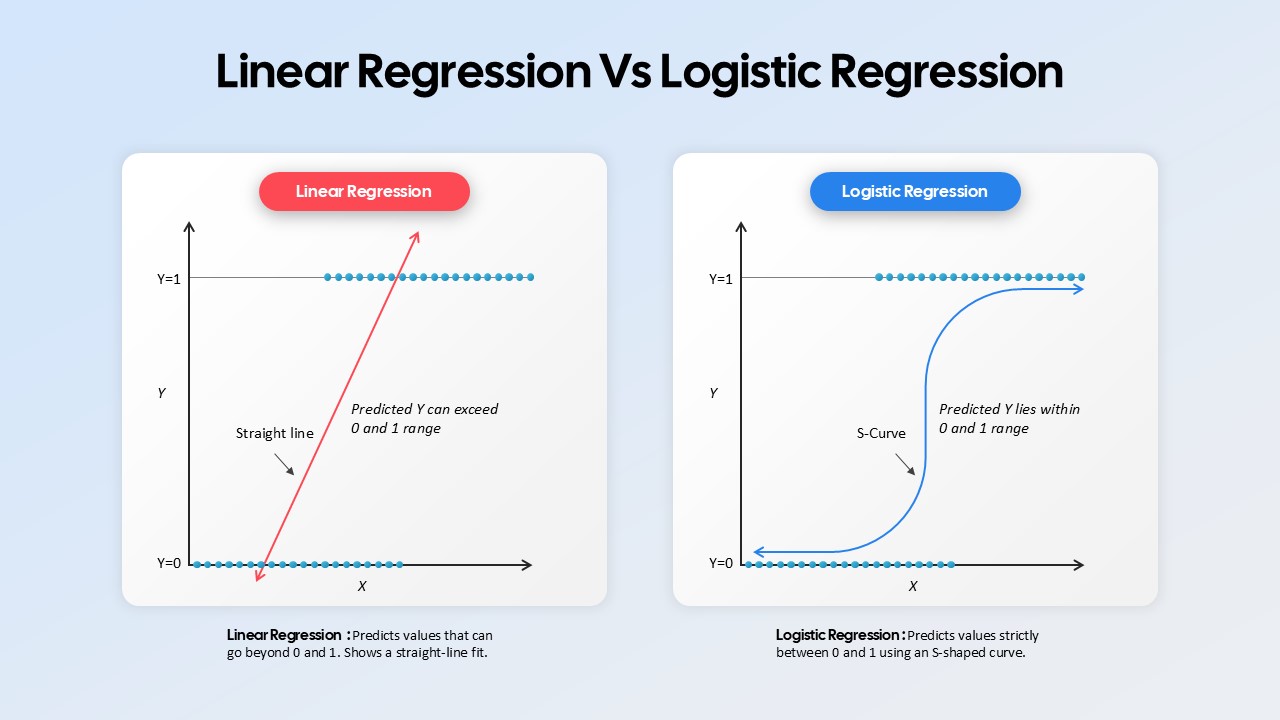
Linear Regression vs Logistic Regression Comparison template for PowerPoint & Google Slides
Comparison
Premium
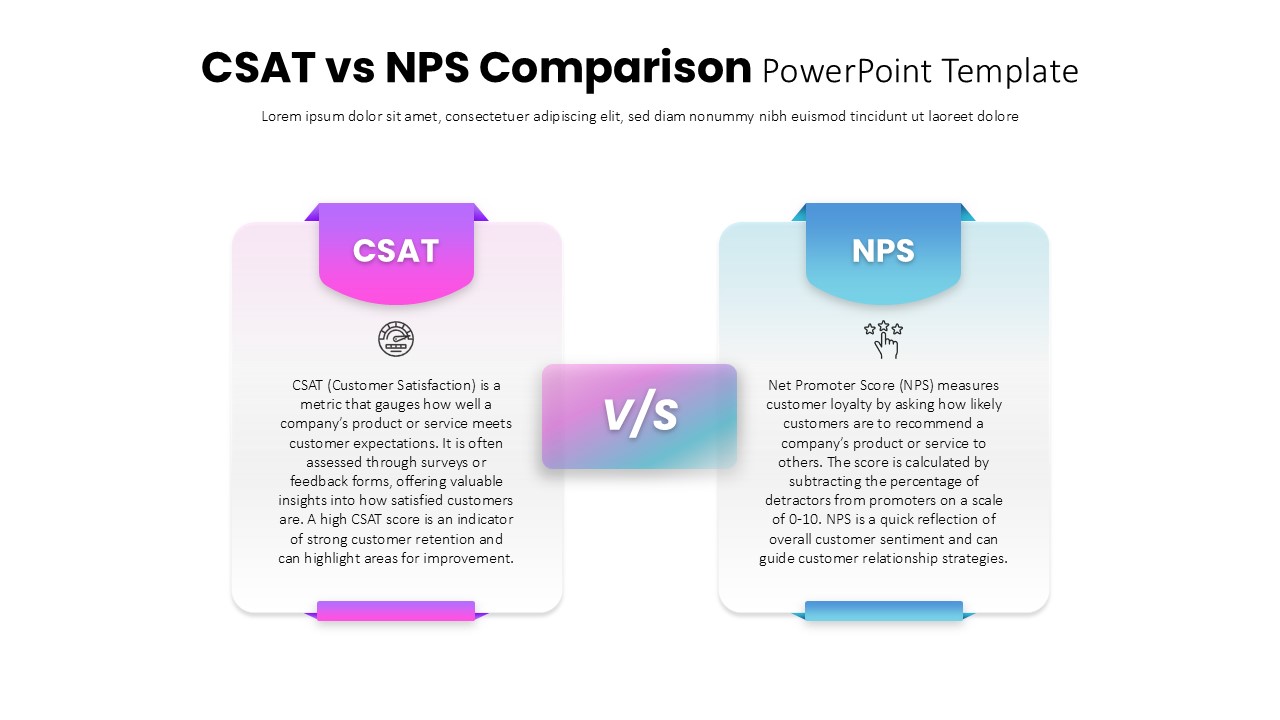
CSAT vs NPS Comparison template for PowerPoint & Google Slides
Business Strategy
Premium
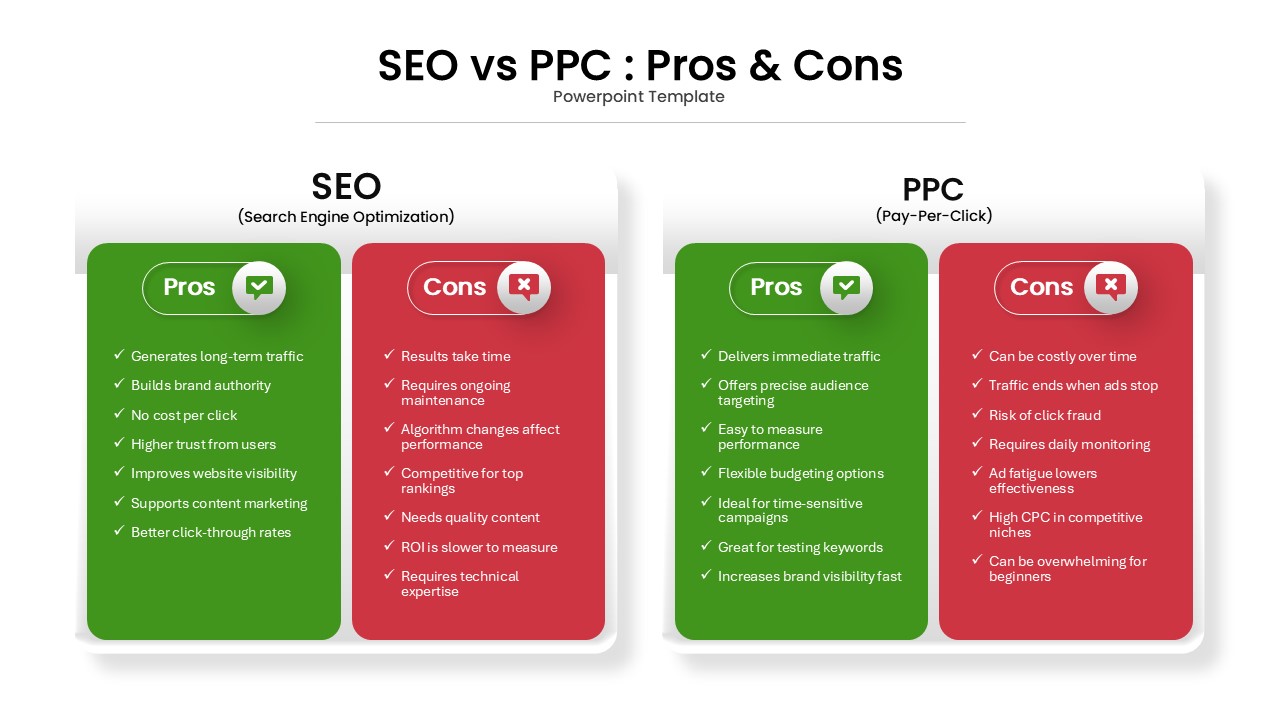
SEO vs PPC: Pros & Cons Comparison Template for PowerPoint & Google Slides
Comparison
Premium
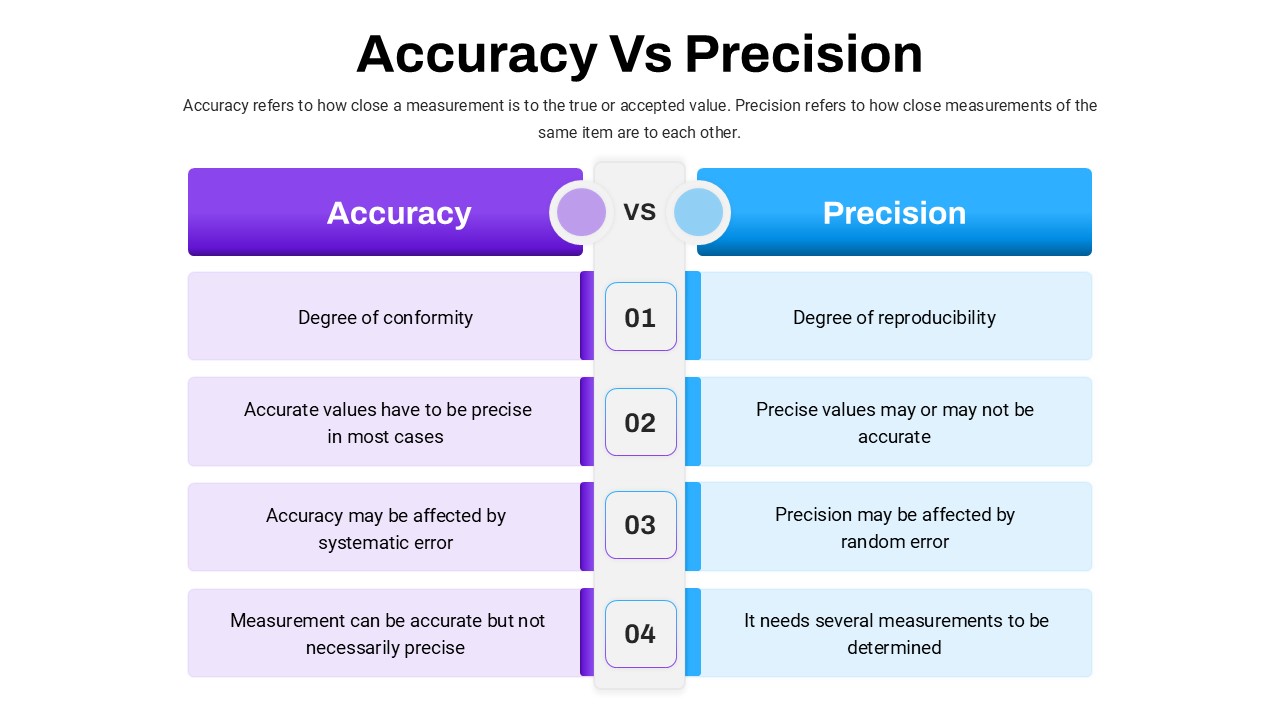
Accuracy Vs Precision Comparison Template for PowerPoint & Google Slides
Comparison Chart
Premium
Risk vs Reward Comparison Template for PowerPoint & Google Slides
Opportunities Challenges
Premium
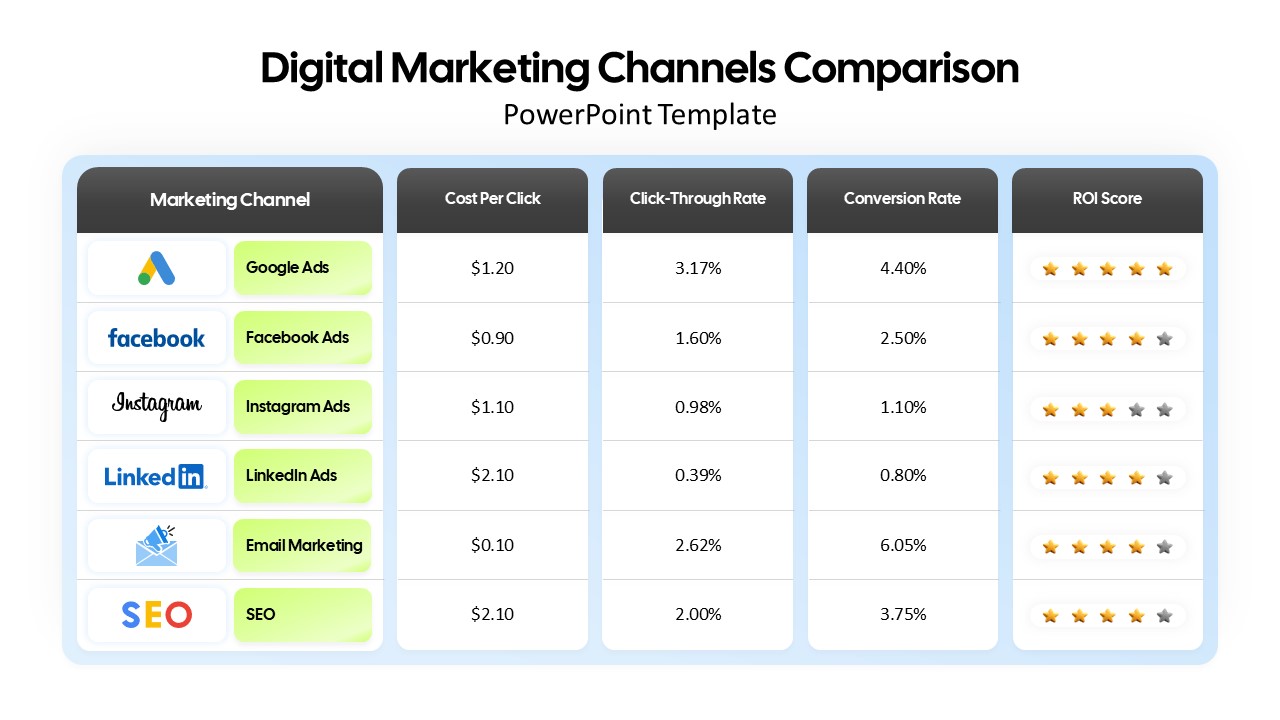
Digital Marketing Channels Comparison template for PowerPoint & Google Slides
Business
Premium