Weekly Gantt Chart Project Timeline Template for PowerPoint & Google Slides


Description
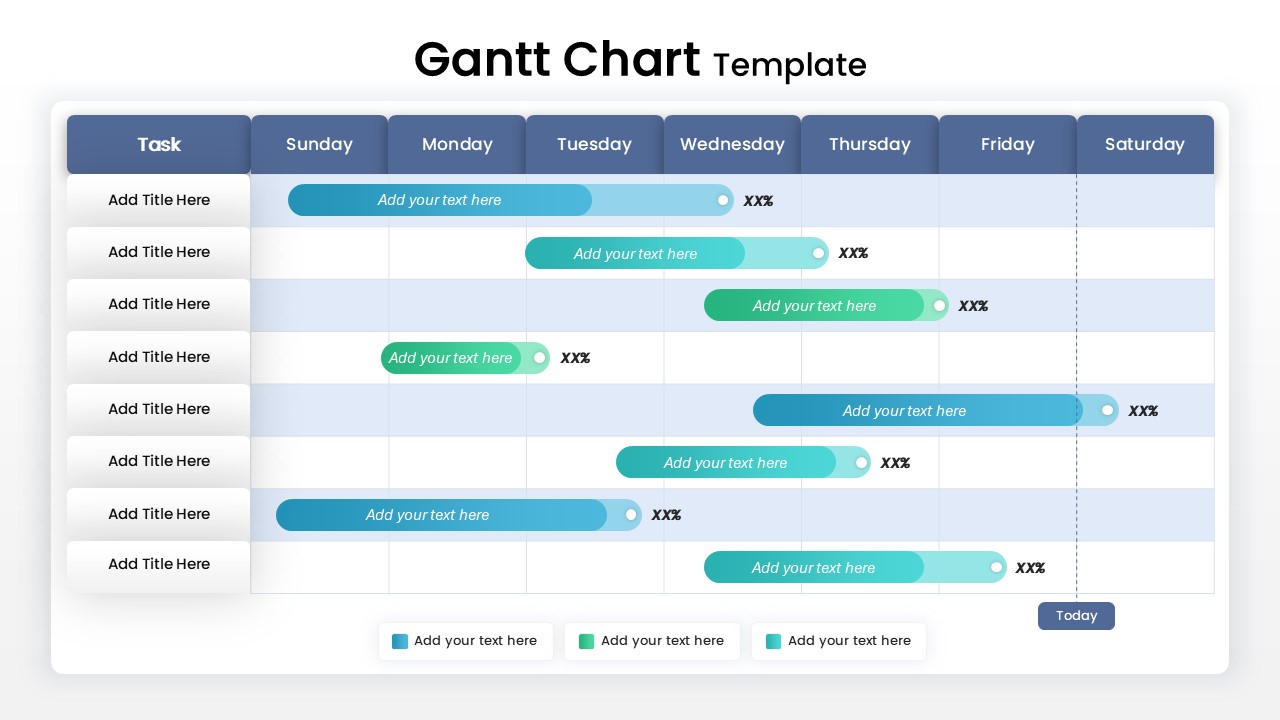
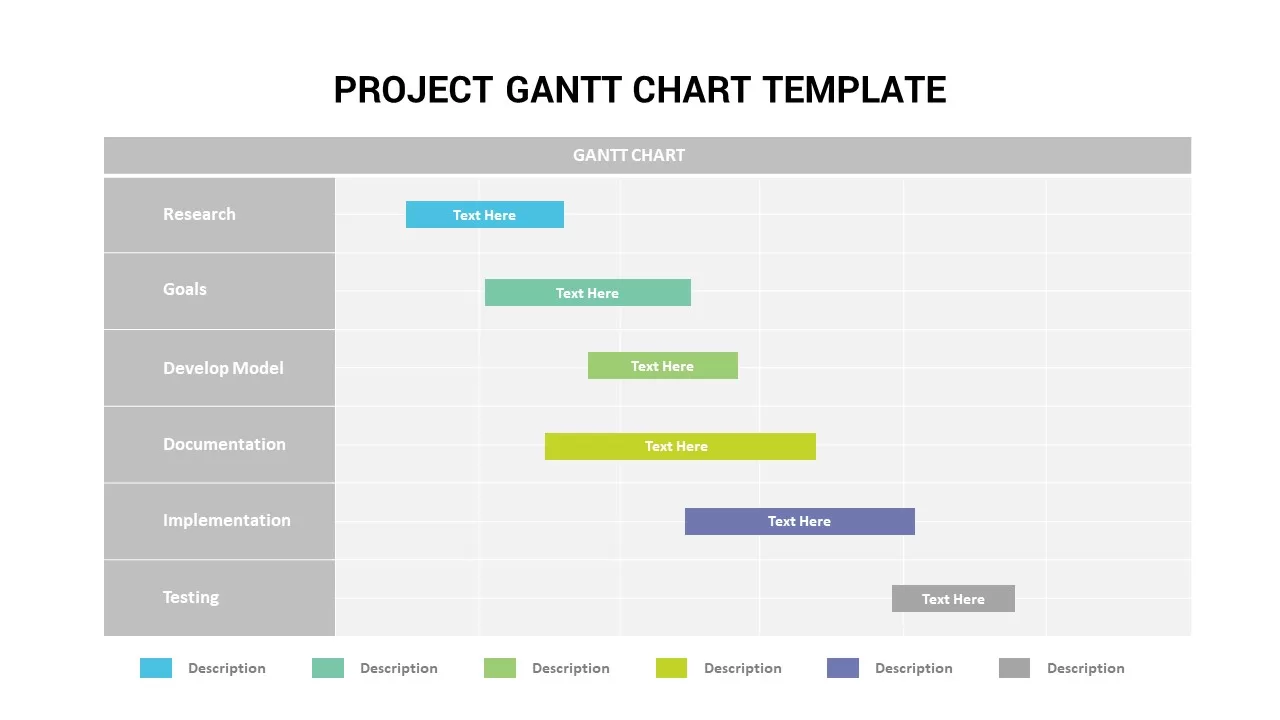
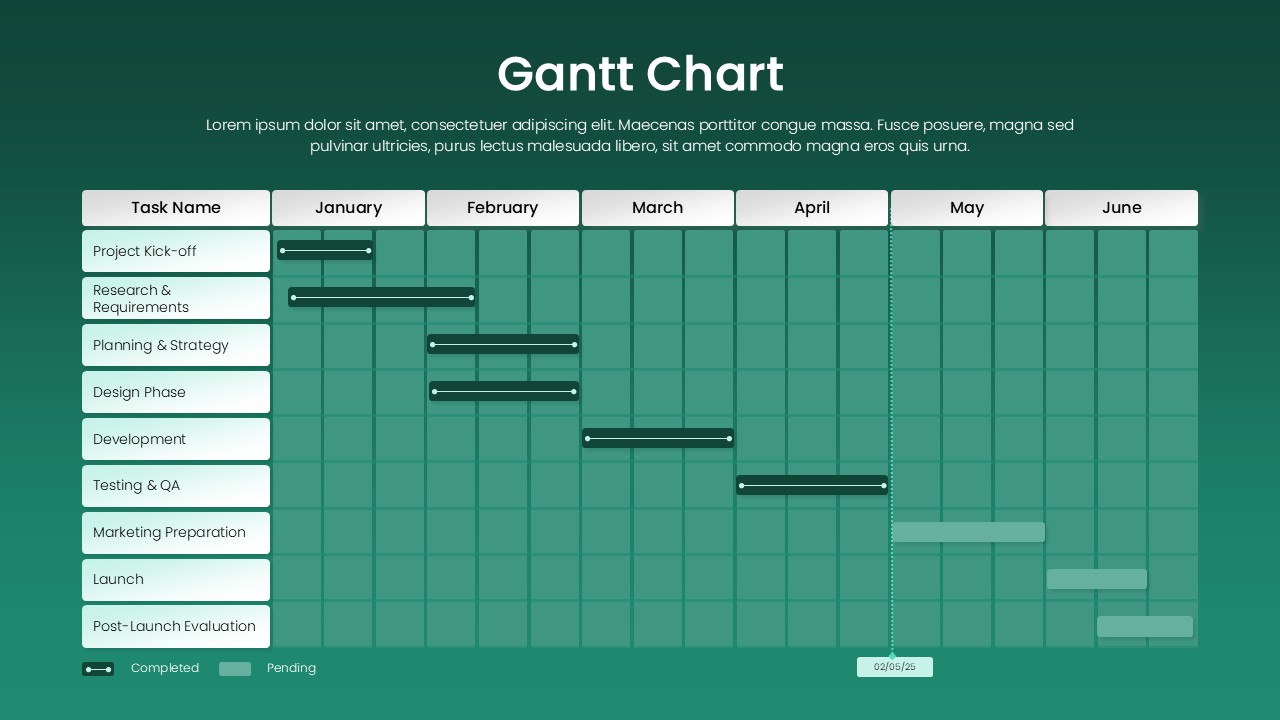
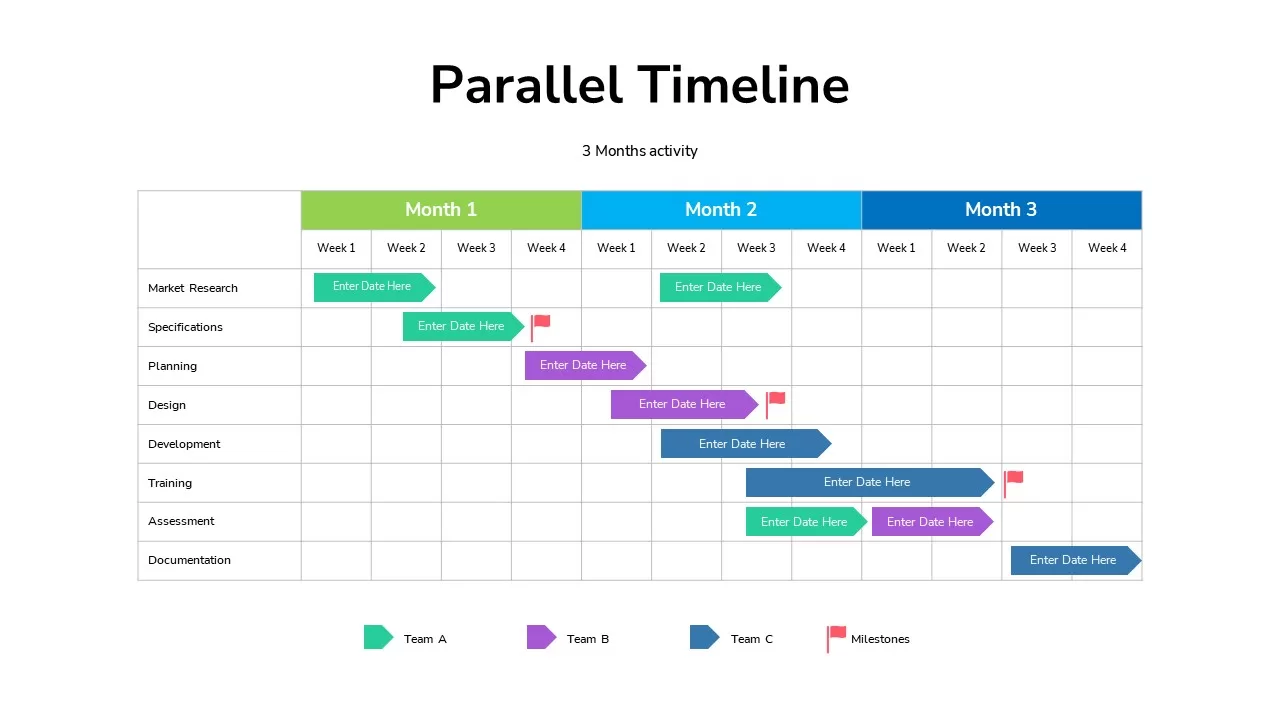
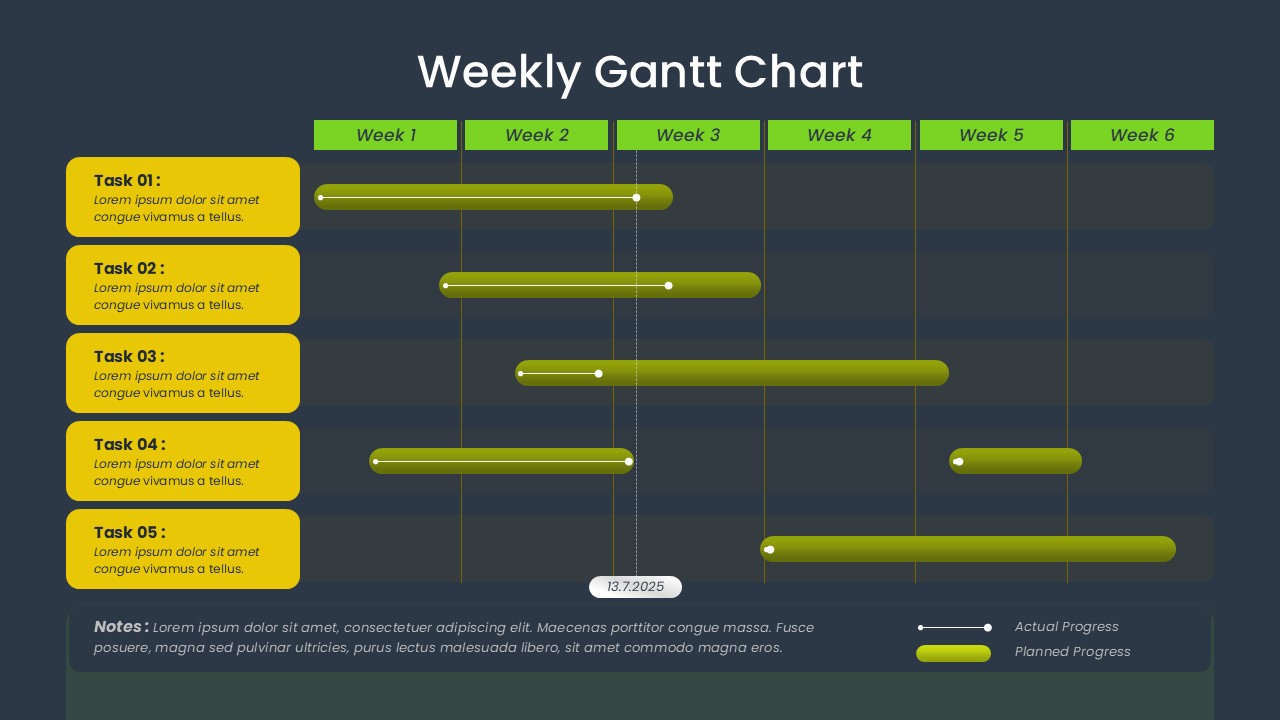
Streamline your project scheduling with this weekly Gantt chart template, designed to display up to six weeks of planned versus actual progress across multiple tasks. Five horizontal rows list tasks with descriptive labels on the left, while vertical gridlines and headers delineate Week 1 through Week 6. Each task bar uses a vibrant gradient fill to indicate planned durations, paired with a thin progress line and marker to show actual completion to date. A customizable date callout highlights the current milestone, and a bottom notes section provides space for annotations, status updates, or risk comments. The clean white background, rounded‐corner panels, and modern sans‐serif typography ensure clarity and professionalism, whether projected in a team meeting or shared as a status report.
Built on master slides for both PowerPoint and Google Slides, this template offers one-click theme color controls to adapt the palette to your brand. All elements are constructed from editable vector shapes, allowing you to resize bars, move gridlines, or adjust task labels without quality loss. Grouped connectors and smart guides maintain alignment automatically when you reposition bars. Preconfigured entrance animations enable sequential reveals of each task row or progress marker, guiding audiences step by step through your timeline. Use the notes panel at the bottom to document assumptions, change requests, or next steps, keeping stakeholders informed and aligned.
Who is it for
Project managers, scrum masters, and program coordinators will leverage this Gantt chart to monitor sprint deliverables, align cross-functional teams, and report weekly status updates in boardrooms, stand-ups, or client presentations.
Other Uses
Beyond project scheduling, repurpose this layout for marketing campaign calendars, sales pipeline reviews, product launch roadmaps, or editorial publishing plans by relabeling tasks and weeks—ensuring clear visibility into any time-based initiative.
Login to download this file

Item ID
SB05293
Related Templates

Weekly Gantt Chart with Milestones Template for PowerPoint & Google Slides
Gantt Chart
Interactive Project Gantt Chart Timeline Template for PowerPoint & Google Slides
Gantt Chart
Annual Project Gantt Chart Timeline Template for PowerPoint & Google Slides
Gantt Chart
Project Tracker Timeline Gantt Chart Template for PowerPoint & Google Slides
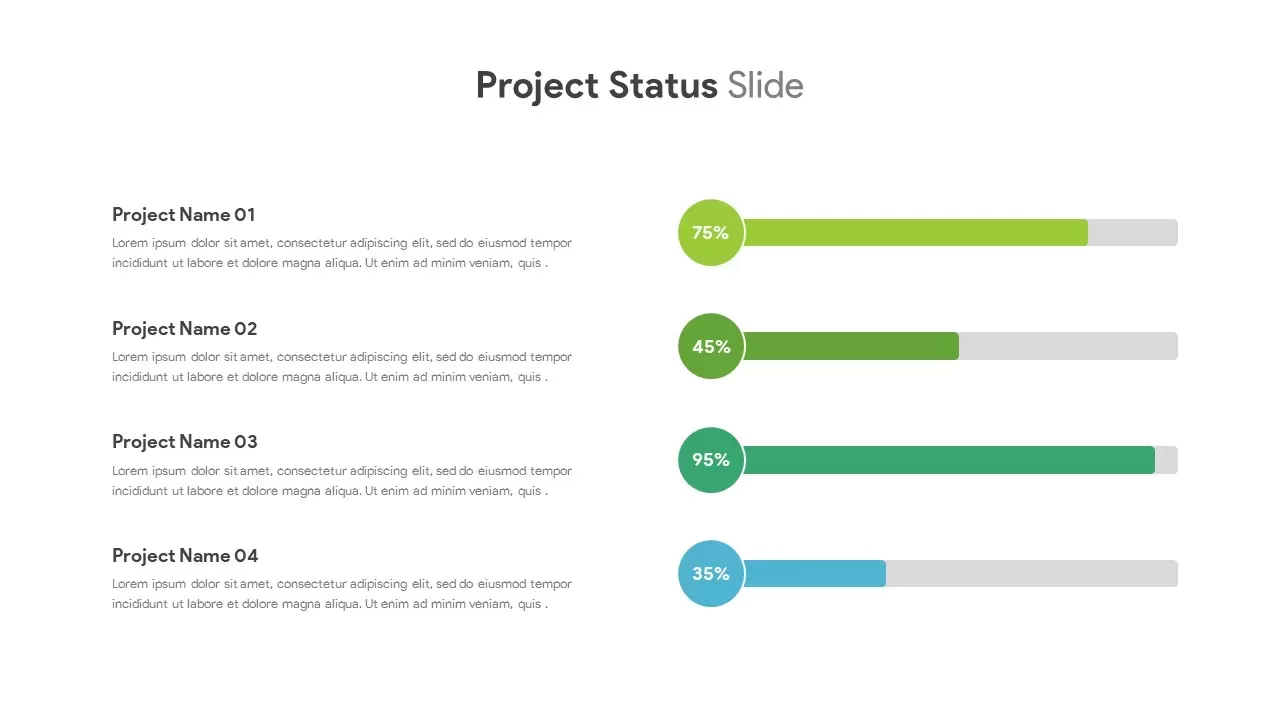
Project Status
Project Timeline Gantt Chart Template for PowerPoint & Google Slides
Gantt Chart
Project Execution Gantt Timeline Template for PowerPoint & Google Slides
Gantt Chart
Project Gantt Chart template for PowerPoint & Google Slides
Gantt Chart
Project Gantt Chart Template for PowerPoint & Google Slides
Gantt Chart
Project Gantt Chart Template for PowerPoint & Google Slides
Gantt Chart
Colorful Annual Gantt Chart Project Planner Template for PowerPoint & Google Slides
Gantt Chart
Creative Dynamic Gantt Chart Timeline Template for PowerPoint & Google Slides
Timeline

Fully Editable Gantt Chart Timeline template for PowerPoint & Google Slides
Gantt Chart

Product Roadmap Gantt Chart Timeline template for PowerPoint & Google Slides
Gantt Chart
Overlapping Timeline Gantt Chart Diagram Template for PowerPoint & Google Slides
Timeline
Stacked Gantt Chart Timeline Slide Template for PowerPoint & Google Slides
Gantt Chart
7 Step 6 Month Gantt Chart Timeline Template for PowerPoint & Google Slides
Gantt Chart
Colorful Annual Gantt Chart Timeline Template for PowerPoint & Google Slides
Gantt Chart
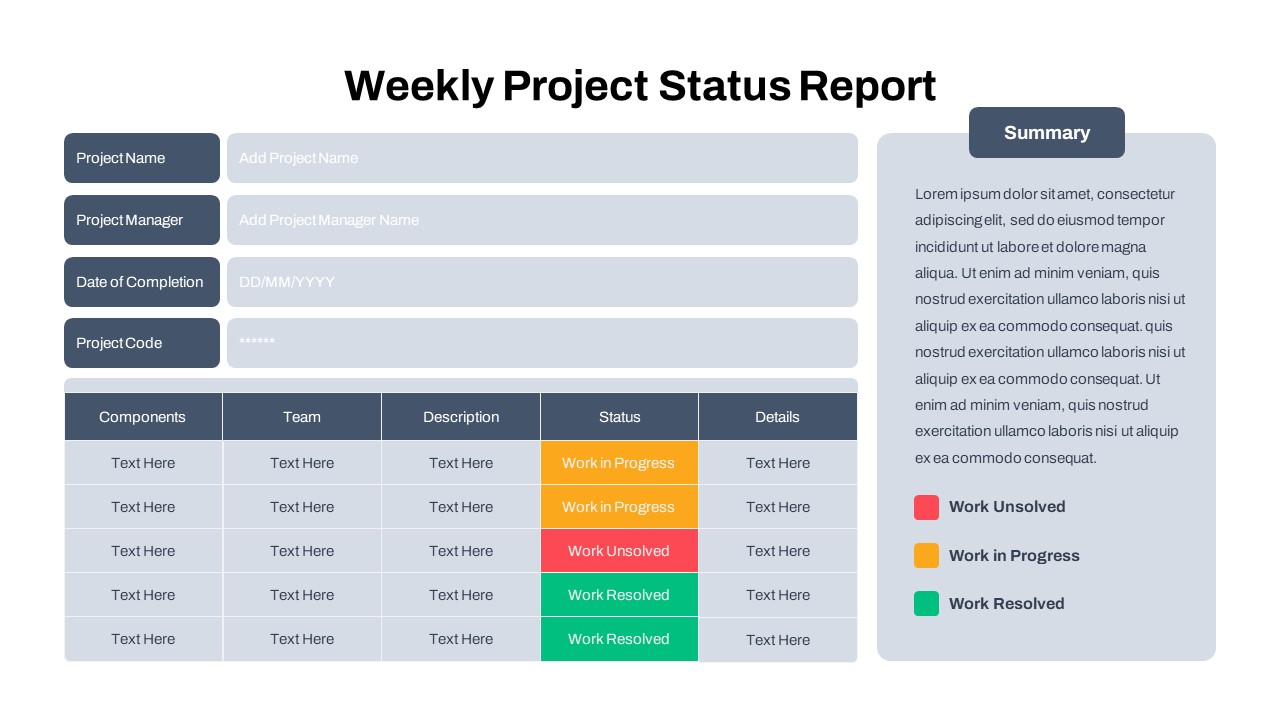
Weekly Project Status Dashboard Template for PowerPoint & Google Slides
Project Status
Free Simple Weekly Project Status Report Template for PowerPoint & Google Slides
Project Status
Free
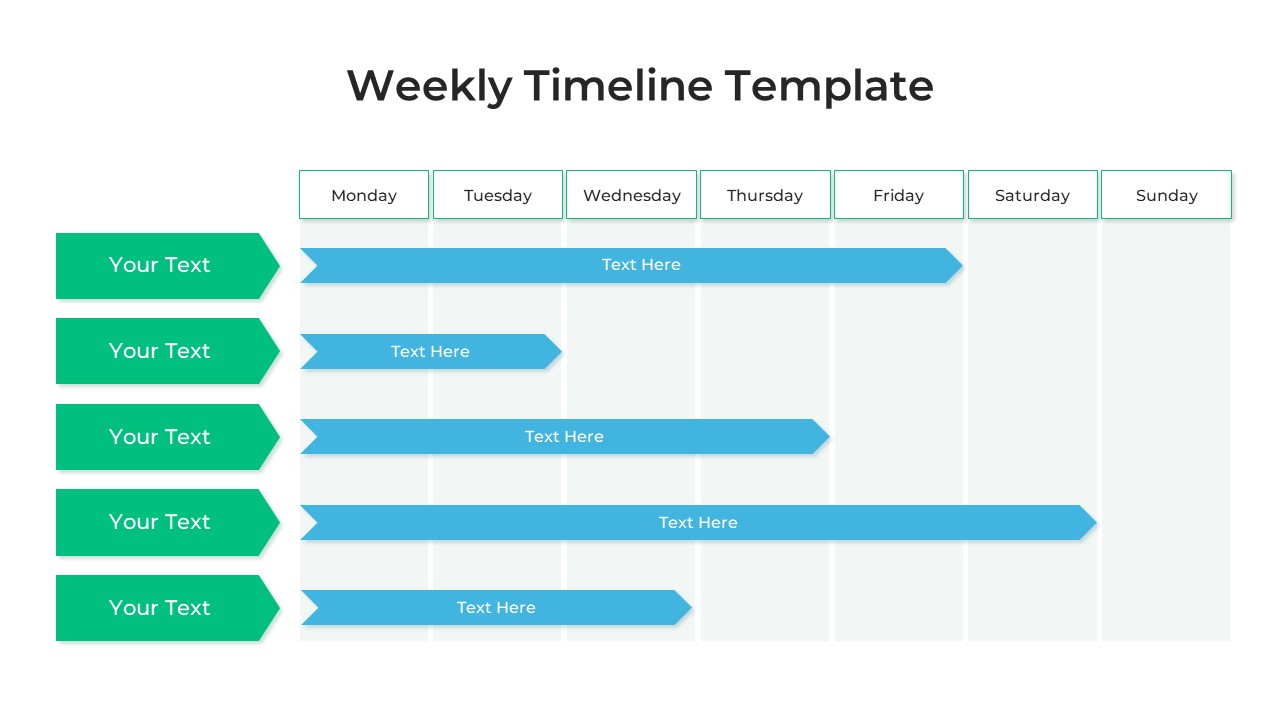
Weekly Planner Five-Row Timeline Template for PowerPoint & Google Slides
Timeline
Weekly Data Chart Slide for PowerPoint & Google Slides
Comparison Chart
Free Professional Gantt Chart Pack – 4 Slides Template for PowerPoint & Google Slides
Gantt Chart
Free
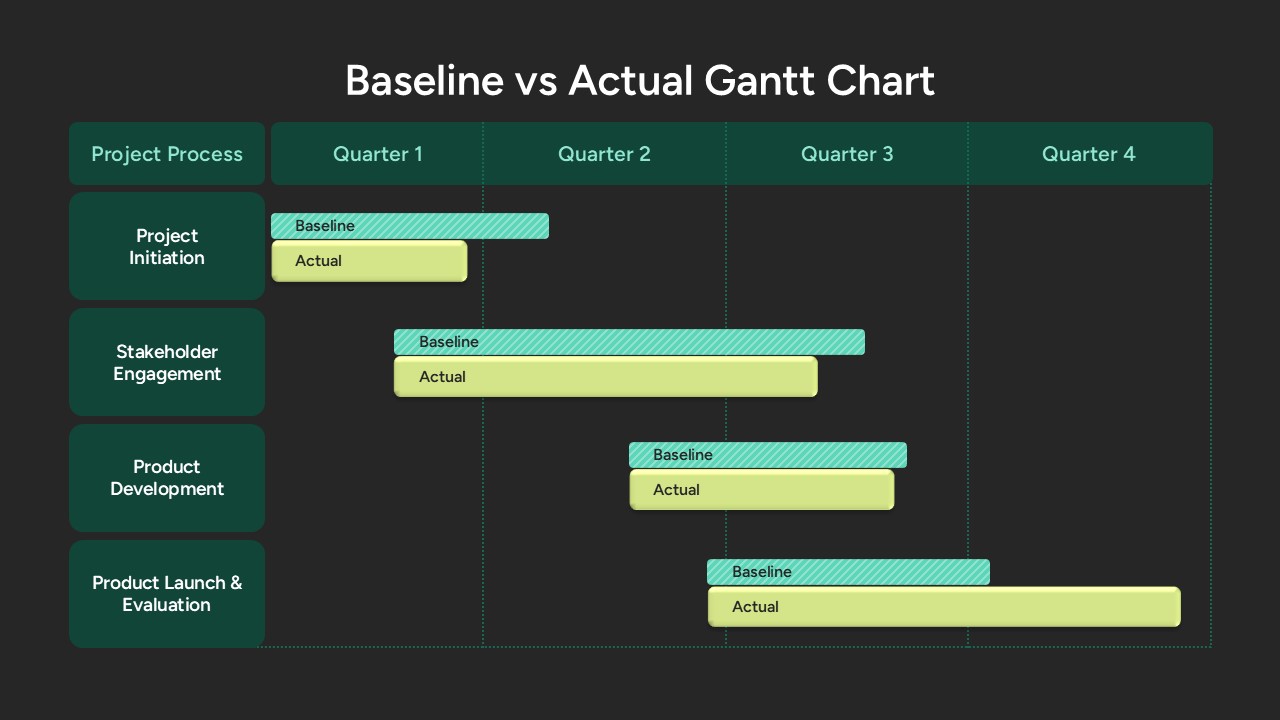
Baseline vs Actual Gantt Chart Template for PowerPoint & Google Slides
Gantt Chart
Event Planning Gantt Chart template for PowerPoint & Google Slides
Business
Color-Coded Gantt Chart template for PowerPoint & Google Slides
Business
Team Gantt Chart Overview template for PowerPoint & Google Slides
Project Status
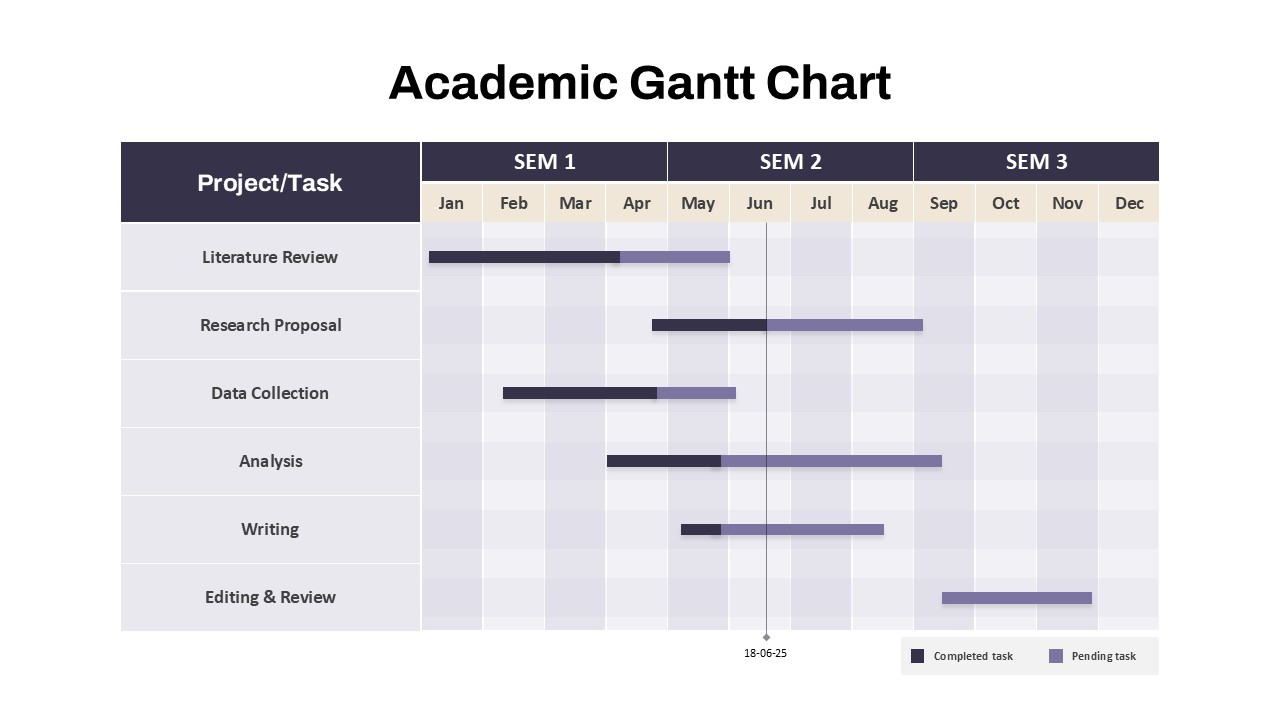
Academic Gantt Chart template for PowerPoint & Google Slides
Business
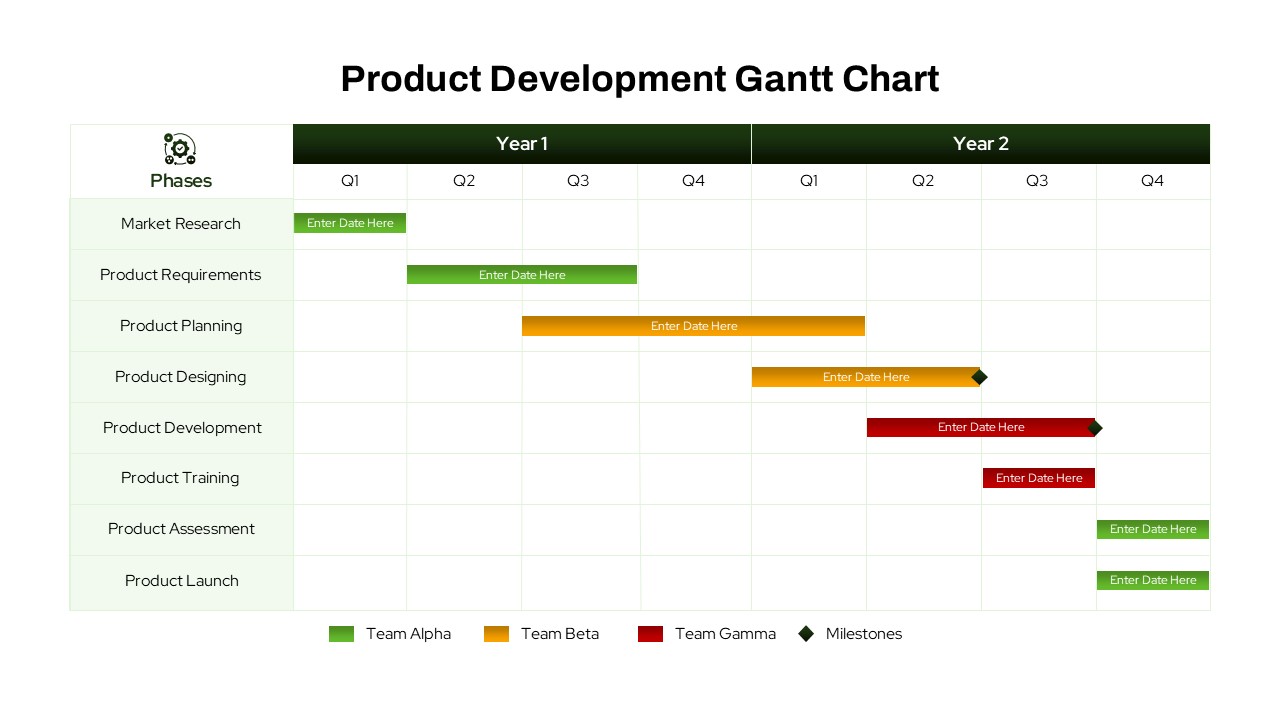
Product Development Gantt Chart template for PowerPoint & Google Slides
Gantt Chart
Static Gantt Chart Overview template for PowerPoint & Google Slides
Project Status
Bar Gantt Chart Template for PowerPoint & Google Slides
Gantt Chart
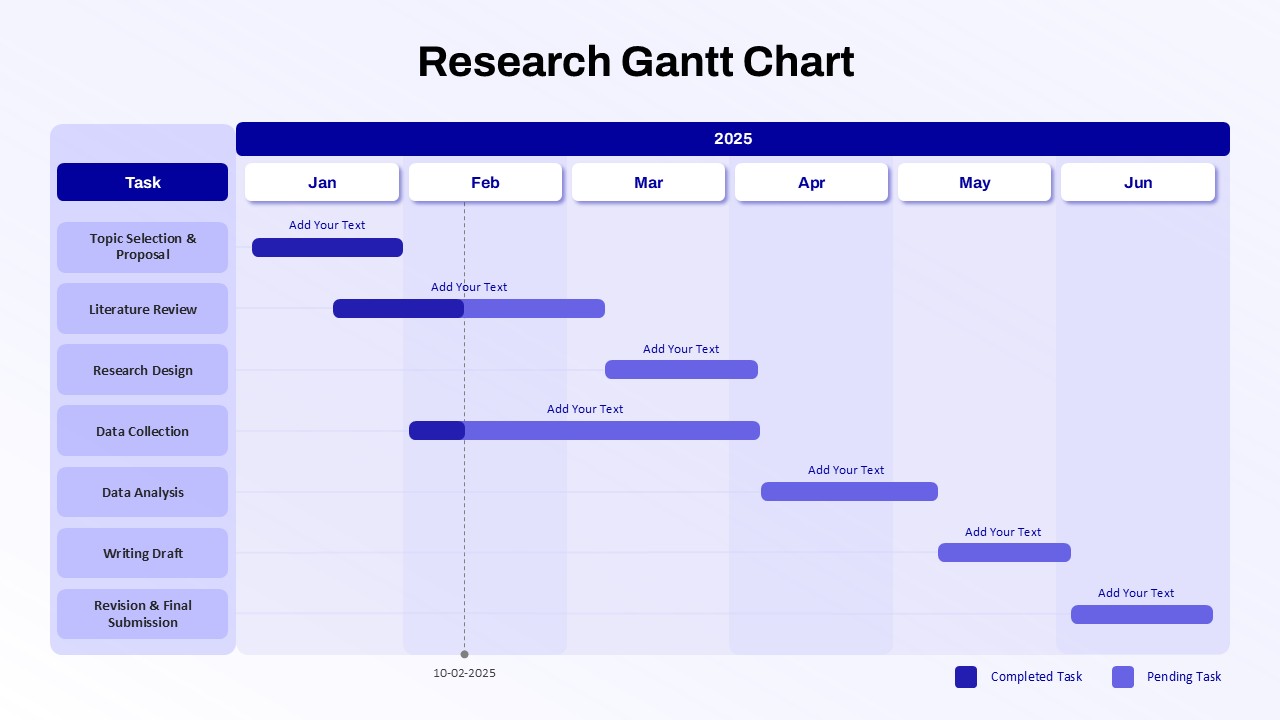
Research Gantt Chart template for PowerPoint & Google Slides
Project
Green Gantt Chart Template for PowerPoint & Google Slides
Gantt Chart
Yearly Gantt Chart with Presentation Template for PowerPoint & Google Slides
Gantt Chart
Quarterly Gantt Chart with Today Marker Template for PowerPoint & Google Slides
Gantt Chart
Half Year Gantt Chart Templat for PowerPoint & Google Slides
Gantt Chart
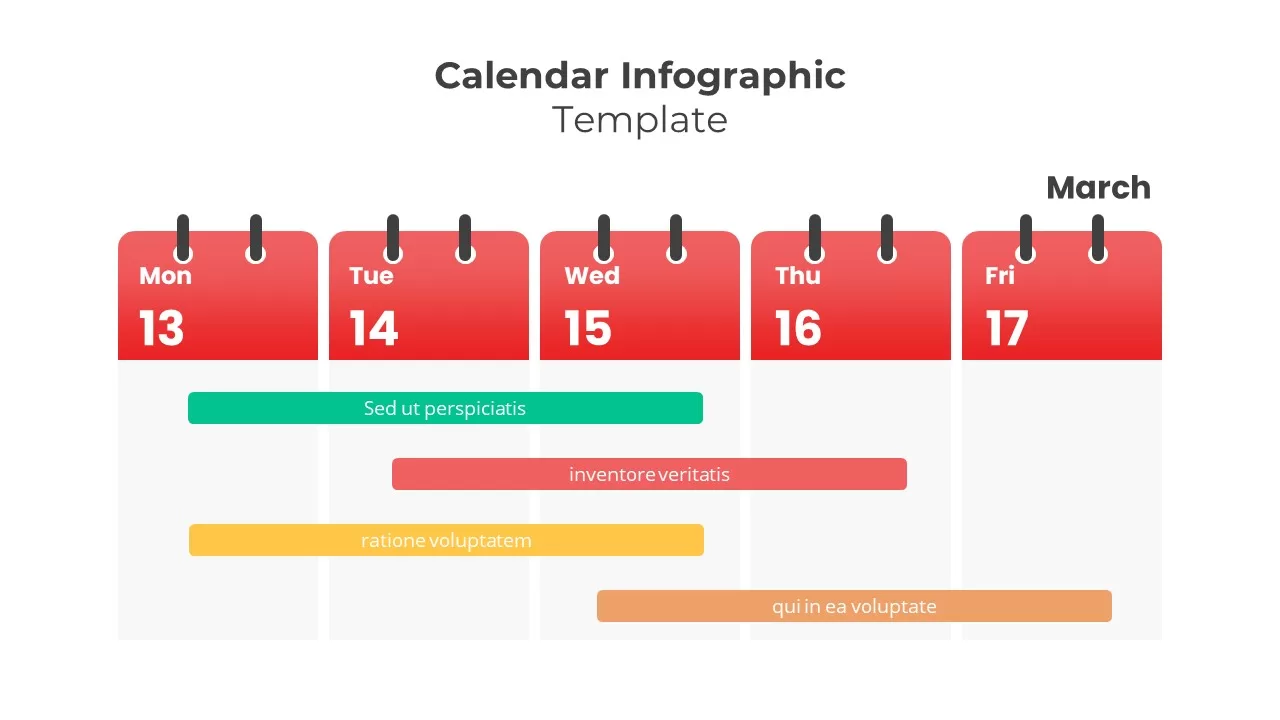
Weekly Five-Day Calendar Infographic Template for PowerPoint & Google Slides
Timeline
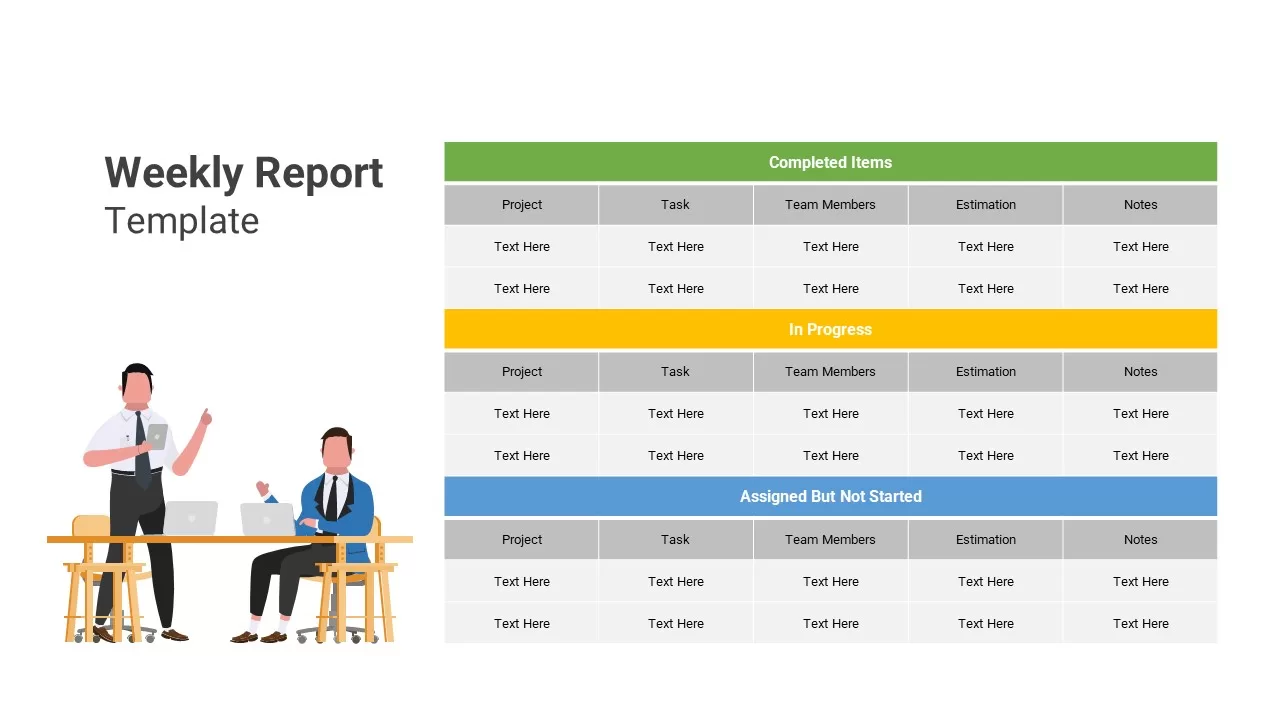
Weekly Report template for PowerPoint & Google Slides
Infographics
Weekly Update Schedule Dashboard Template for PowerPoint & Google Slides
Agenda
Weekly Status Report Dashboard Template for PowerPoint & Google Slides
HR
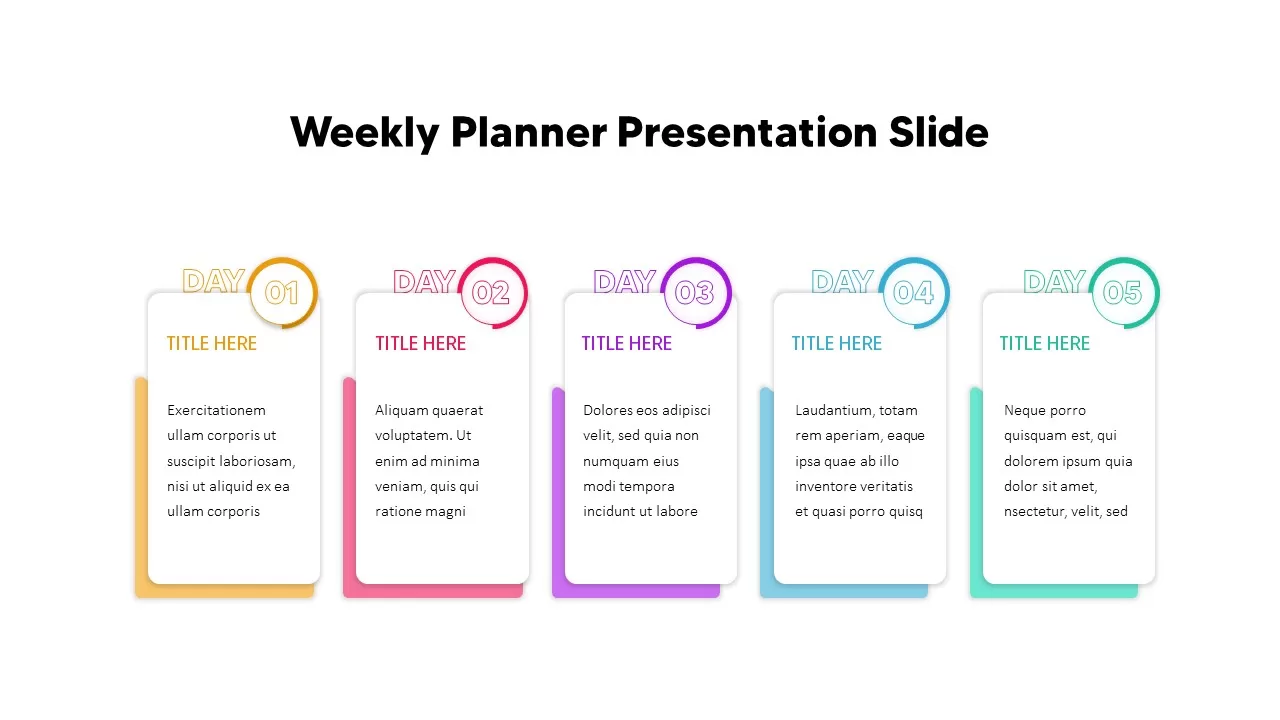
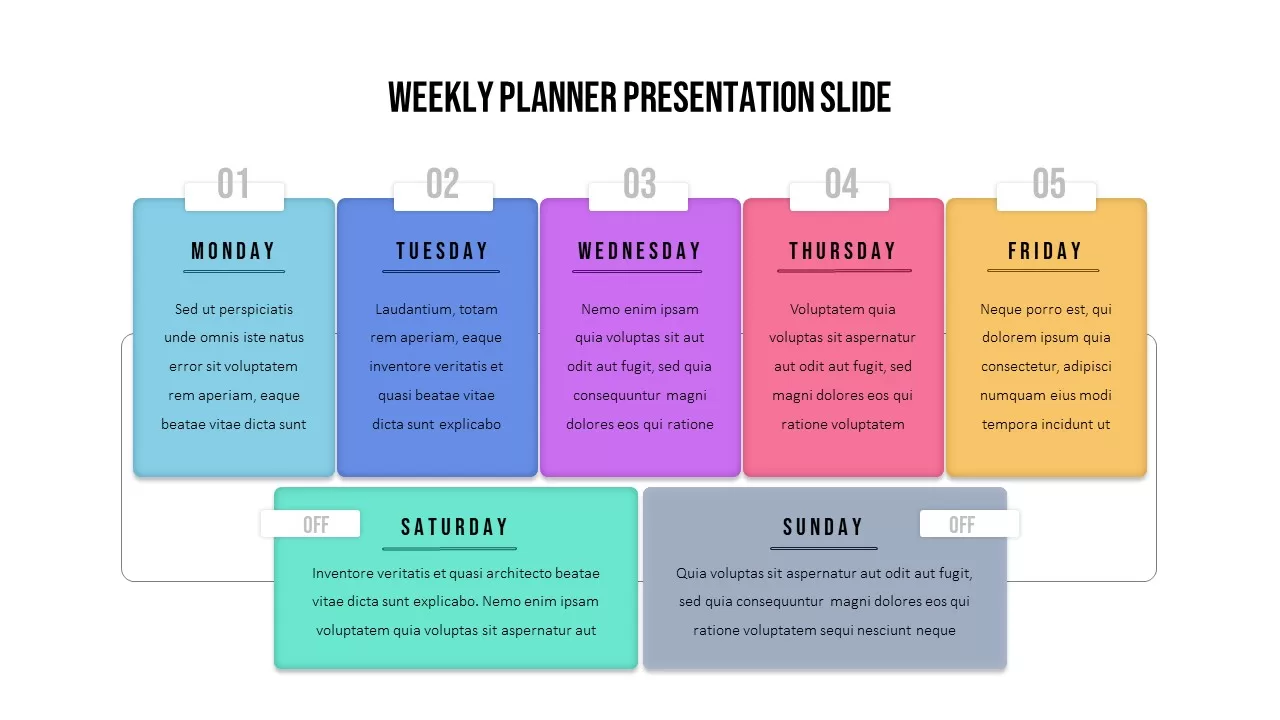
Weekly Planner Presentation Slide Template for PowerPoint & Google Slides
Infographics
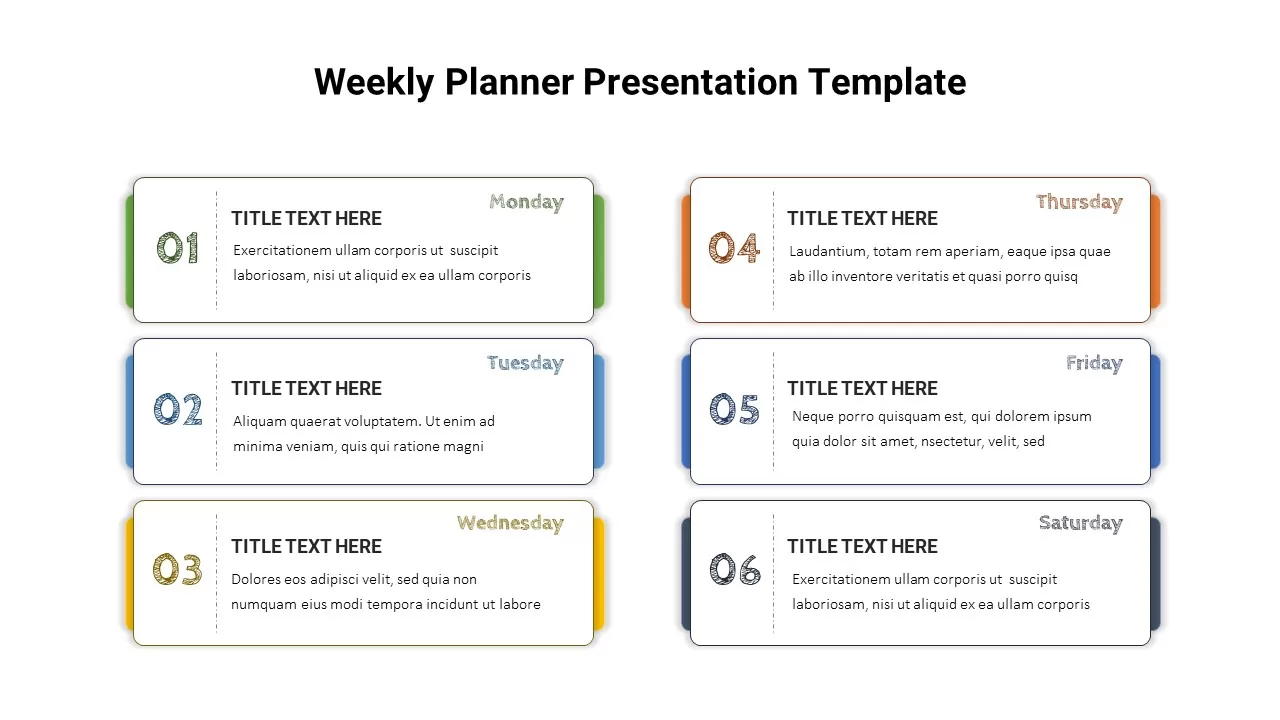
Six-Day Weekly Planner Layout Template for PowerPoint & Google Slides
Infographics
Weekly Planner Presentation Slide Template for PowerPoint & Google Slides
Agenda
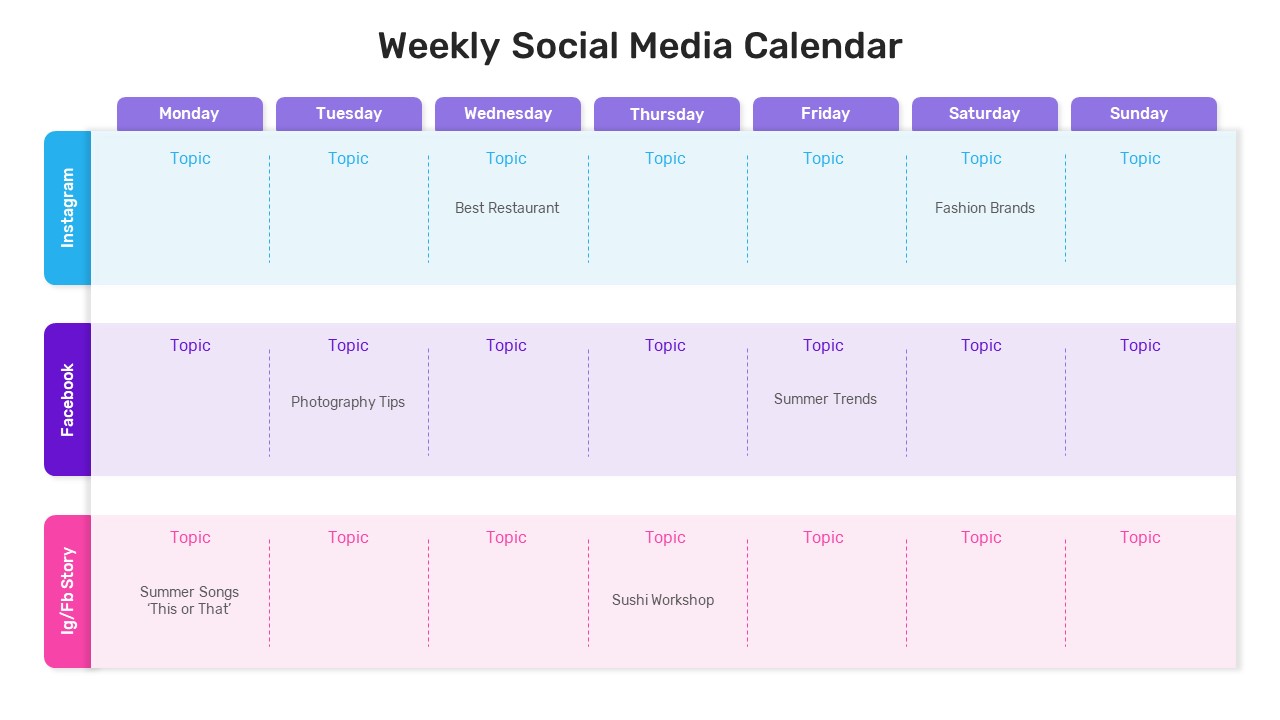
Weekly Social Media Calendar Editable Template for PowerPoint & Google Slides
Digital Marketing
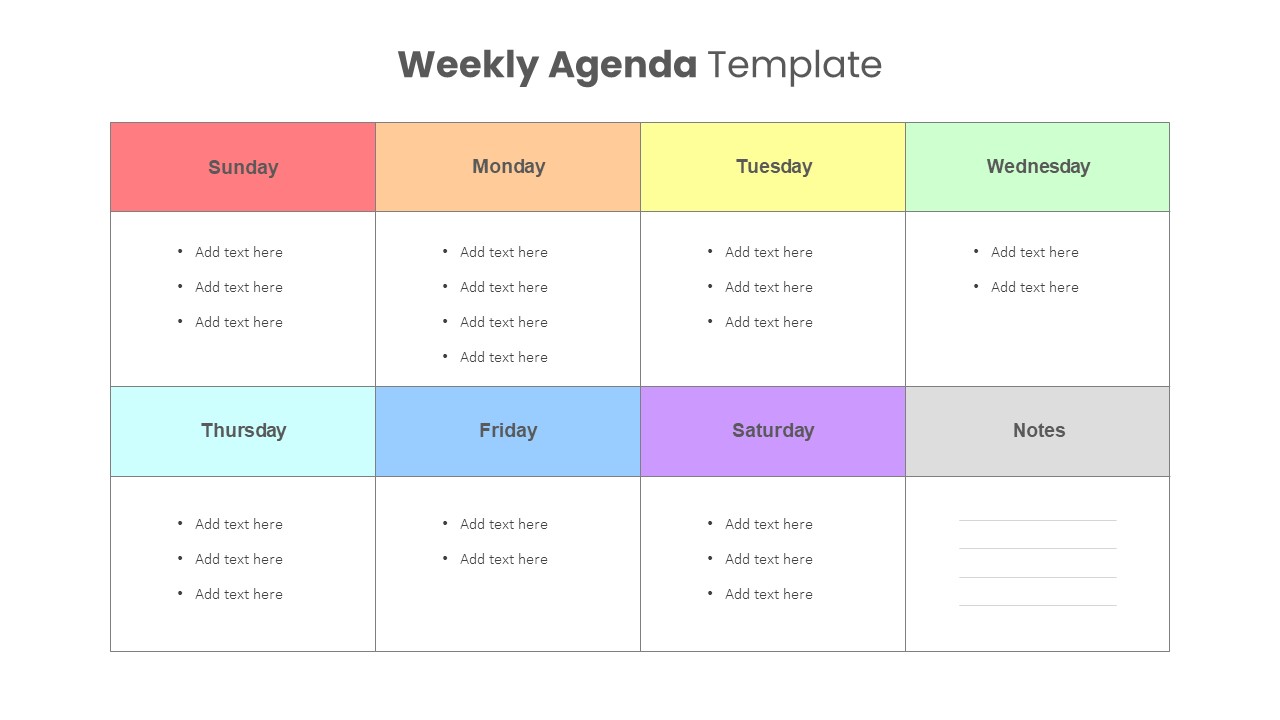
Versatile Weekly Agenda Planner Template for PowerPoint & Google Slides
Agenda
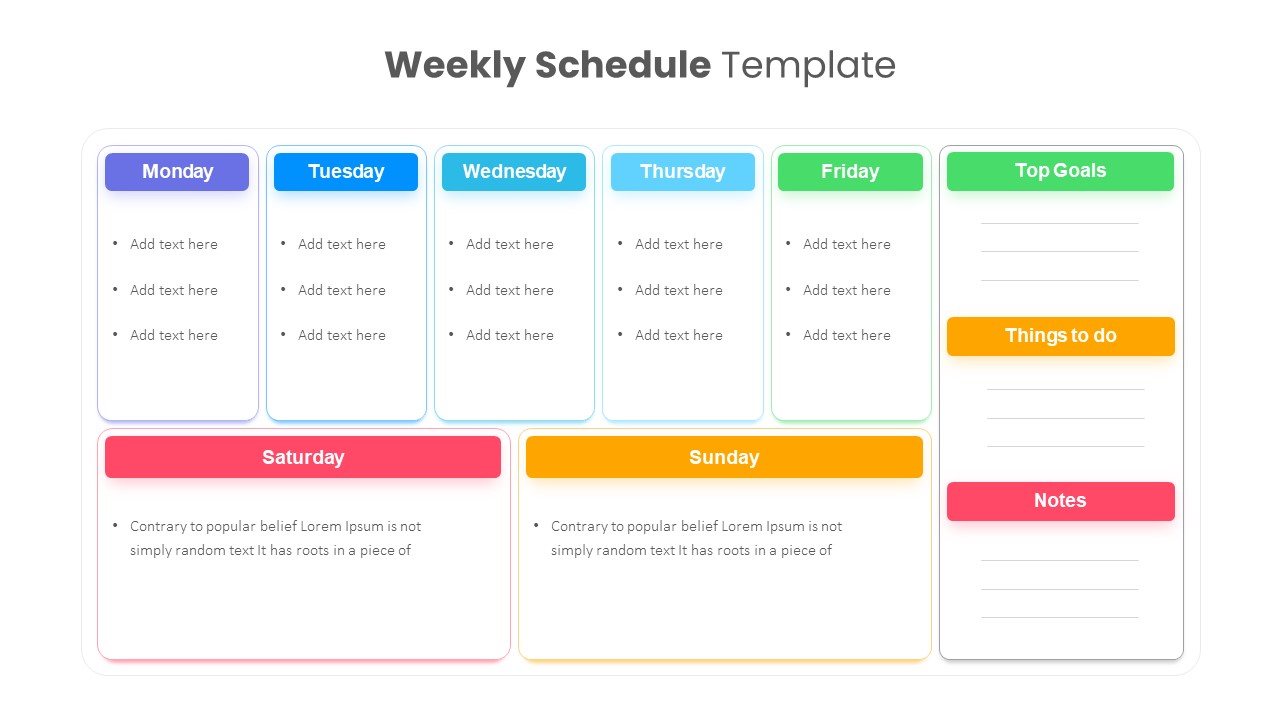
Colorful Weekly Schedule Slide Deck Template for PowerPoint & Google Slides
Agenda
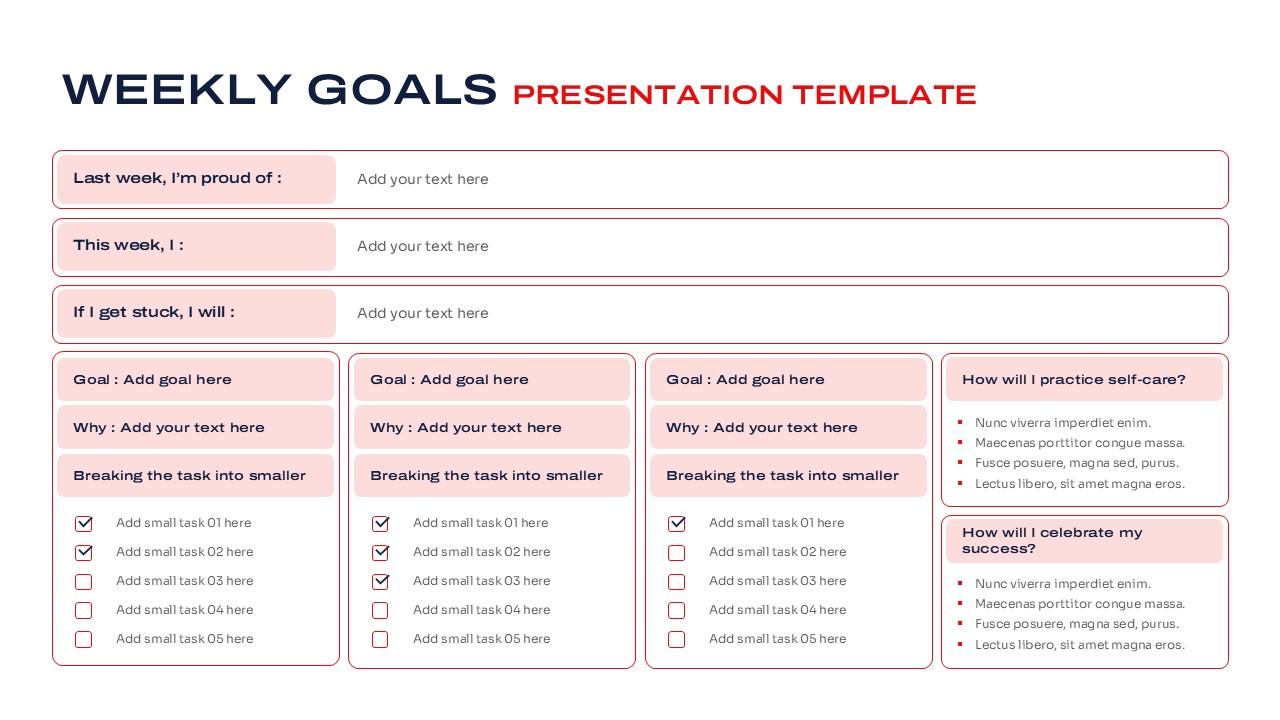
Weekly Goals Planning and Productivity Overview Template for PowerPoint & Google Slides
Goals
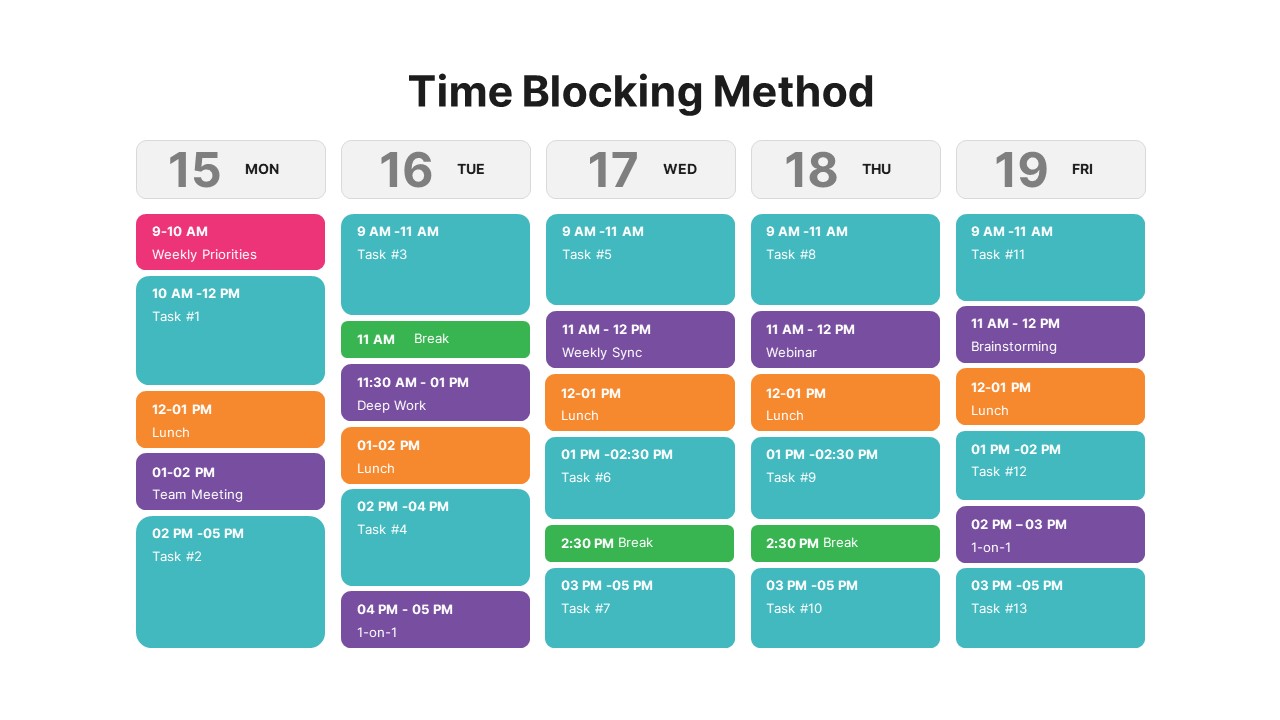
Time Blocking Method Weekly Schedule for PowerPoint & Google Slides
Project Status
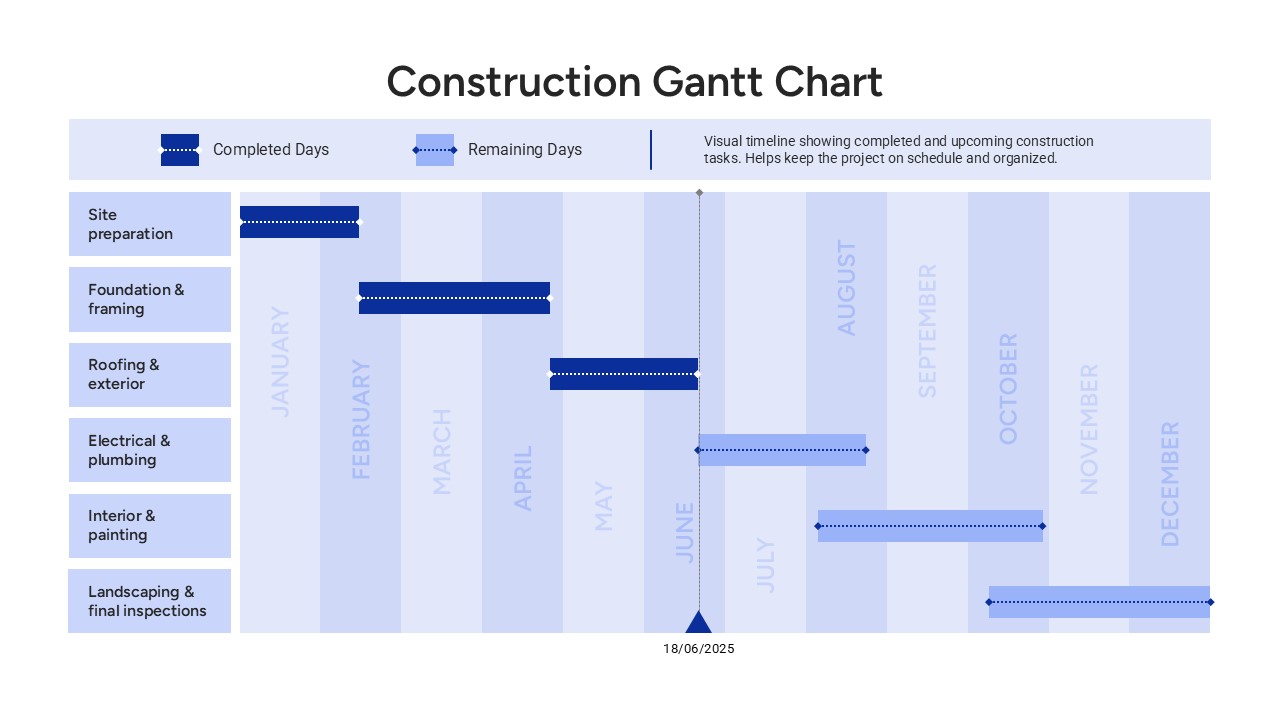
Construction Gantt Chart Template
Gantt Chart
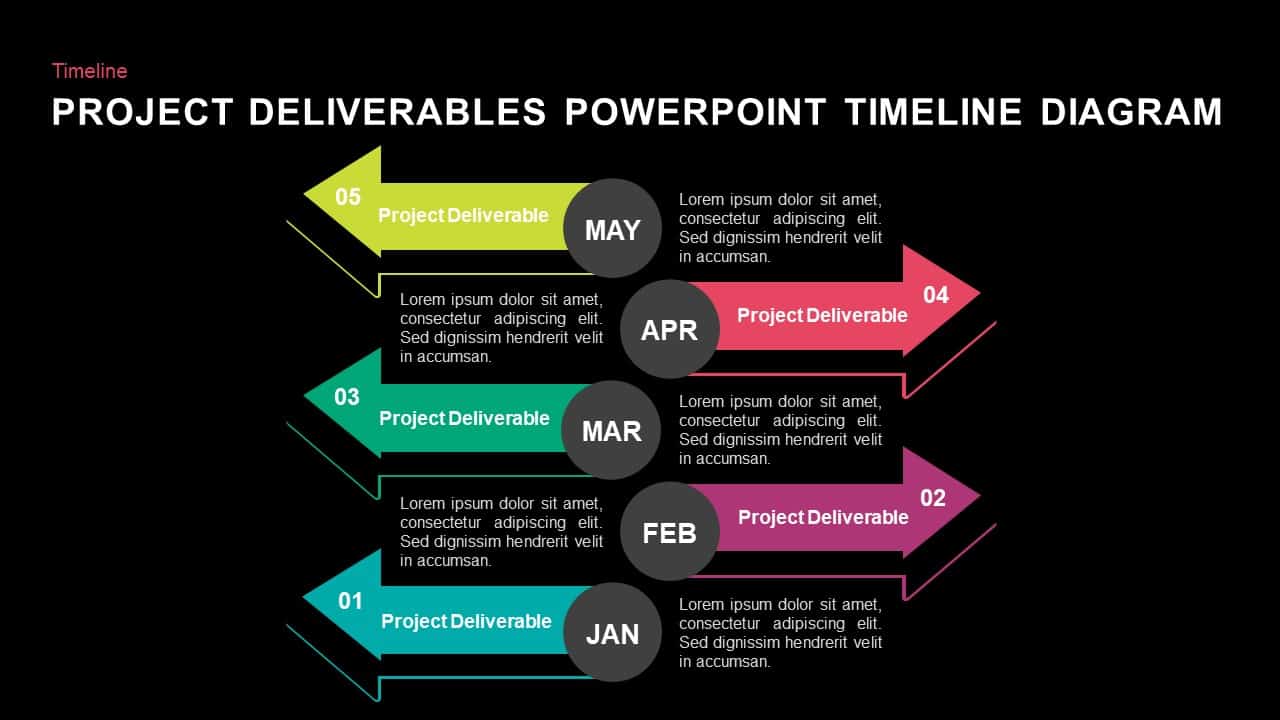
Project Deliverables Timeline Template for PowerPoint & Google Slides
Timeline
Project Timeline Management template for PowerPoint & Google Slides
Infographics
Animated Parallel Timeline Project template for PowerPoint & Google Slides
Infographics
Project Update & Timeline Infographic Template for PowerPoint & Google Slides
Business
Horizontal Timeline Project Status Template for PowerPoint & Google Slides
Project Status
Calendar Migration Project Timeline Template for PowerPoint & Google Slides
Timeline
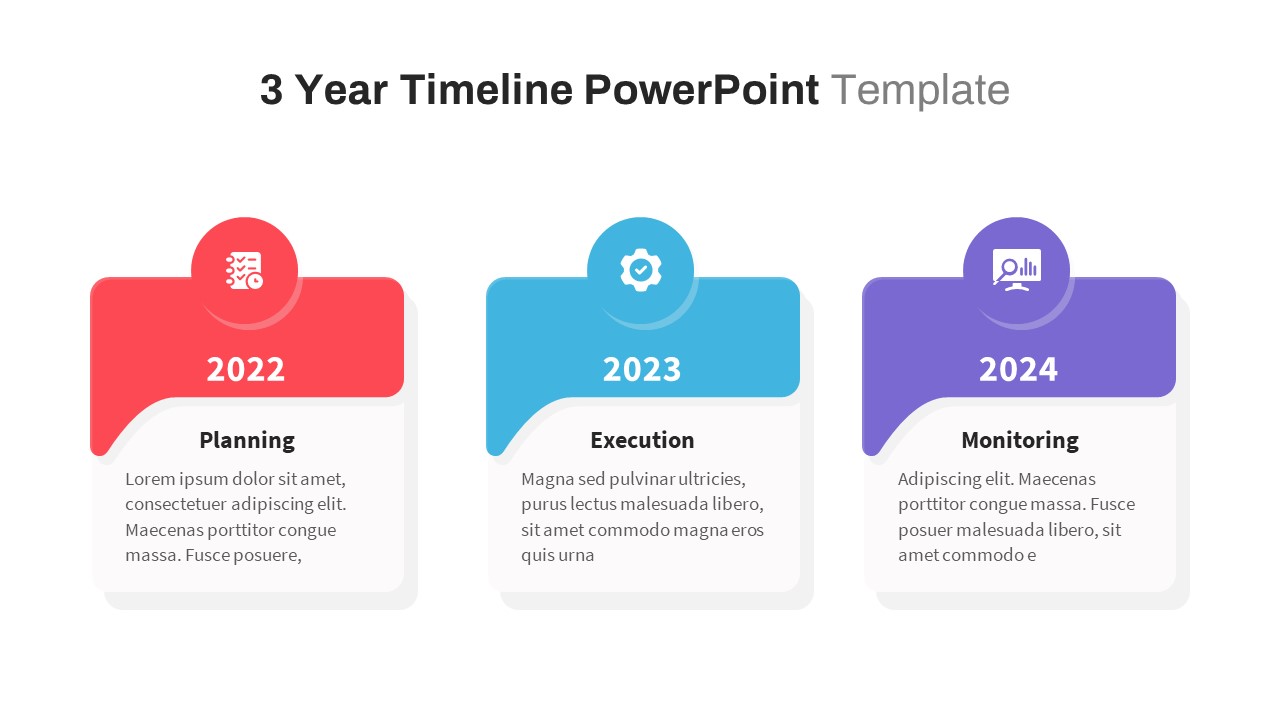
Three-Year Project Roadmap Timeline Template for PowerPoint & Google Slides
Timeline
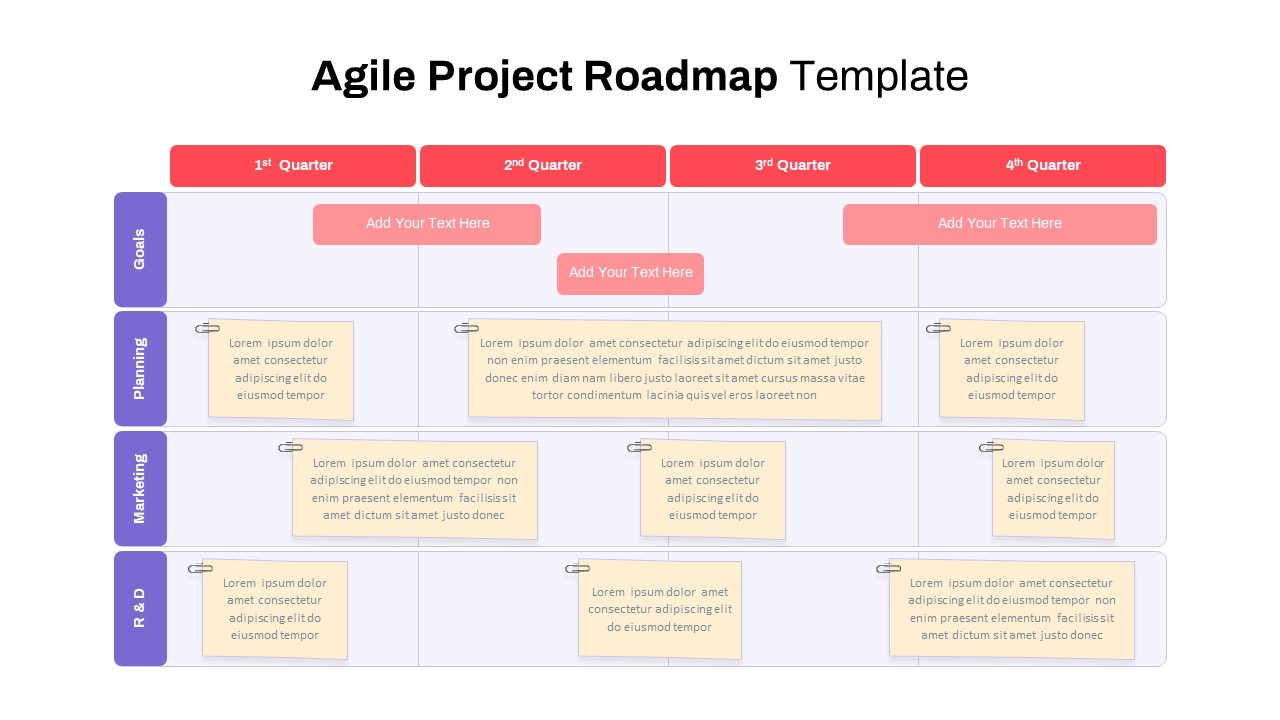
Agile Project Roadmap Timeline Template Pack for PowerPoint & Google Slides
Scrum
Project Comparison Timeline Roadmap Template for PowerPoint & Google Slides
Comparison
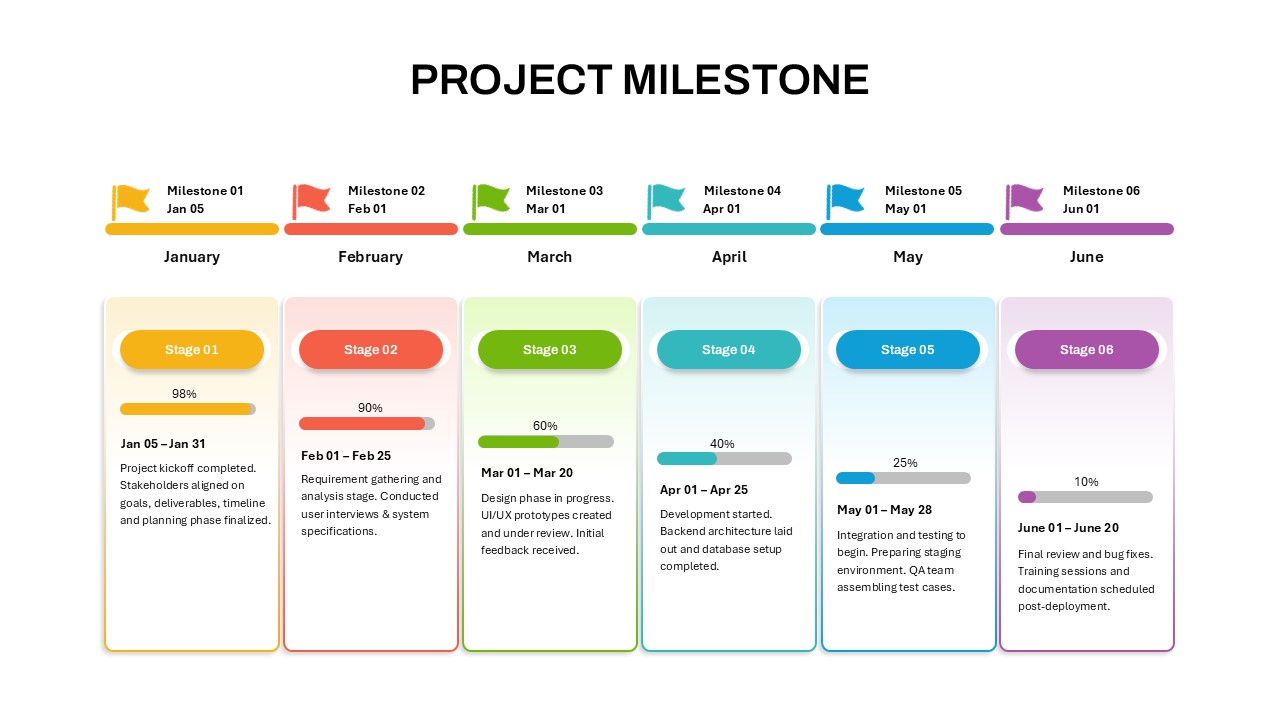
Project Milestone Timeline Infographic Template for PowerPoint & Google Slides
Timeline
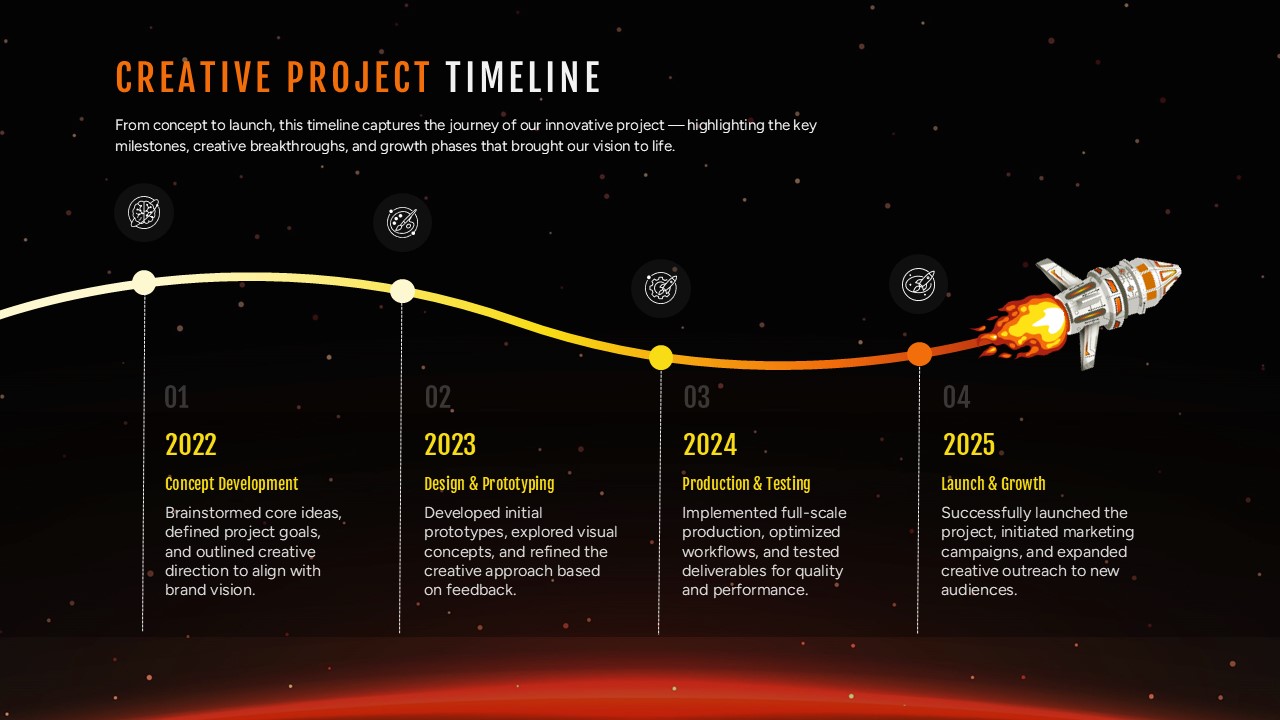
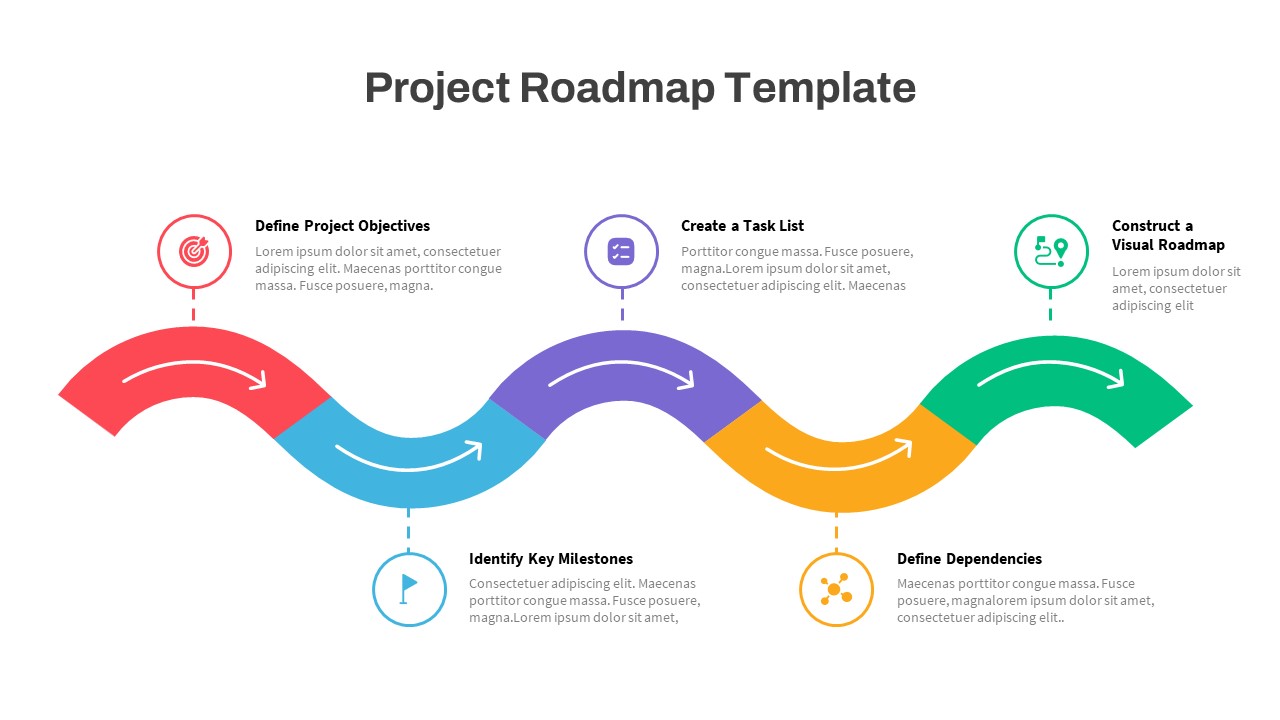
Creative Project Timeline Roadmap Template for PowerPoint & Google Slides
Timeline
Wavy Timeline Project Roadmap Slide for PowerPoint & Google Slides
Project Status
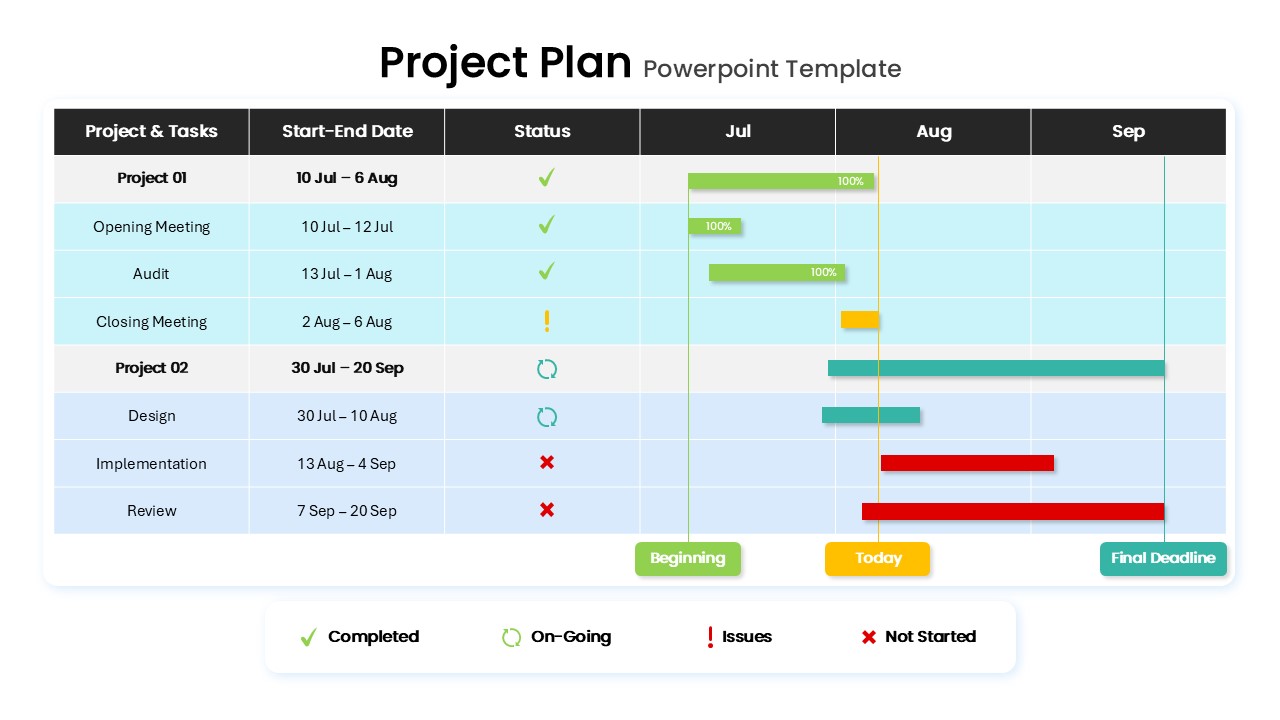
Project Plan Timeline for PowerPoint & Google Slides
Business Plan
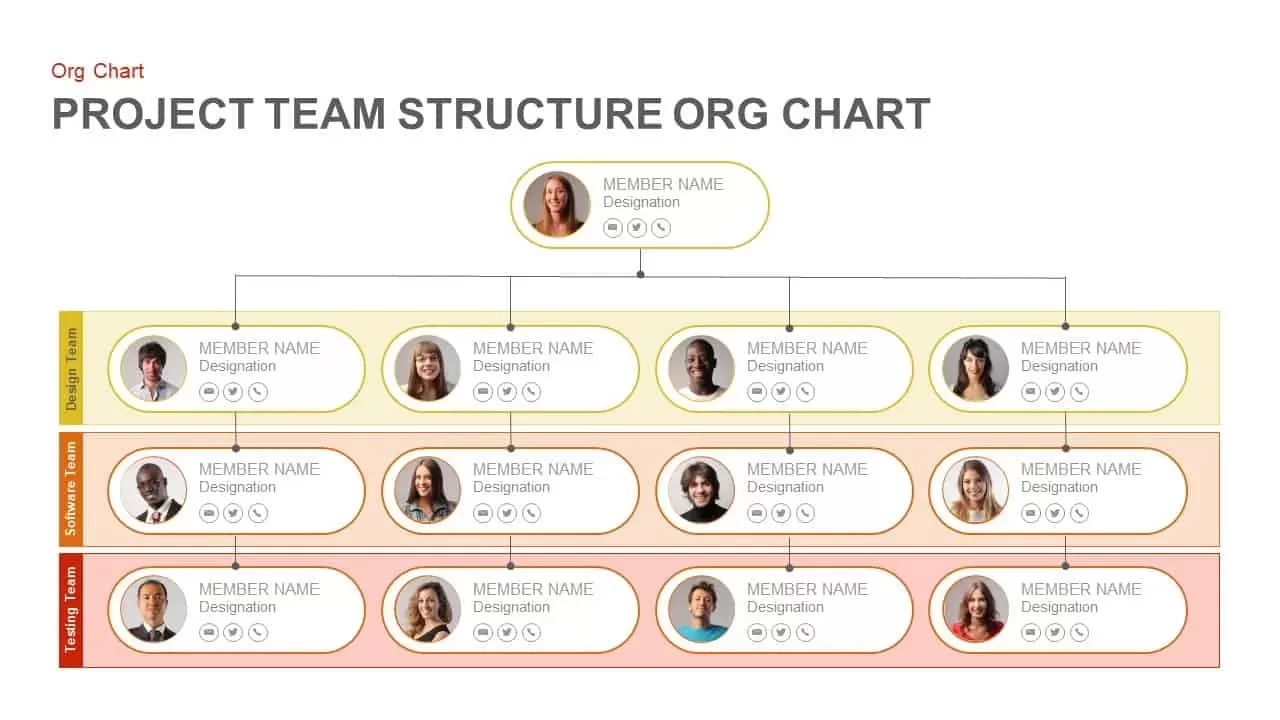
Project Team Structure Org Chart Template for PowerPoint & Google Slides
Org Chart
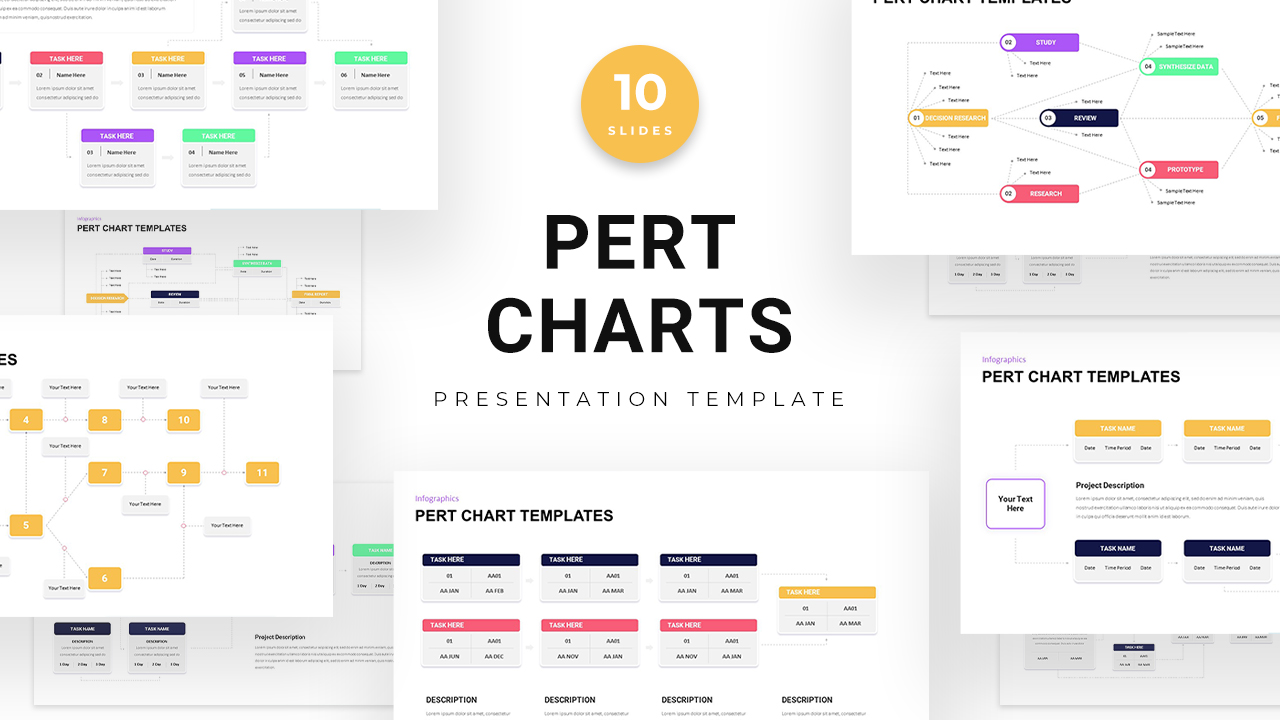
PERT Chart Project Management template for PowerPoint & Google Slides
Project Status
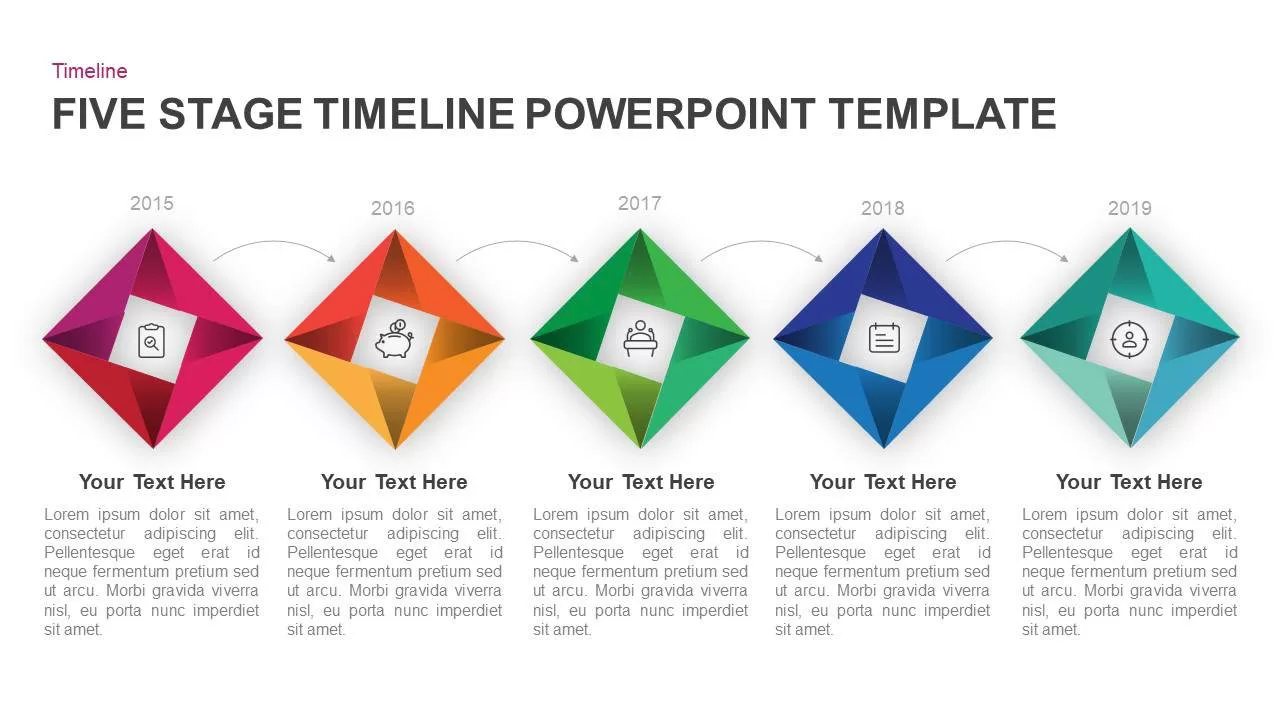
Five-Stage Diamond Timeline Chart Template for PowerPoint & Google Slides
Timeline
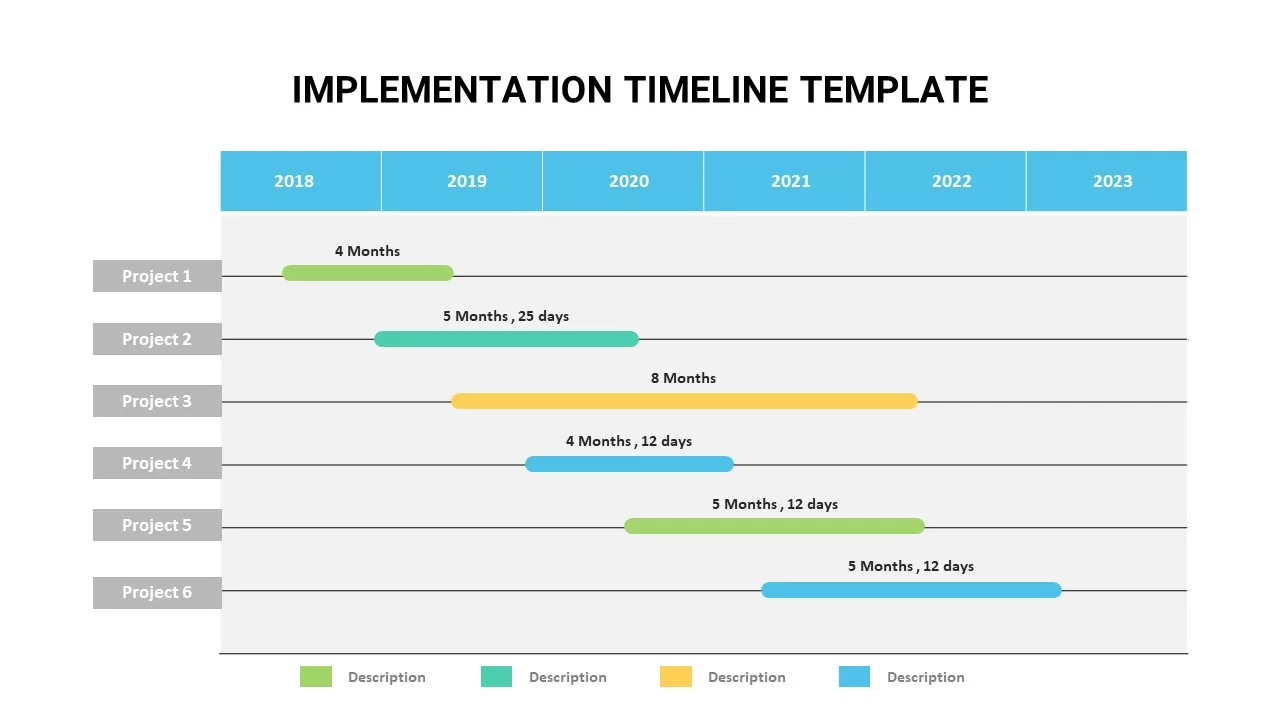
Animated Implementation Timeline Chart Template for PowerPoint & Google Slides
Timeline
Business Timeline Comparison Bar Chart Template for PowerPoint & Google Slides
Comparison Chart
Excel-Driven Gradient Timeline Chart Template for PowerPoint & Google Slides
Five-Phase Horizontal Timeline Chart Template for PowerPoint & Google Slides
Timeline
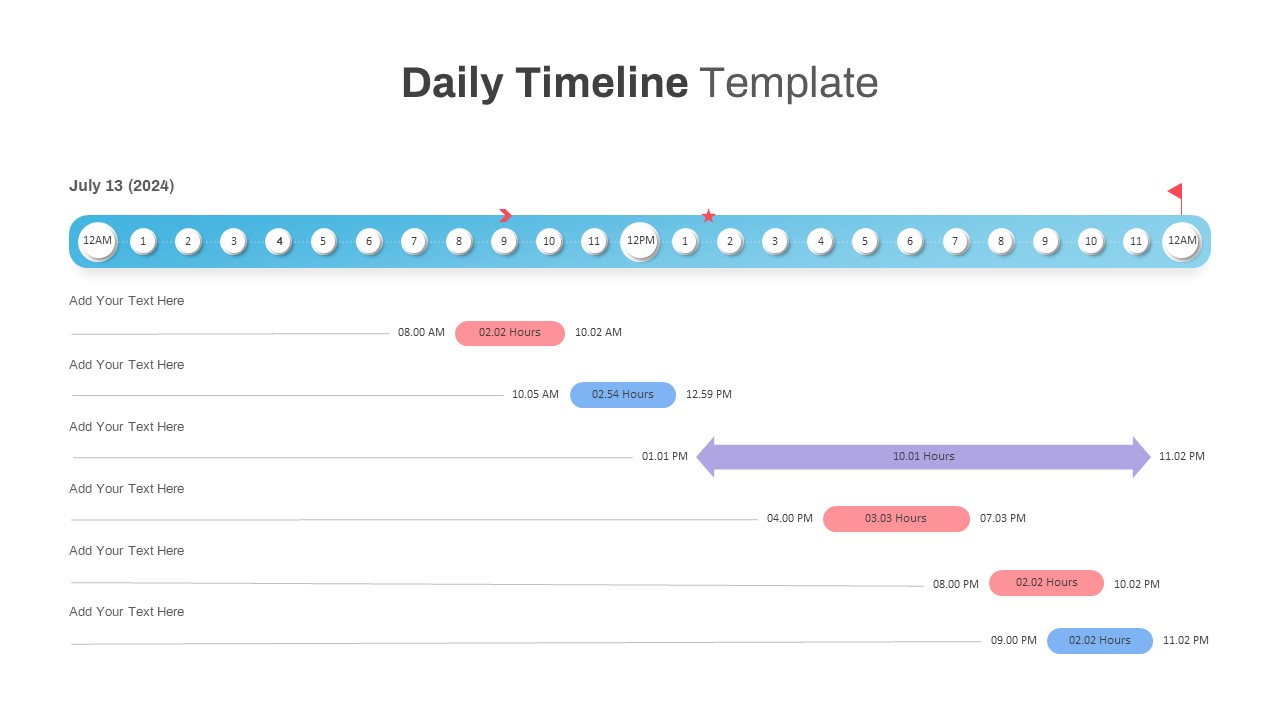
Interactive Daily Timeline Schedule Chart Template for PowerPoint & Google Slides
Timeline
Professional Milestone Timeline Chart Template for PowerPoint & Google Slides
Timeline
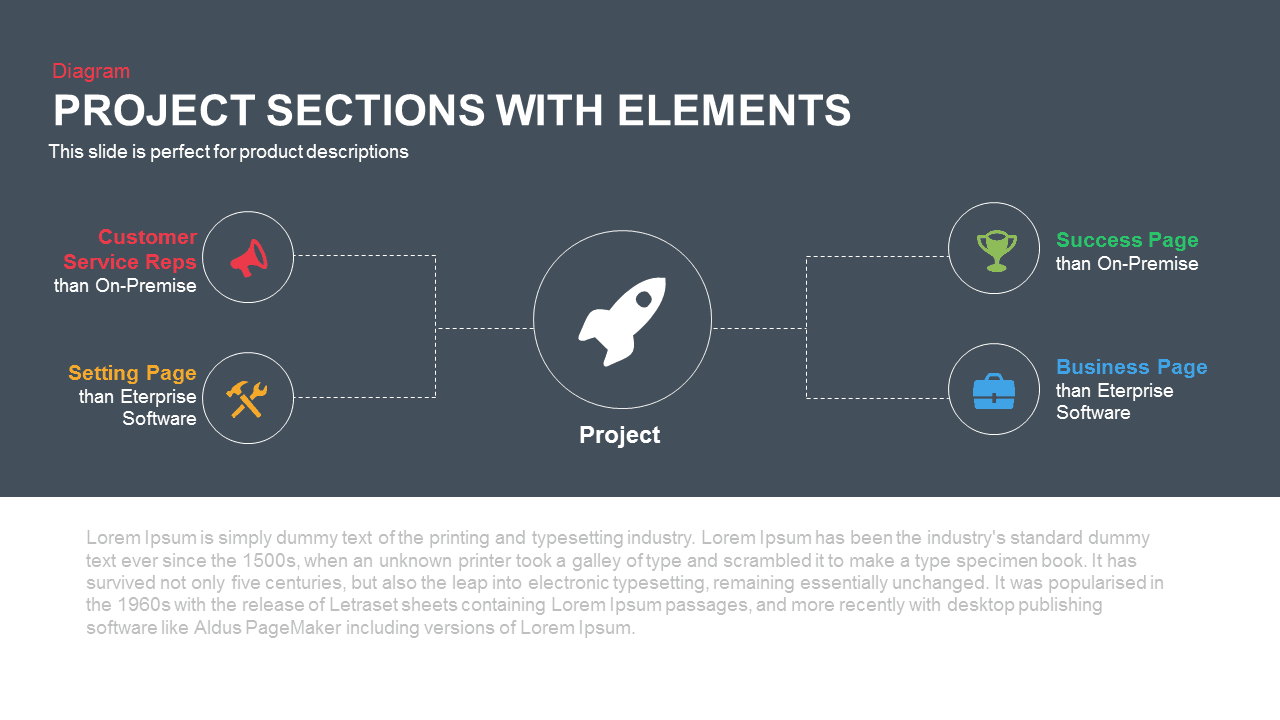
Project Sections Hub-and-Spoke Diagram template for PowerPoint & Google Slides
Flow Charts
Project Management Dashboard Template for PowerPoint & Google Slides
Project
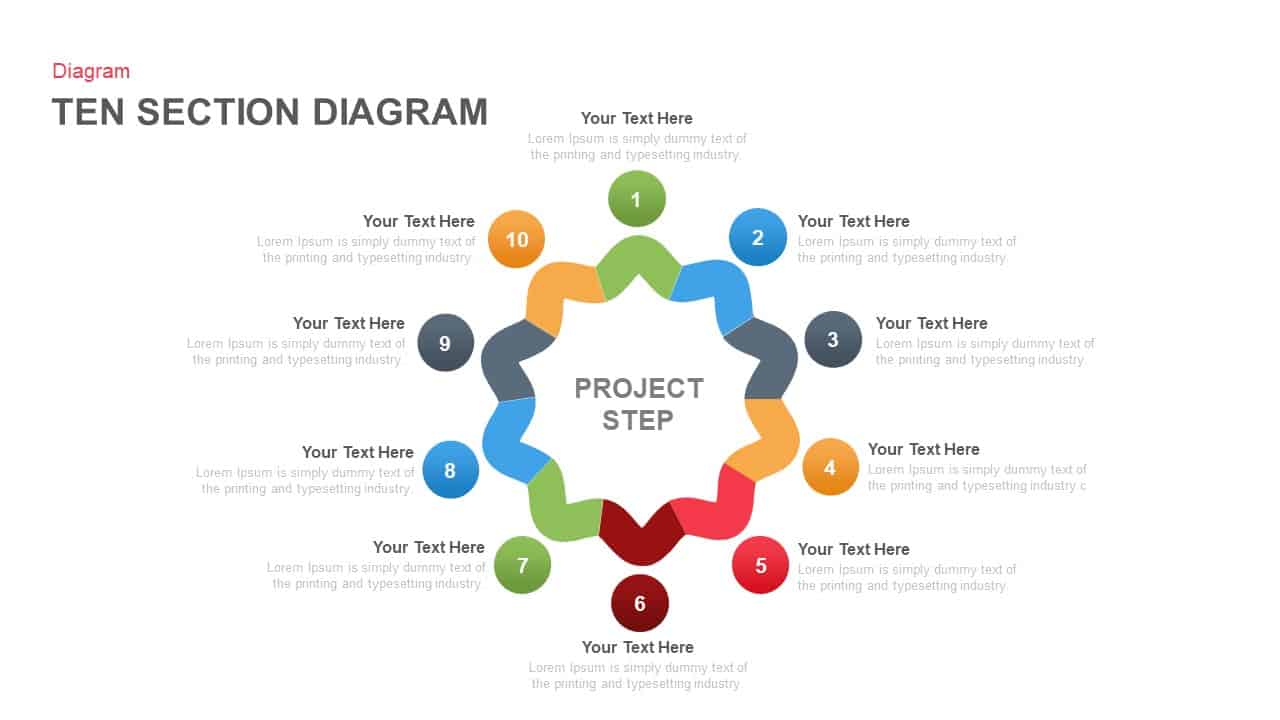
Ten-Section Project Steps Diagram Template for PowerPoint & Google Slides
Process
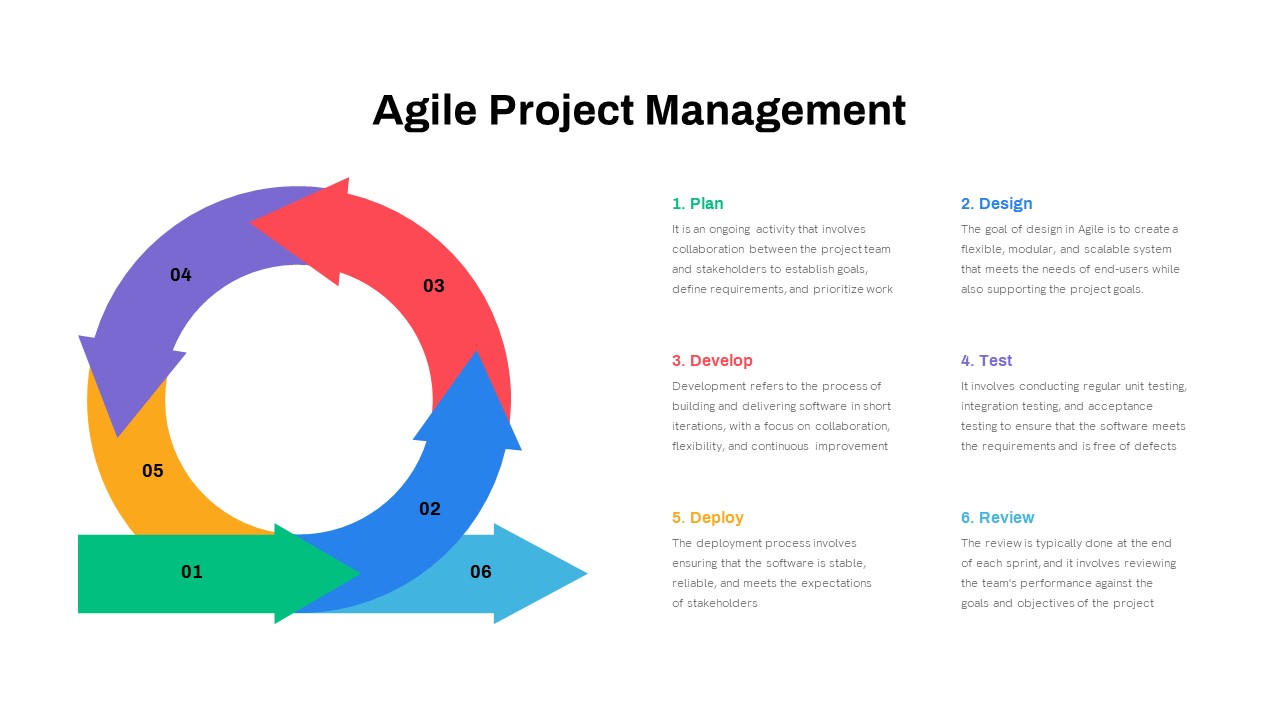
Comprehensive Agile Project Management Template for PowerPoint & Google Slides
Scrum

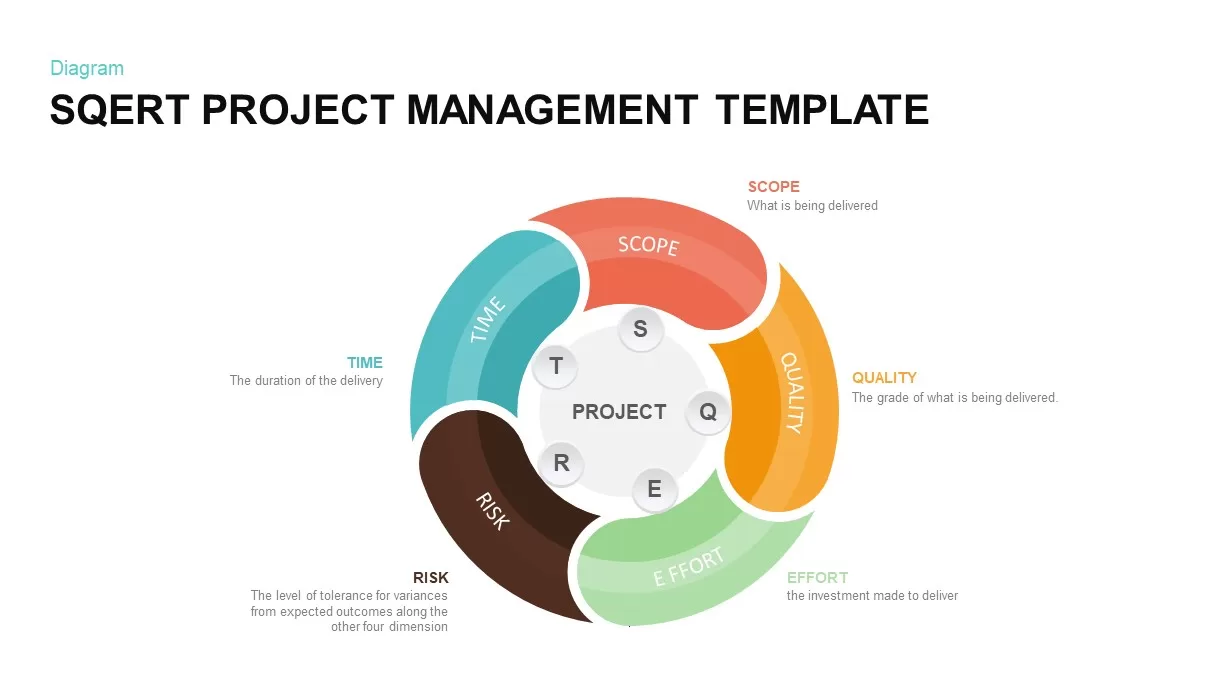
SQERT Project Management Infographic Template for PowerPoint & Google Slides
Process
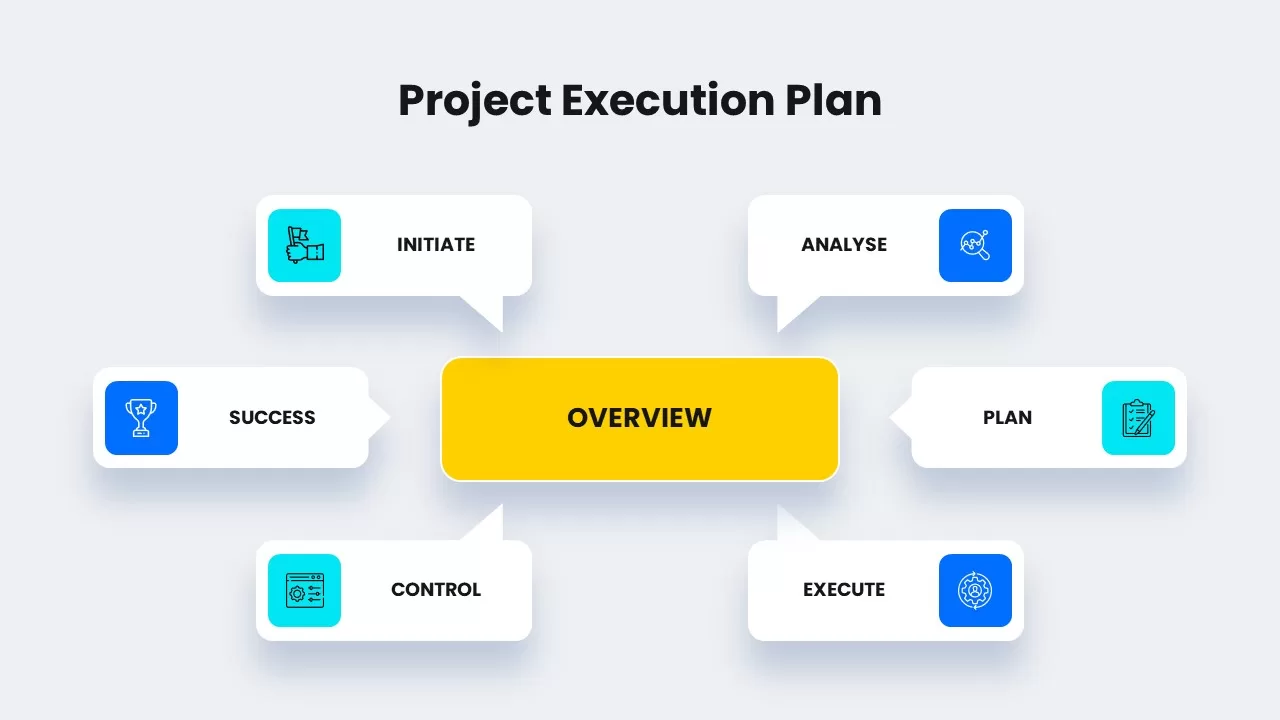
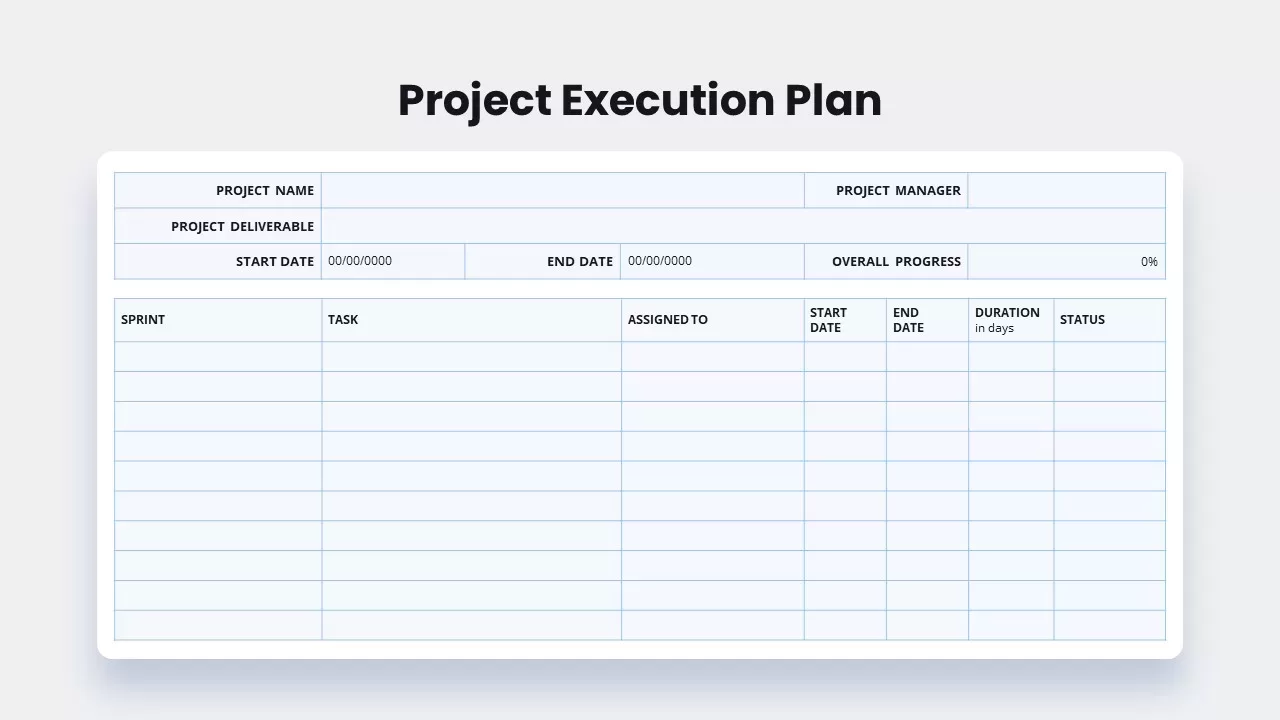
Project Execution Plan Overview Template for PowerPoint & Google Slides
Project Status
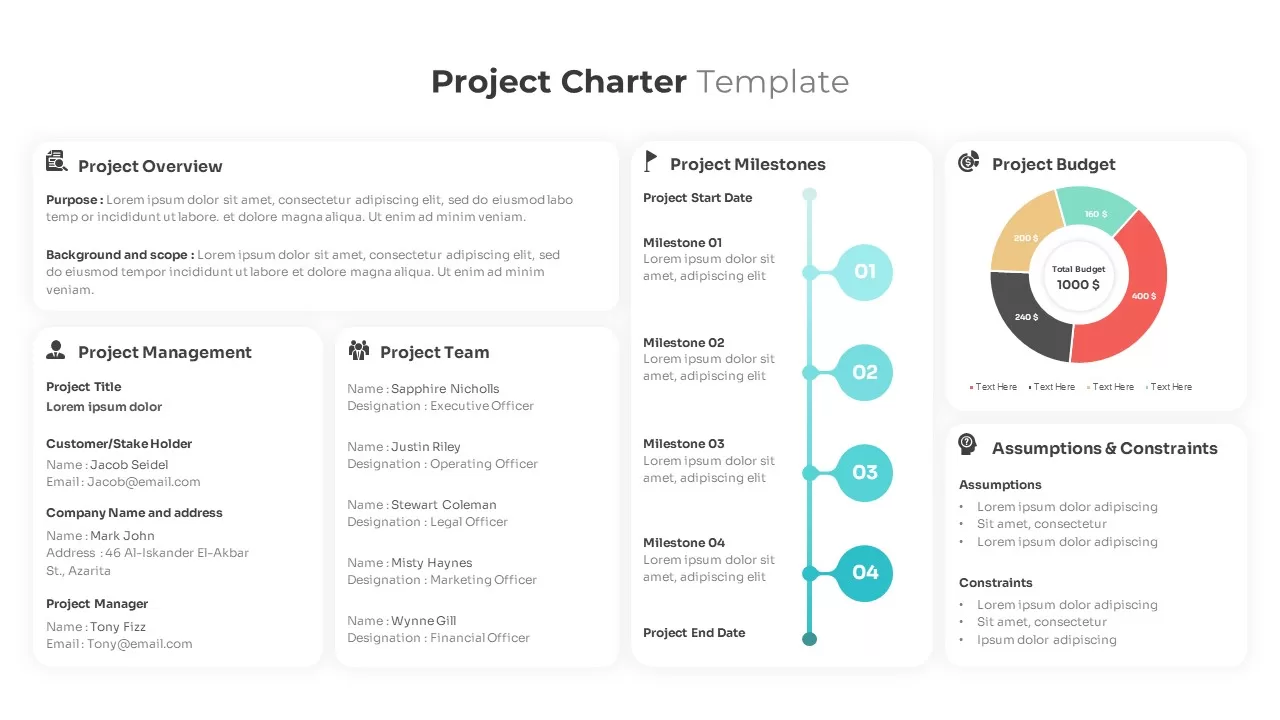
Project Charter Overview template for PowerPoint & Google Slides
Business Plan
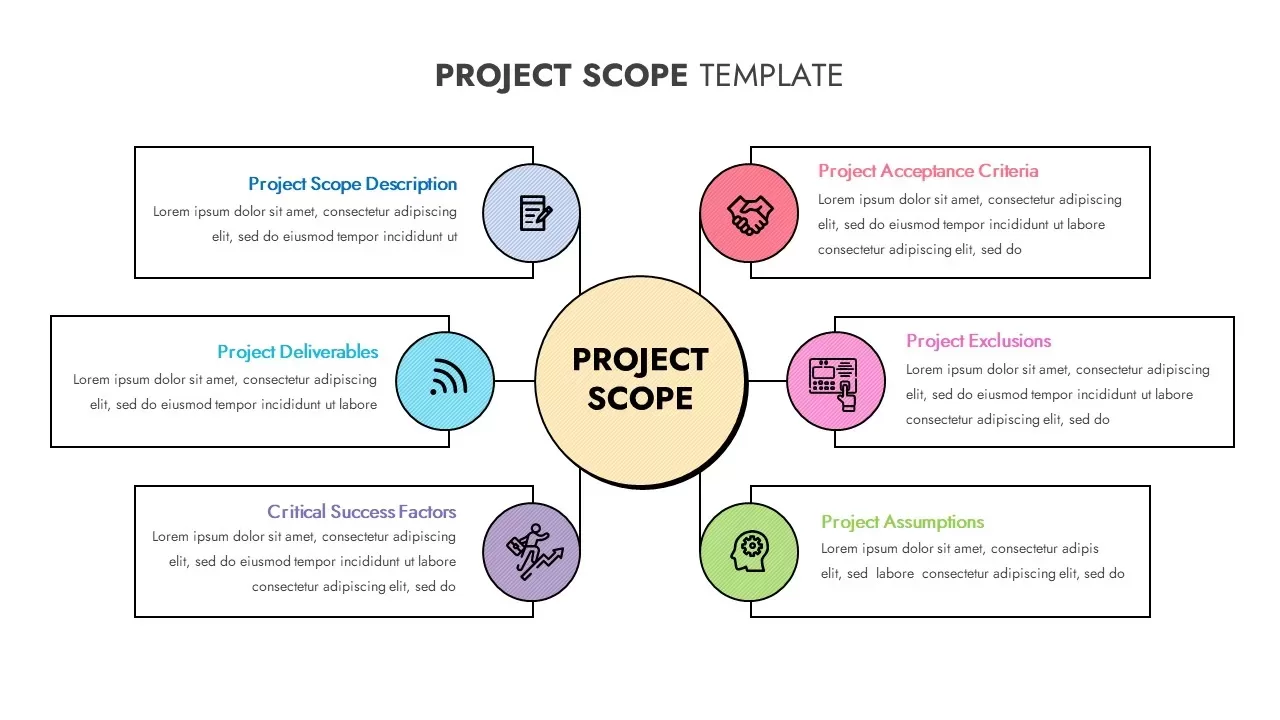
Project Scope Hub & Spoke Layout Template for PowerPoint & Google Slides
Process
Comprehensive Project Execution Plan template for PowerPoint & Google Slides
Project Status
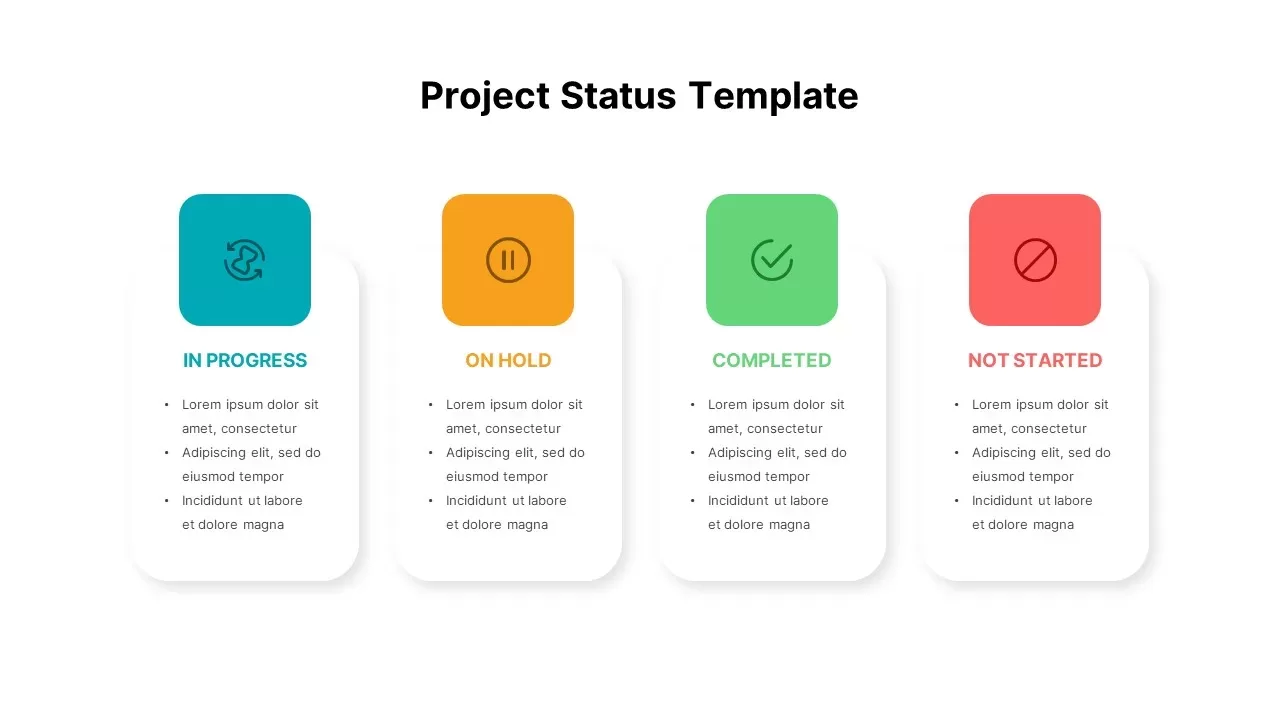
Clean Minimal Project Status Update Template for PowerPoint & Google Slides
Project
Color-Coded Project Status Slide Template for PowerPoint & Google Slides
Project Status
Project Status Dashboard Template for PowerPoint & Google Slides
Project Status

Project Management Deck template for PowerPoint & Google Slides
Project
Project Management Funnel template for PowerPoint & Google Slides
Project
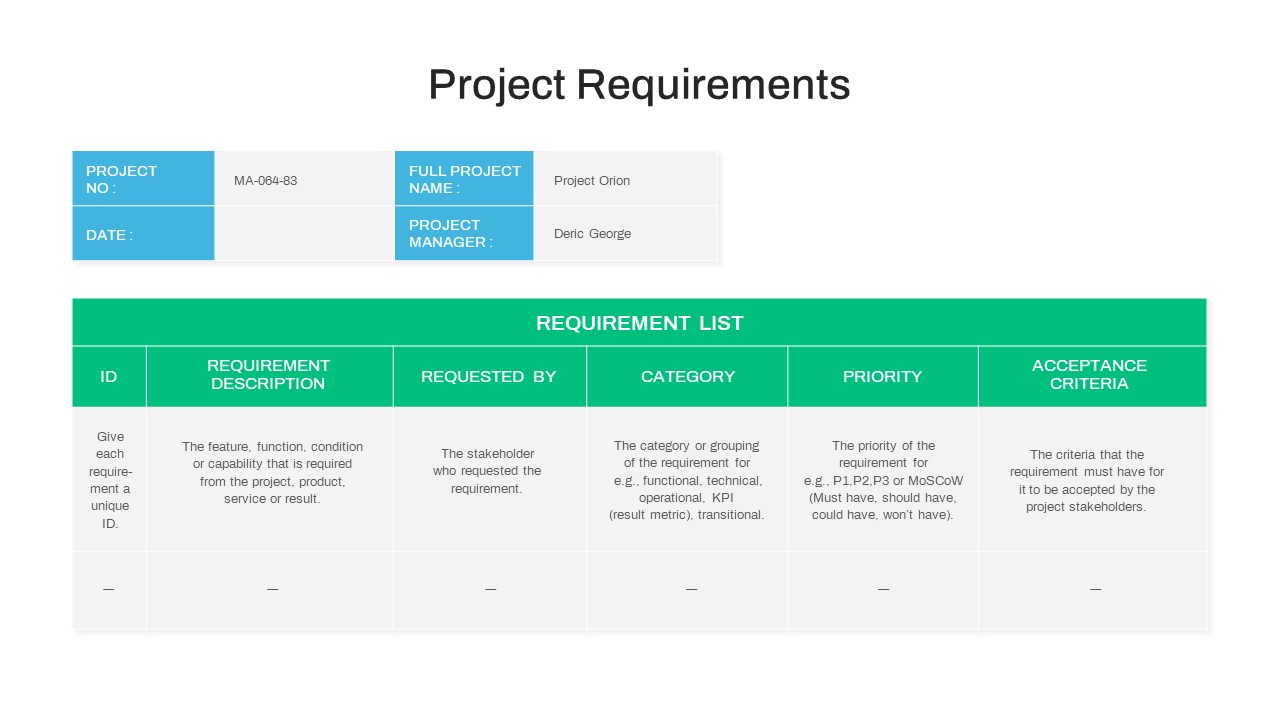
Project Requirements Matrix Template for PowerPoint & Google Slides
Project
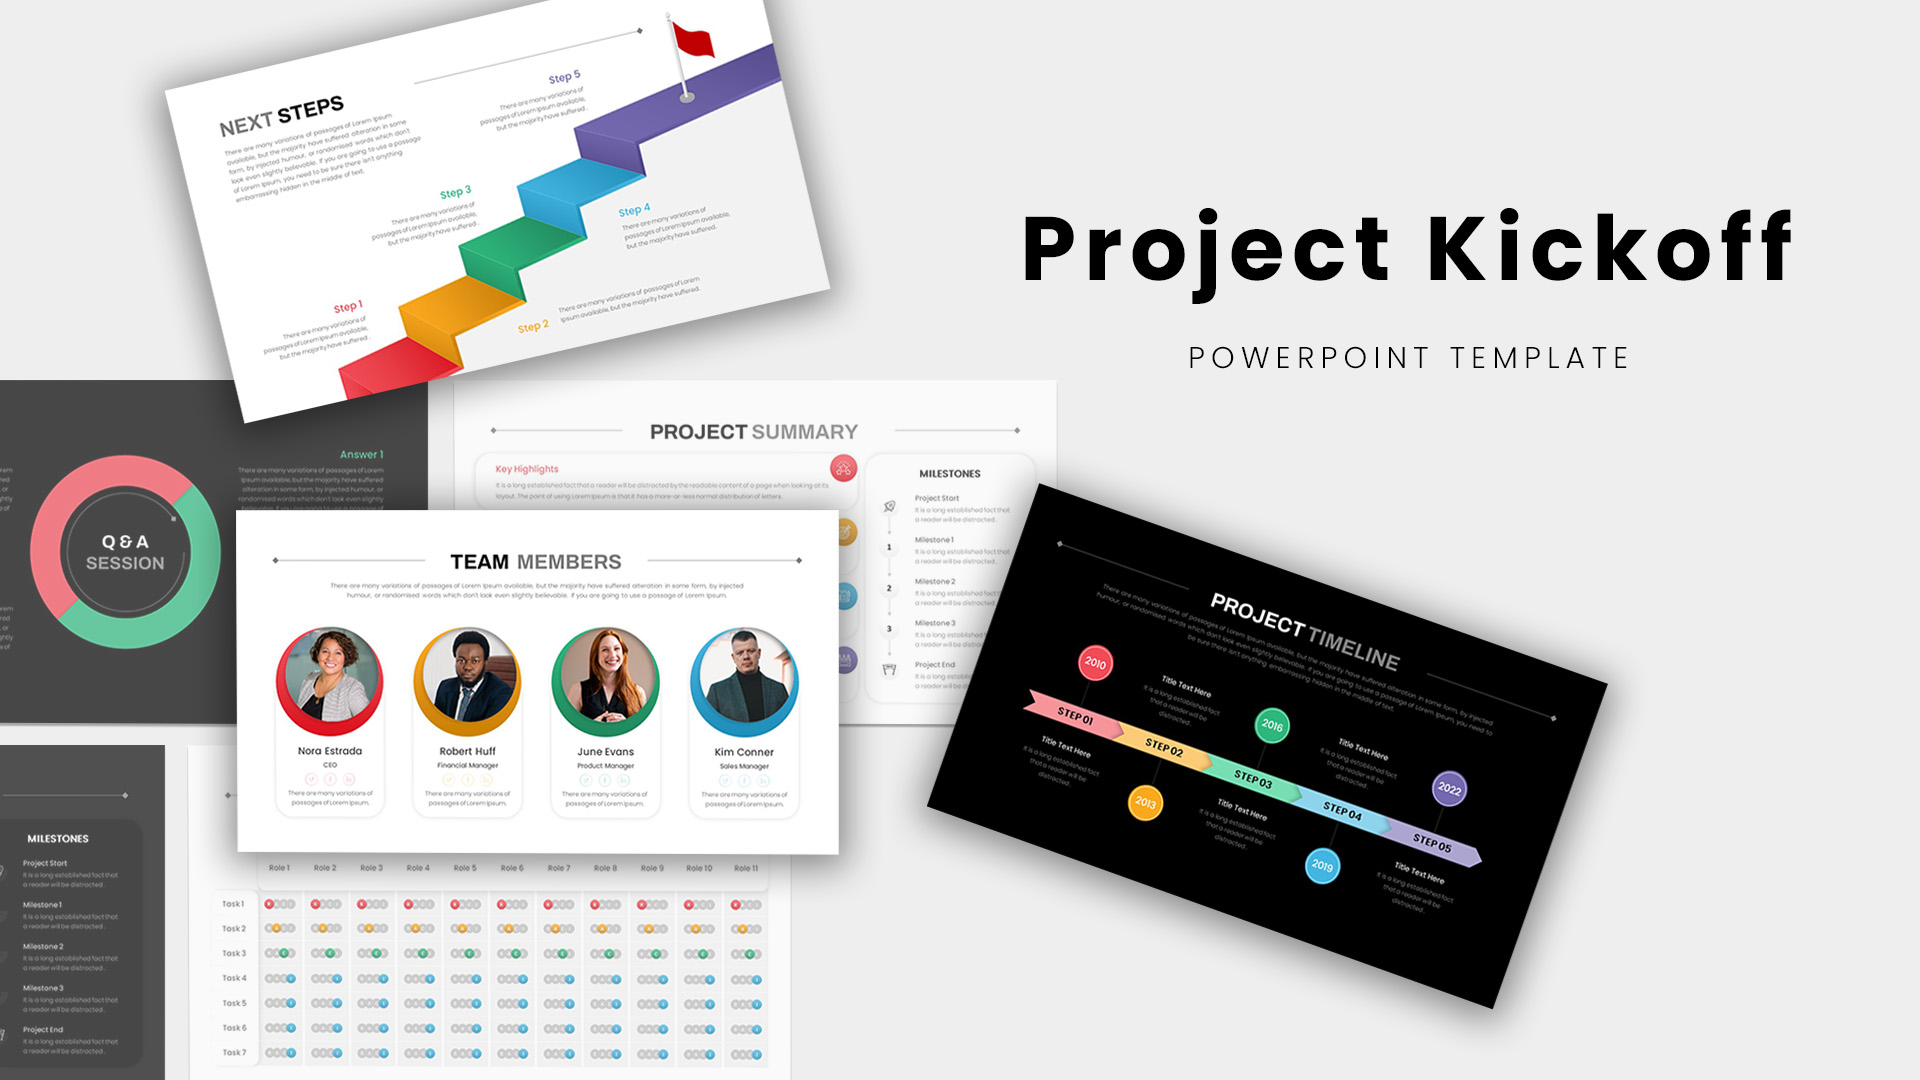
Professional Project Kickoff Deck Template for PowerPoint & Google Slides
Project
Project Progress Dashboard Pie Charts Template for PowerPoint & Google Slides
Project
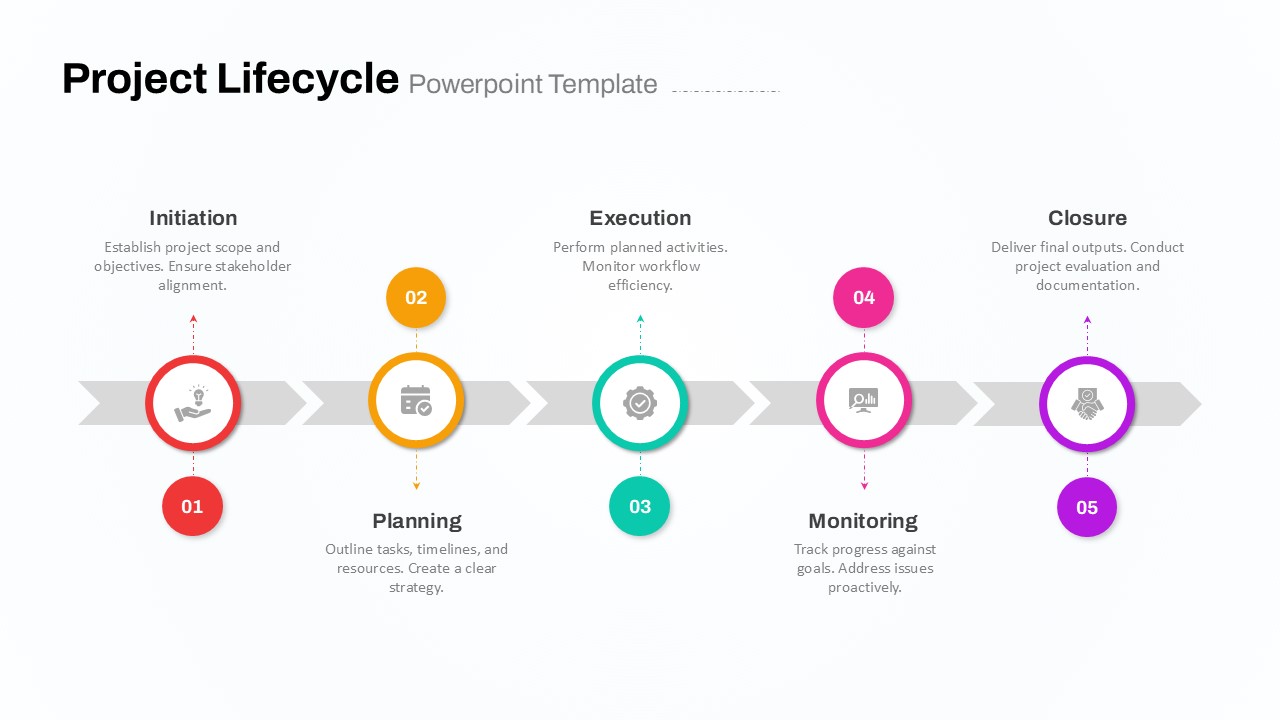
Five-Phase Project Lifecycle Diagram Template for PowerPoint & Google Slides
Infographics
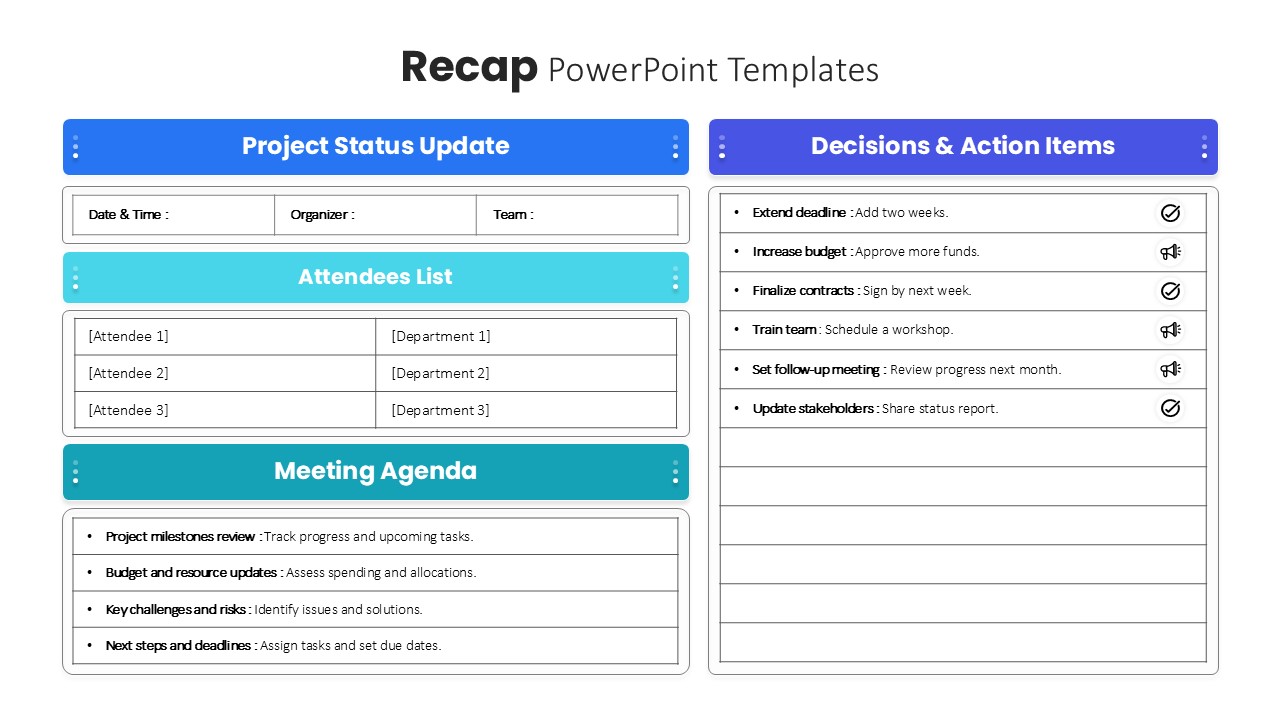
Project Meeting Recap & Action Items Template for PowerPoint & Google Slides
Project Status
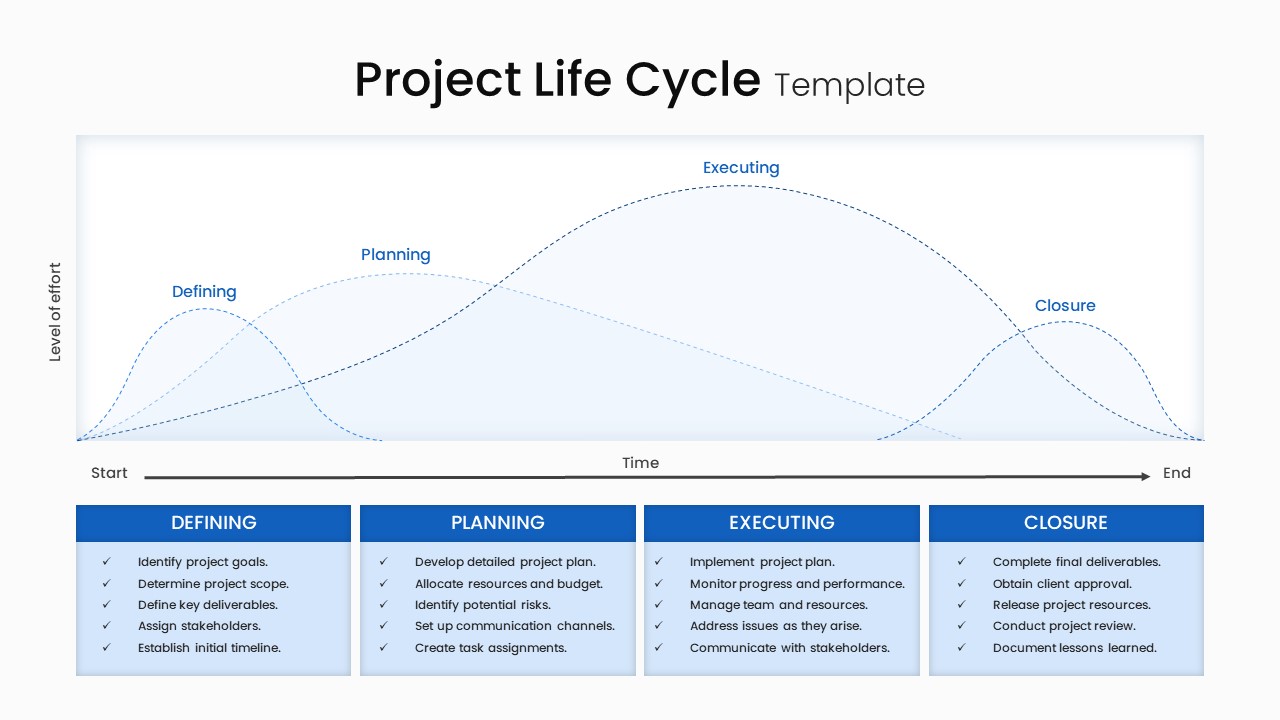
Project Life Cycle Workflow Diagram Template for PowerPoint & Google Slides
Process
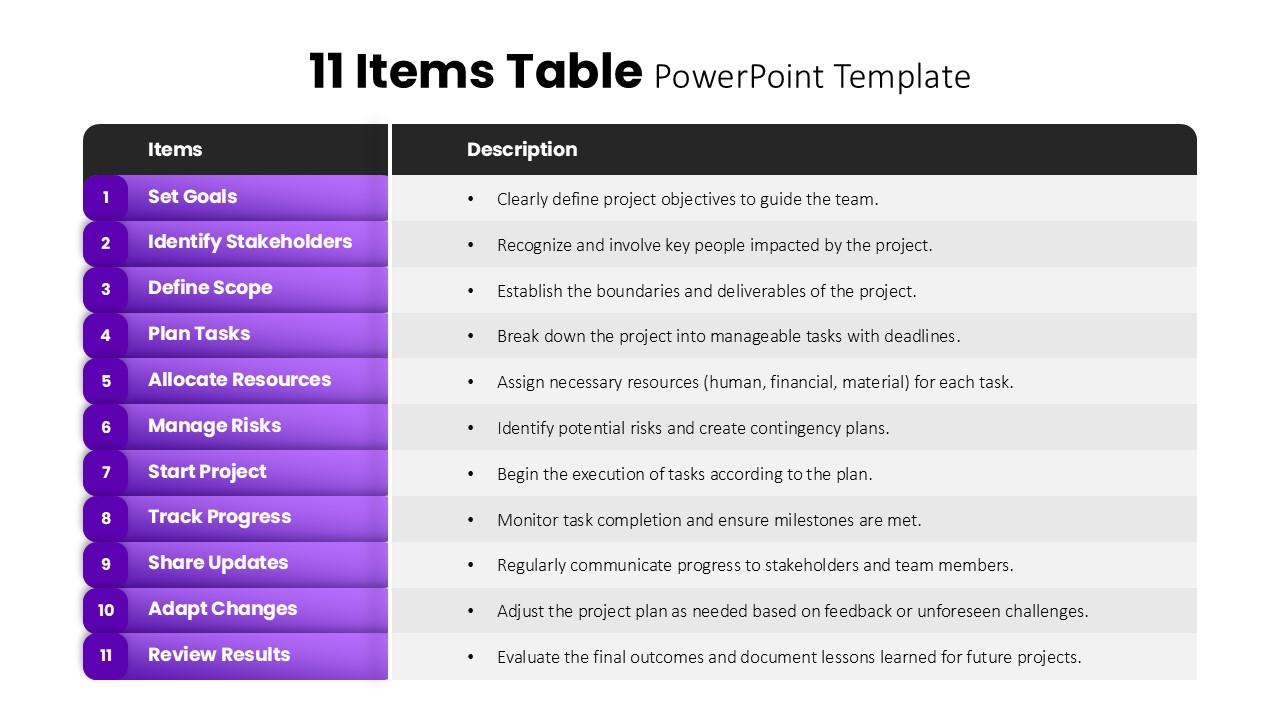
11 Items Table Project Planning Steps template for PowerPoint & Google Slides
Business
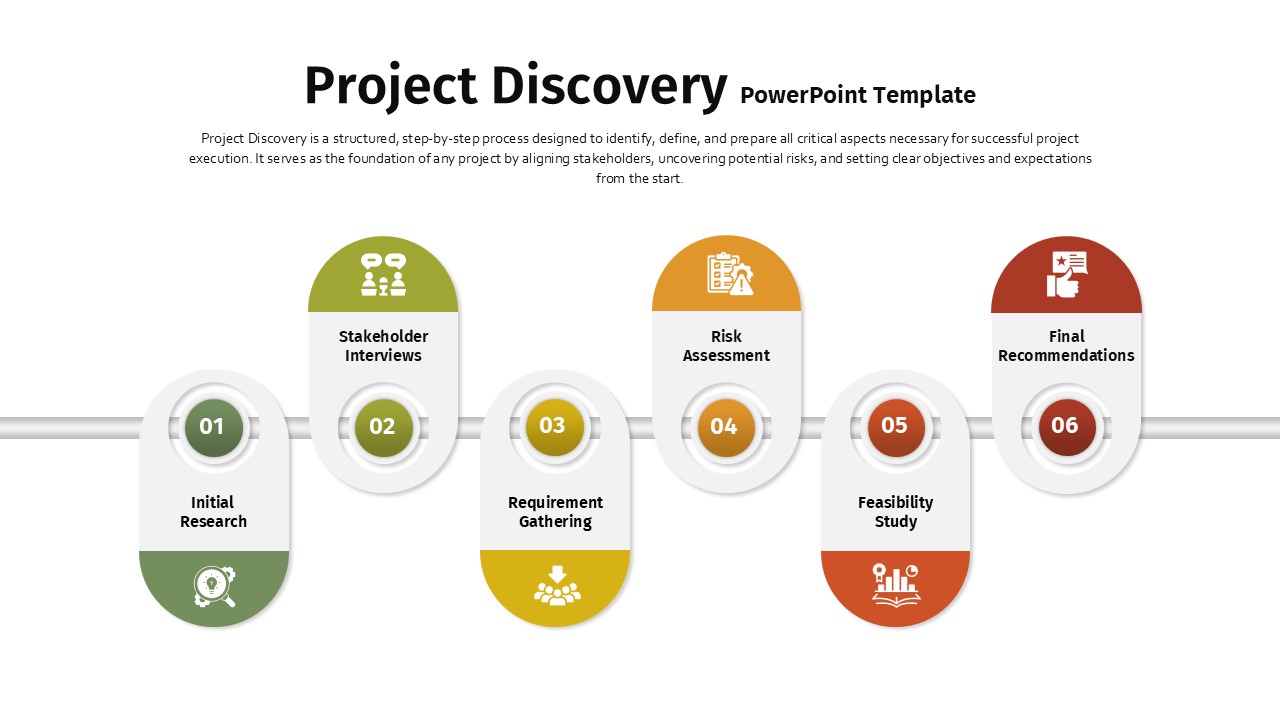
Project Discovery Infographic Pack Template for PowerPoint & Google Slides
Timeline
AI Technology Project Proposal Template for PowerPoint & Google Slides
AI
Project Tracking Dashboard Table Template for PowerPoint & Google Slides
Project Status
Project Status Update Dashboard Table Template for PowerPoint & Google Slides
Project Status
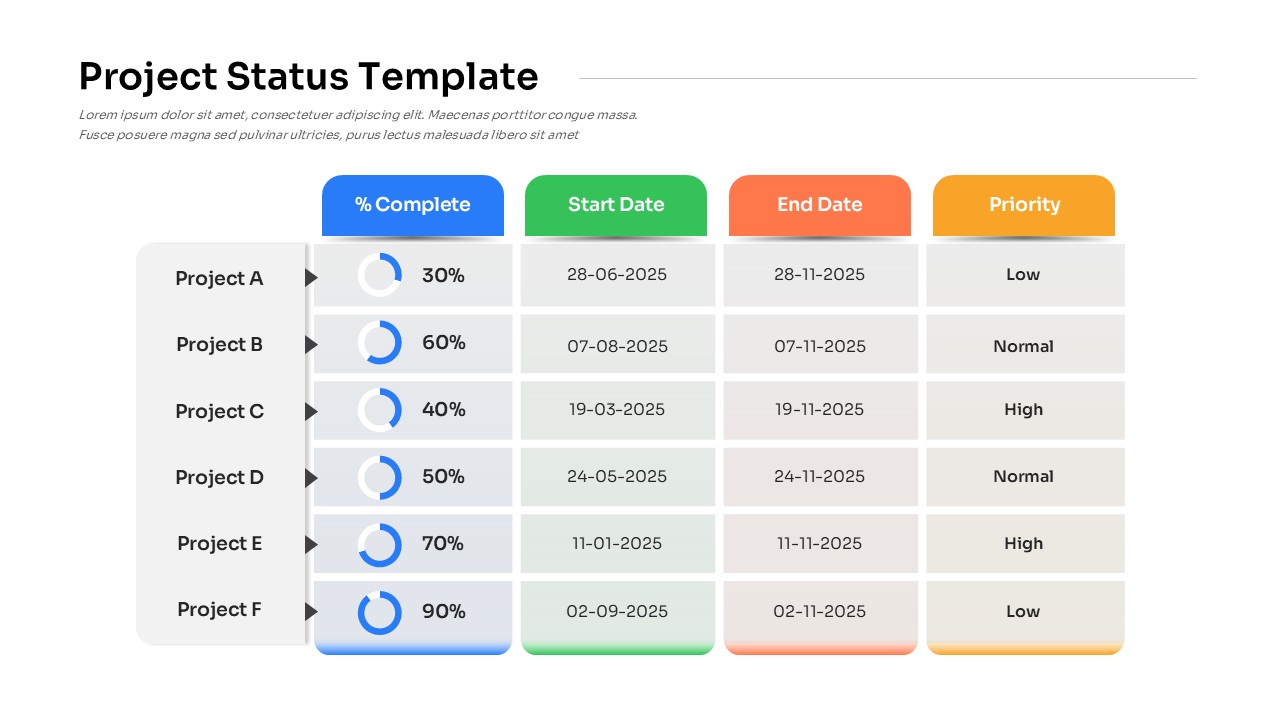
Project Status with Progress & Priority Template for PowerPoint & Google Slides
Table
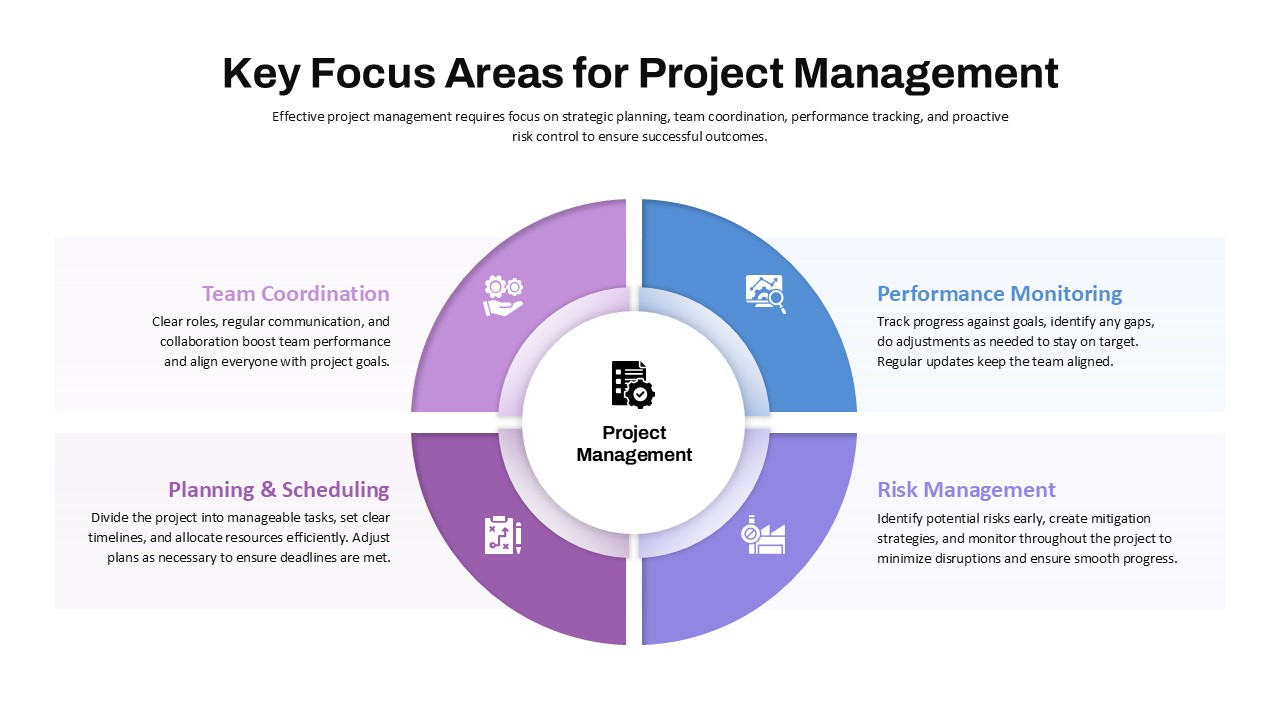
Key Focus Areas for Project Management Template for PowerPoint & Google Slides
Business
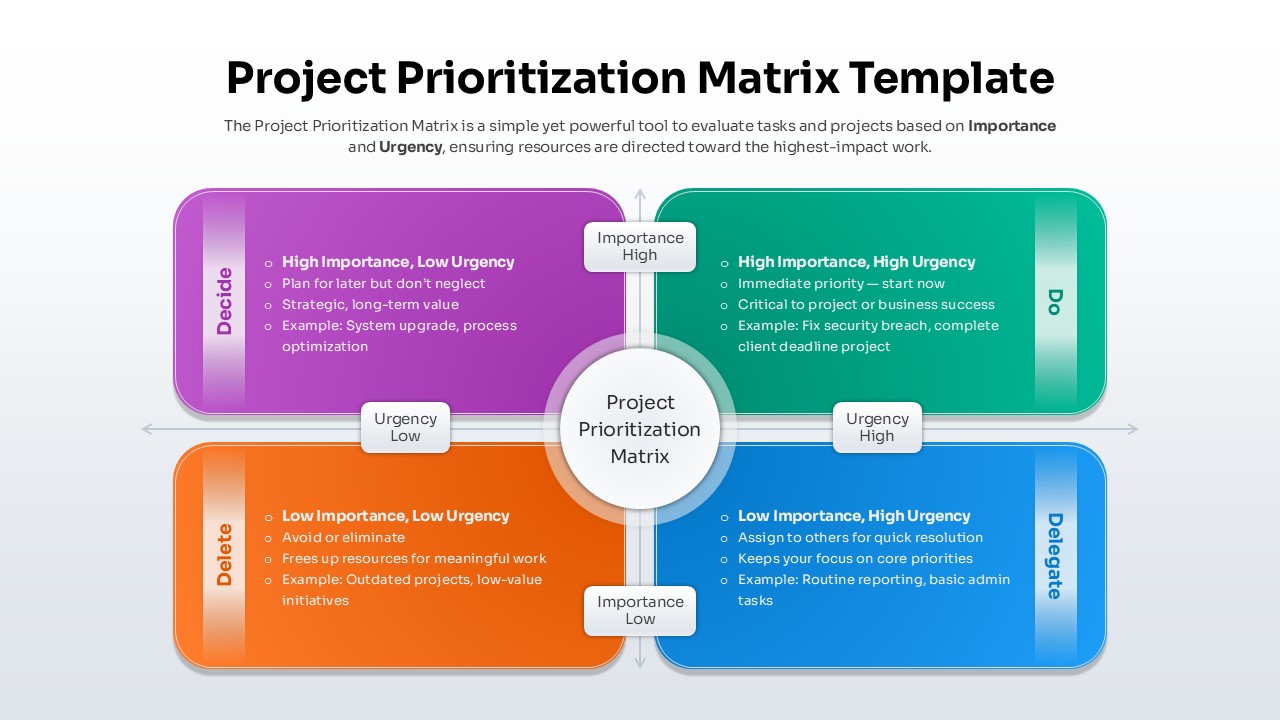
Project Prioritization Matrix Template for PowerPoint & Google Slides
Project
Civil Engineering Project Overview Deck Template for PowerPoint & Google Slides
Decks
Construction Project Dashboard Template for PowerPoint & Google Slides
Project