Supply Positioning Model Matrix Template for PowerPoint & Google Slides


Description
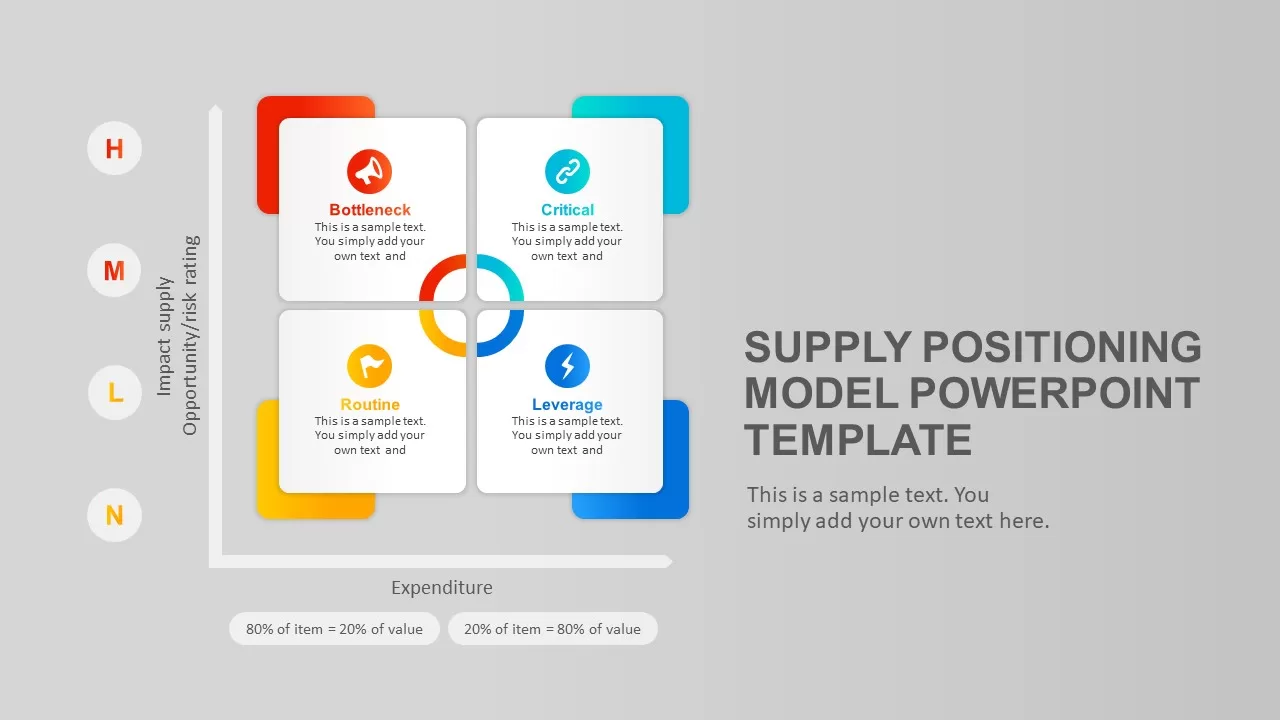
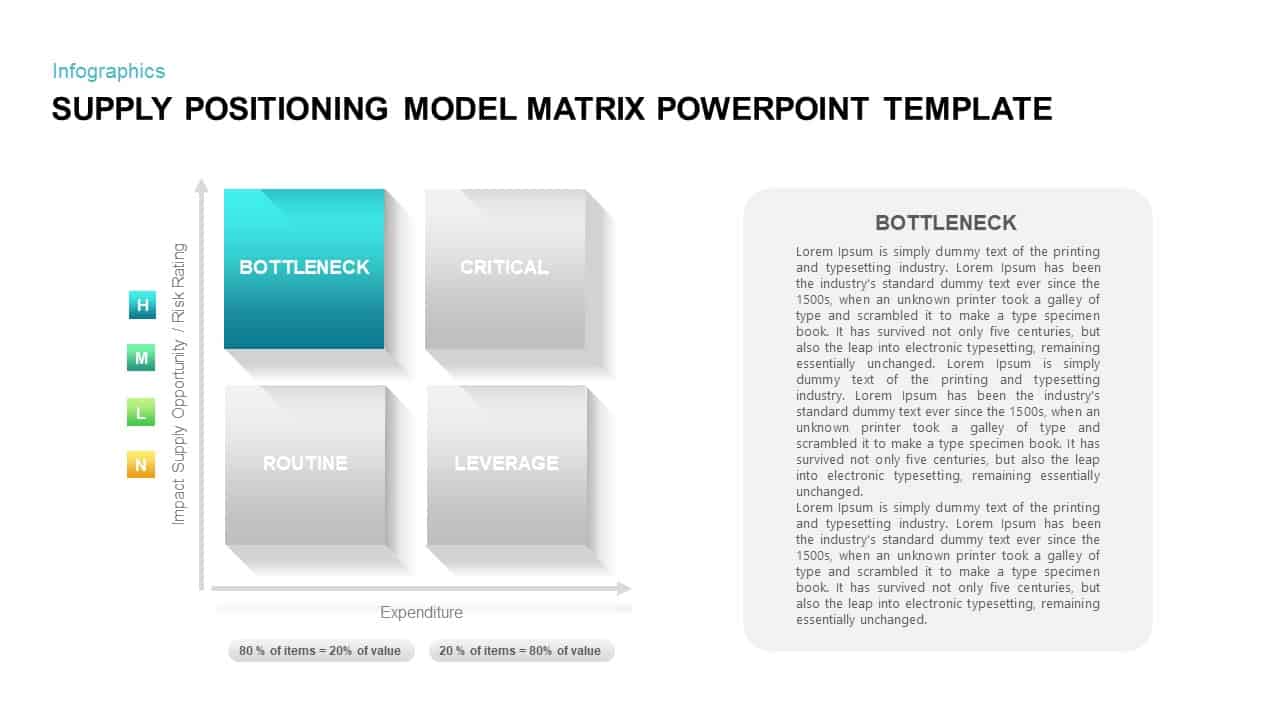
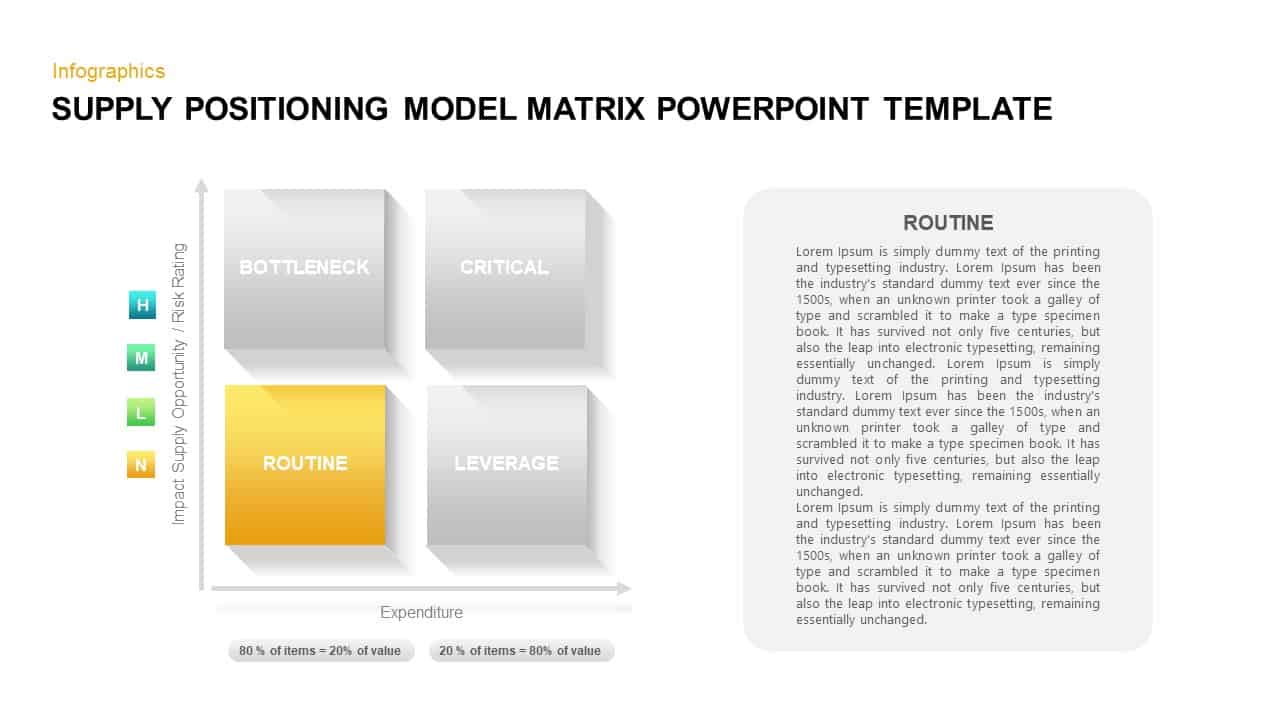
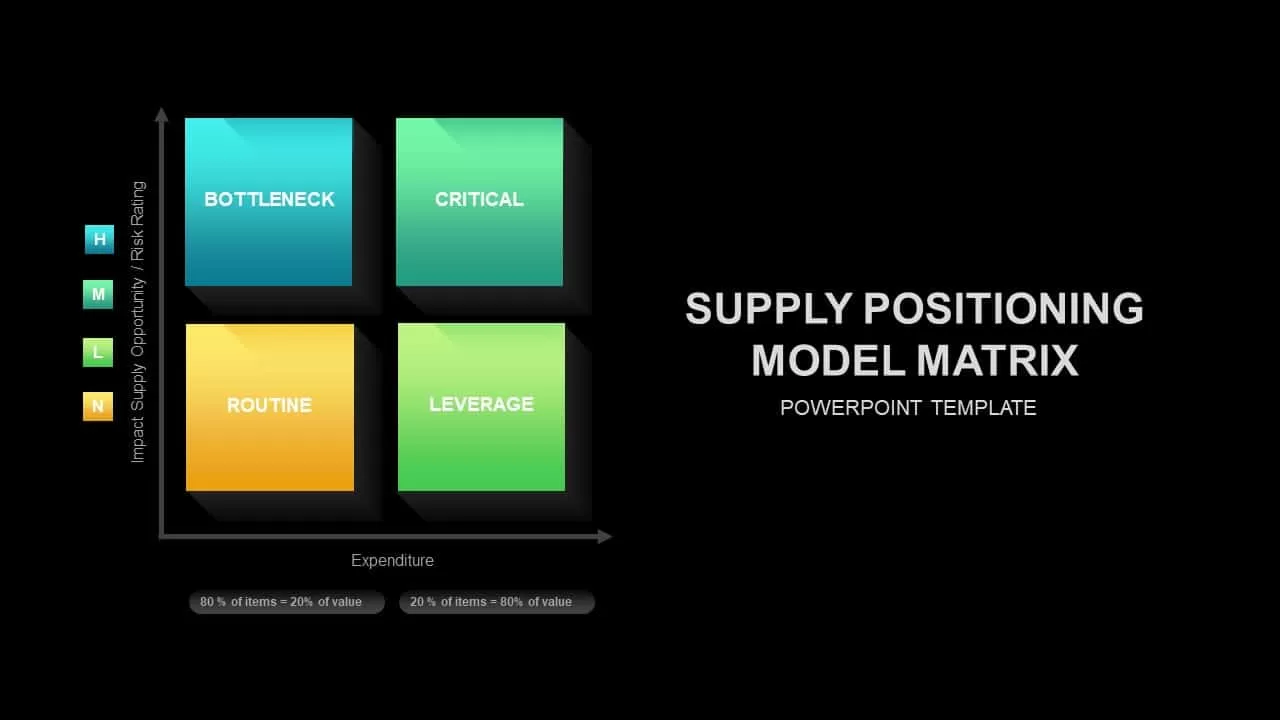
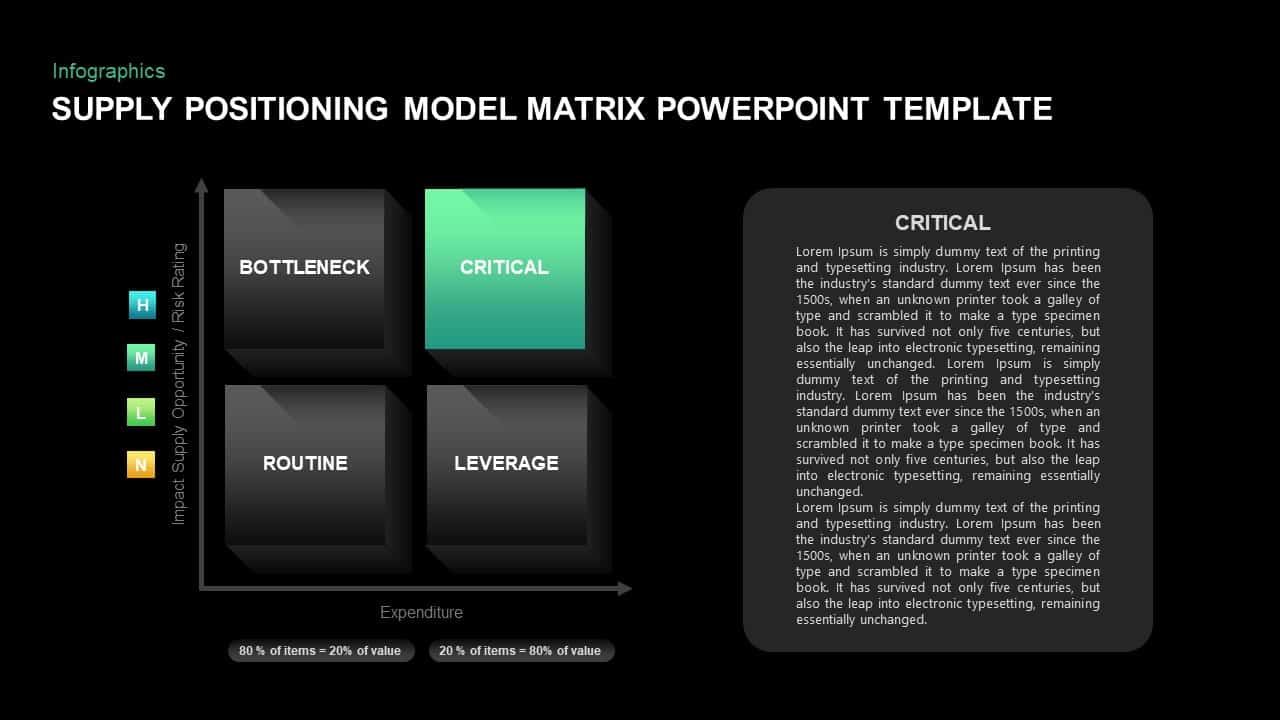
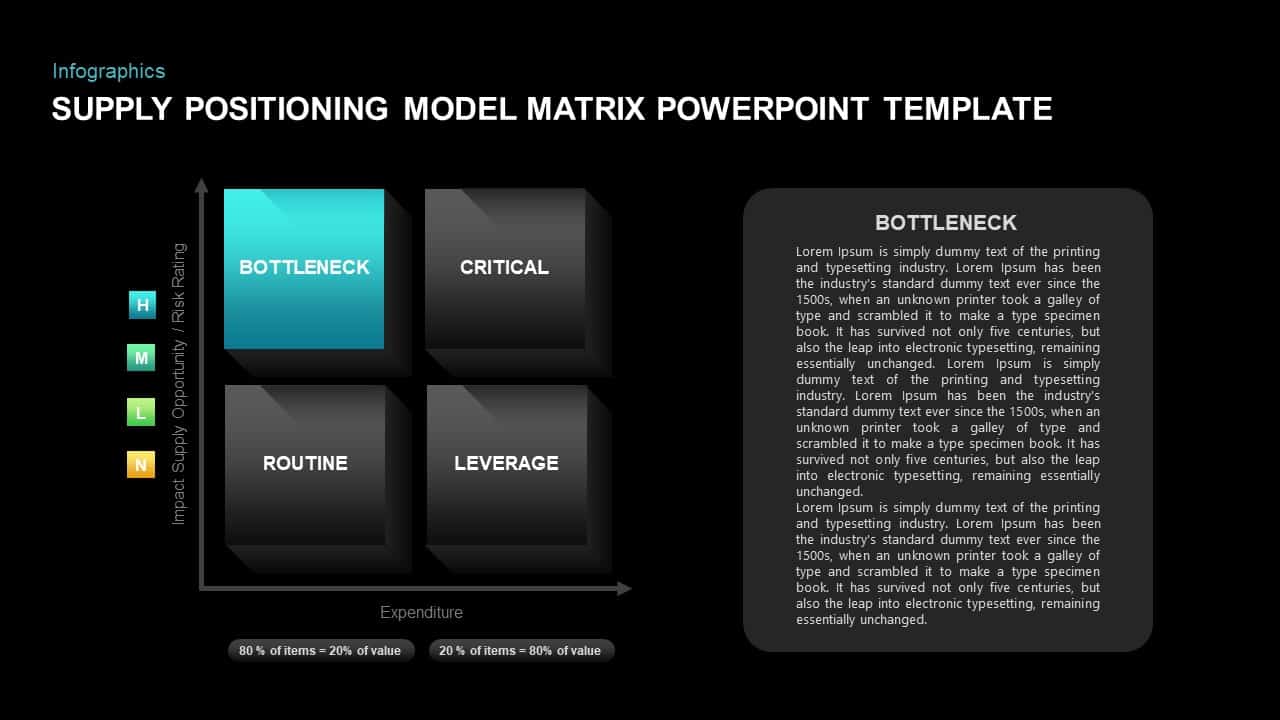
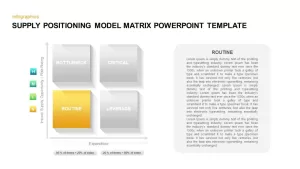
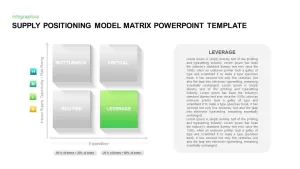
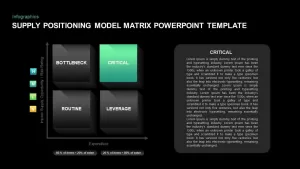
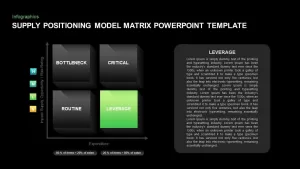
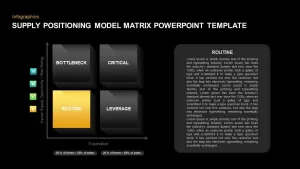
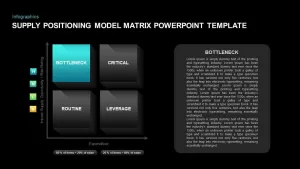
Drive procurement strategy with this 3D four-quadrant Supply Positioning Model Matrix. Each gradient-filled block—Bottleneck, Critical, Routine, and Leverage—sits on a clean grid with subtle drop shadows, mapping impact (risk/opportunity) on the vertical axis against expenditure on the horizontal axis. A concise legend denotes High (H), Medium (M), Low (L), and Non-critical (N) categories, while Pareto callouts at the base illustrate “80% of items = 20% of spend” and “20% of items = 80% of spend.” Master-slide support, placeholder text, and editable shapes let you swap color palettes, adjust labels, or animate quadrants in seconds, all against a minimalist white backdrop for maximum audience focus.
Whether presenting to executives, aligning cross-functional teams, or mapping supplier strategies, this template accelerates decision-making by visualizing risk and cost in a single glance. Duplicate and reorder blocks to reflect changing priorities, repurpose axes for alternative metrics such as lead time or quality rating, or export as an infographic for reports.
Customize gradient styles to align with corporate branding or highlight specific supplier categories; adjust axis labels and legends to accommodate alternative criteria. Use built-in callouts to annotate cost-saving initiatives or spotlight critical suppliers. With smart guides and editable shapes, you can resize quadrants to emphasize high-priority areas or integrate icons for service categories—saving time and reducing design errors.
Leverage slide transitions to reveal quadrants progressively during your narrative, guiding audiences from overview to deep-dive. Merge this slide with procurement dashboards or category roadmaps to create cohesive visual storylines. Ideal for training sessions, supplier scorecard reviews, or executive briefings, it delivers a clear, data-driven perspective on supply positioning.
Who is it for
Procurement managers, supply chain analysts, category managers, risk officers, and operations leads seeking a clear visual framework to assess supplier impact and expenditure.
Other Uses
Repurpose for project risk assessments, budget allocation reviews, asset portfolio analyses, market segmentation exercises, or performance benchmarking by adapting axes to any two metrics.
Login to download this file

Item ID
SB01637
Related Templates

Supply Positioning Model Template for PowerPoint & Google Slides
Business Models
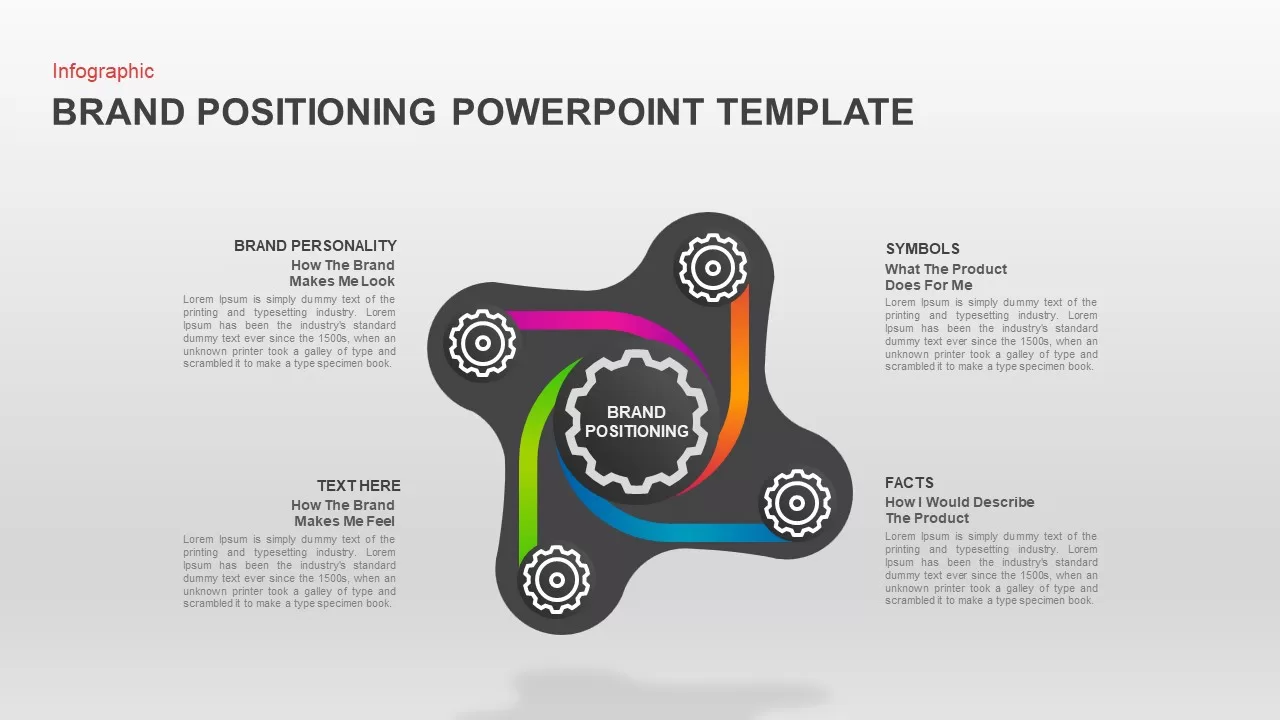
Brand Positioning Presentation Template for PowerPoint & Google Slides
Business
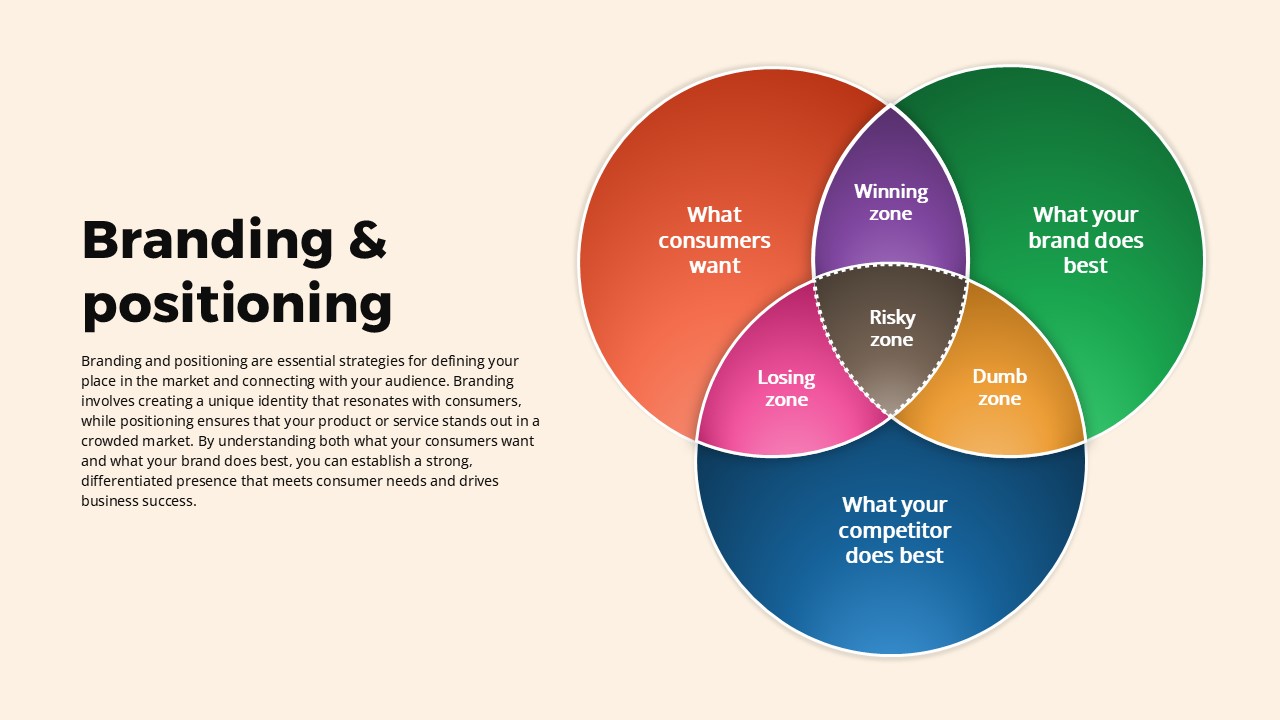
Branding and Positioning Venn Diagram Template for PowerPoint & Google Slides
Comparison
STP Segmentation Targeting Positioning Strategy Deck for PowerPoint & Google Slides
Marketing
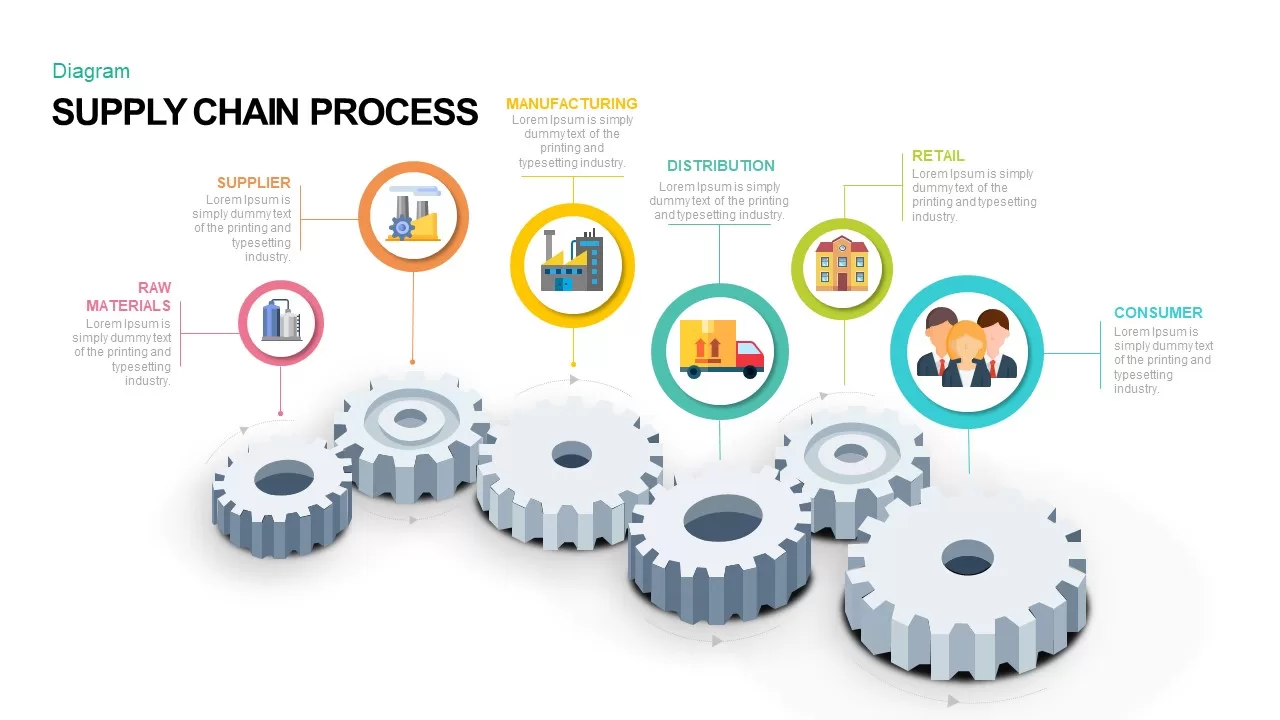
Supply Chain Process Gear Diagram Template for PowerPoint & Google Slides
Process
Logistics and Supply Chain Management Template for PowerPoint & Google Slides
Process
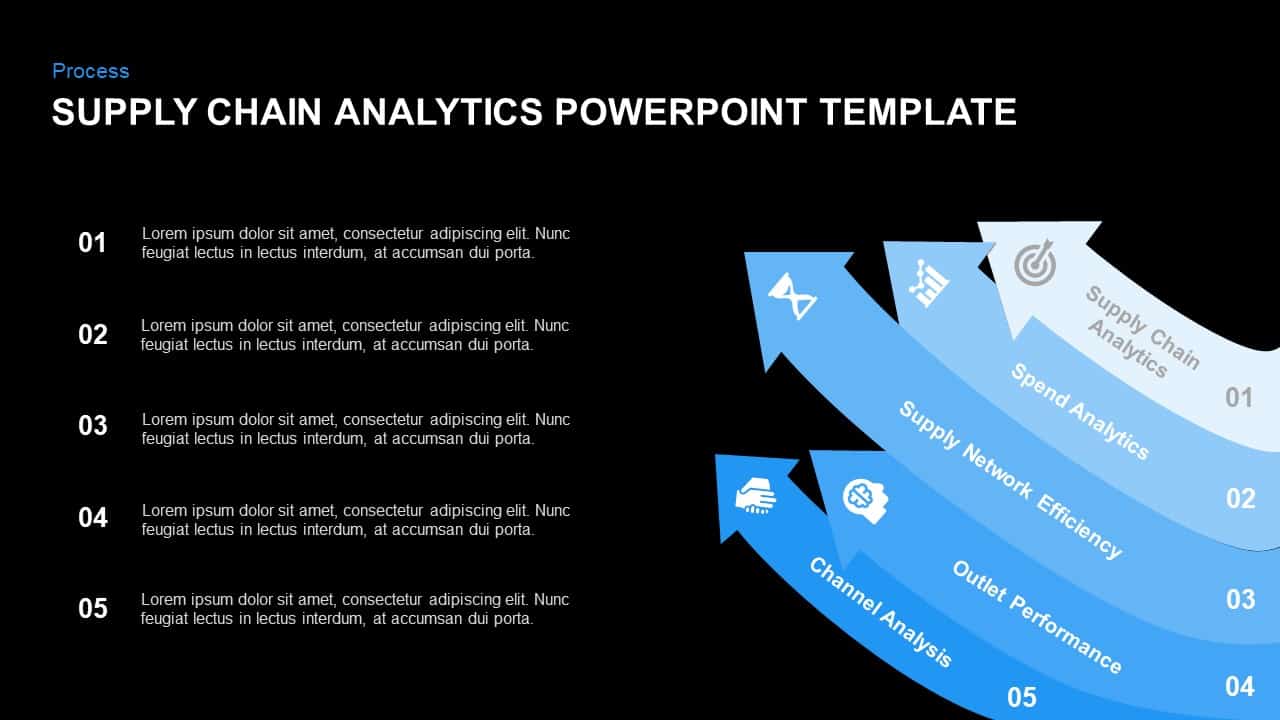
Supply Chain Analytics Process Template for PowerPoint & Google Slides
Process
Supply Chain Management Logistics Cover Template for PowerPoint & Google Slides
Pitch Deck
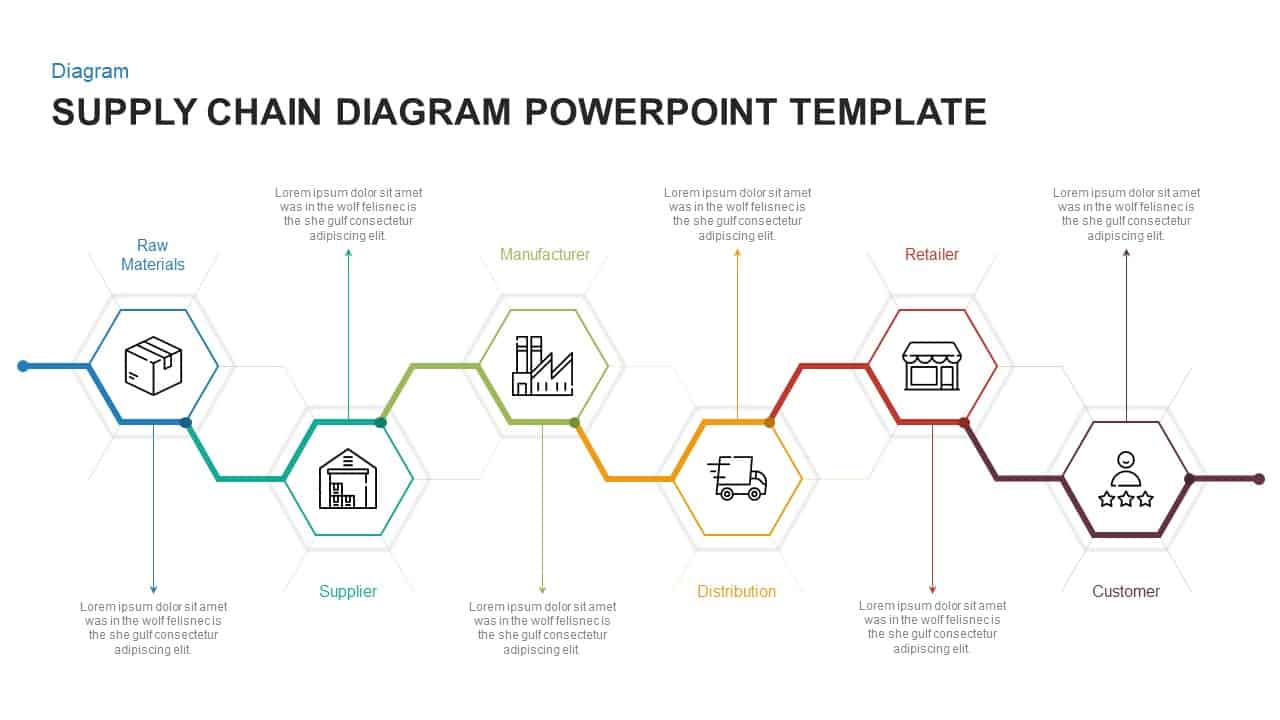
Hexagonal Supply Chain Diagram Template for PowerPoint & Google Slides
Process
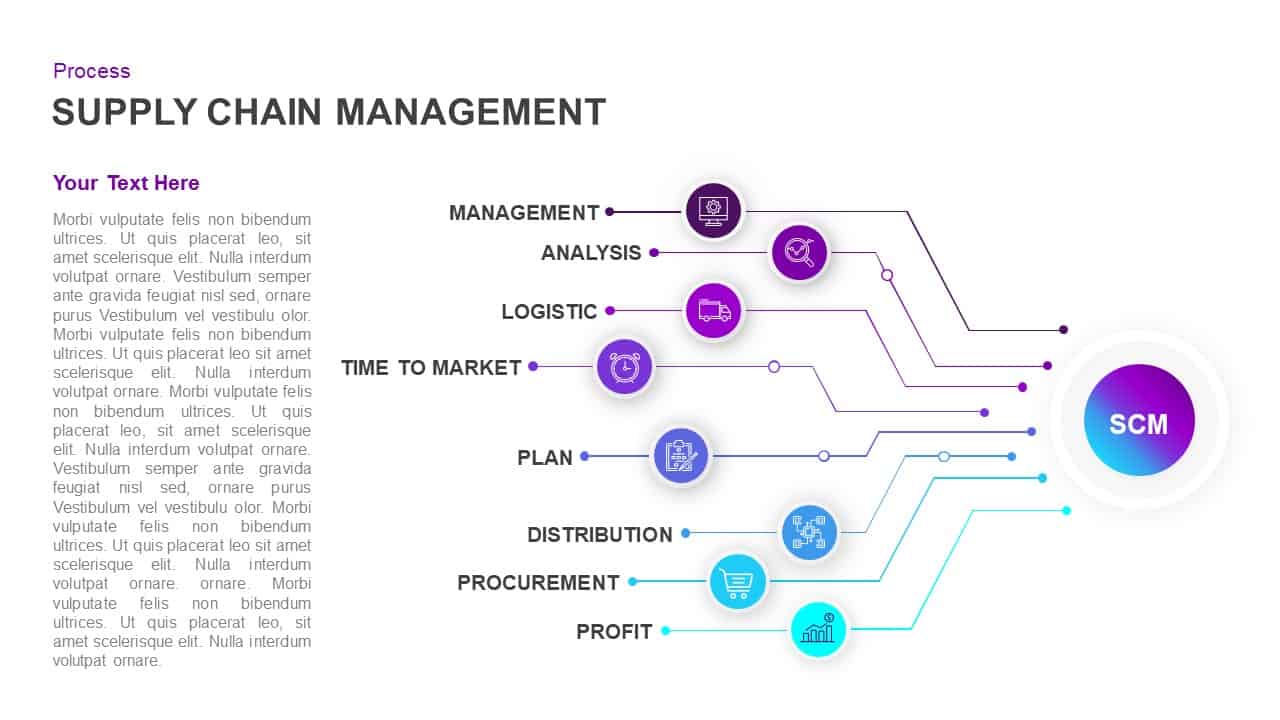
Supply Chain Management Process Diagram Template for PowerPoint & Google Slides
Process
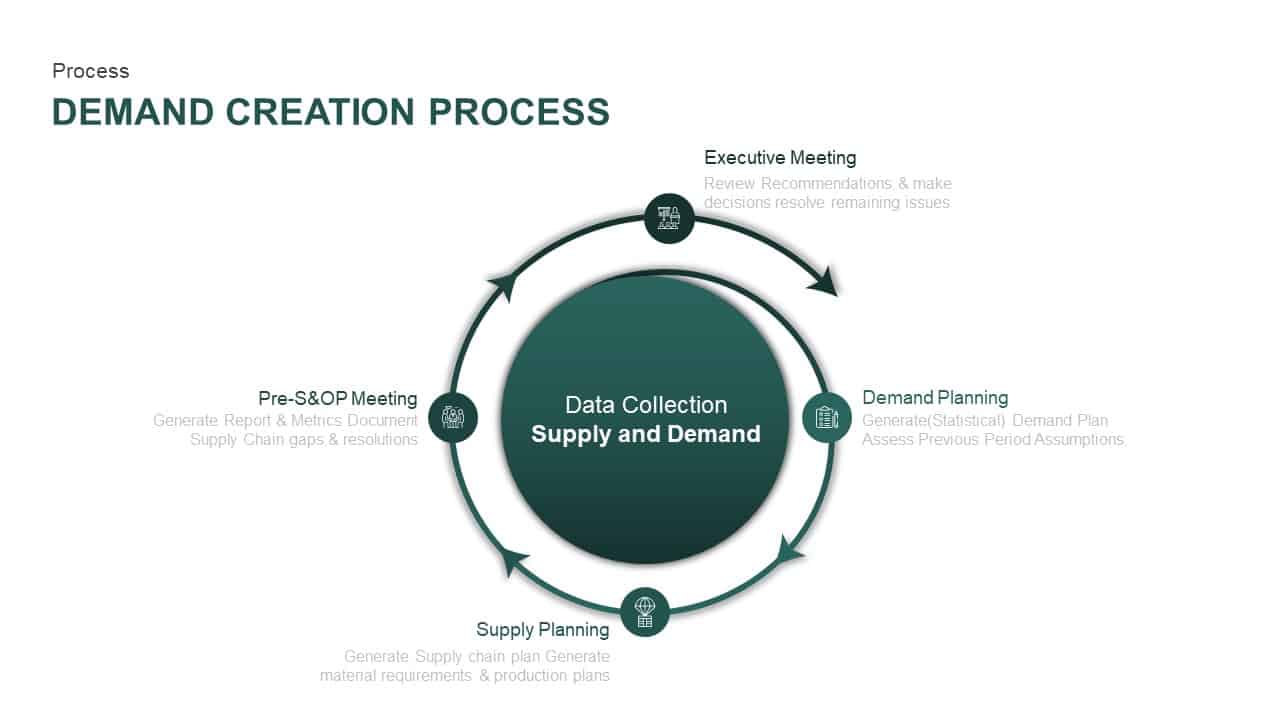
Supply and Demand Creation Cycle Diagram Template for PowerPoint & Google Slides
Process
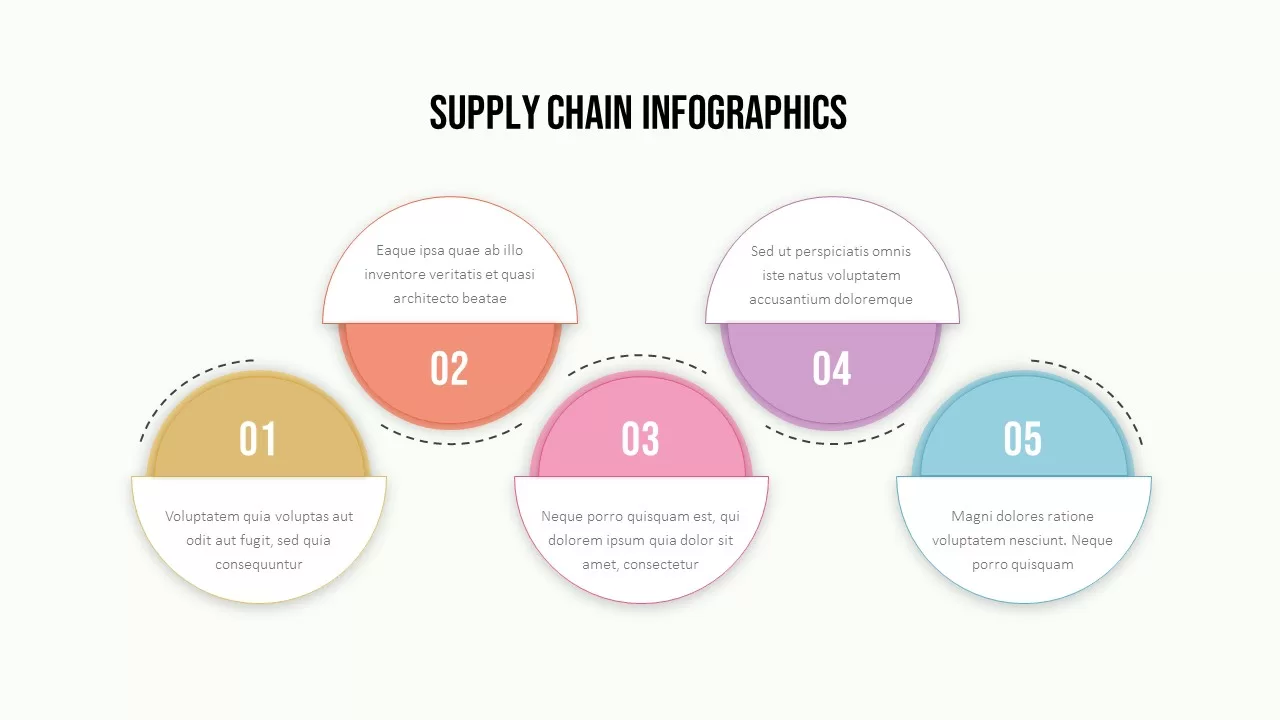
Supply Chain Circular Process Infographics Template for PowerPoint & Google Slides
Business Strategy
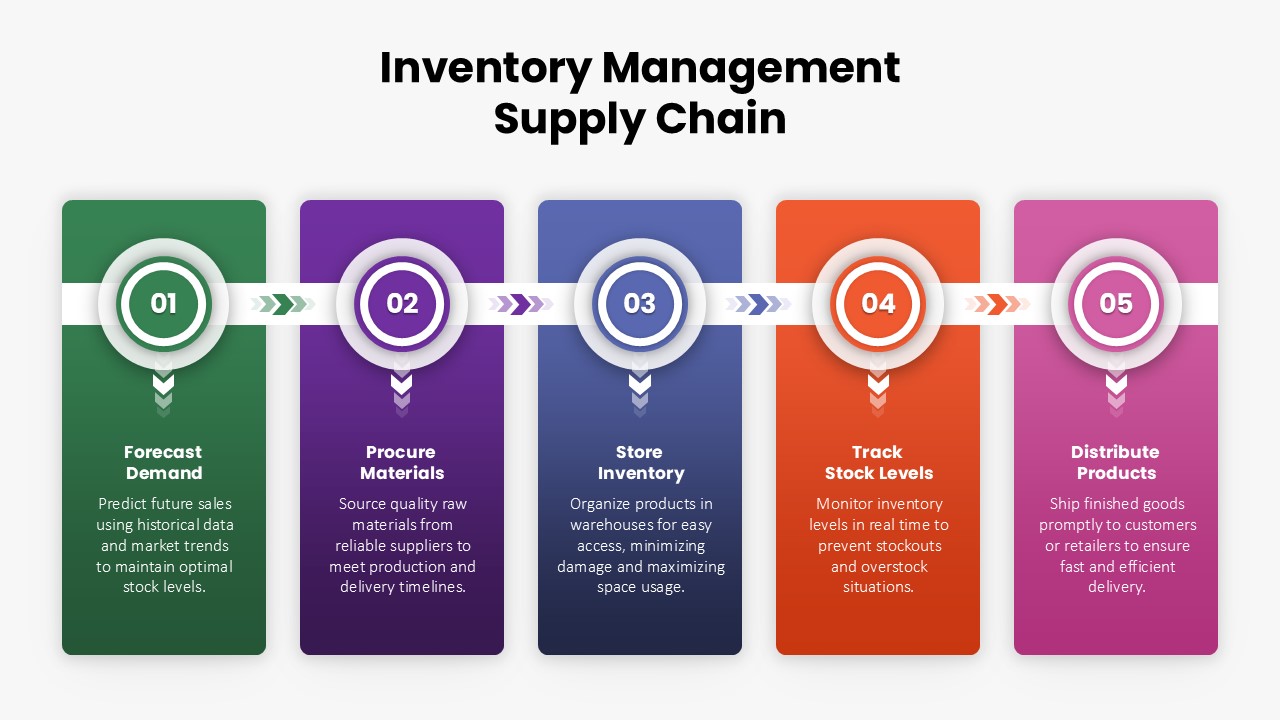
Inventory Management Supply Chain Template for PowerPoint & Google Slides
Process
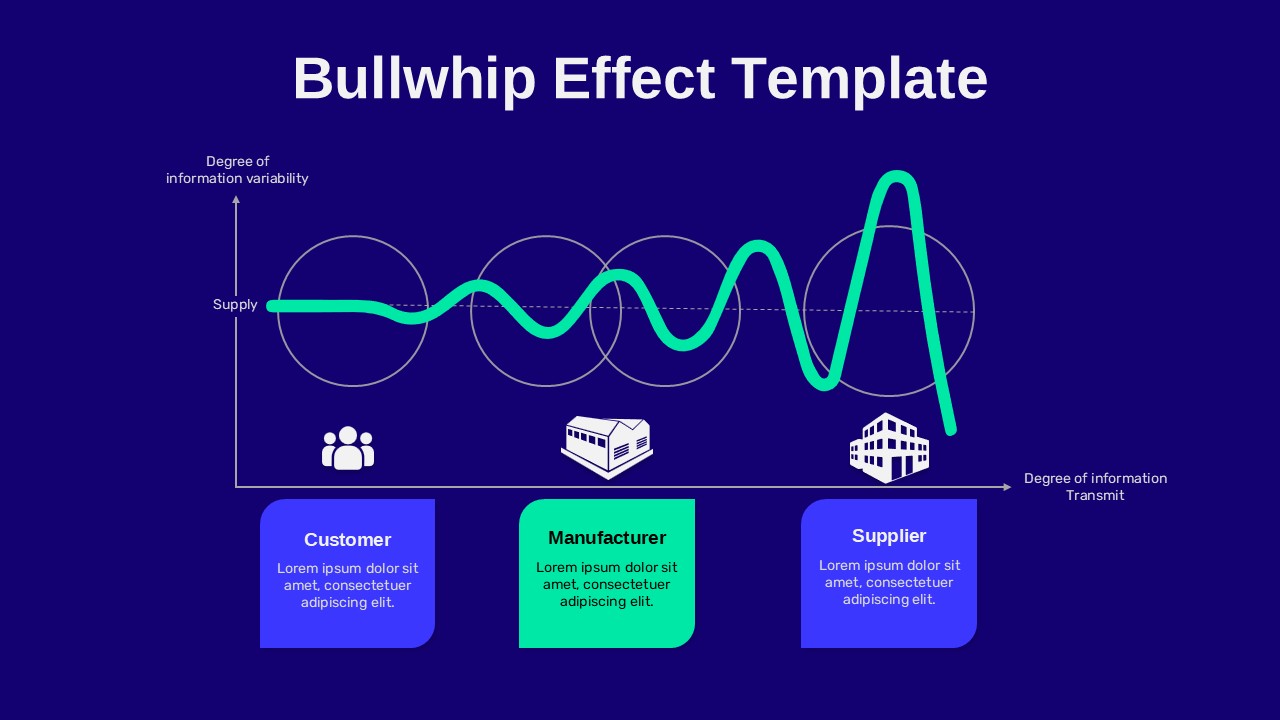
Bullwhip Effect Supply Chain Variability Diagram Template for PowerPoint & Google Slides
Business Models
Ansoff Matrix Growth Strategy Model Template for PowerPoint & Google Slides
BCG
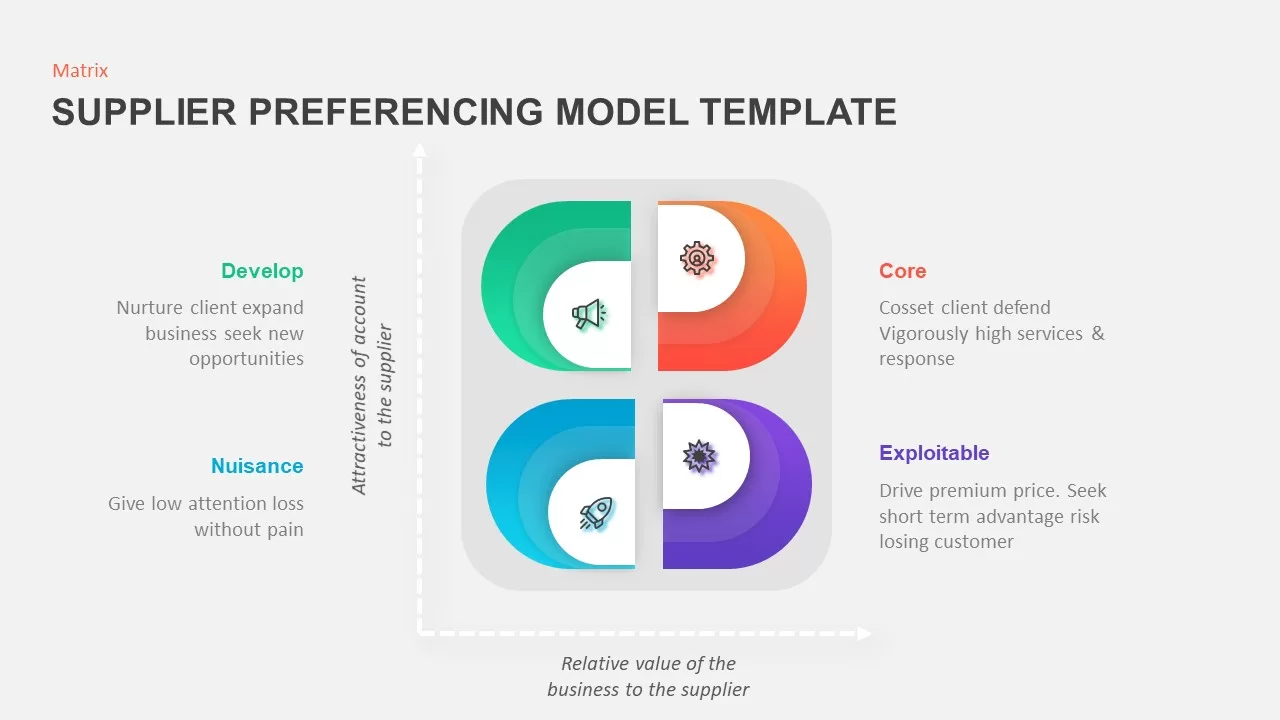
Supplier Preferencing Model Matrix Template for PowerPoint & Google Slides
Business Strategy
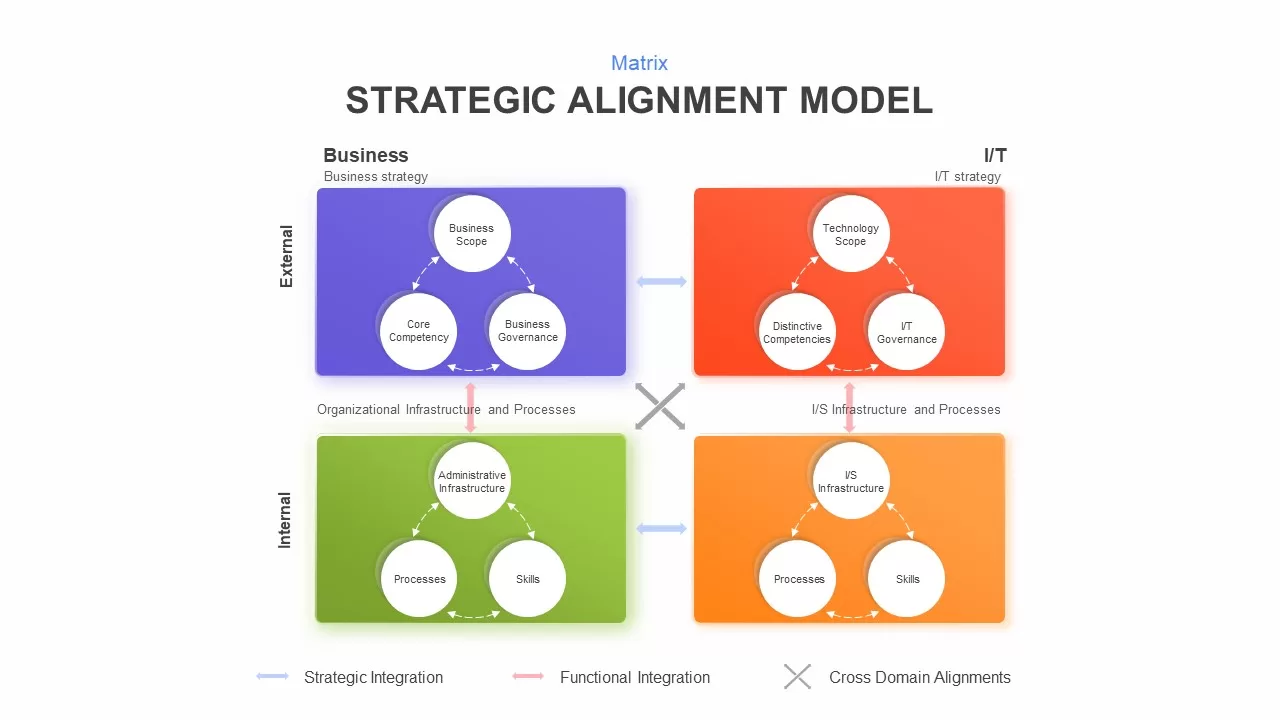
Strategic Alignment Matrix Model Template for PowerPoint & Google Slides
Project

Innovation Ambition Matrix & Funnel Strategy Slides for PowerPoint & Google Slides
Process
Market Development Matrix Chart Template for PowerPoint & Google Slides
Comparison Chart
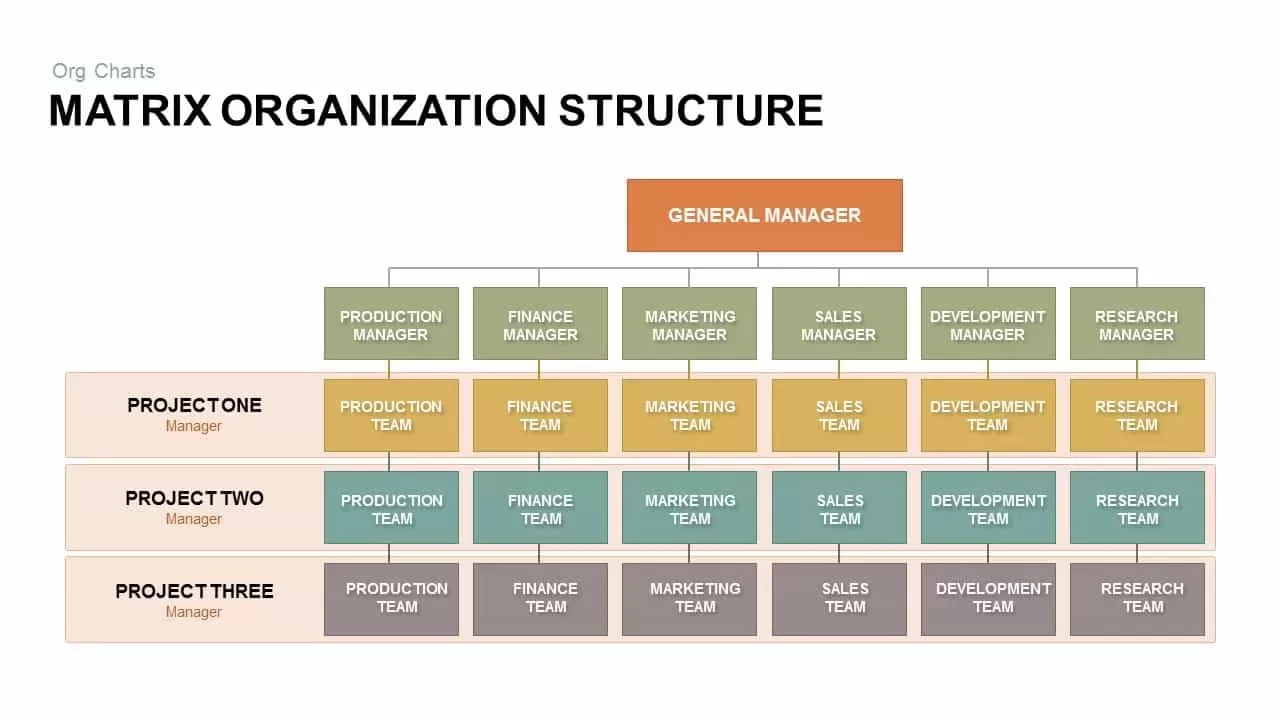
Matrix Organization Structure template for PowerPoint & Google Slides
Org Chart

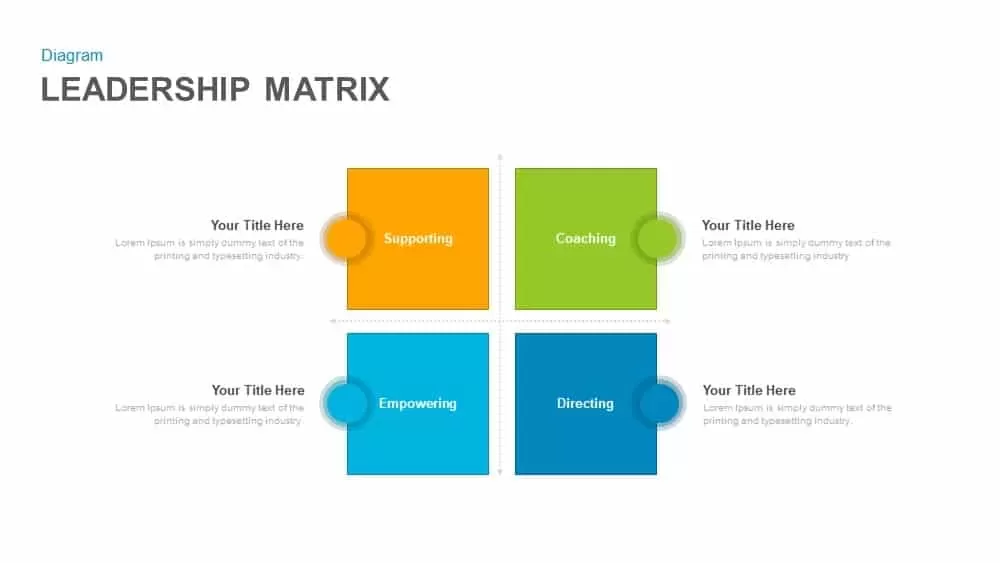
Leadership Matrix with Four Quadrants Template for PowerPoint & Google Slides
Comparison
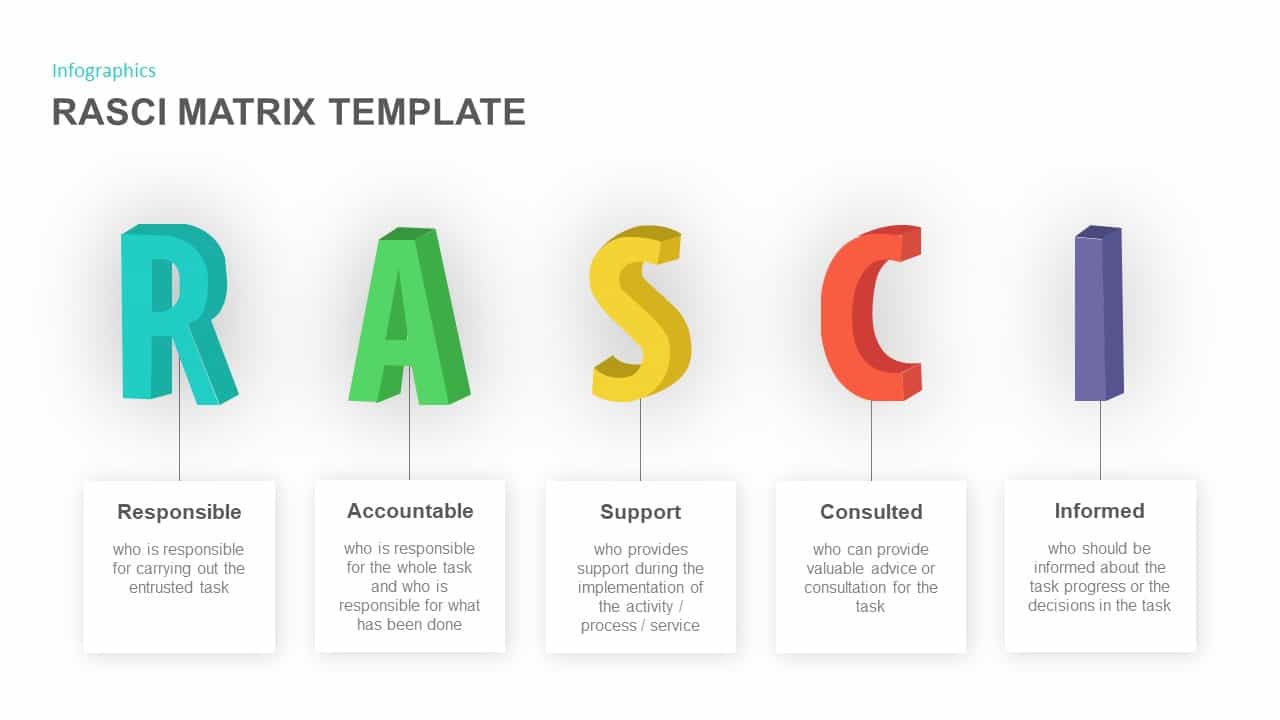
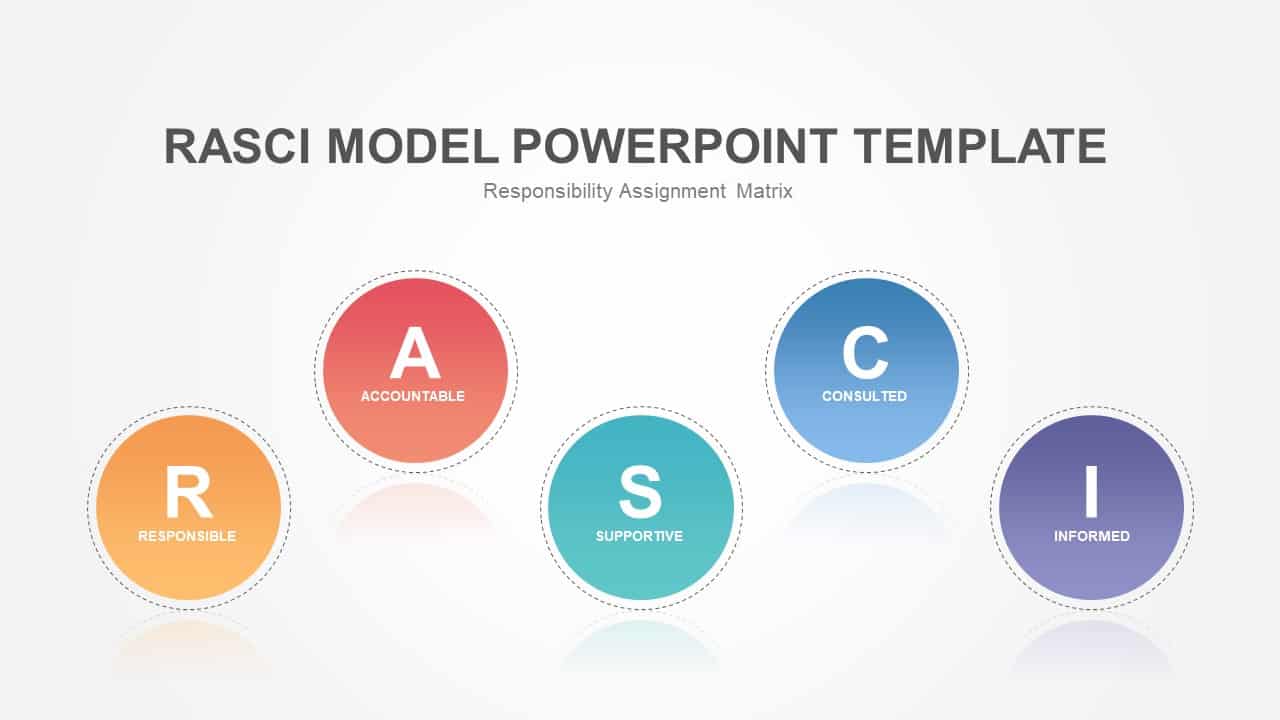
RASCI Assignment Matrix Infographic Template for PowerPoint & Google Slides
Infographics
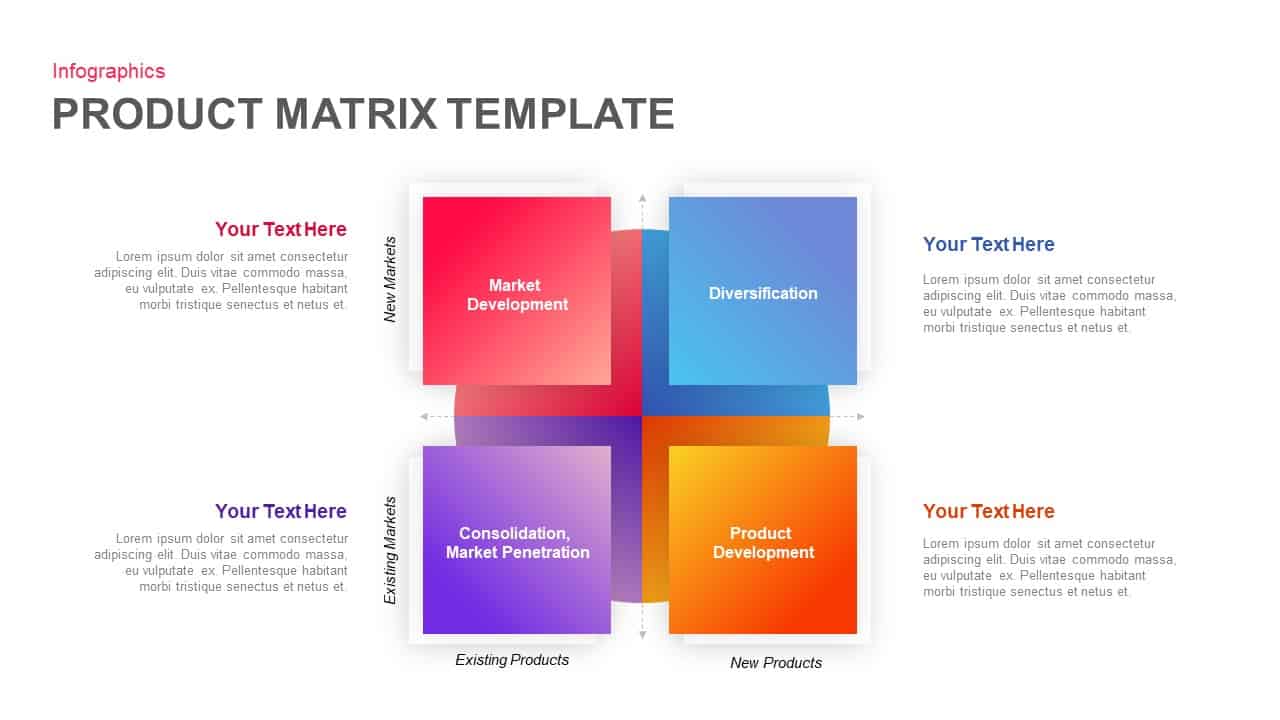
Product Market Expansion Matrix Template for PowerPoint & Google Slides
Business
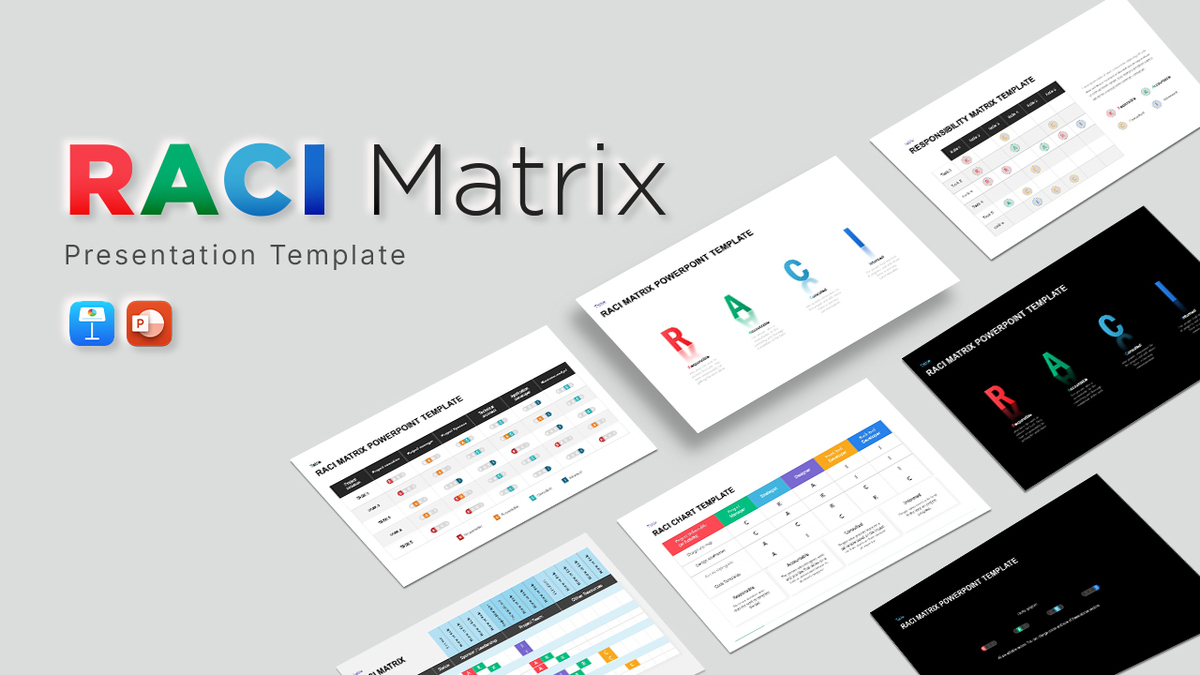
RASCI Responsibility Matrix Chart Template for PowerPoint & Google Slides
Business

Interactive RACI Responsibility Matrix Template for PowerPoint & Google Slides
Project
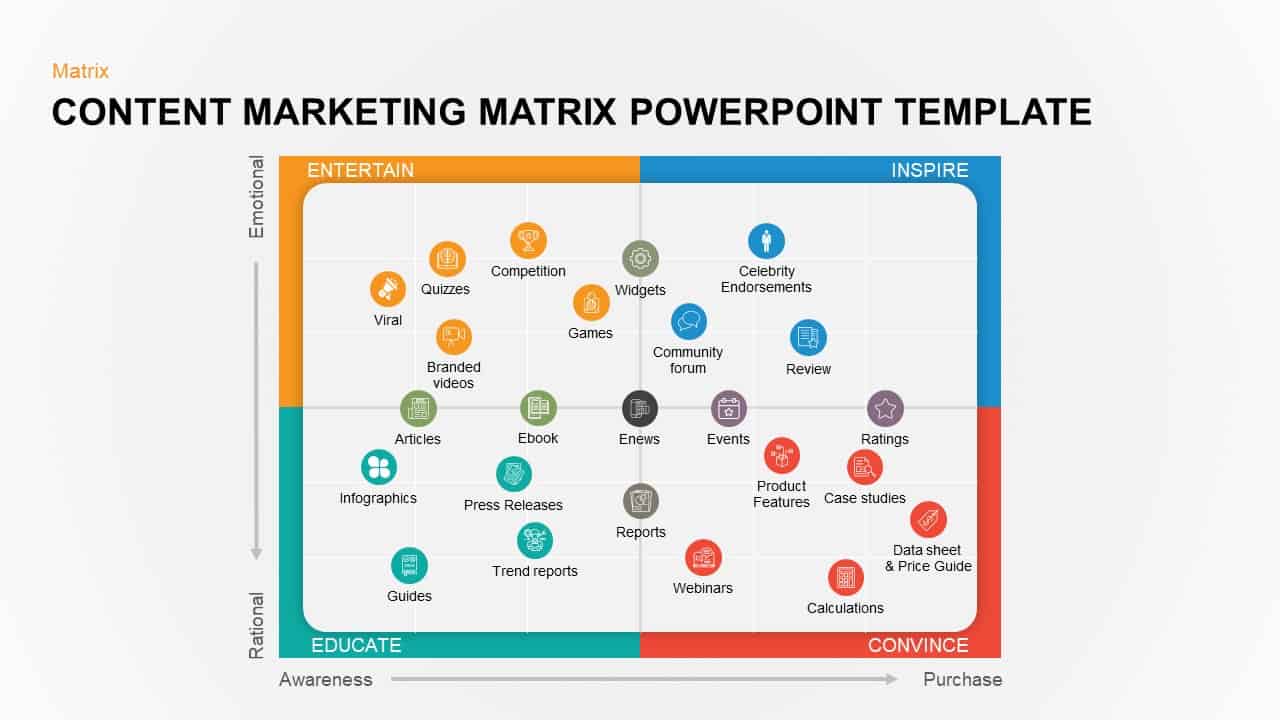
Colorful Content Marketing Matrix Template for PowerPoint & Google Slides
Comparison
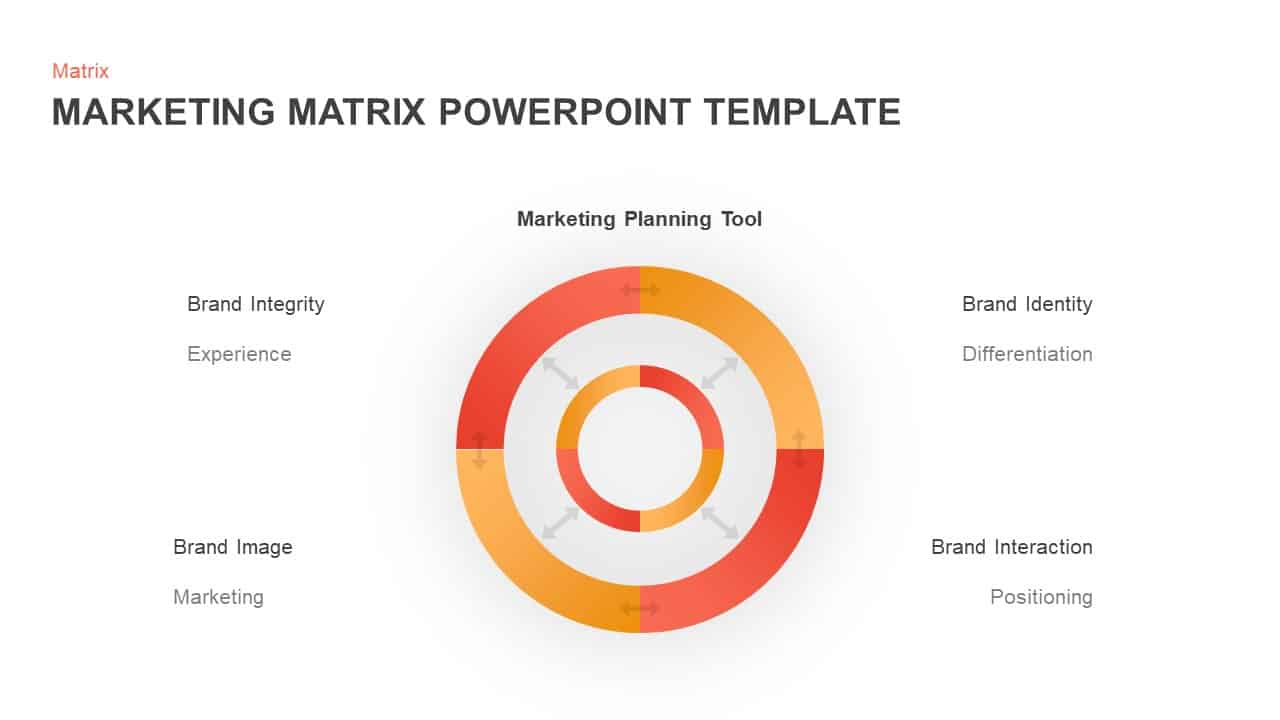
Concentric Marketing Matrix Slide Template for PowerPoint & Google Slides
Circular
Three-Year Strategic Plan Matrix Template for PowerPoint & Google Slides
Timeline
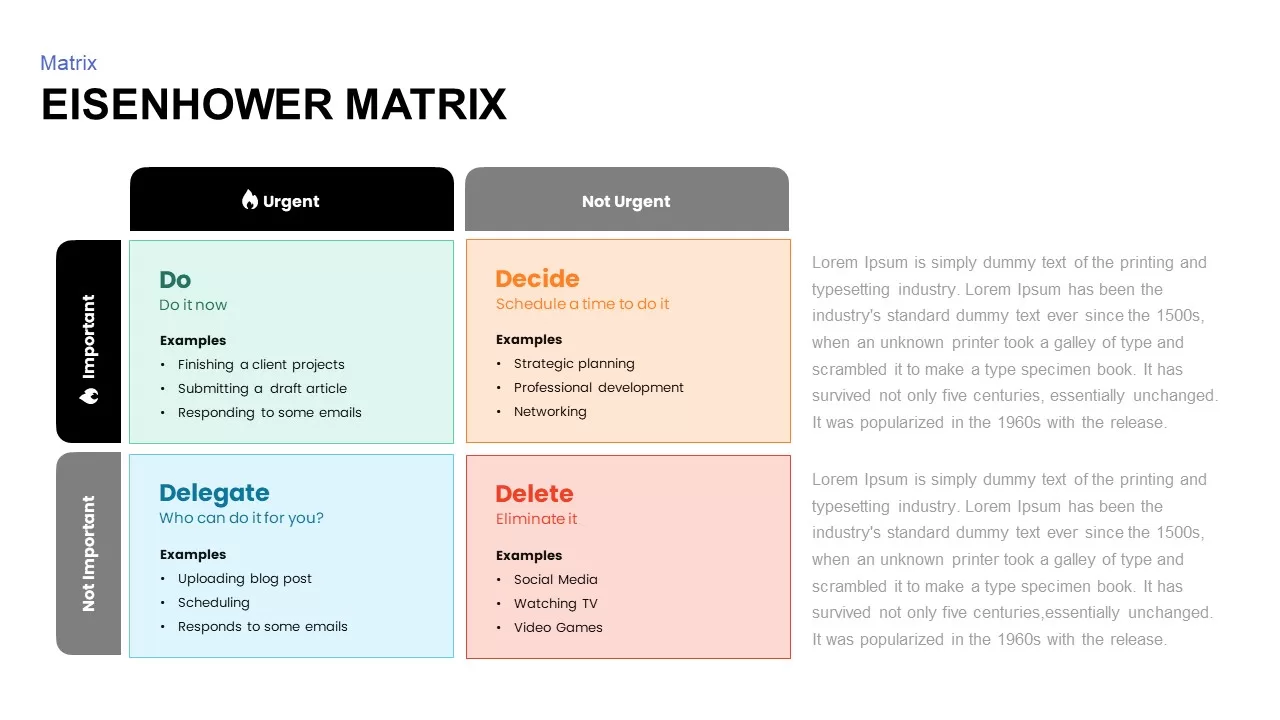
Eisenhower Matrix Task Prioritization Template for PowerPoint & Google Slides
Comparison Chart
RASCI Responsibility Assignment Matrix Template for PowerPoint & Google Slides
Project
Strategic ADL Matrix by Industry Life Cycle & Position Template for PowerPoint & Google Slides
Business Strategy
Ansoff Growth Matrix Strategy Diagram Template for PowerPoint & Google Slides
Business Strategy
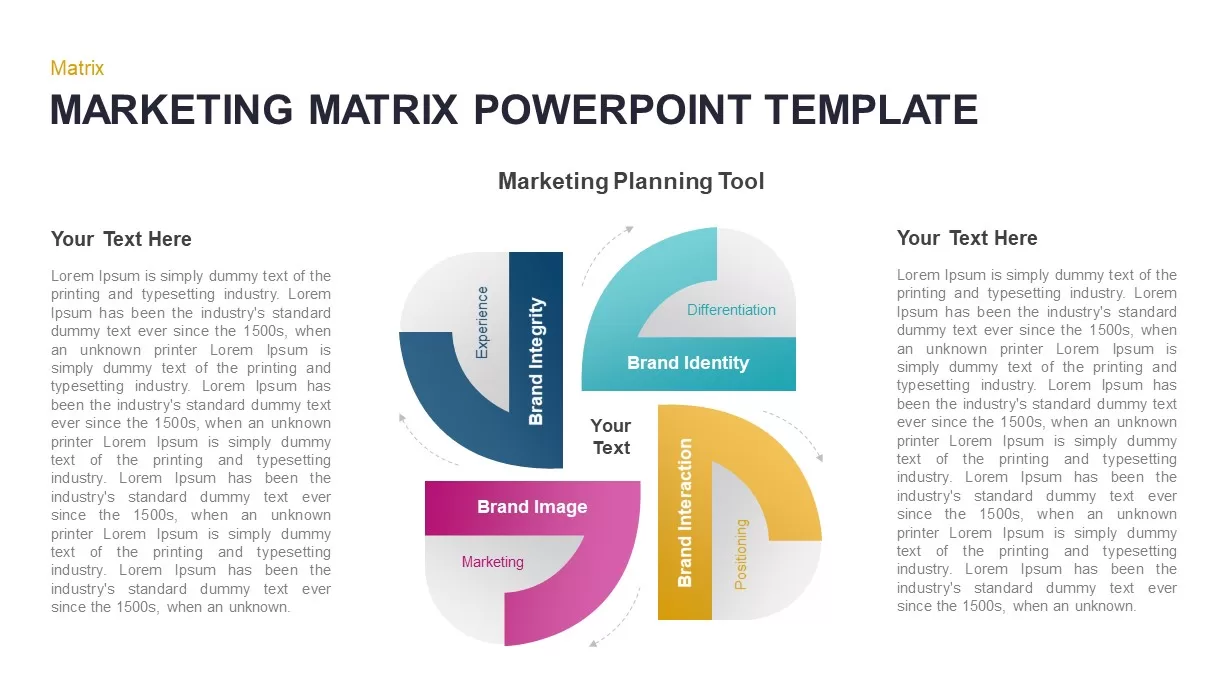
Marketing Matrix Brand Quadrant Diagram Template for PowerPoint & Google Slides
Process
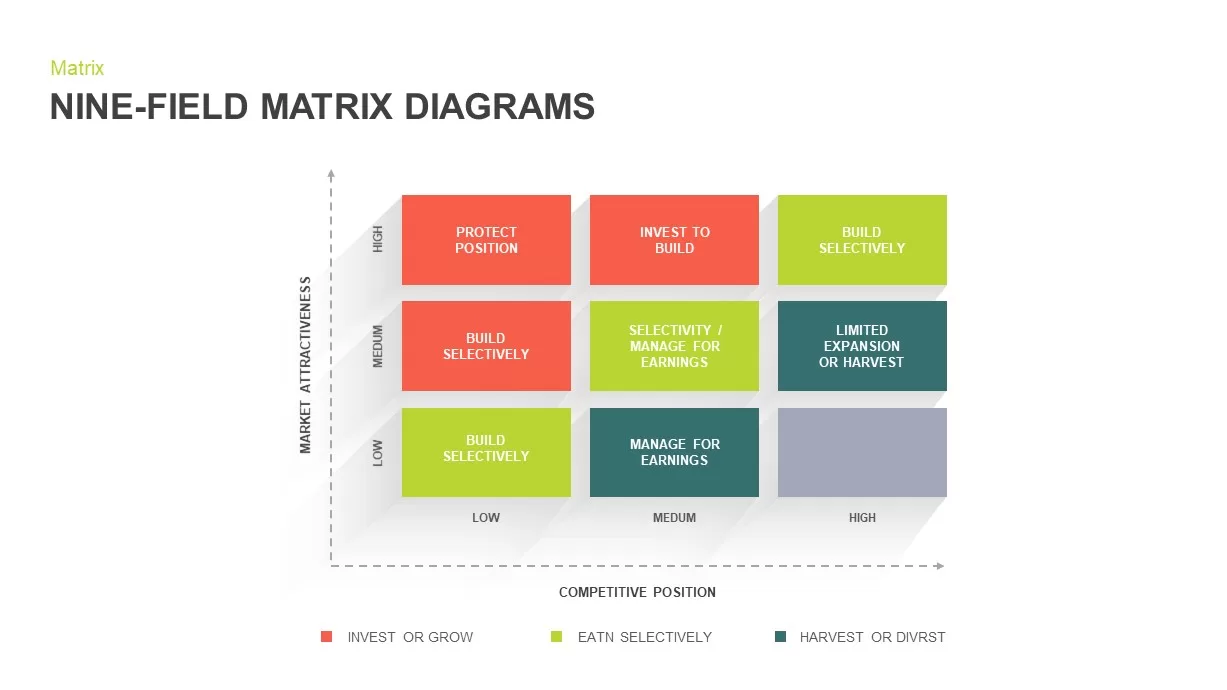
Nine-Field Matrix Diagrams Collection Template for PowerPoint & Google Slides
Comparison Chart
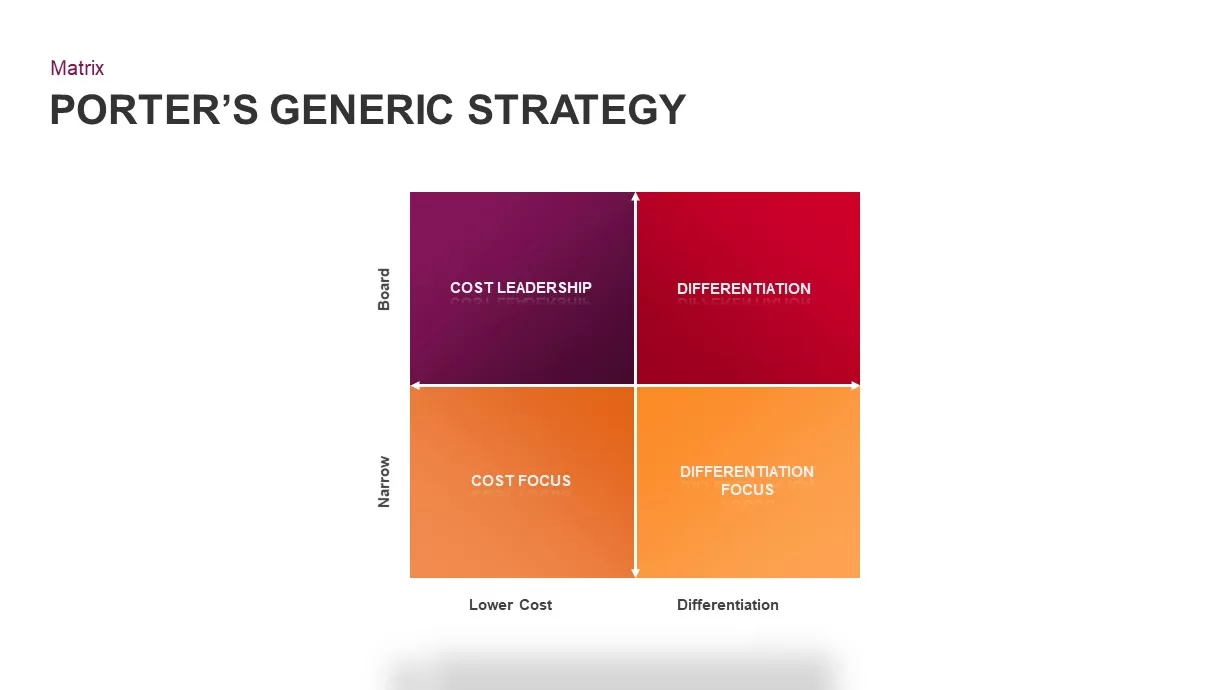
Porter’s Generic Strategy Matrix Diagram Template for PowerPoint & Google Slides
Competitor Analysis
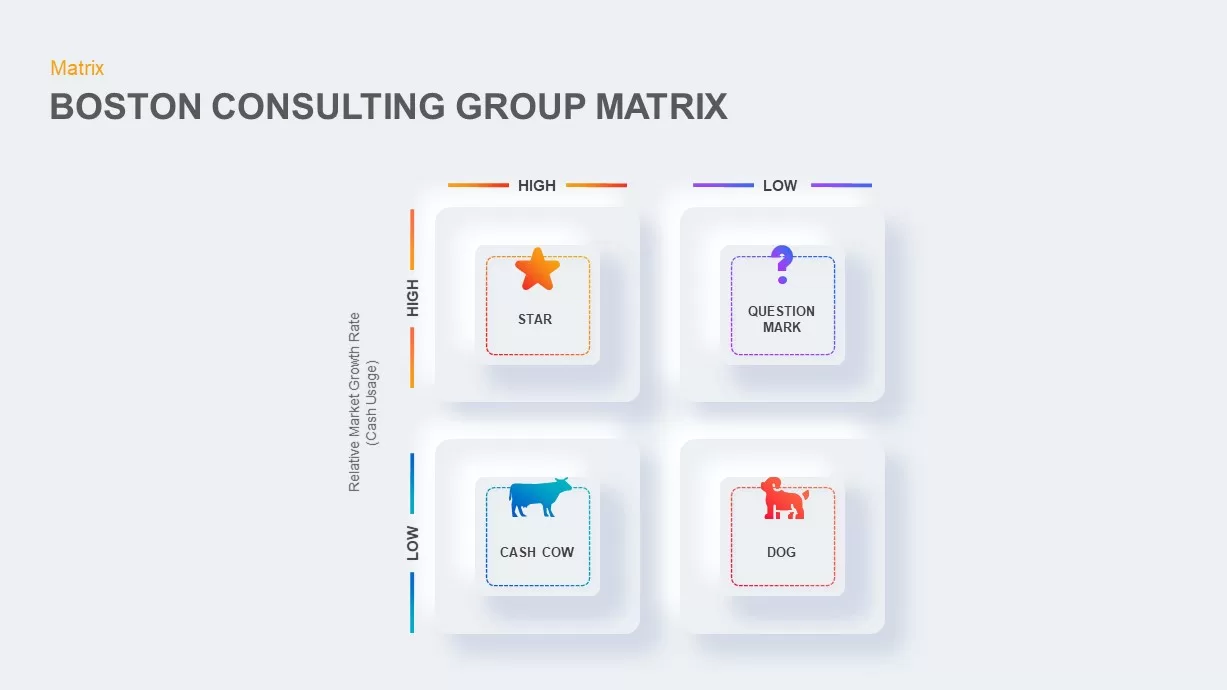
Boston Consulting Group Matrix Diagram Template for PowerPoint & Google Slides
BCG
Editable Four-Quadrant TOWS Matrix Template for PowerPoint & Google Slides
Opportunities Challenges
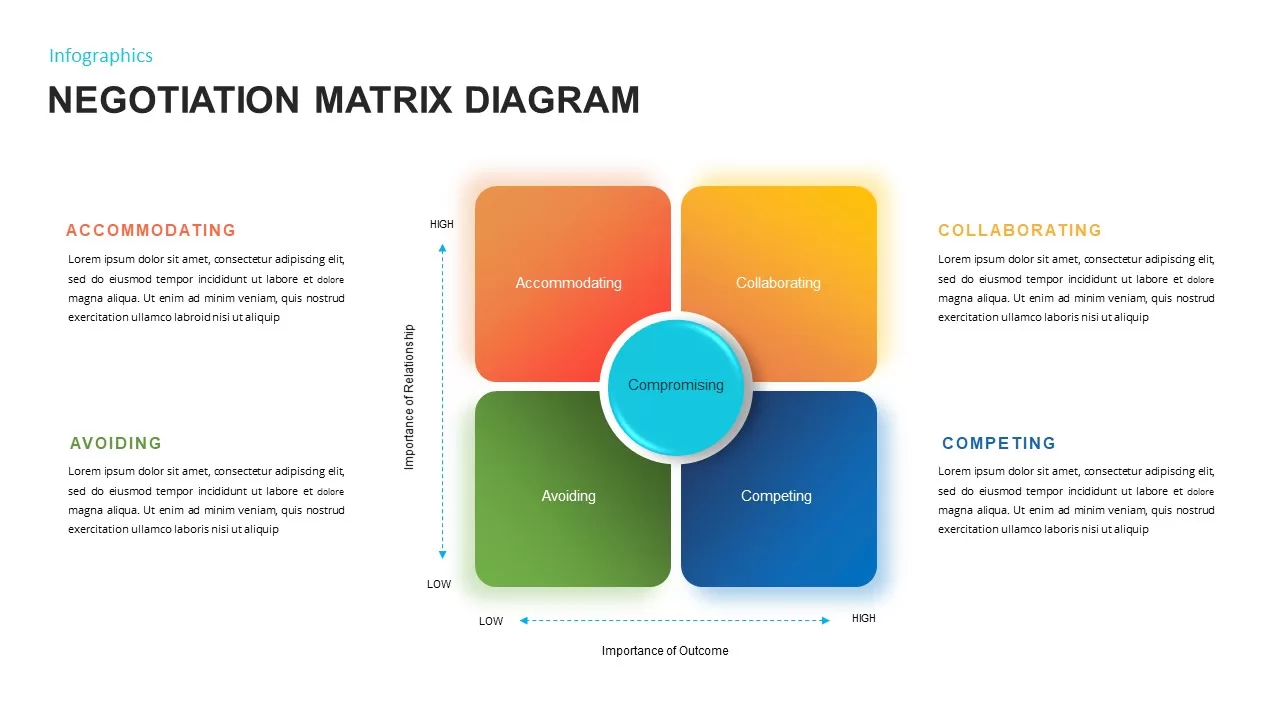
Negotiation Matrix Diagram Template for PowerPoint & Google Slides
Business
Eisenhower Matrix Decision-Making template for PowerPoint & Google Slides
Infographics
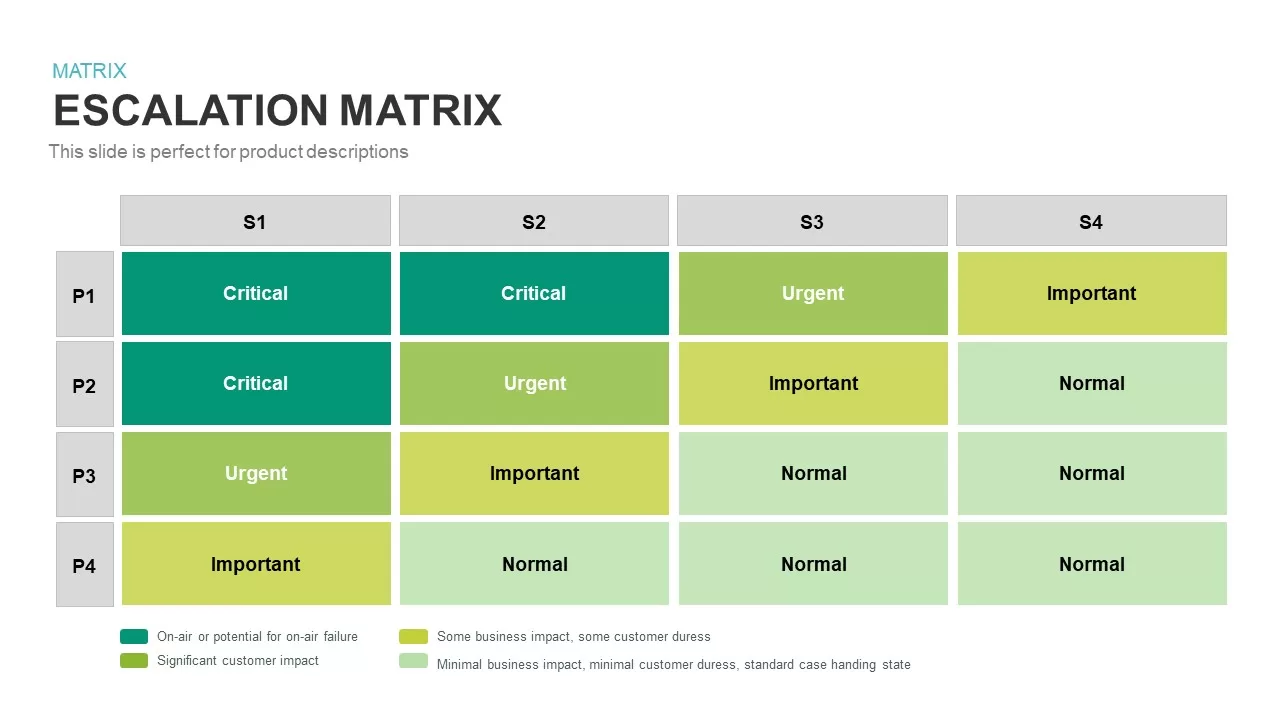
Escalation Matrix template for PowerPoint & Google Slides
Business
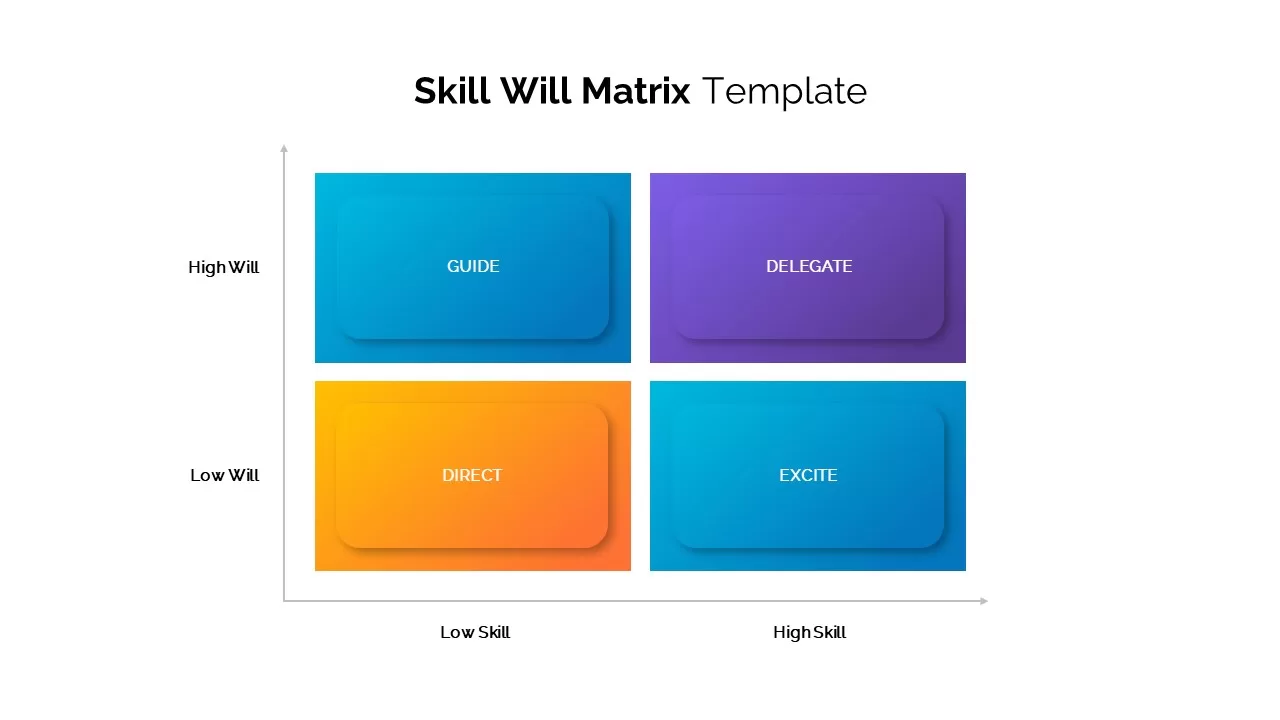
Skill Will Matrix Template for PowerPoint & Google Slides
Infographics
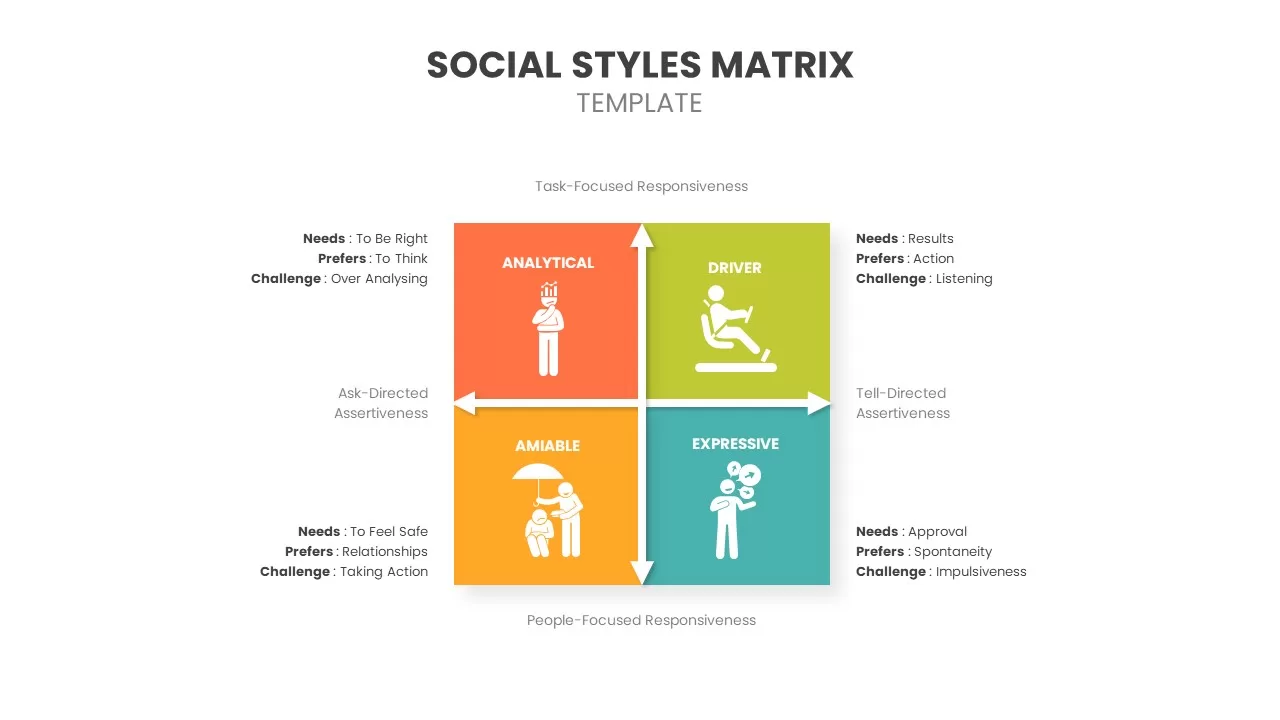
Social Styles Matrix Template for PowerPoint & Google Slides
Business
Pugh Matrix Decision Comparison Chart Template for PowerPoint & Google Slides
Comparison Chart
30 60 90 Day Plan Matrix Table Template for PowerPoint & Google Slides
Timeline
Executive 30-60-90 Day Plan Matrix Template for PowerPoint & Google Slides
Timeline
Executive 30-60-90 Day Plan Matrix Template for PowerPoint & Google Slides
Timeline
Competitive Landscape Matrix Template for PowerPoint & Google Slides
Comparison
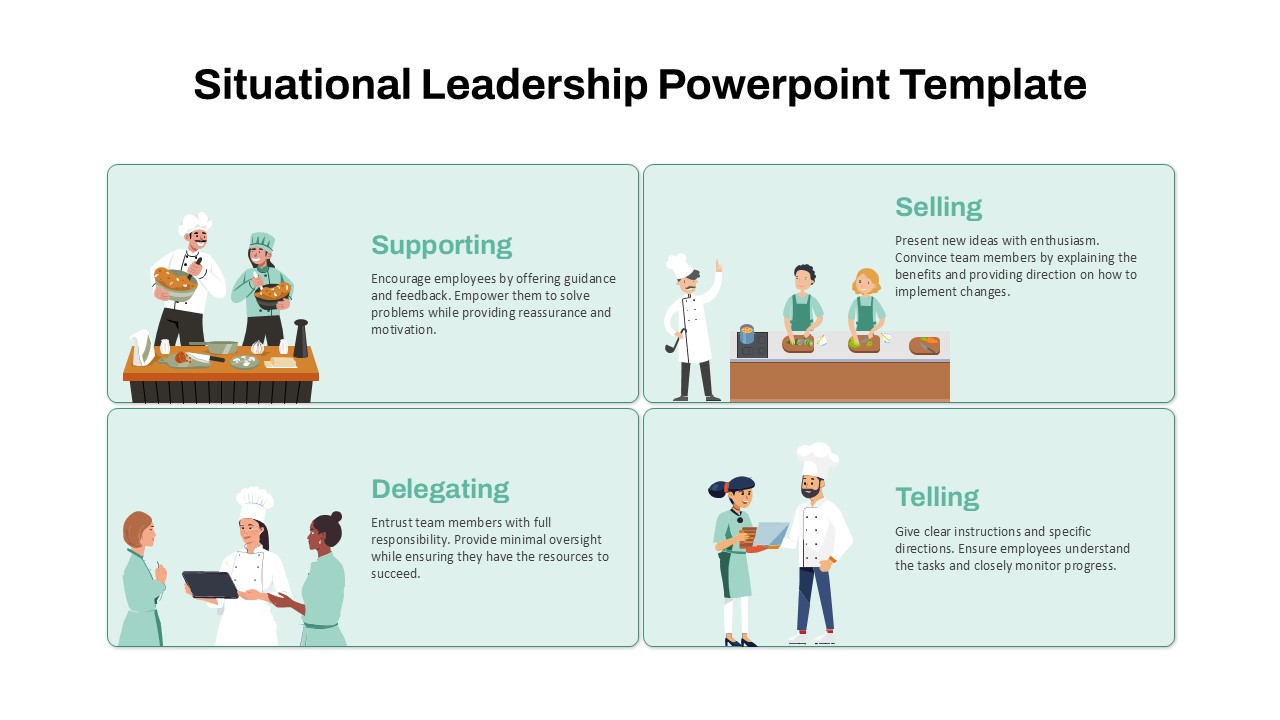
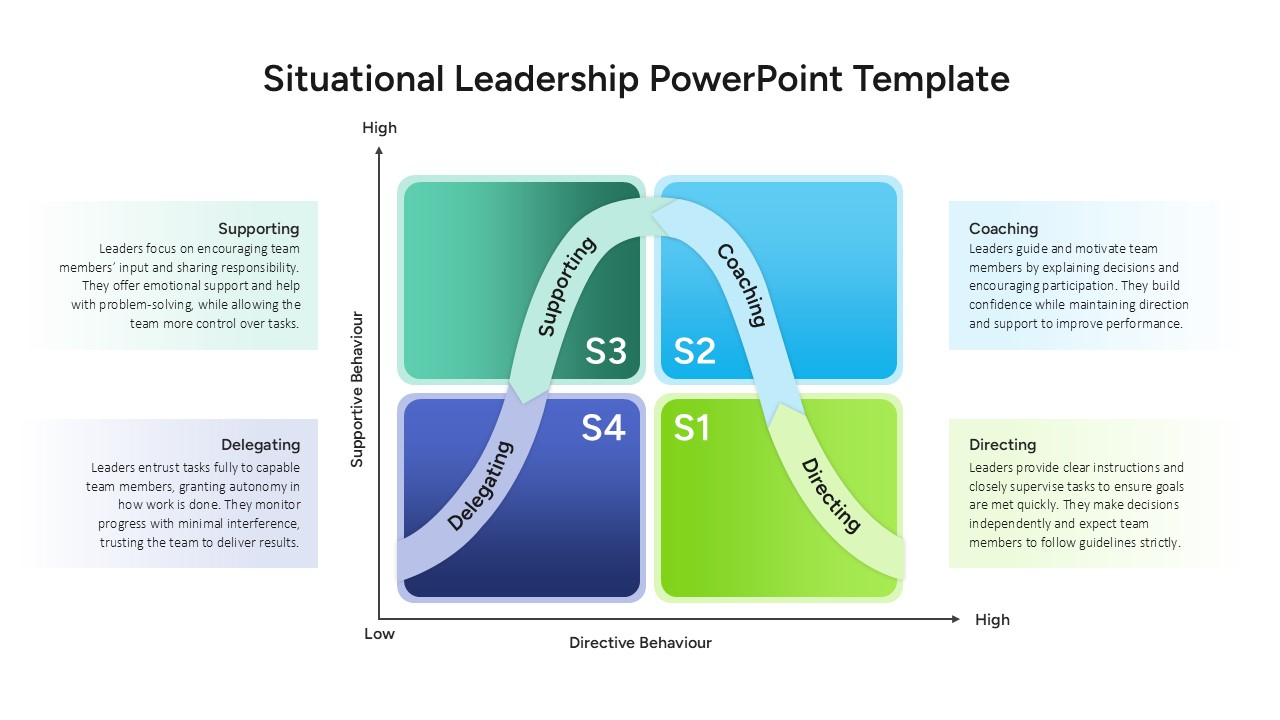
Situational Leadership Matrix Template for PowerPoint & Google Slides
Process
9-Box Matrix for Performance & Potential Template for PowerPoint & Google Slides
Employee Performance
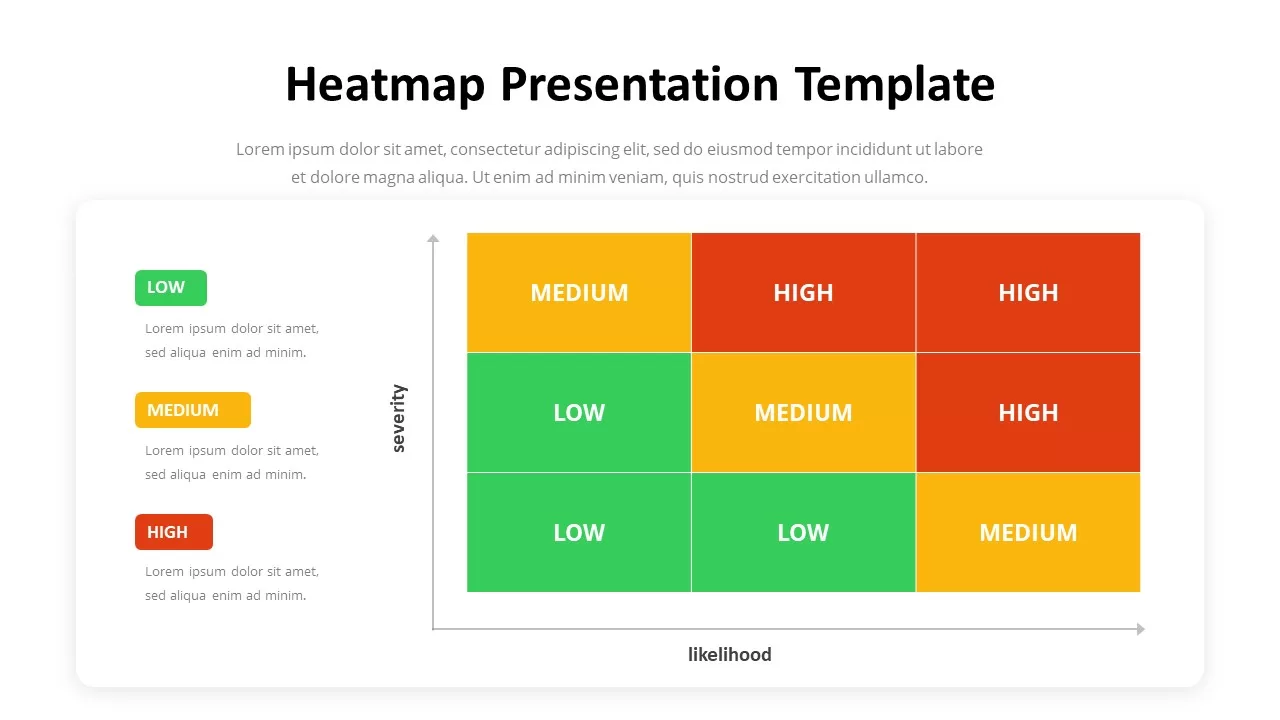
Professional Interactive Heat Map Matrix Template for PowerPoint & Google Slides
Comparison Chart
Heat Map Risk Matrix Dashboard Template for PowerPoint & Google Slides
Comparison Chart
Risk Assessment Heatmap Matrix Slide Template for PowerPoint & Google Slides
Comparison Chart
Heatmap Matrix Template for PowerPoint & Google Slides
Maps
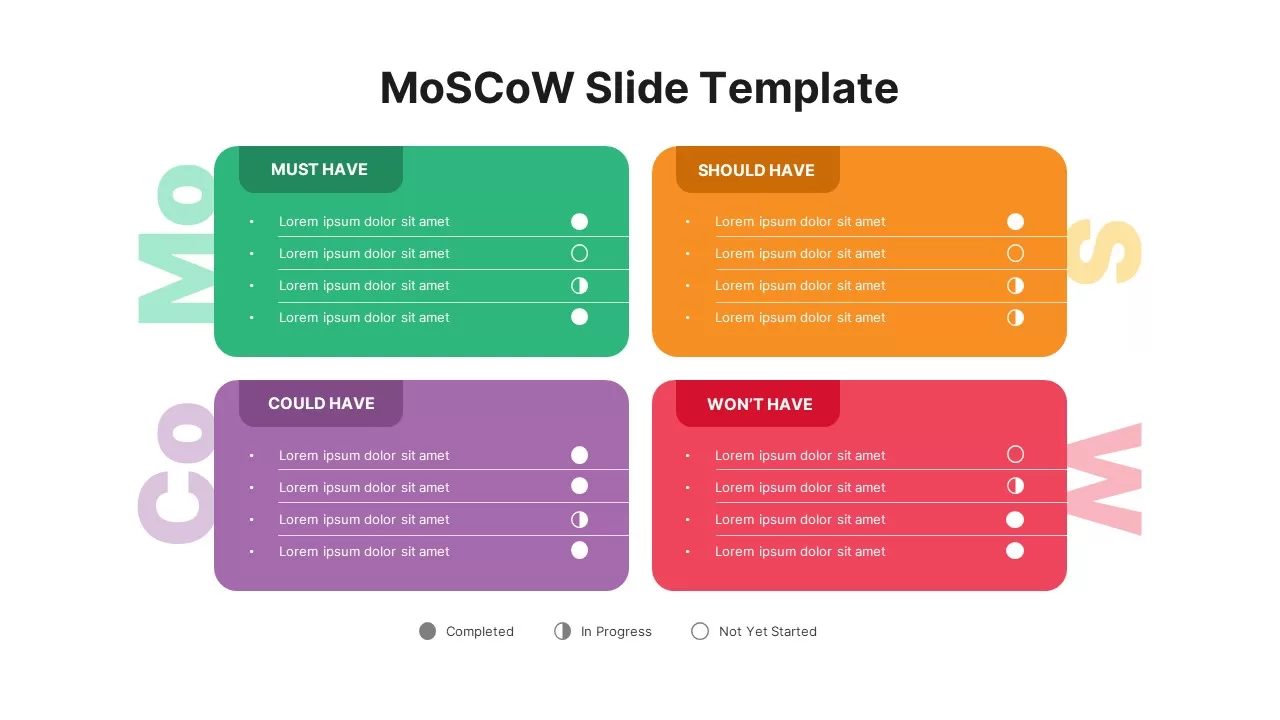
MoSCoW Prioritization Matrix Slide Template for PowerPoint & Google Slides
Business Strategy
Vendor Comparison Matrix with High-Level Requirements template for PowerPoint & Google Slides
Comparison Chart
MABA Attractiveness Matrix Chart Template for PowerPoint & Google Slides
Comparison Chart
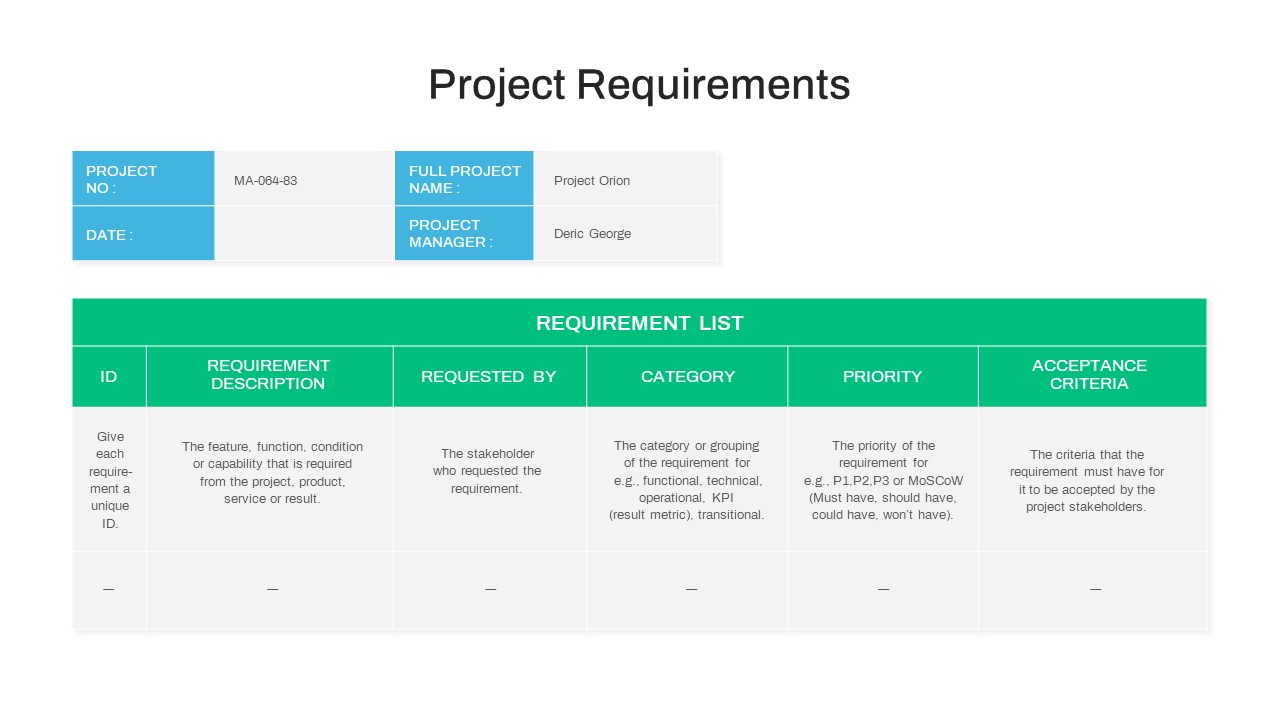
Project Requirements Matrix Template for PowerPoint & Google Slides
Project
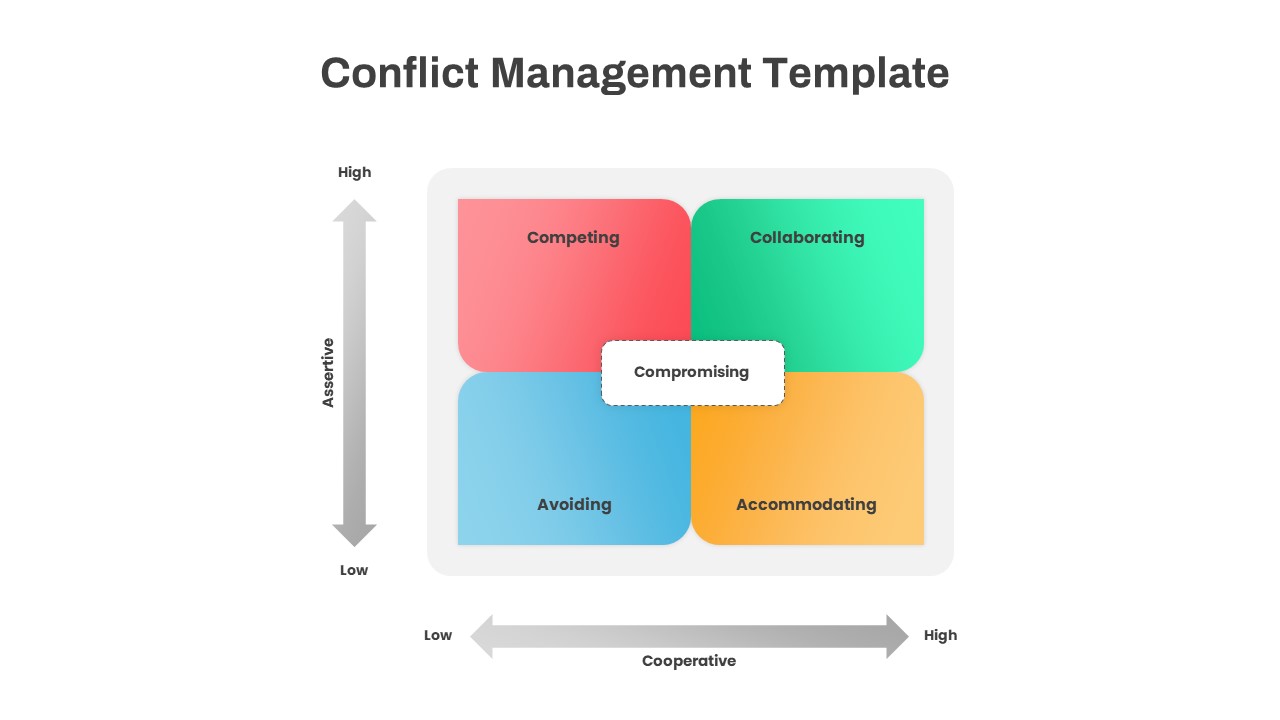
Conflict Management Matrix Template for PowerPoint & Google Slides
Leadership
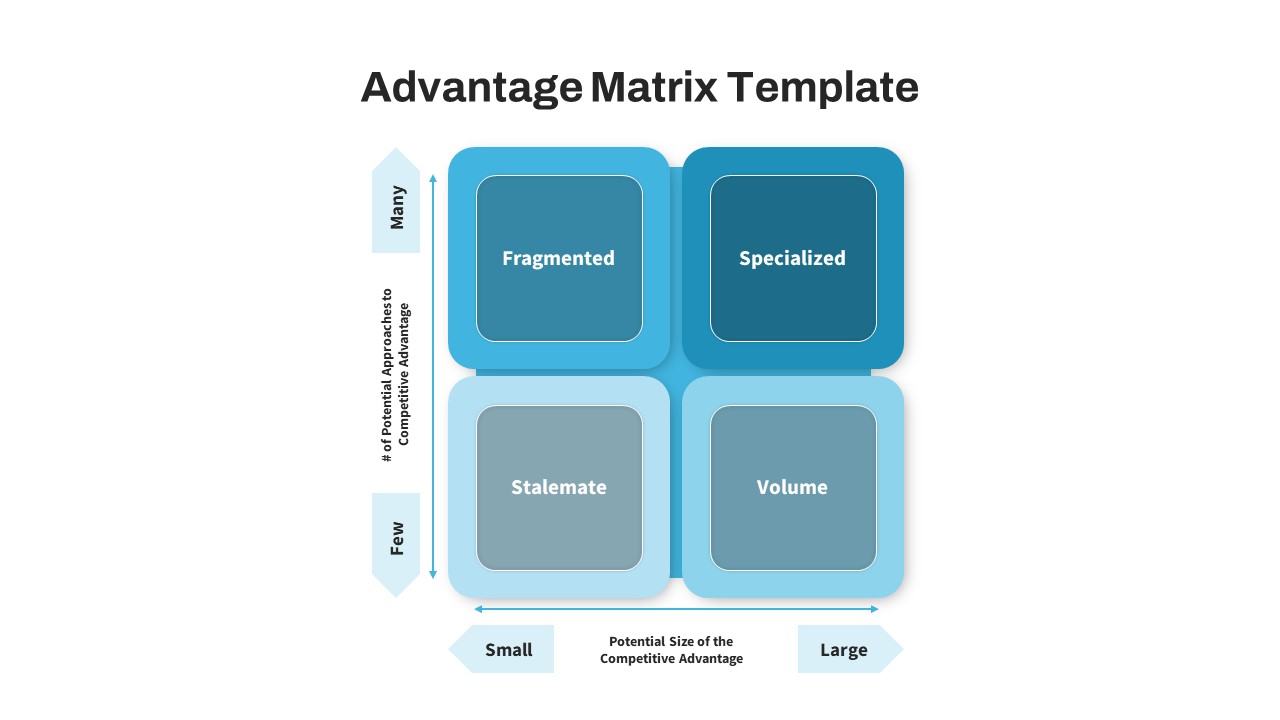
Advantage Matrix 2×2 Framework Template for PowerPoint & Google Slides
Competitor Analysis
Bubble Chart Scatter, Diagram & Matrix Template for PowerPoint & Google Slides
Comparison Chart
Business Growth Strategies Matrix Template for PowerPoint & Google Slides
Comparison
Free Competitor Analysis Matrix Template for PowerPoint & Google Slides
Competitor Analysis
Free
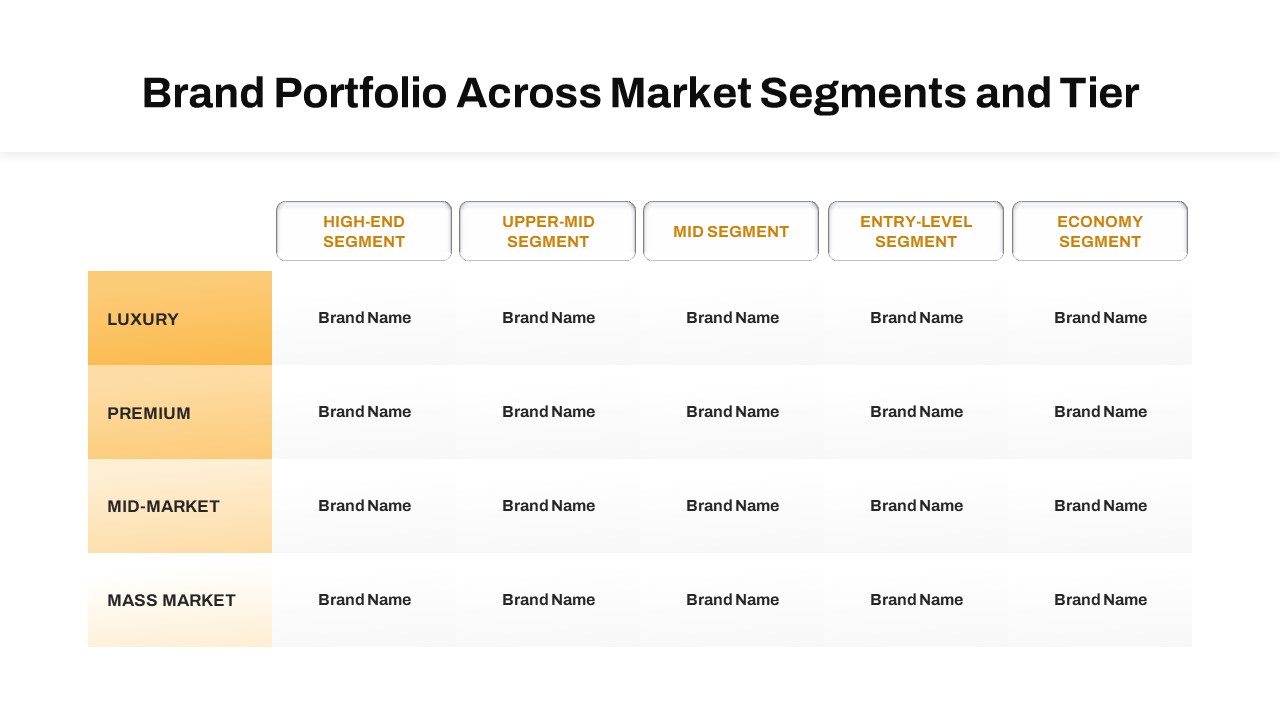
Brand Portfolio Matrix: Segments & Tiers Template for PowerPoint & Google Slides
Business Report
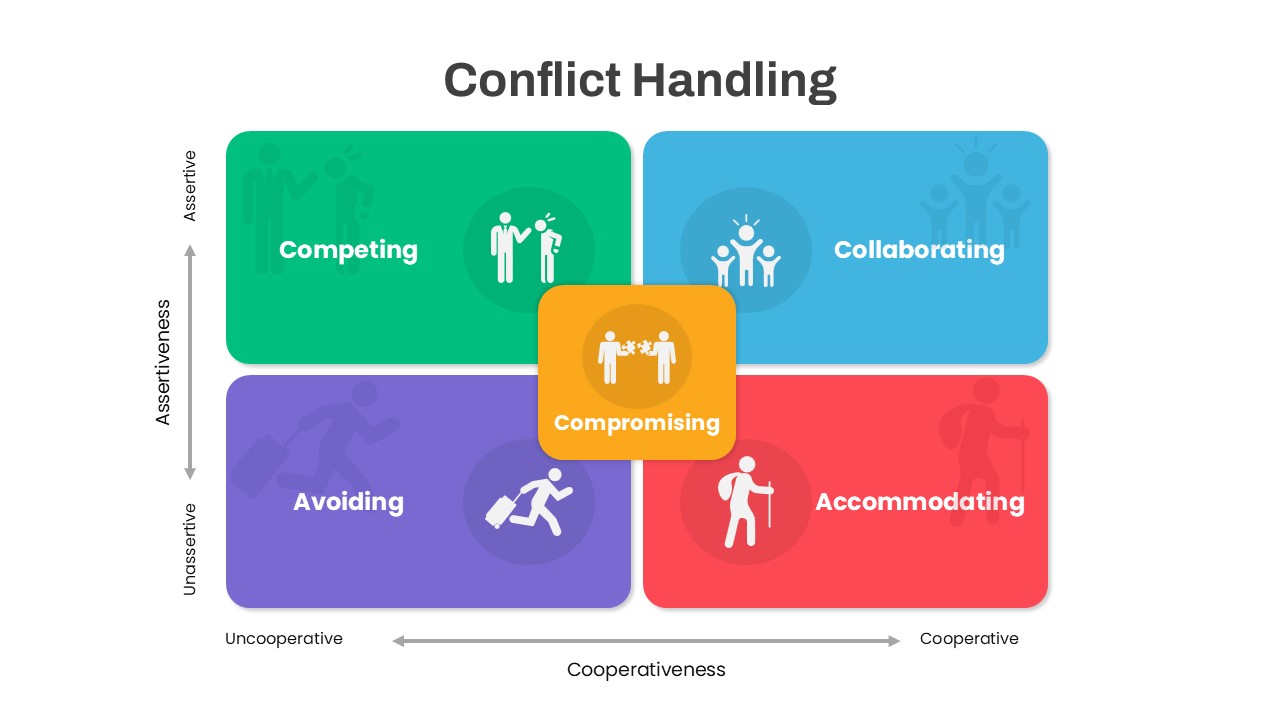
Colorful Conflict Handling Matrix Template for PowerPoint & Google Slides
Comparison
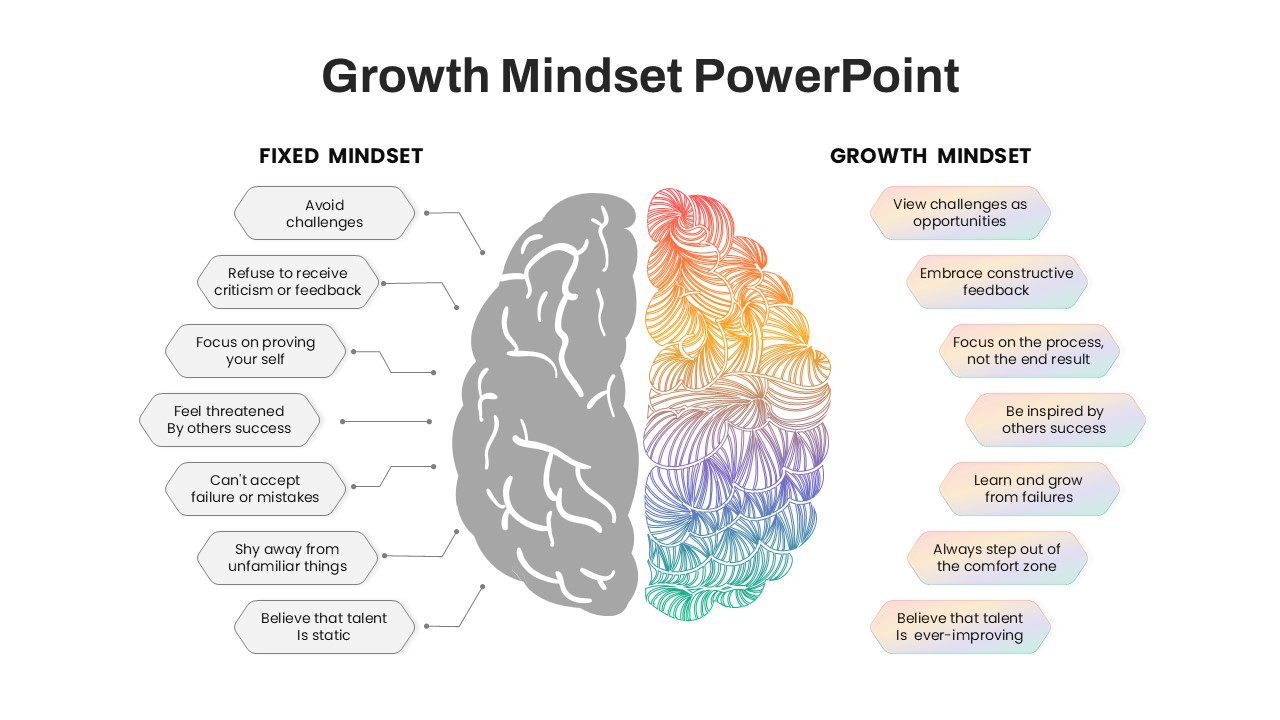
Fixed vs Growth Mindset Matrix Template for PowerPoint & Google Slides
Comparison
Decision Matrix & Prioritization Chart Template for PowerPoint & Google Slides
Comparison Chart
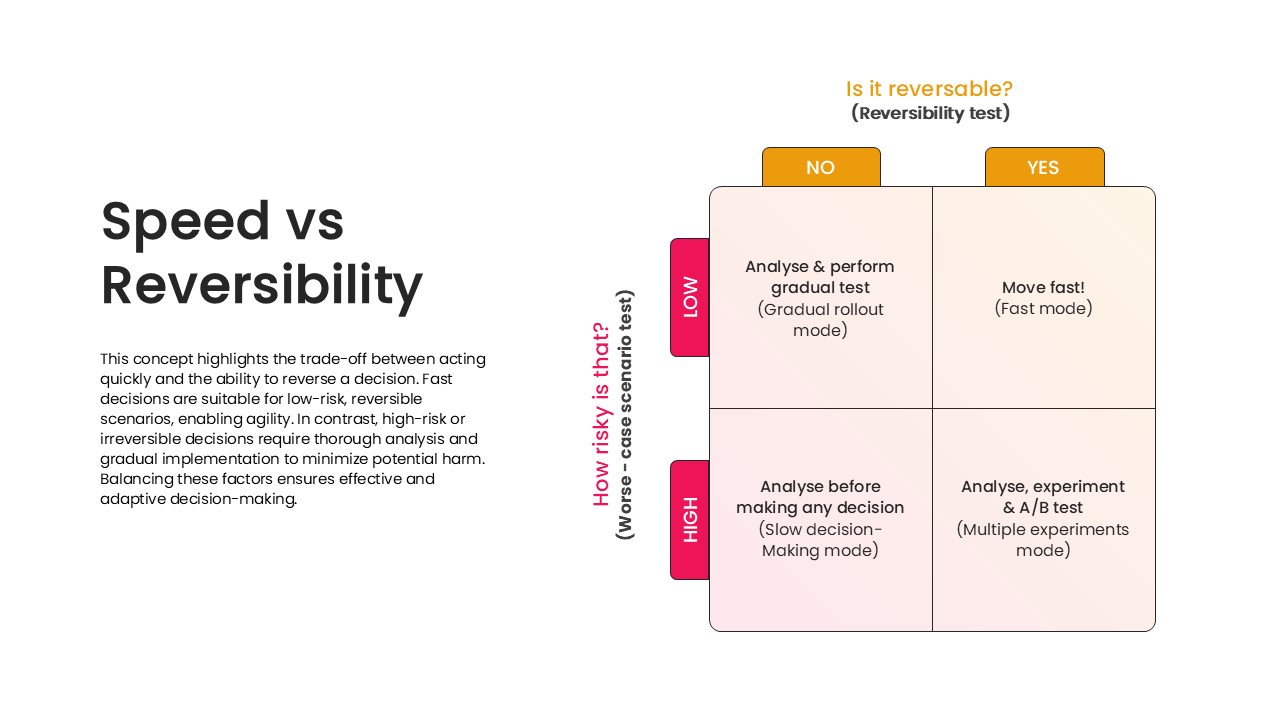
Speed vs Reversibility Decision Matrix Template for PowerPoint & Google Slides
Comparison
Ansoff Growth Matrix Professional Template for PowerPoint & Google Slides
Comparison
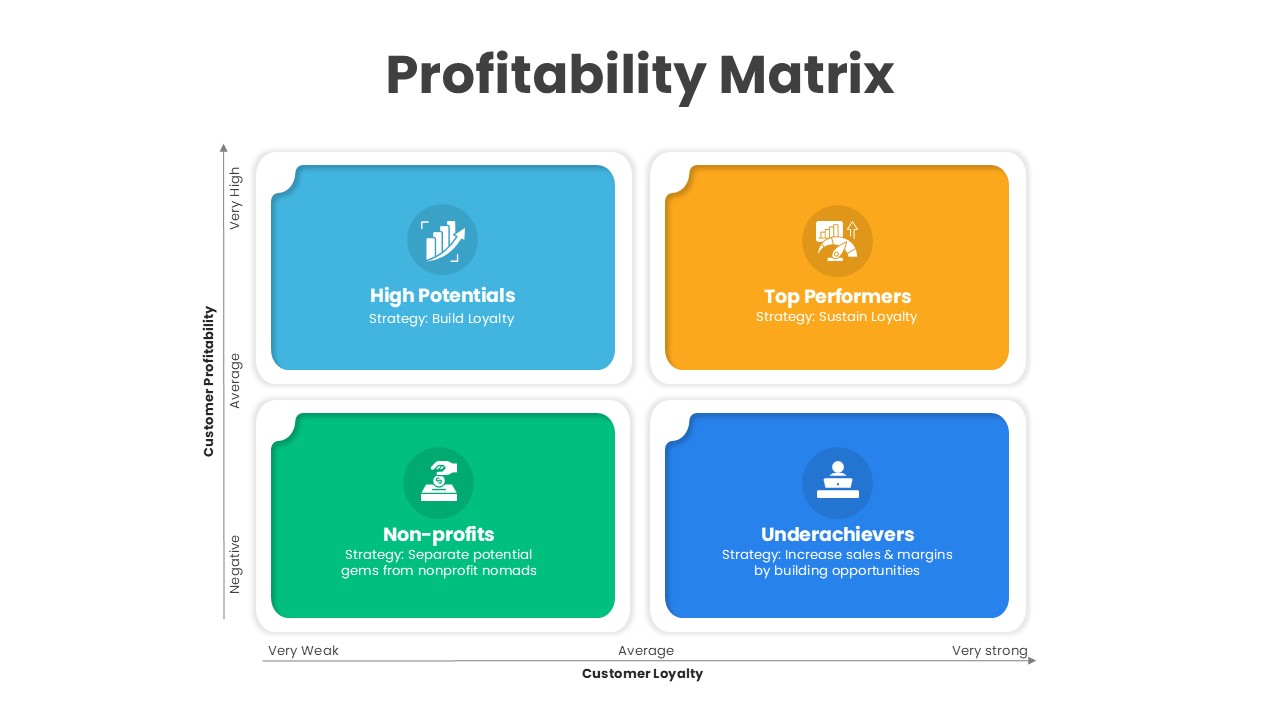
Customer Loyalty & Profitability Matrix Template for PowerPoint & Google Slides
Comparison
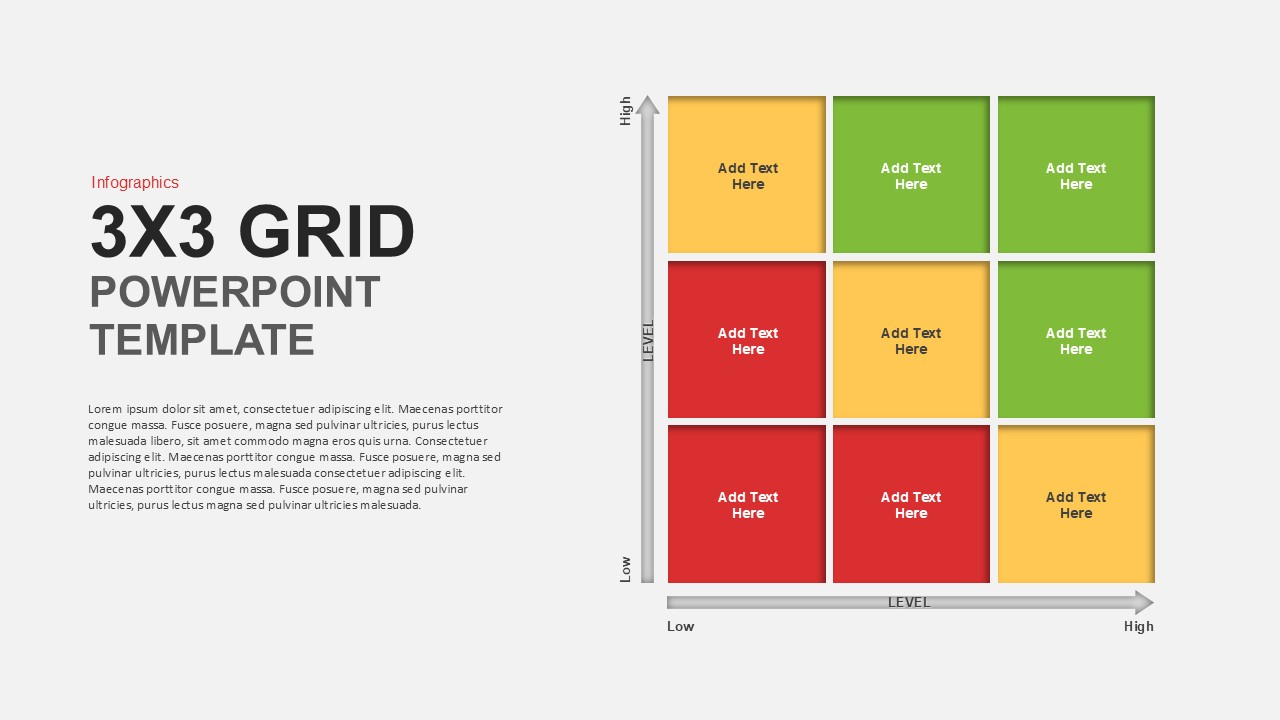
Matrix Grid Diagram Template for PowerPoint & Google Slides
Comparison
Porter’s Generic Strategies Matrix Template for PowerPoint & Google Slides
Business Strategy
Maxi-Maxi Strategy Matrix SWOT Diagram Template for PowerPoint & Google Slides
SWOT
PAEI Leadership Roles 2×2 Matrix Diagram Template for PowerPoint & Google Slides
Business Models
2×2 Matrix PowerPoint & Google Slides Template
Business Models
Competitor Profile Matrix Comparison Template for PowerPoint & Google Slides
Comparison Chart
Confusion Matrix Diagram Overview Template for PowerPoint & Google Slides
Comparison
Risk Scoring & Ranking Heatmap Matrix Template for PowerPoint & Google Slides
Risk Management
Feasibility Matrix Comparison Chart Template for PowerPoint & Google Slides
Comparison Chart
Risk Probability and Impact Matrix Template for PowerPoint & Google Slides
Risk Management
Quantitative Risk Analysis Matrix template for PowerPoint & Google Slides
Risk Management
Build vs Buy Matrix Decision Framework template for PowerPoint & Google Slides
Business Strategy
Weighted Decision Matrix template for PowerPoint & Google Slides
Business Models
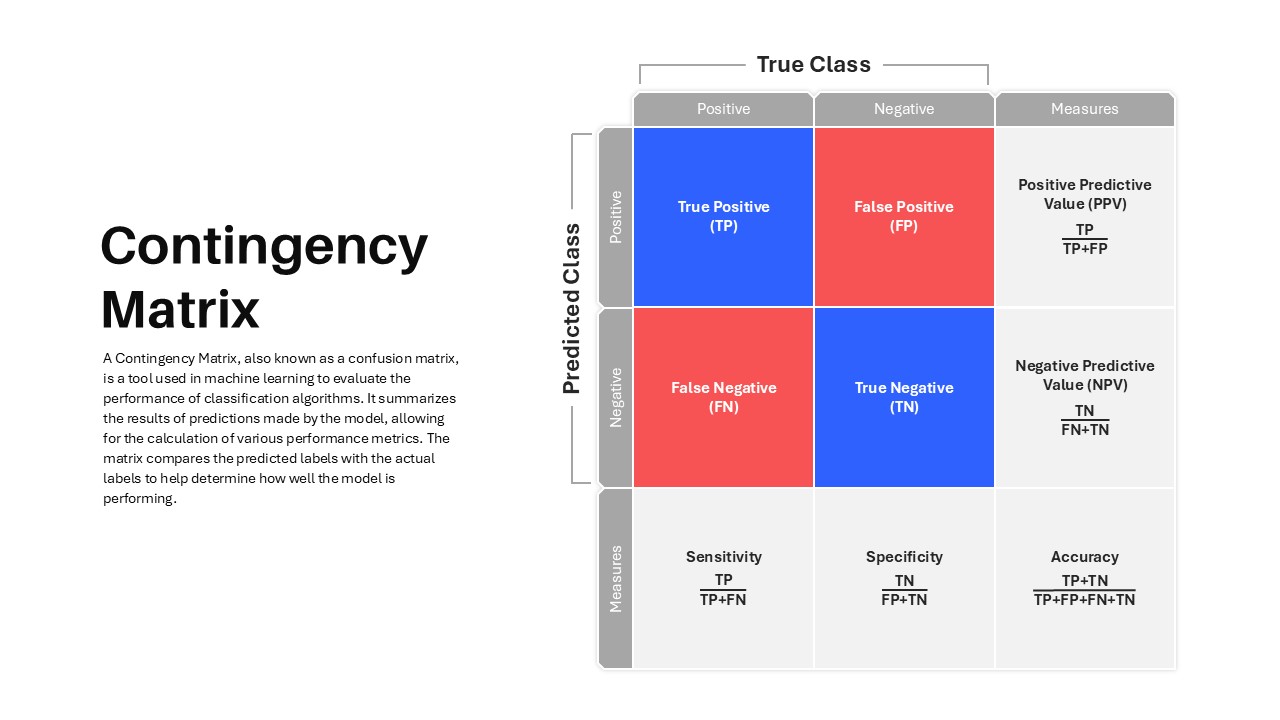
Contingency Matrix in Machine Learning template for PowerPoint & Google Slides
Technology
Situational Leadership Matrix Template for PowerPoint & Google Slides
Leadership
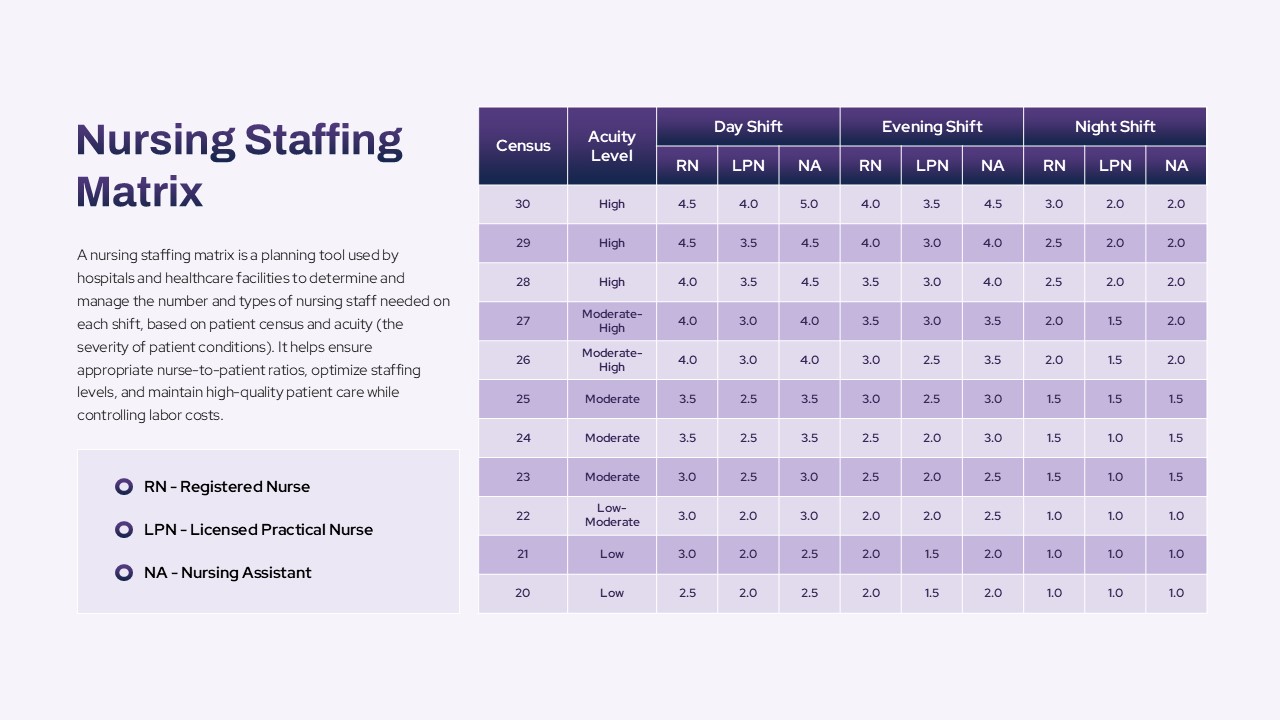
Nursing Staffing Matrix Planning Template for PowerPoint & Google Slides
Nursing
Disaster Response Role Matrix RACI Chart Template for PowerPoint & Google Slides
Project Status
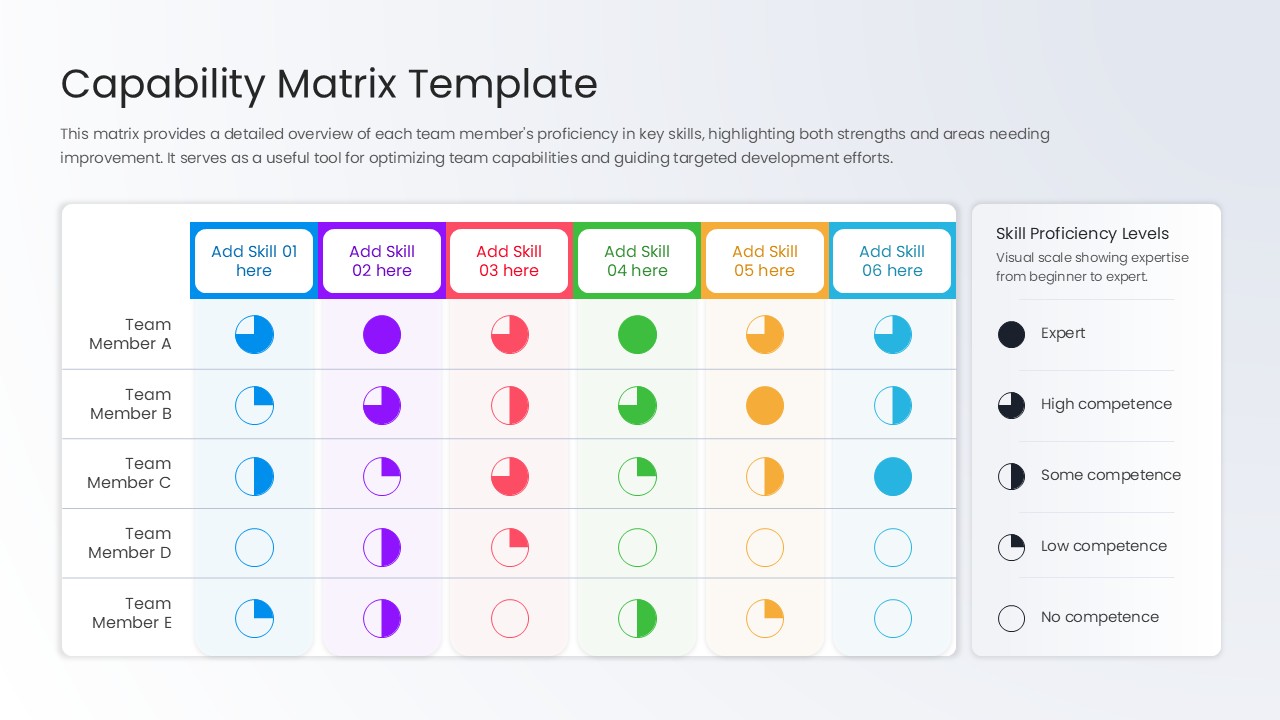
Capability Matrix Template for PowerPoint & Google Slides
HR
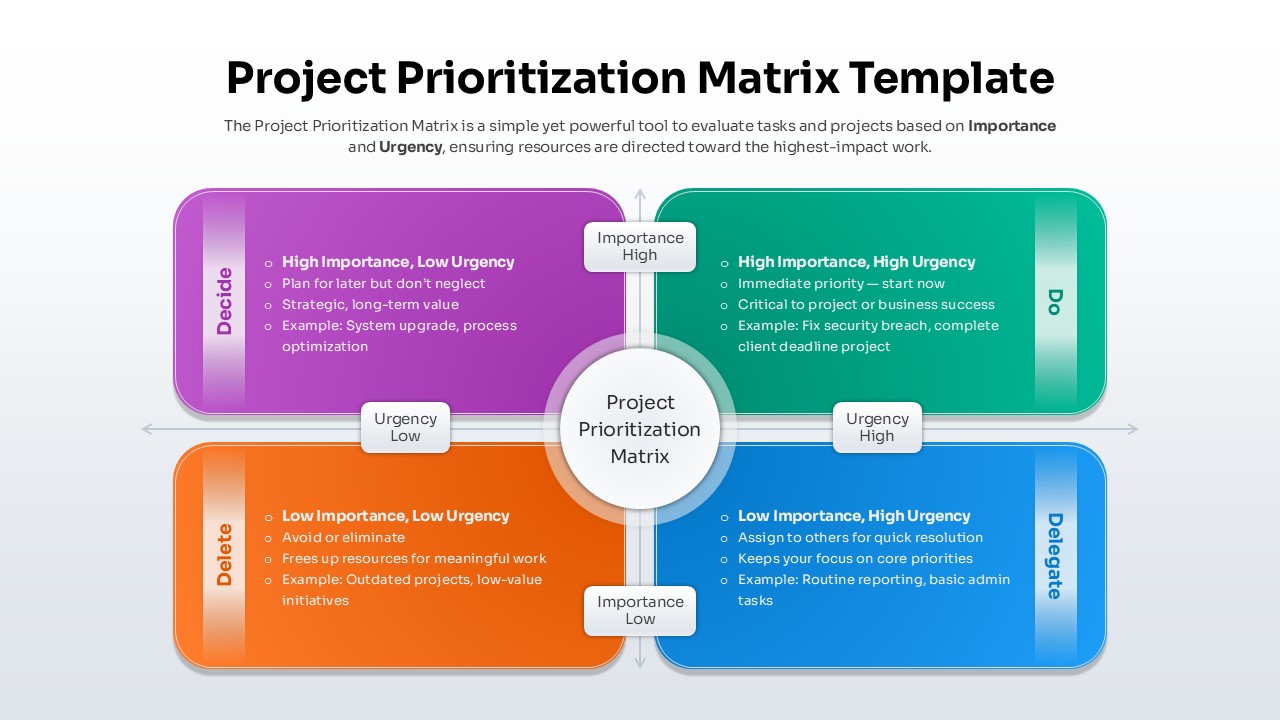
Project Prioritization Matrix Template for PowerPoint & Google Slides
Project
Personal SWOT Analysis Matrix Cards Template for PowerPoint & Google Slides
SWOT
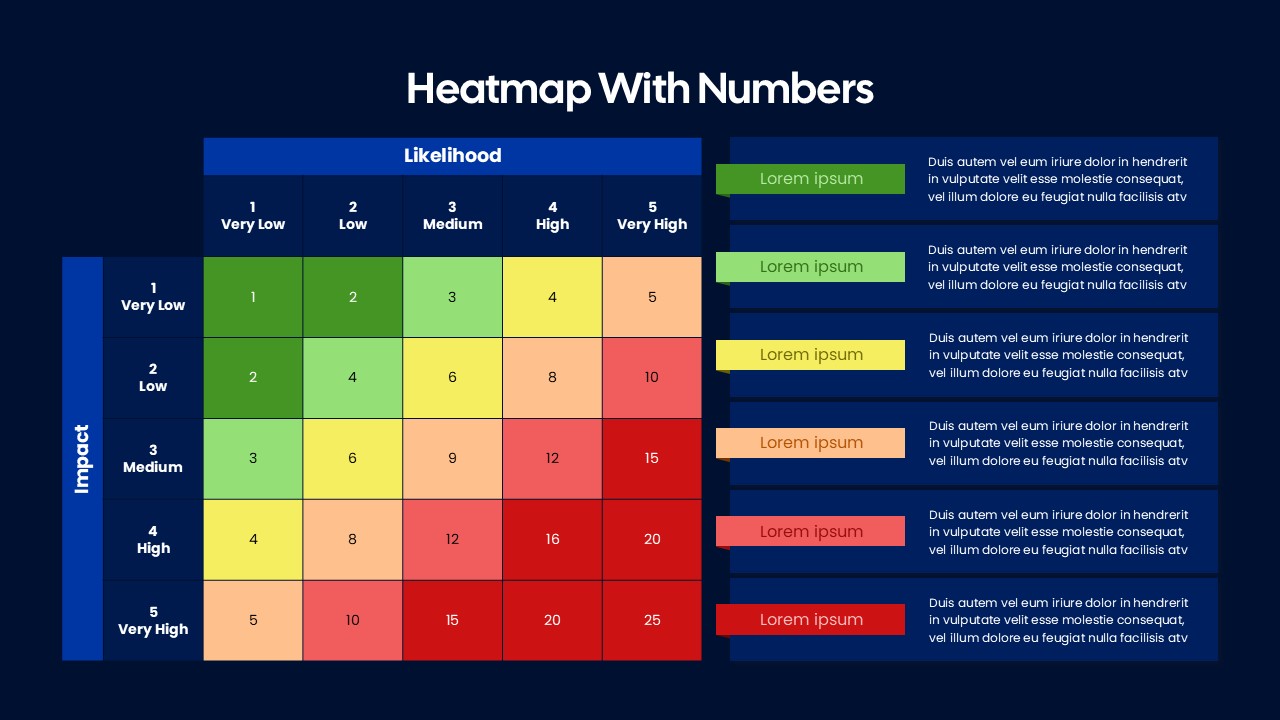
Heatmap Matrix with Numbers Template for PowerPoint & Google Slides
Project
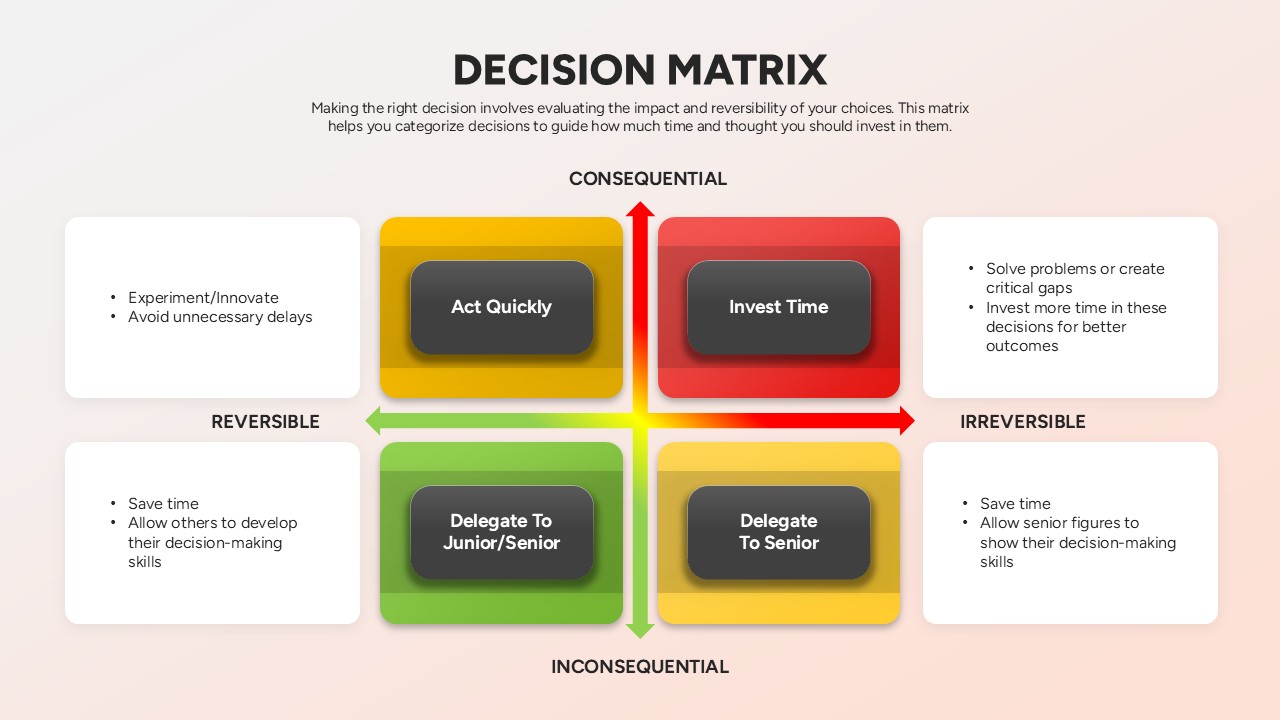
Decision Matrix Evaluation Framework Slide Template for PowerPoint & Google Slides
Leadership
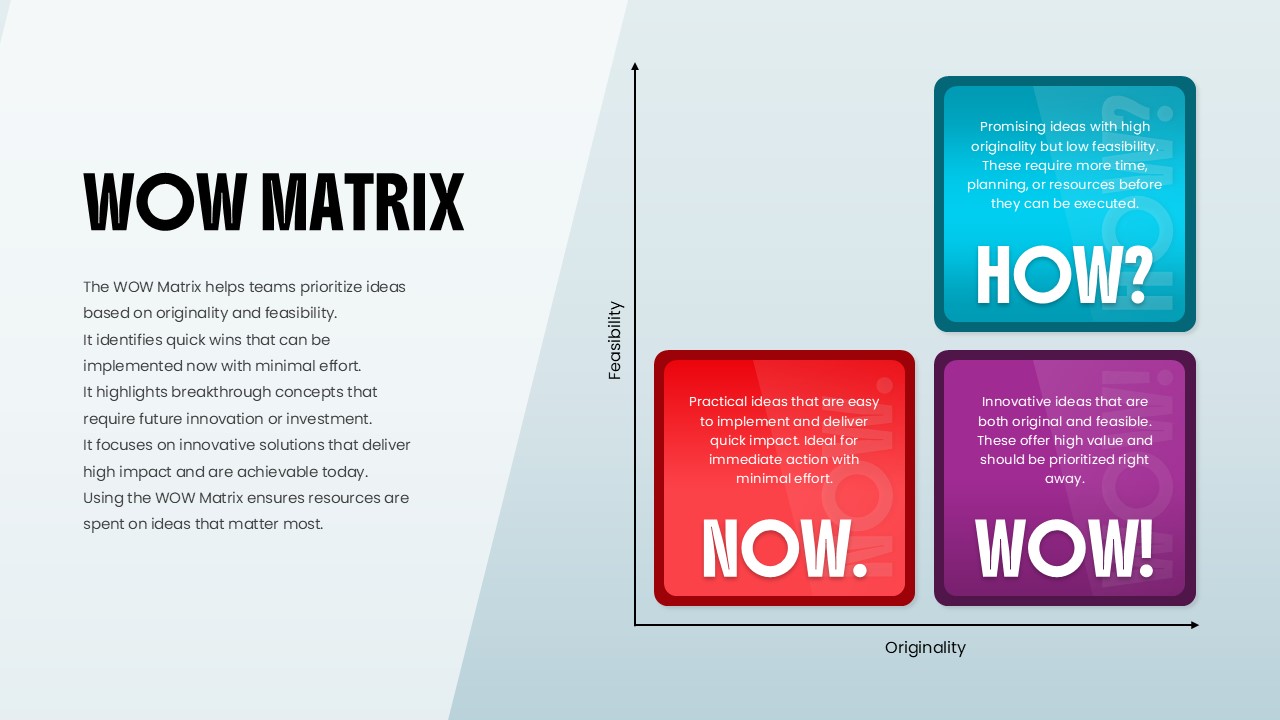
WOW Matrix Template for PowerPoint & Google Slides
Business Strategy

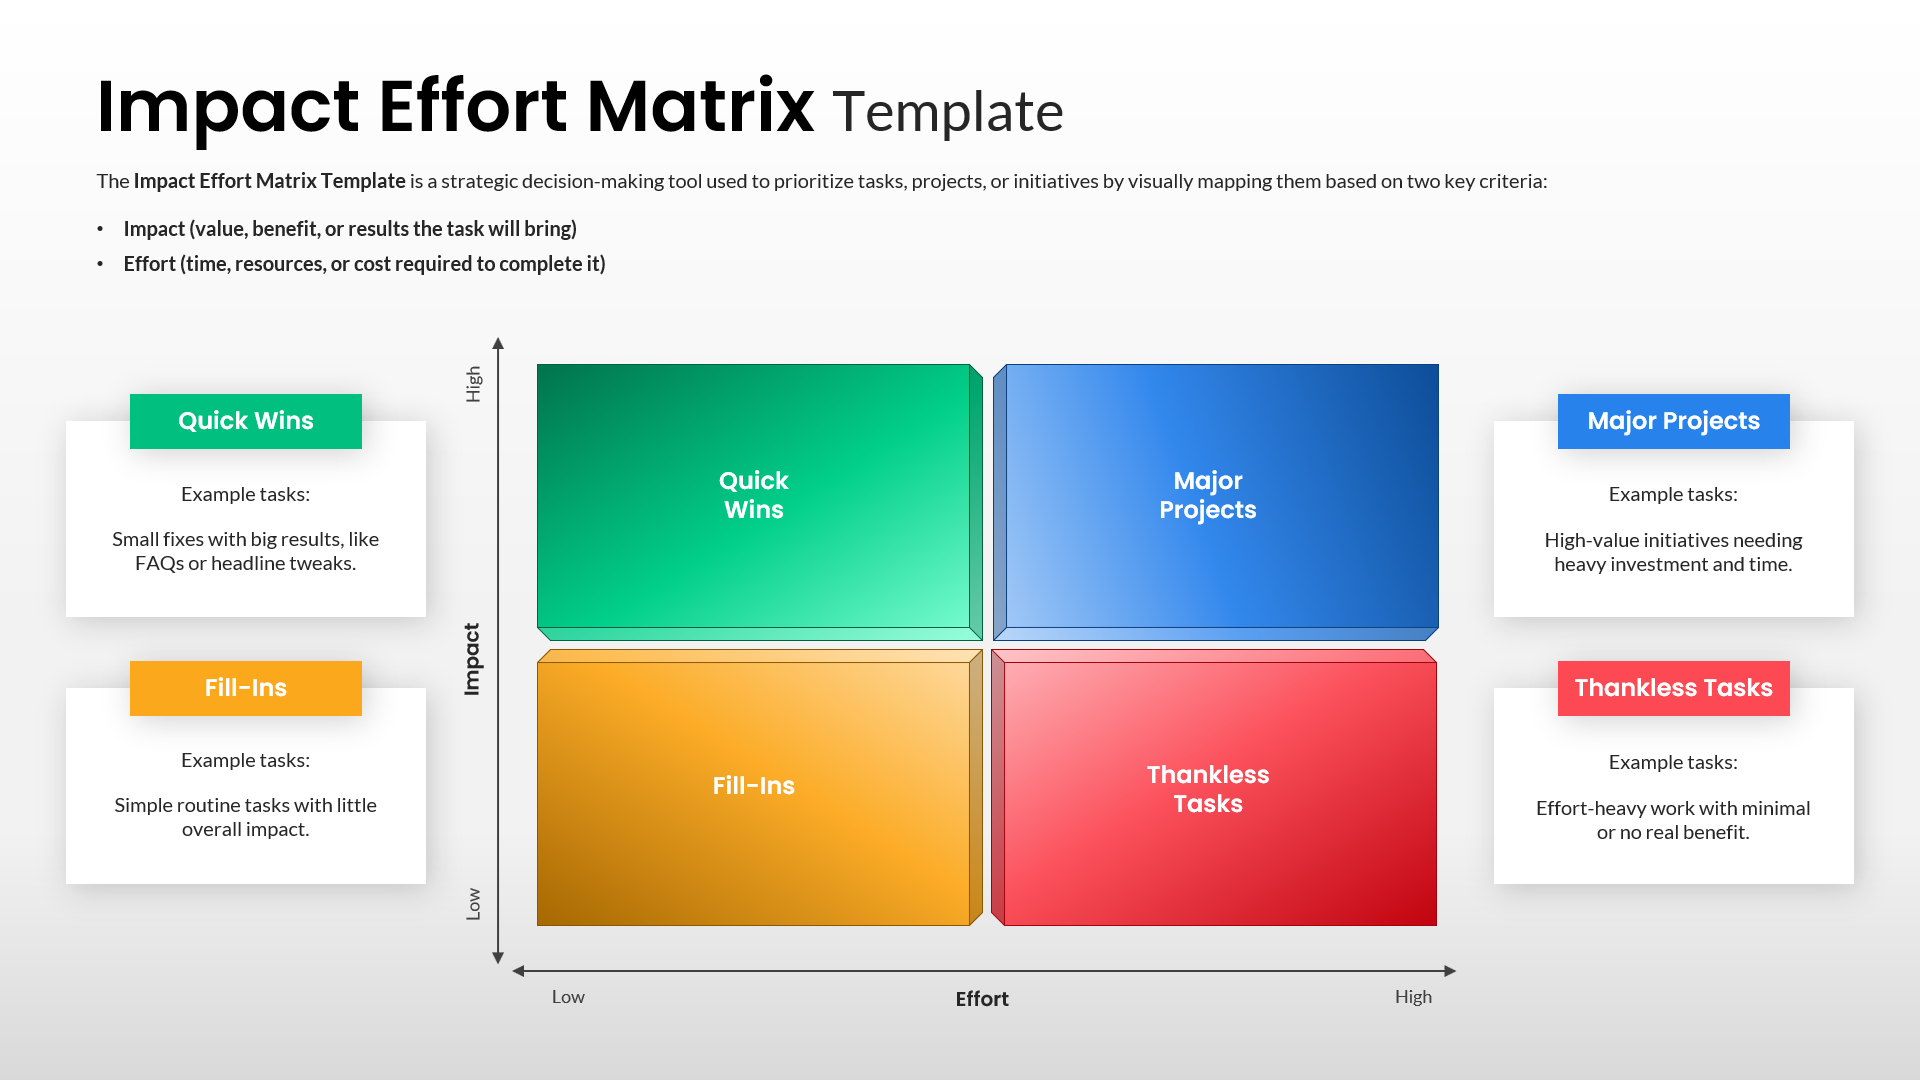
Impact Effort Matrix Template for PowerPoint & Google Slides
Comparison Chart
Ansoff Growth Matrix Template for PowerPoint & Google Slides
Business Strategy
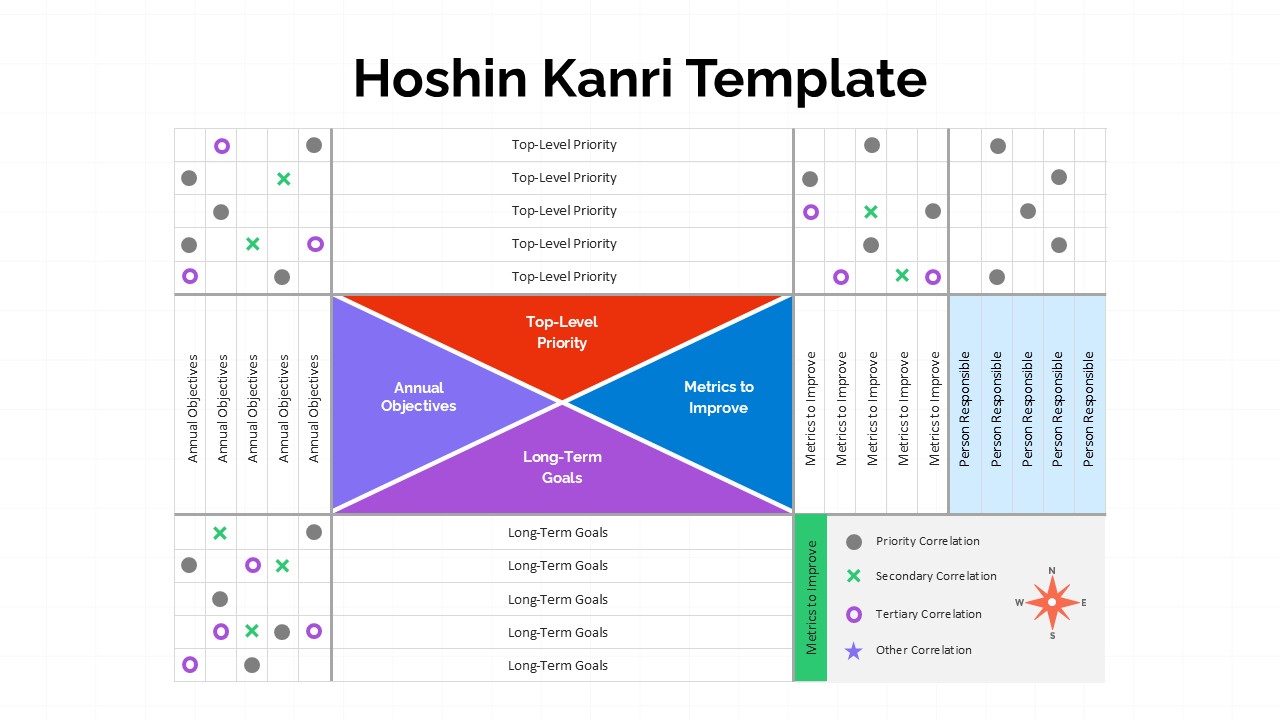
Hoshin Kanri Strategic Planning Matrix Template for PowerPoint & Google Slides
Business Strategy
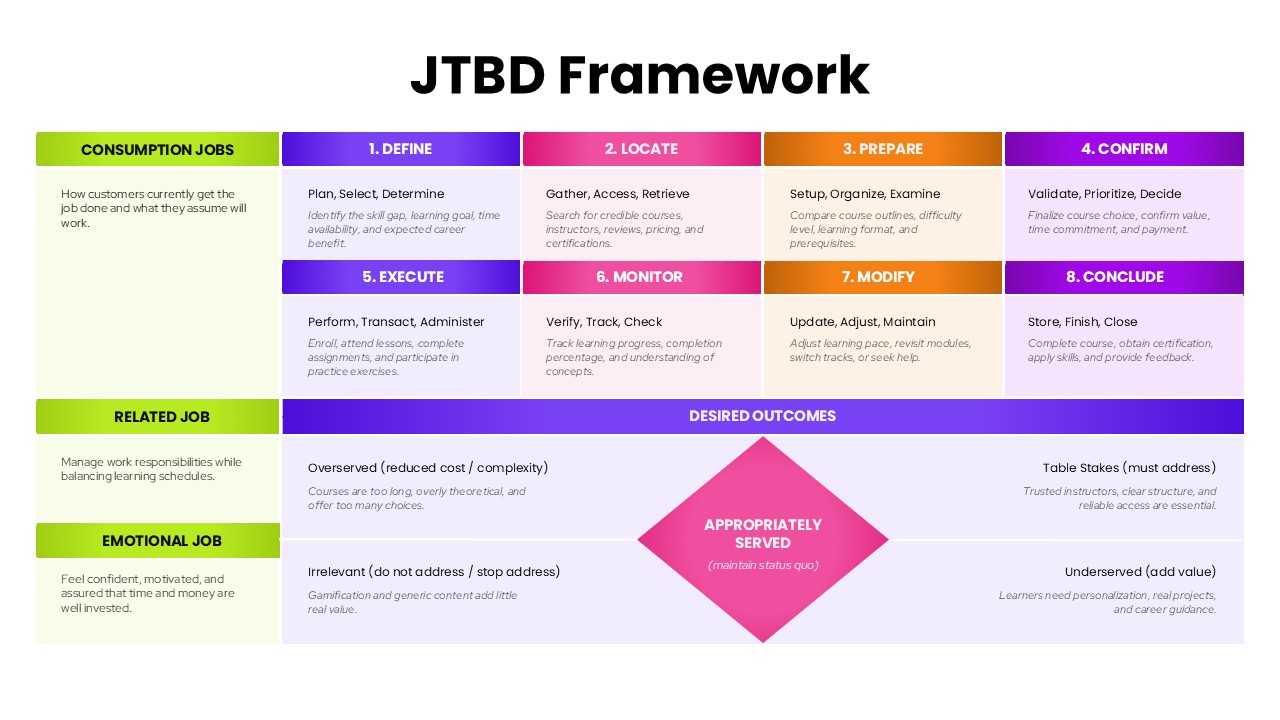
JTBD Framework Process and Outcomes Matrix Template for PowerPoint & Google Slides
Marketing
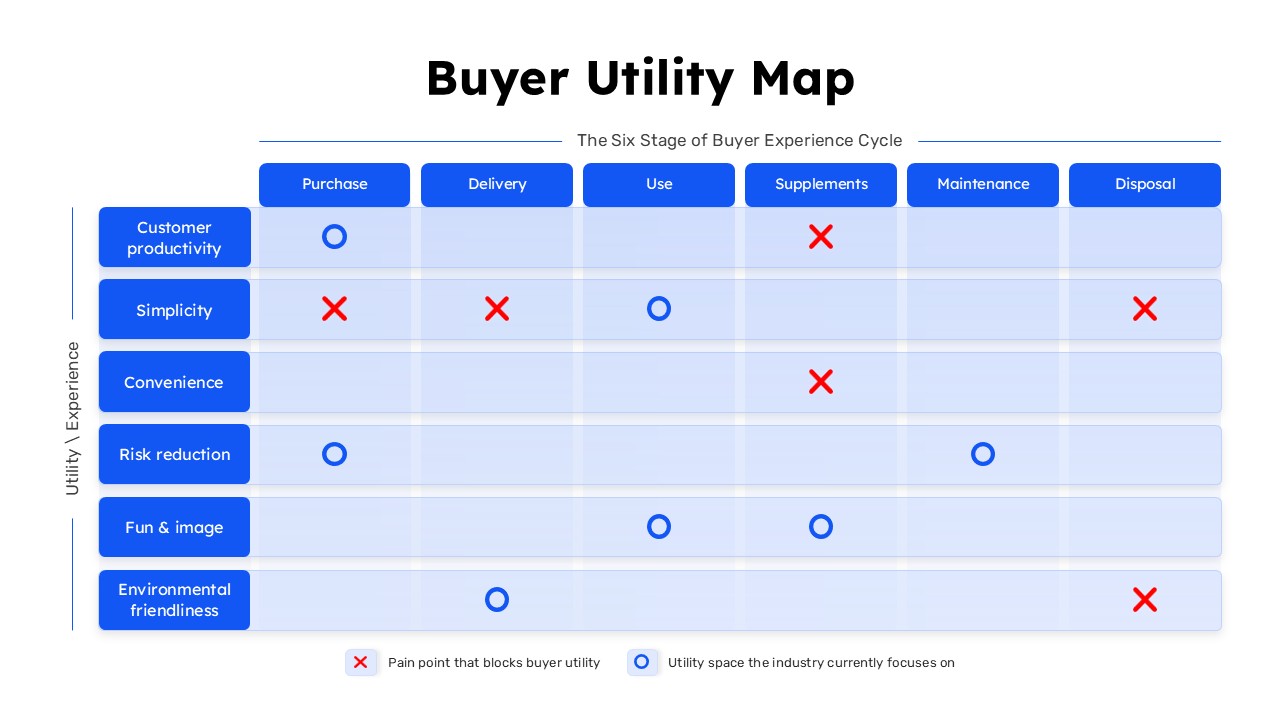
Buyer Utility Map Strategy Matrix Template for PowerPoint & Google Slides
Customer Journey
Materiality Assessment Matrix Diagram Template for PowerPoint & Google Slides
Risk Management
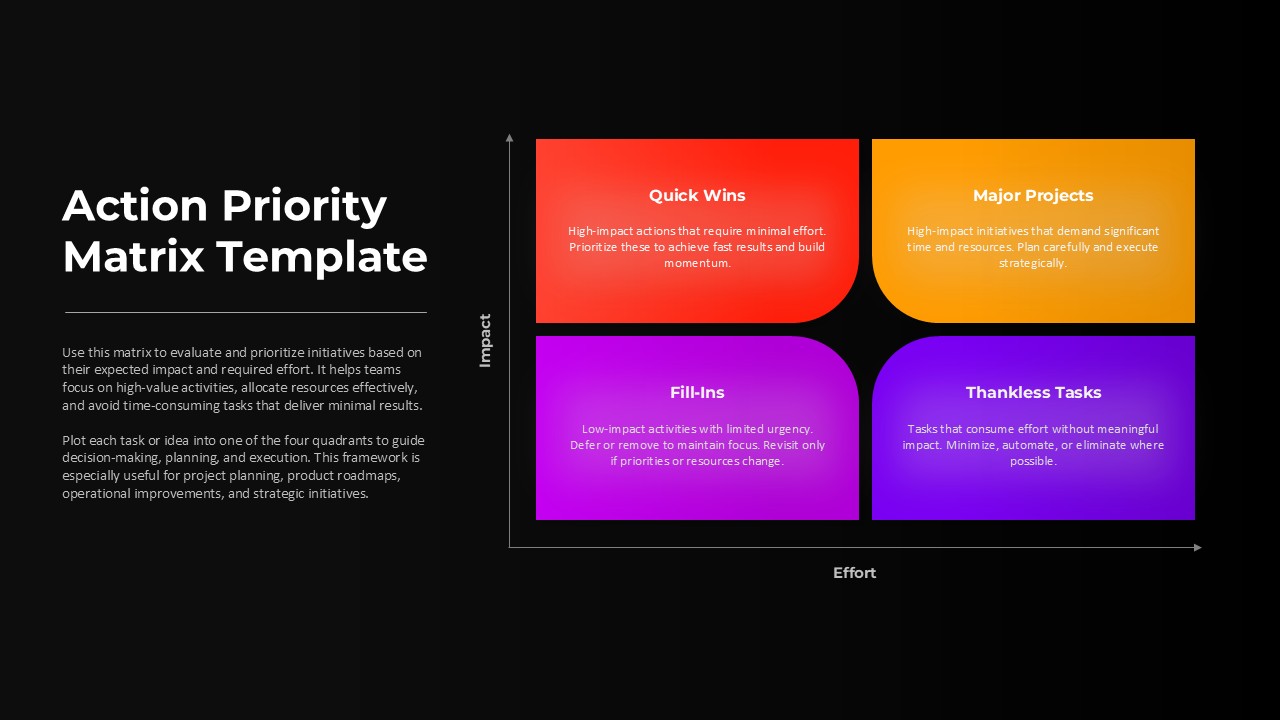
Action Priority Impact Effort Matrix Template for PowerPoint & Google Slides
Business Strategy
IT Gap Analysis Assessment Matrix Template for PowerPoint & Google Slides
Information Technology