Color-Coded Startup Org Chart Slide for PowerPoint & Google Slides


Description
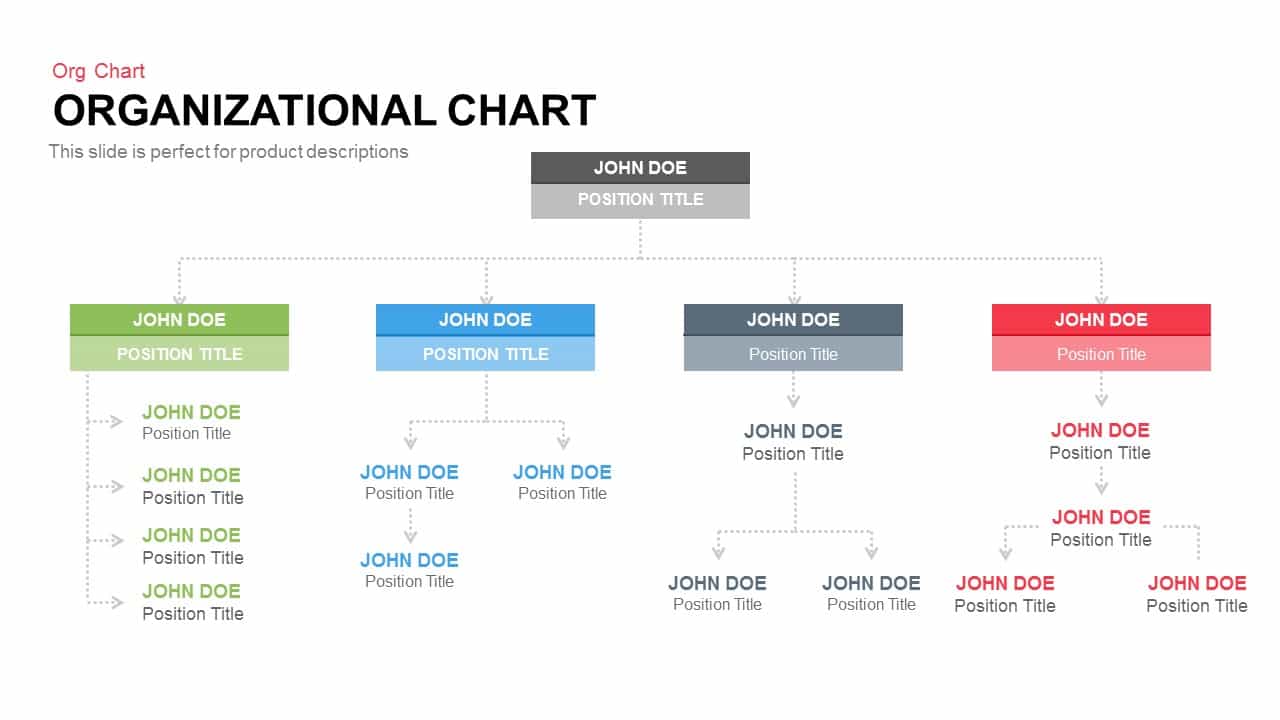
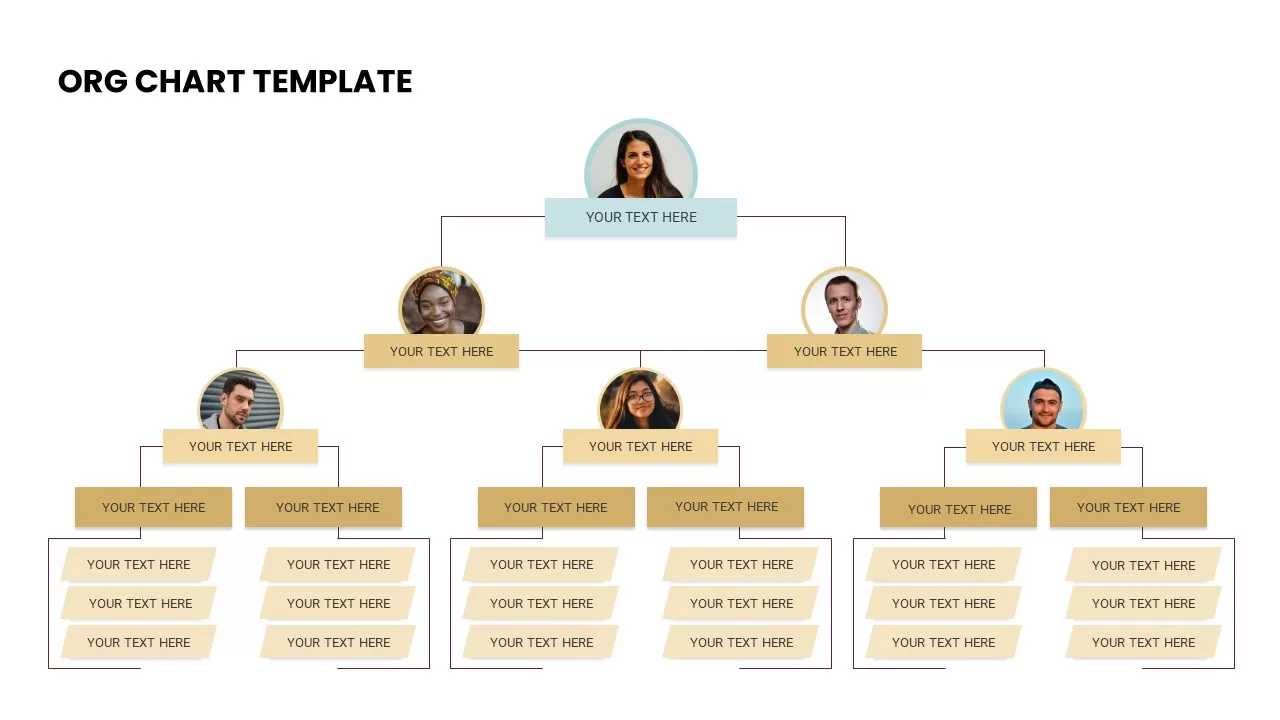
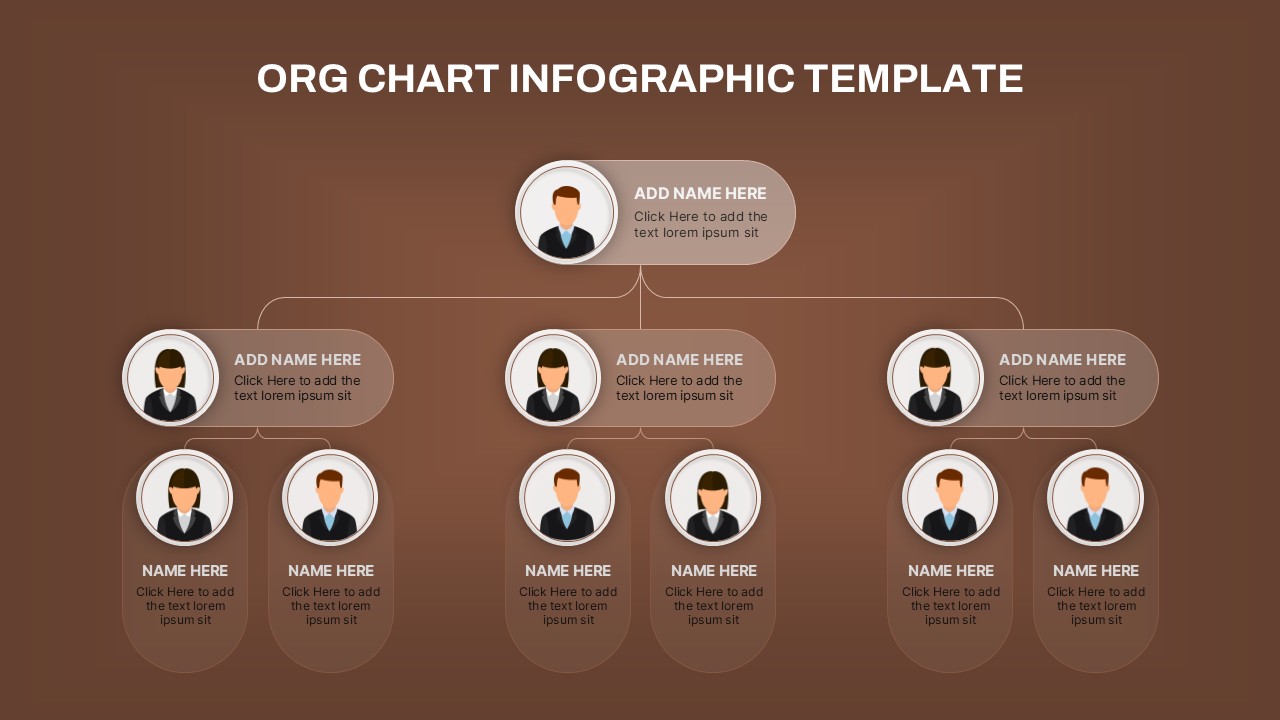
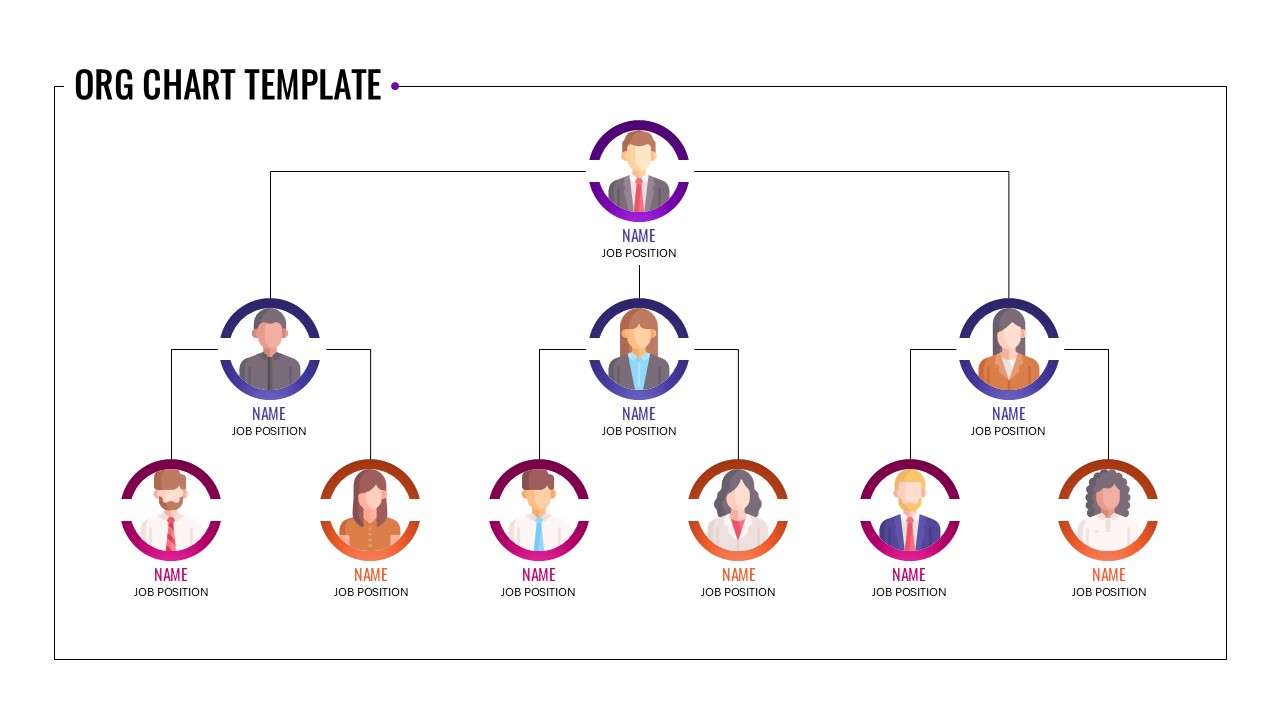
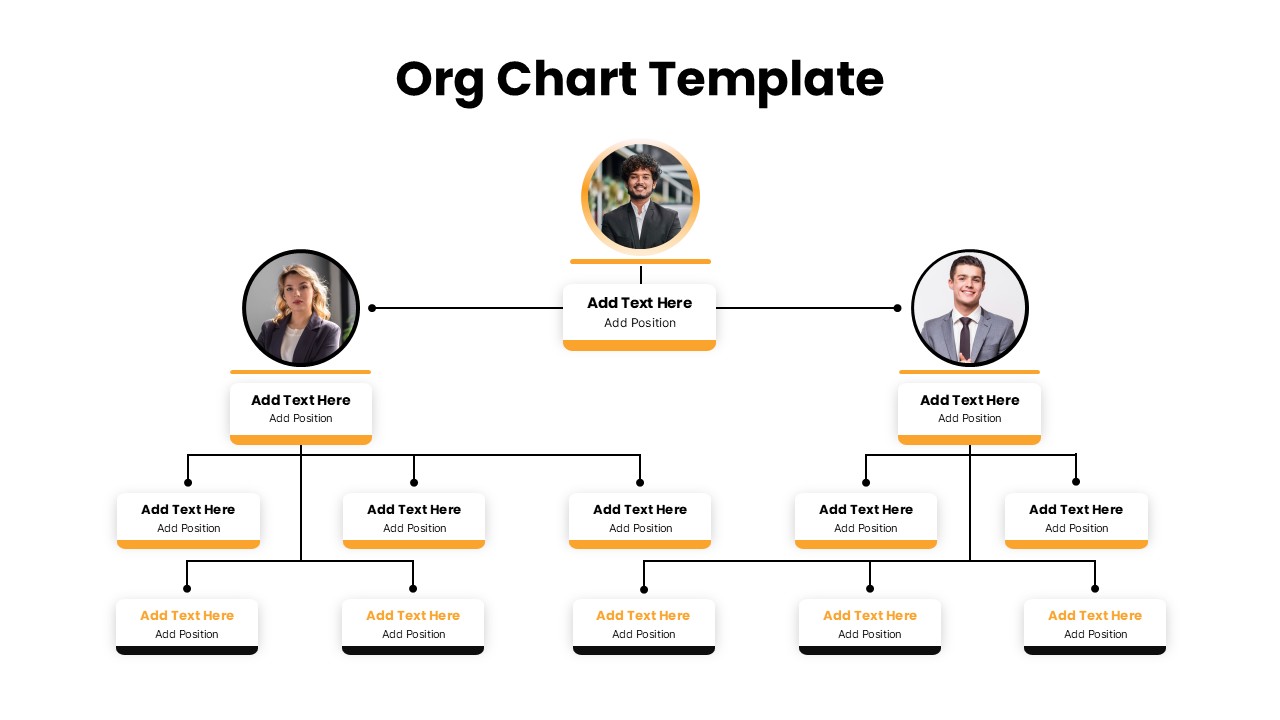
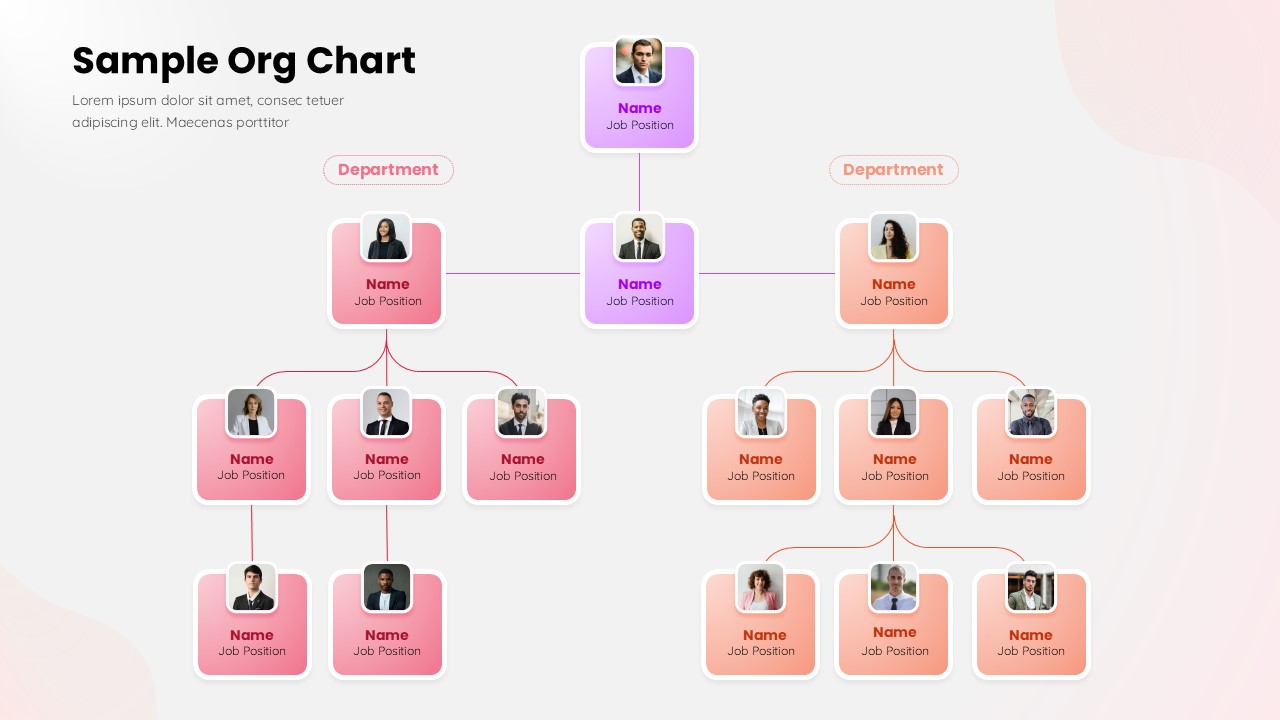
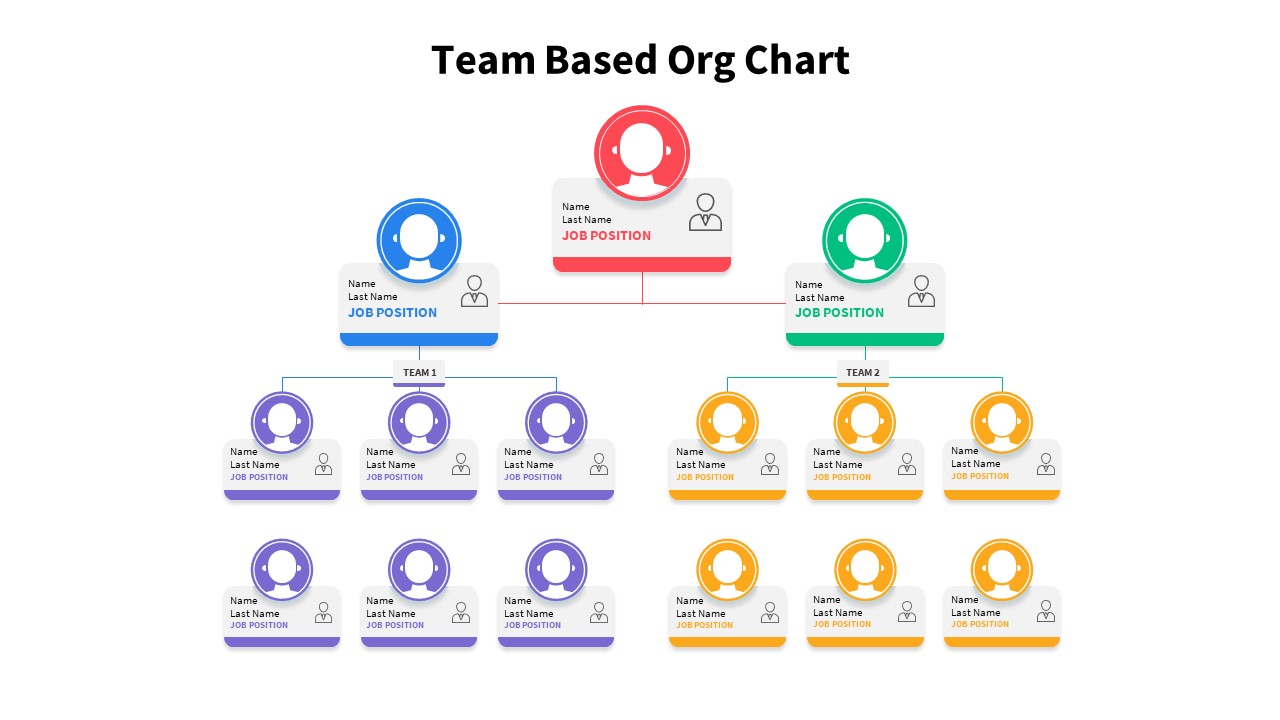
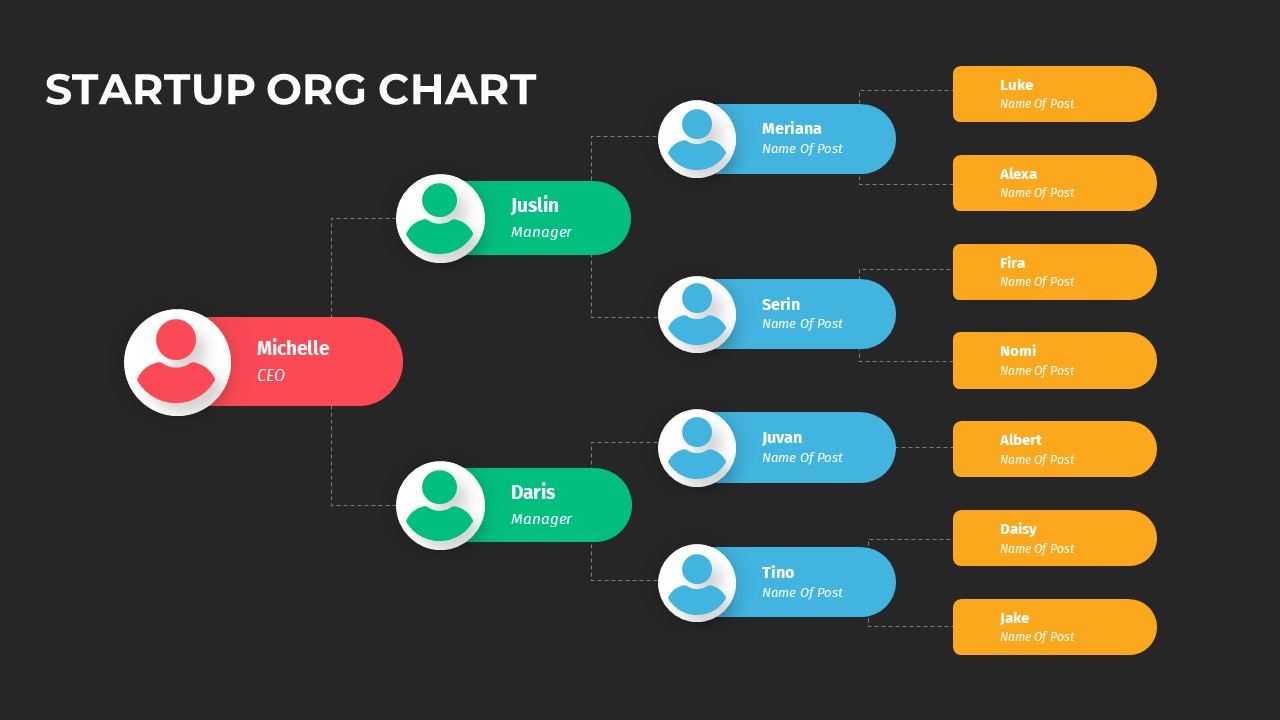
Present your team hierarchy with clarity using this Color-Coded Startup Org Chart slide. Designed specifically for modern startups, the layout visually distinguishes roles and reporting lines through a simple yet effective color scheme: red for leadership (CEO), green for managers, blue for direct reports, and orange for sub-level roles. Each team member is represented with an avatar icon, name, and position label, all neatly aligned for a clean horizontal layout.
This chart simplifies complex team structures by using curved rectangular nodes and dotted connector lines to show relationships. With its bright color palette and intuitive design, this template enhances transparency and encourages better understanding of roles within agile teams or fast-growing organizations.
Fully customizable in both PowerPoint and Google Slides, users can easily update names, roles, and colors to match their actual company structure. Ideal for onboarding decks, investor updates, or internal reporting, this chart helps communicate team dynamics at a glance.
Who is it for
Perfect for startup founders, HR teams, team leads, or project managers who want to present a structured team hierarchy in a visually engaging and accessible format.
Other Uses
Can be adapted for department-specific org charts, temporary project teams, event staffing, internship program structures, or any cross-functional working group overview.
Login to download this file

Item ID
SB04017
Related Templates

Color-Coded Gantt Chart template for PowerPoint & Google Slides
Business
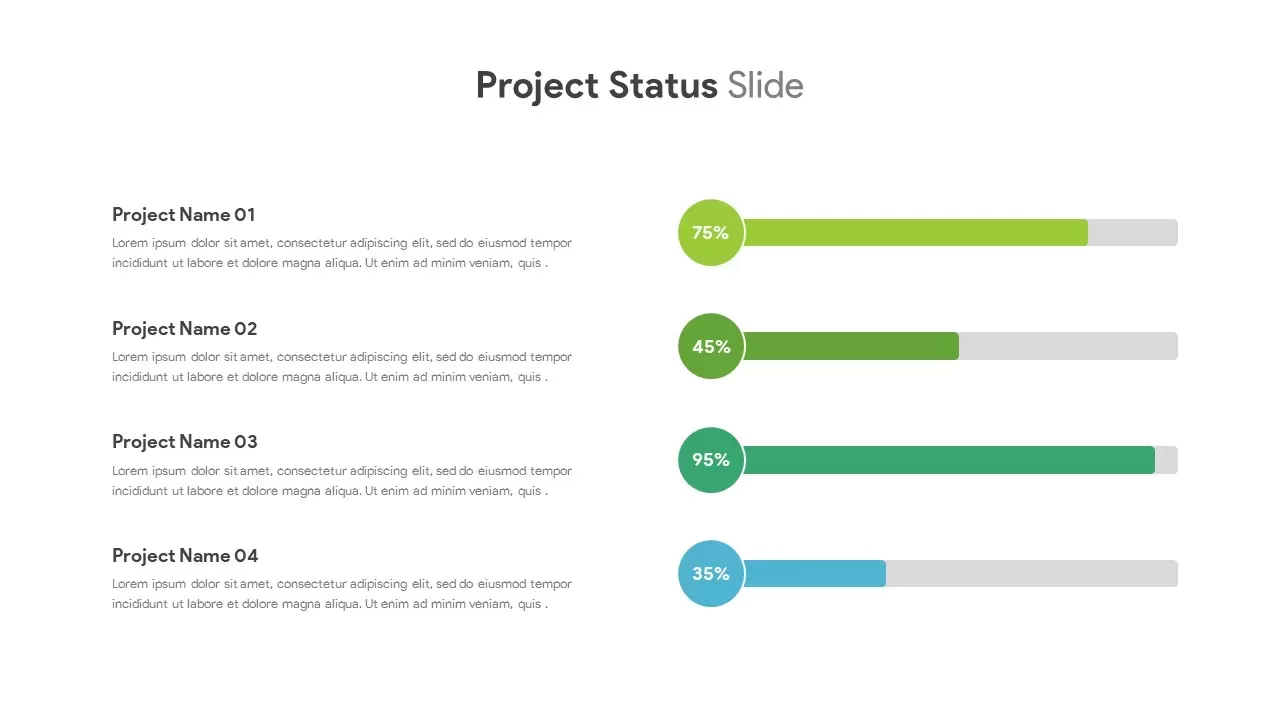
Color-Coded Project Status Slide Template for PowerPoint & Google Slides
Project Status
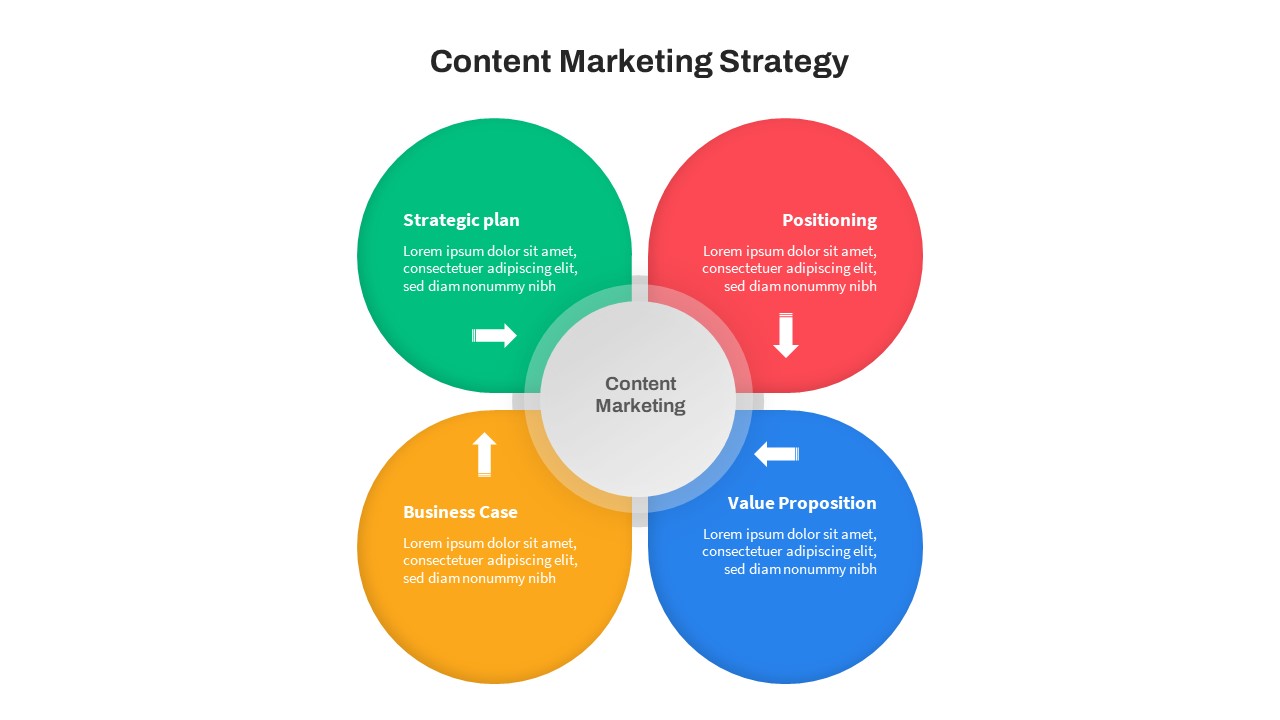
Color-Coded Content Marketing Strategy Slide for PowerPoint & Google Slides
Marketing
Free Color-Coded Fishbone Diagram Template for PowerPoint & Google Slides
Project
Free

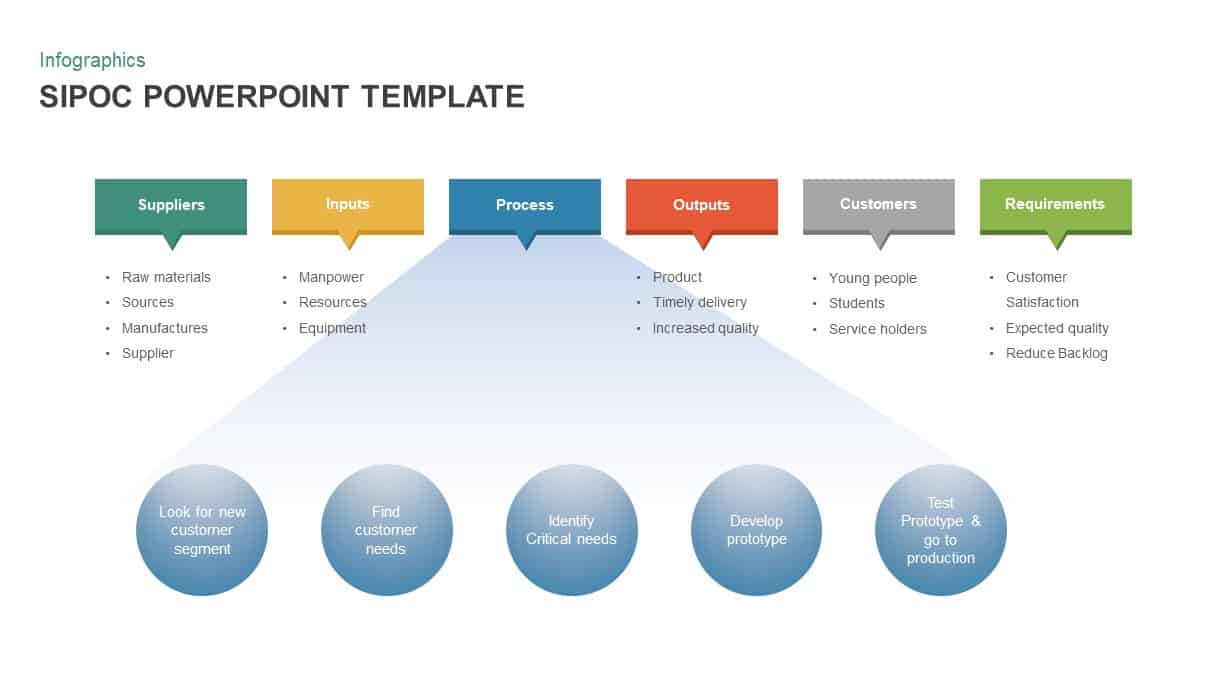
Color-Coded SIPOC Diagram with Process Flow for PowerPoint & Google Slides
Process
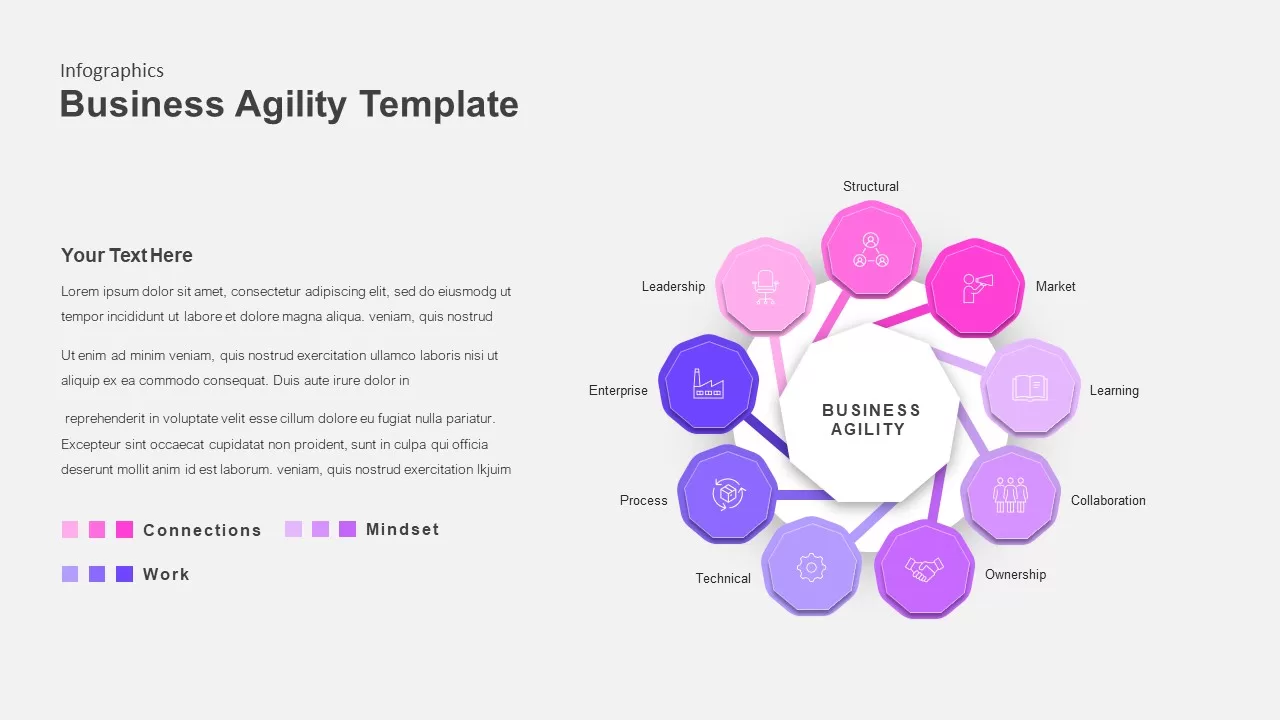
Color-Coded Business Agility Radial Template for PowerPoint & Google Slides
Business
Color-Coded Calendar Infographic Template for PowerPoint & Google Slides
Infographics
Six-Section Color-Coded Agenda Template for PowerPoint & Google Slides
Agenda
Six-Step Color-Coded Table of Contents Template for PowerPoint & Google Slides
Agenda
Color-Coded Project Status Template for PowerPoint & Google Slides
Project Status
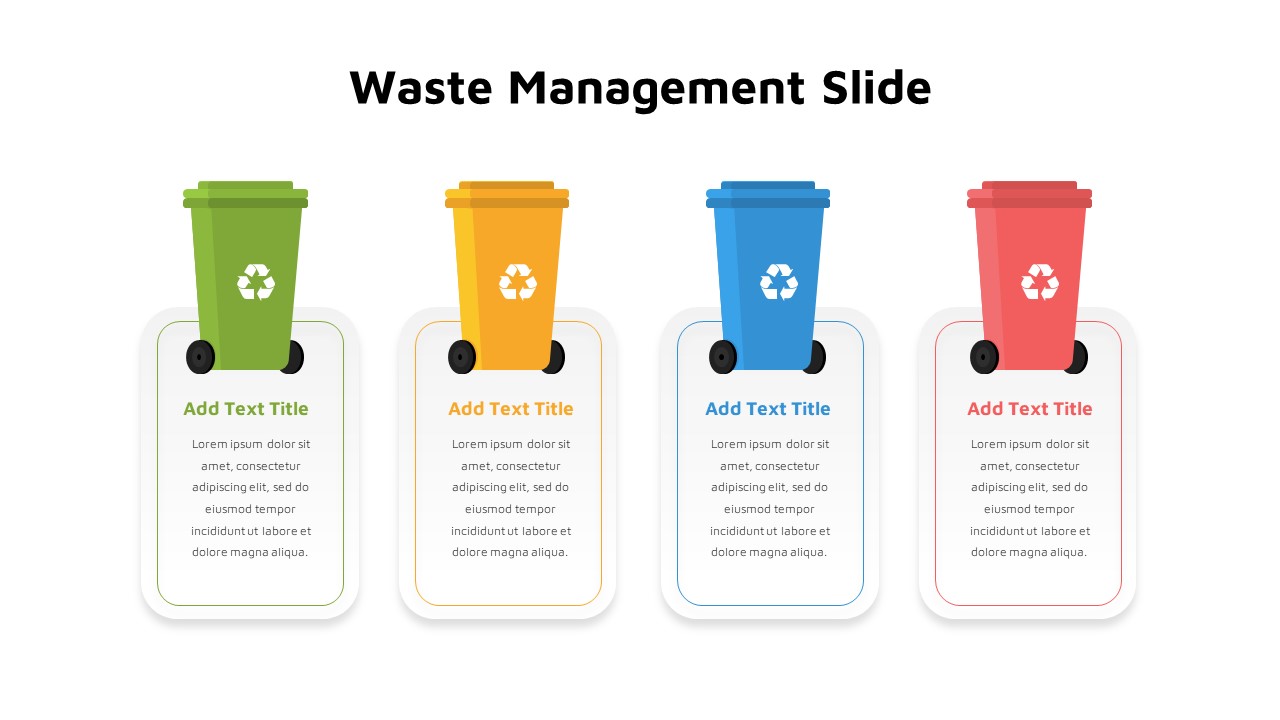
Color-Coded Waste Management Bins Template for PowerPoint & Google Slides
Comparison
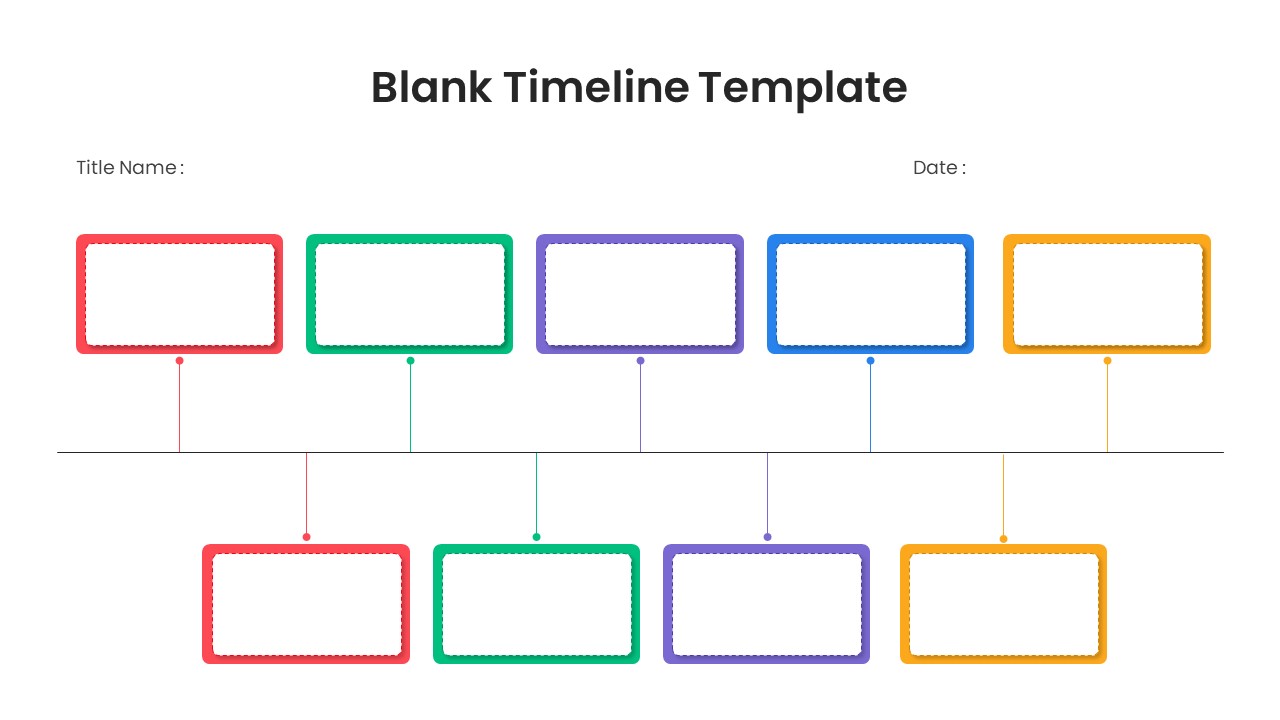
Blank Two-Tier Color-Coded Timeline Template for PowerPoint & Google Slides
Timeline
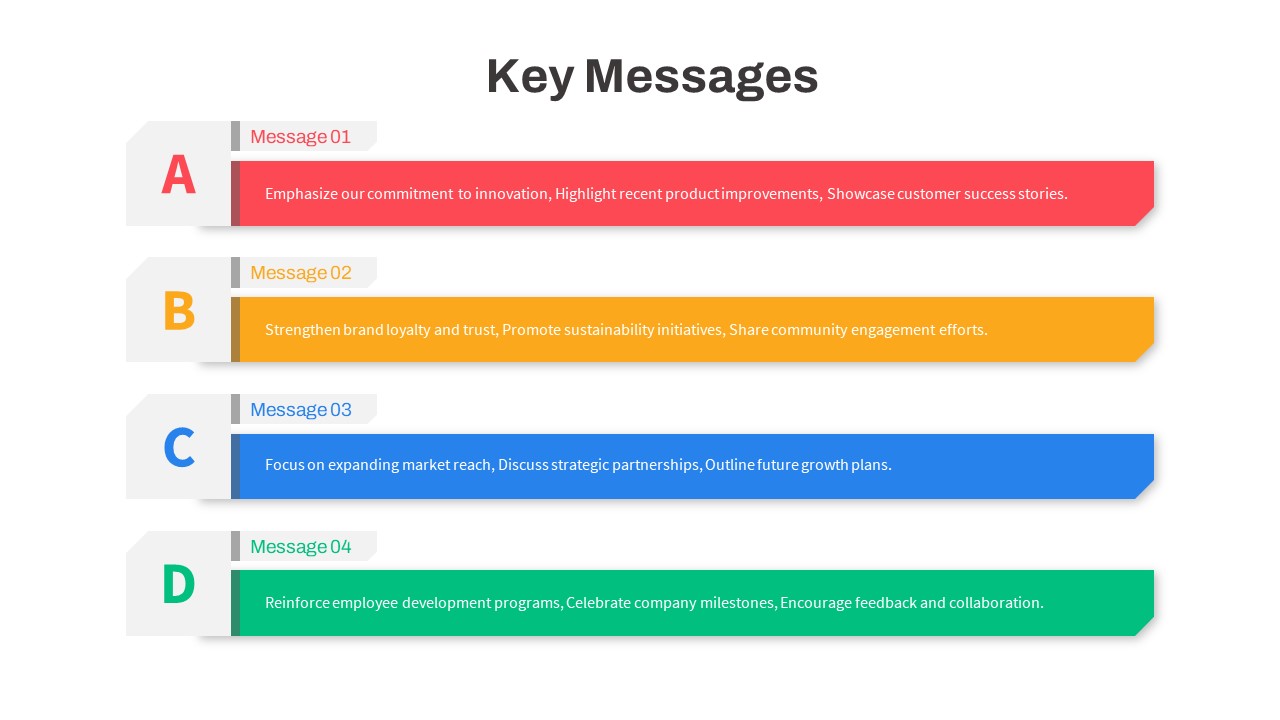
Color-Coded Corporate Key Messages Template for PowerPoint & Google Slides
Process
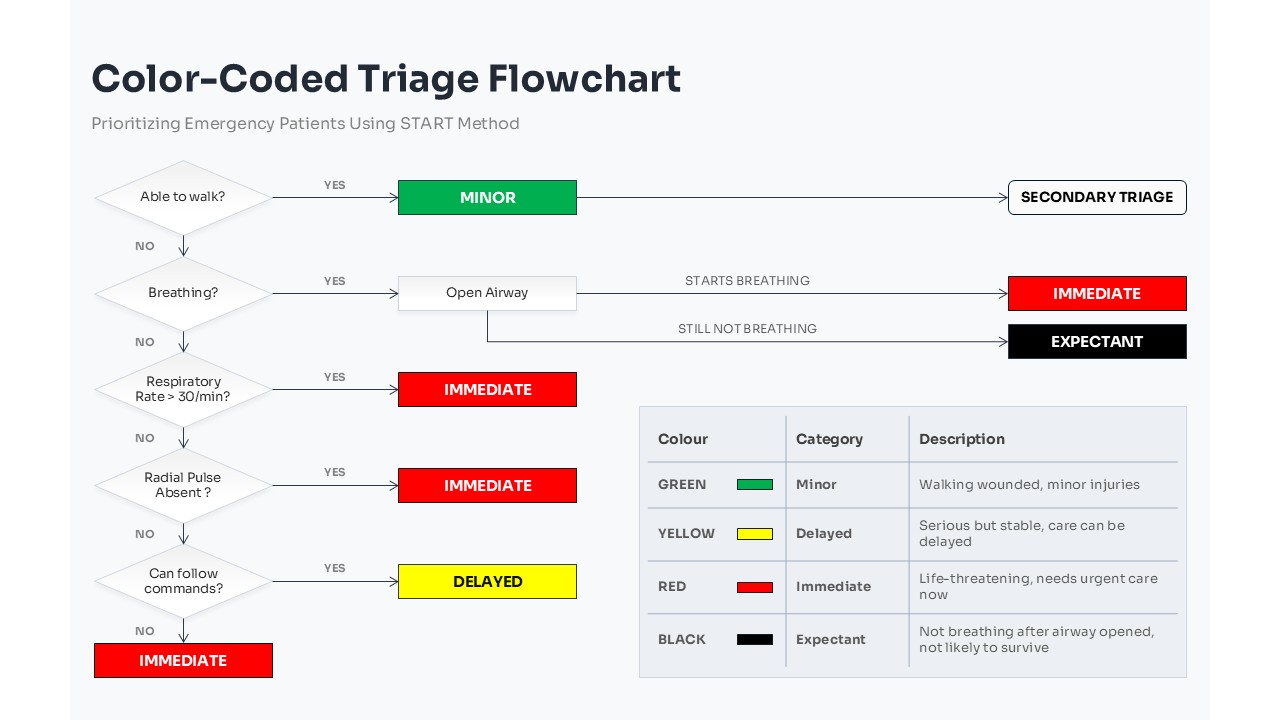
Color-Coded Medical Triage Flowchart Template for PowerPoint & Google Slides
Flow Charts
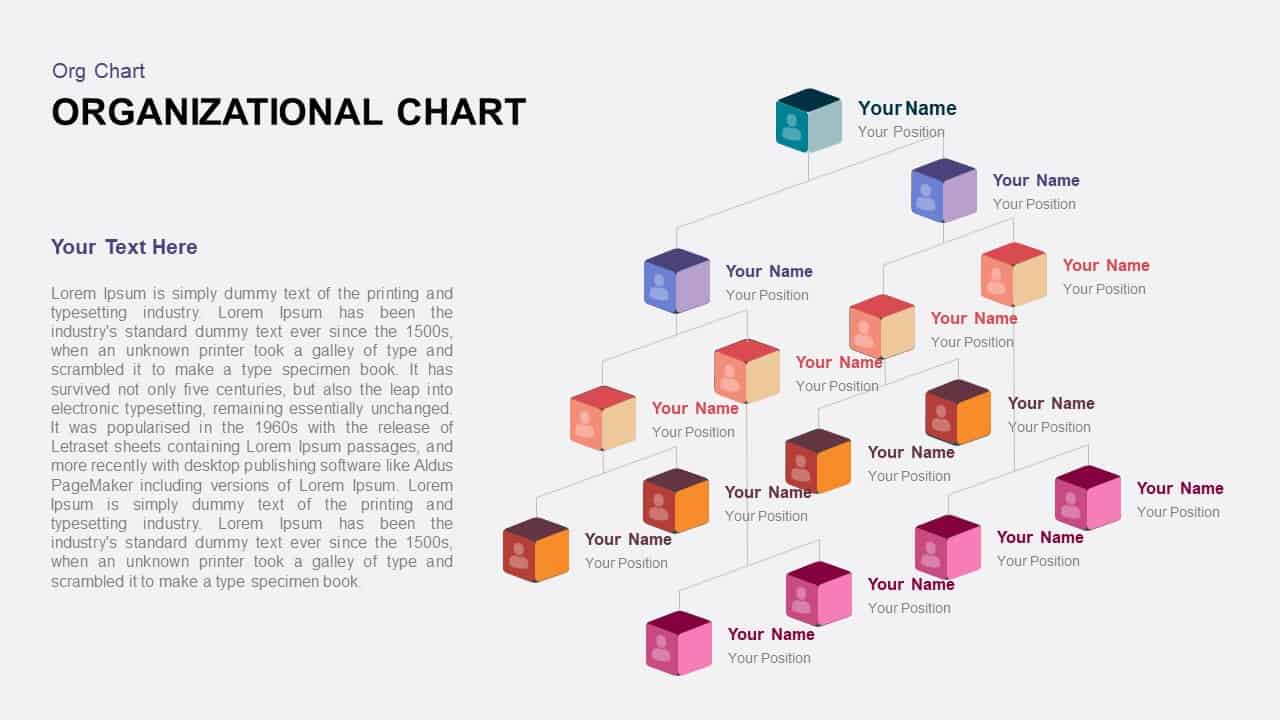
3D Color Block Organizational Chart Slide for PowerPoint & Google Slides
Org Chart
Modern Multi-Color Polar Chart Diagram Template for PowerPoint & Google Slides
Charts
Corporate Org Chart template for PowerPoint & Google Slides
Org Chart
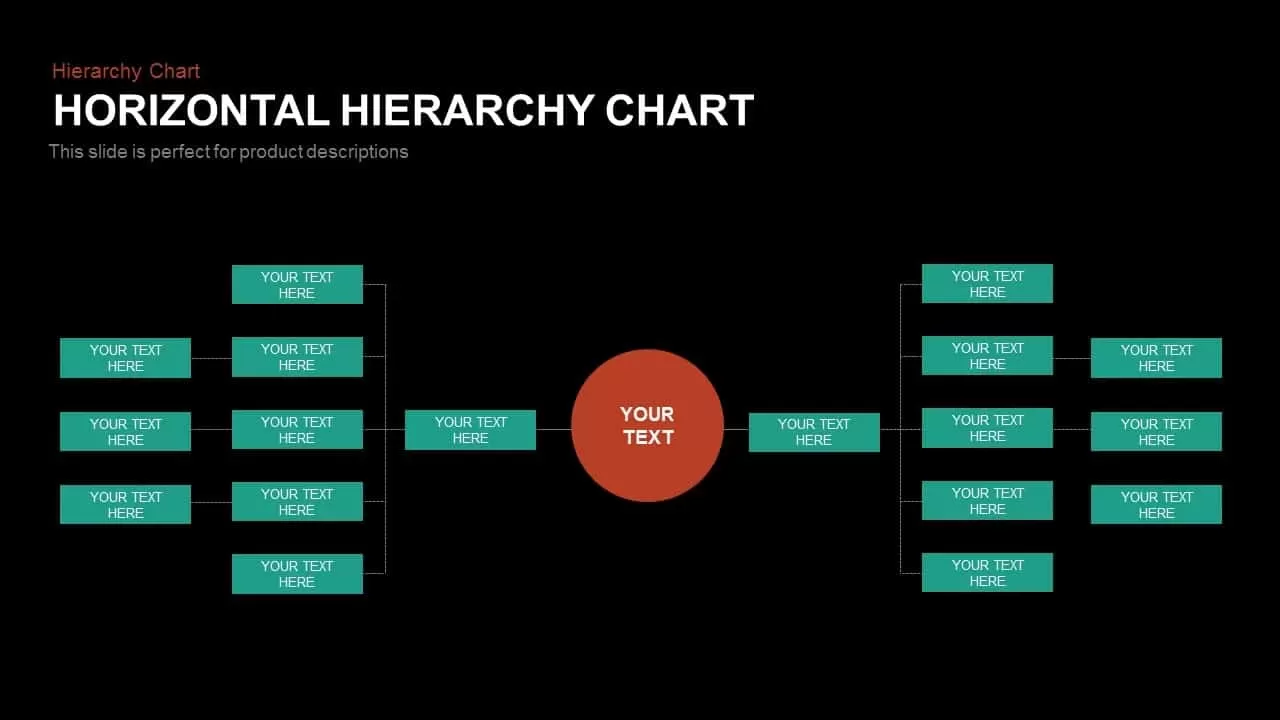
Horizontal Org Chart template for PowerPoint & Google Slides
Org Chart
Organizational Structure Org Chart Template for PowerPoint & Google Slides
Org Chart
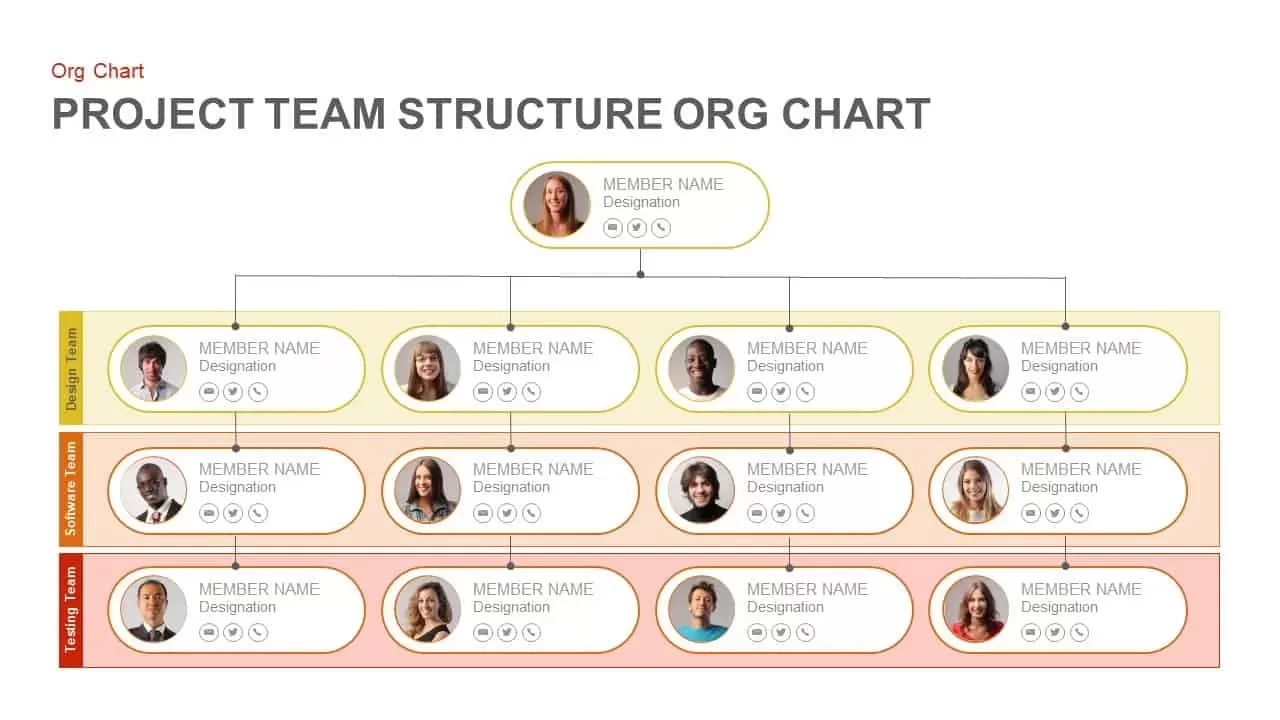
Project Team Structure Org Chart Template for PowerPoint & Google Slides
Org Chart
Modern Colorful Circular Org Chart Template for PowerPoint & Google Slides
Org Chart
Org Chart Structure template for PowerPoint & Google Slides
Org Chart
C-Suite Executive Org Chart Diagram Template for PowerPoint & Google Slides
Org Chart
Animated Hexagon Org Chart Diagram Template for PowerPoint & Google Slides
Org Chart
Company Structure Hierarchical Org Chart Template for PowerPoint & Google Slides
Org Chart
Hierarchical Org Chart Infographic Template for PowerPoint & Google Slides
Org Chart
Circular Sample Org Chart Template for PowerPoint & Google Slides
Org Chart
Corporate Hierarchy Org Chart Template for PowerPoint & Google Slides
Org Chart
Sample Org Chart Template for PowerPoint & Google Slides
Org Chart

Gradient Color Agenda Slide Bundle Template for PowerPoint & Google Slides
Agenda
Multi-Color Eight-Step Ribbon Diagram Template for PowerPoint & Google Slides
Process
Multi-Color Enneagram Circular Diagram Template for PowerPoint & Google Slides
Circular

Blured Color Duo Pitch Template for PowerPoint & Google Slides
Company Profile
Multi-Color Five-Step Curved Arrow Template for PowerPoint & Google Slides
Process
Dual-Color Cost vs Benefit Analysis Template for PowerPoint & Google Slides
Comparison
Purple Color Presentation Template for PowerPoint & Google Slides
Company Profile
Multi-Color Milestone Timeline Layout Template for PowerPoint & Google Slides
Timeline
Multi-Color Technology Roadmap Template Pack for PowerPoint & Google Slides
Roadmap
Free Minimal Multi-Color Table of Contents Template for PowerPoint & Google Slides
Agenda
Free
Multi-color Curved Timeline Roadmap Template for PowerPoint & Google Slides
Timeline
Multi Color SWOT Analysis Quadrant Template for PowerPoint & Google Slides
SWOT
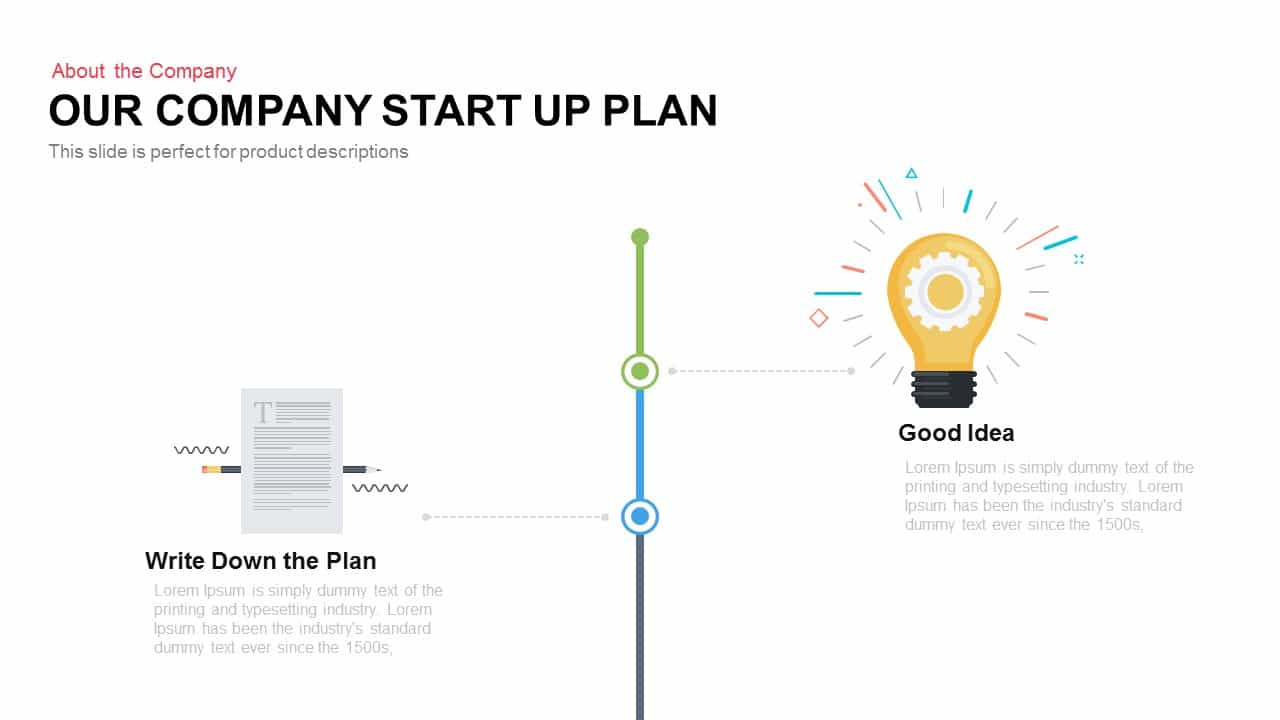
Company Startup Plan Timeline Slide Template for PowerPoint & Google Slides
Timeline
Versatile Startup Roadmap Slide Pack Template for PowerPoint & Google Slides
Timeline
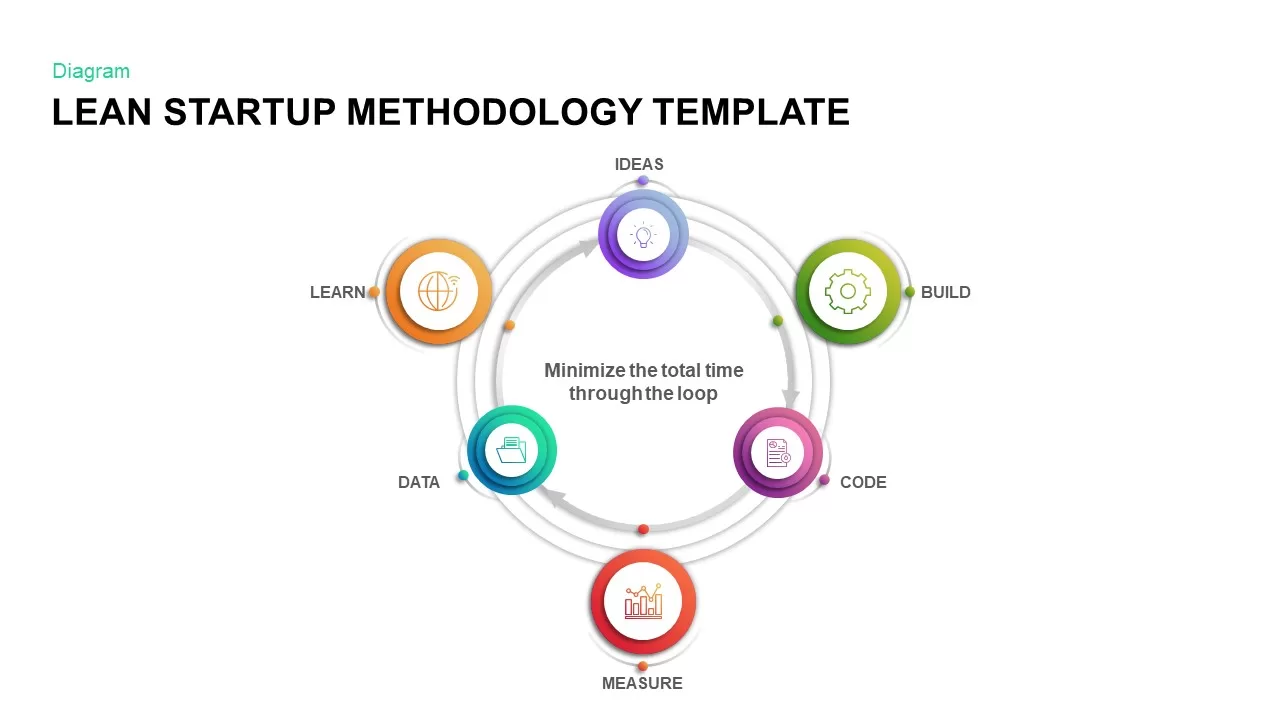
Lean Startup Methodology Infographic Template for PowerPoint & Google Slides
Circular
Modern Gradient Startup Pitch Deck Template for PowerPoint & Google Slides
Pitch Deck
Dark Tech Startup Business Plan Deck Template for PowerPoint & Google Slides
Software Development
Bold Vibrant Startup Pitch Deck Template for PowerPoint & Google Slides
Pitch Deck
Biotech Startup Profile Pitch Deck Template for PowerPoint & Google Slides
Pitch Deck
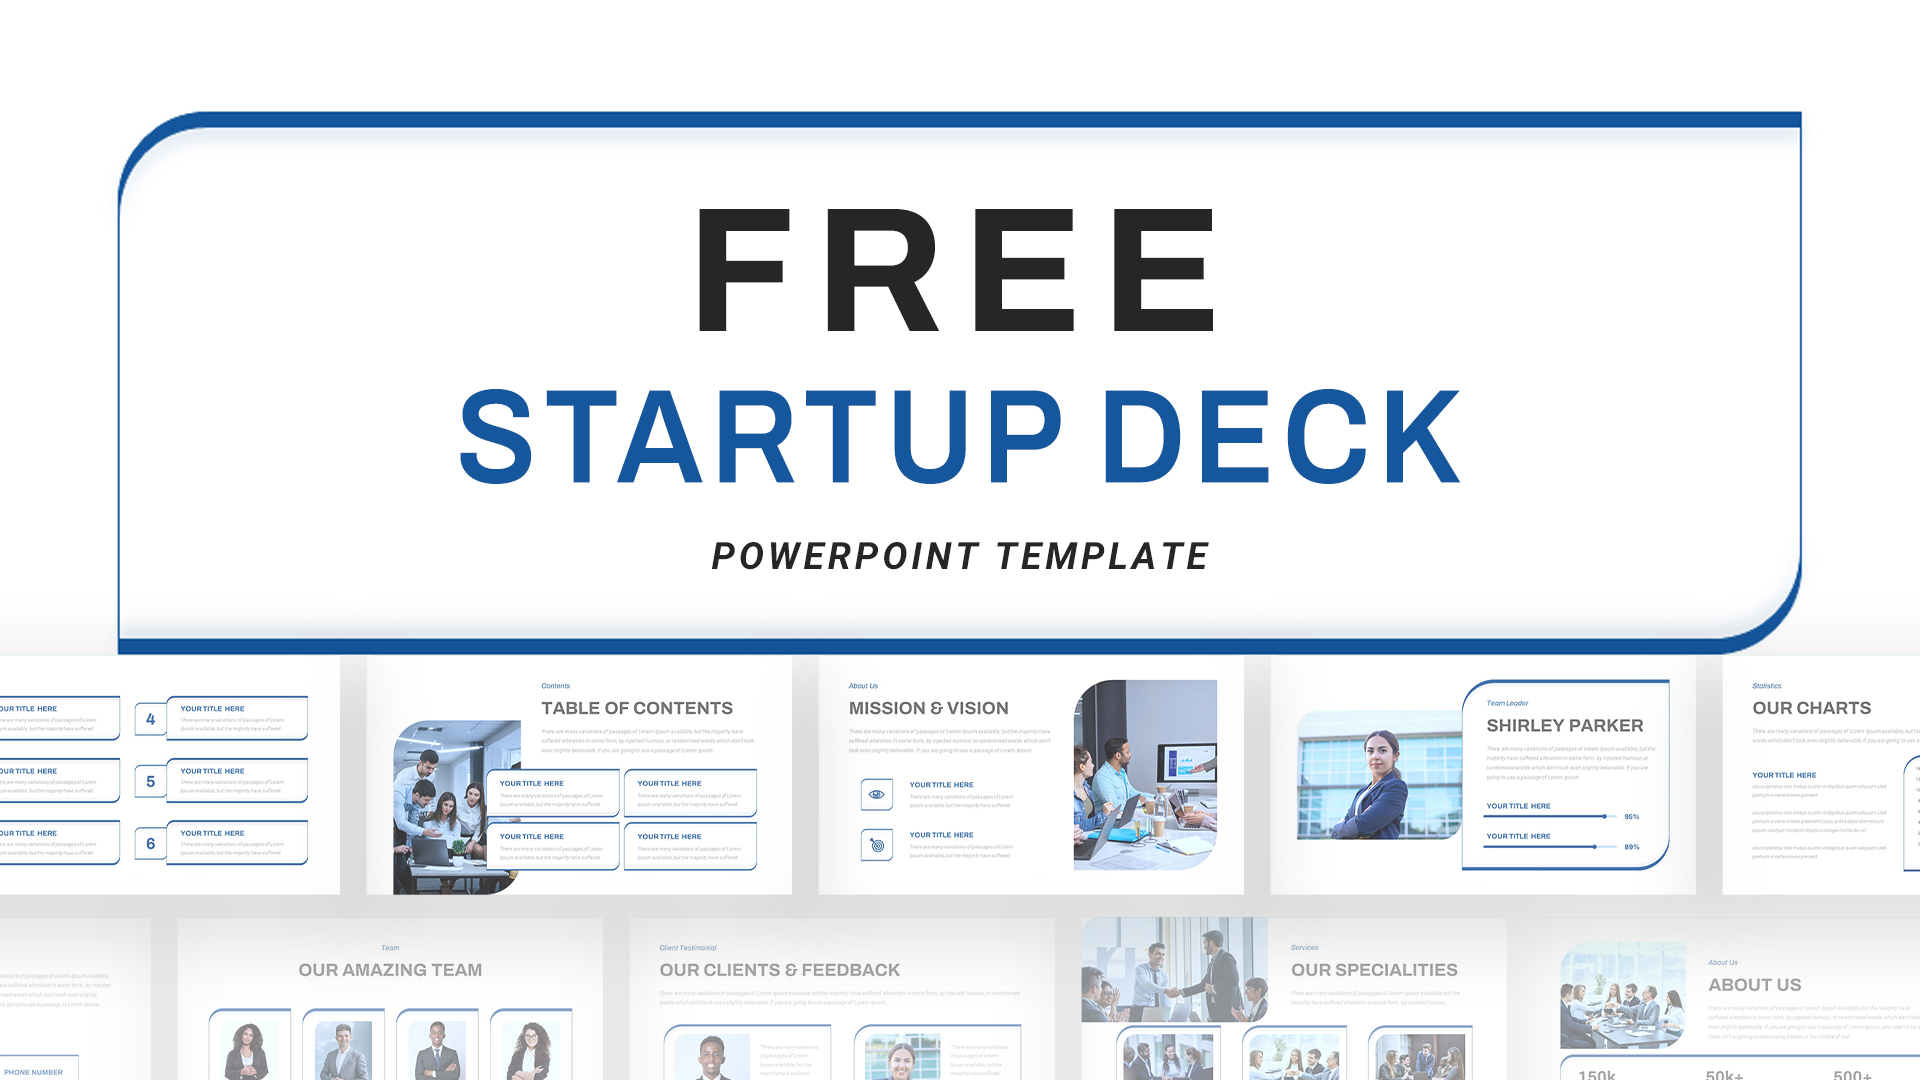
Free Startup Pitch Deck Template for PowerPoint & Google Slides
Pitch Deck
Colorful Startup Financing Cycle Diagram Template for PowerPoint & Google Slides
Finance
AI Startup Pitch Deck Presentation Template for PowerPoint & Google Slides
Pitch Deck
AI Startup Company Profile Template for PowerPoint & Google Slides
Company Profile
Startup Executive Summary Template for PowerPoint & Google Slides
Business Report
Bar Data Chart Slide for PowerPoint & Google Slides
Bar/Column
Weekly Data Chart Slide for PowerPoint & Google Slides
Comparison Chart
Tornado Chart Data Comparison Slide Template for PowerPoint & Google Slides
Bar/Column
Free Editable Simple Column Chart Slide Template for PowerPoint & Google Slides
Bar/Column
Free
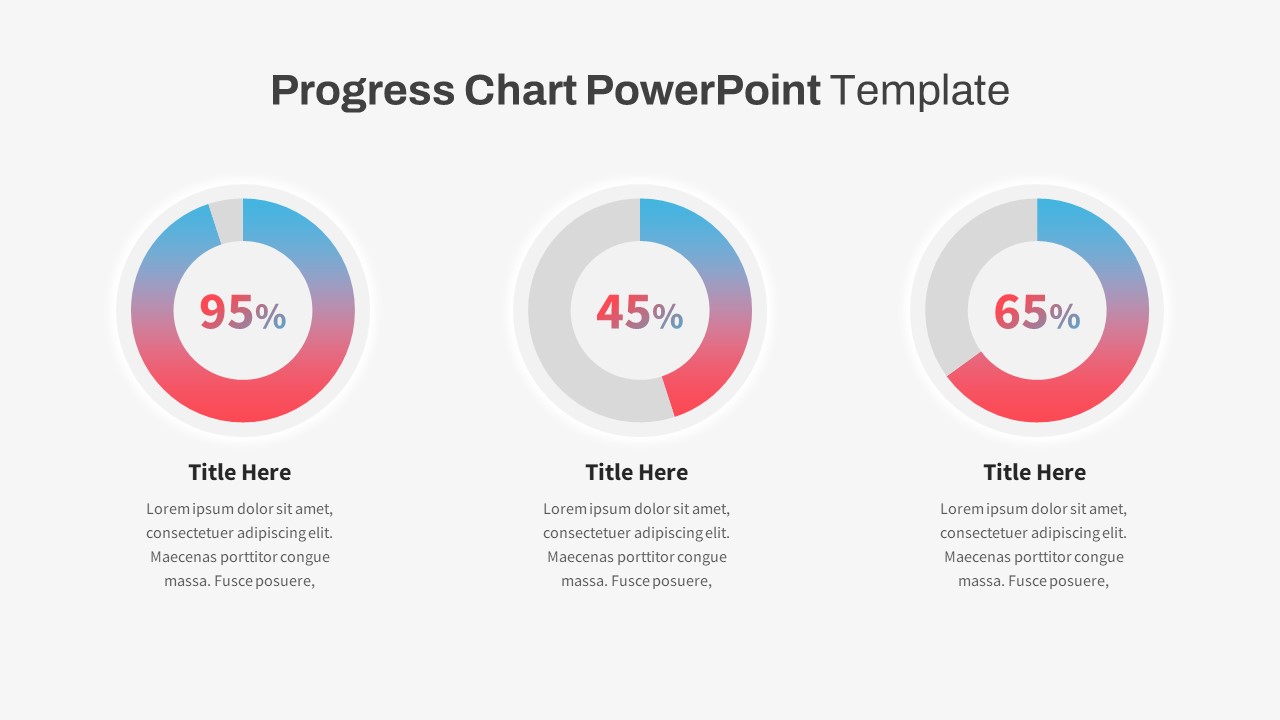
Progress Chart Slide for PowerPoint & Google Slides
Charts
Horizontal Bar Chart Slide with Icons Template for PowerPoint & Google Slides
Bar/Column
Stacked Gantt Chart Timeline Slide Template for PowerPoint & Google Slides
Gantt Chart
Quad Chart Infographic Pack of 8 Slides Template for PowerPoint & Google Slides
Comparison Chart
Free Professional Gantt Chart Pack – 4 Slides Template for PowerPoint & Google Slides
Gantt Chart
Free
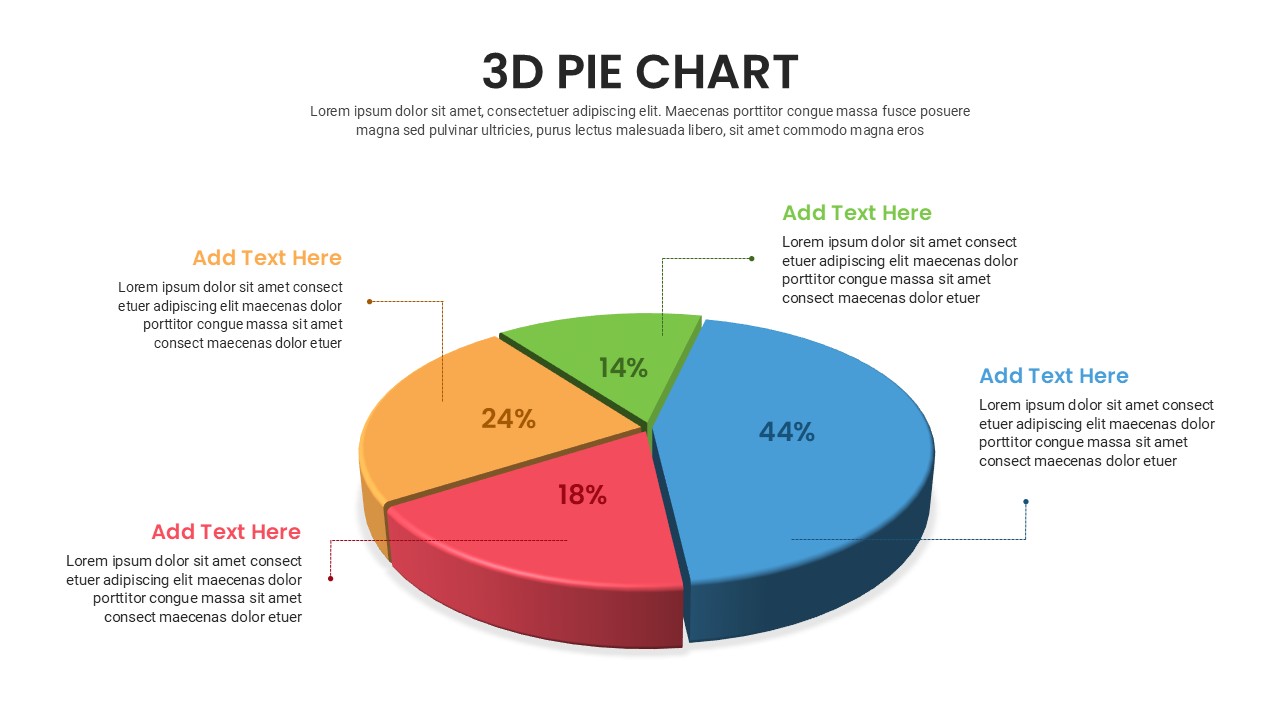
Free 3D Pie Chart template for PowerPoint & Google Slides
Pie/Donut
Free
Bar Chart Sample template for PowerPoint & Google Slides
Bar/Column
Mobile Data Analysis Chart template for PowerPoint & Google Slides
Charts
Creative Data Analysis Bar Chart template for PowerPoint & Google Slides
Bar/Column
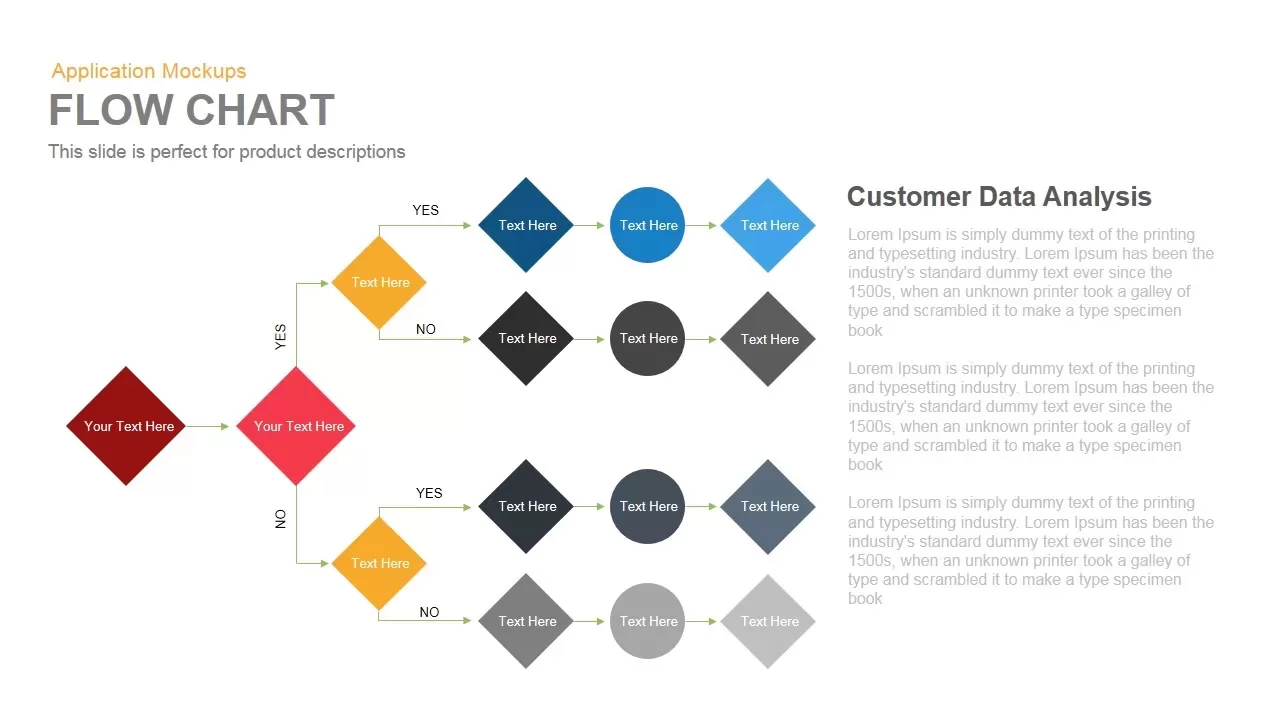
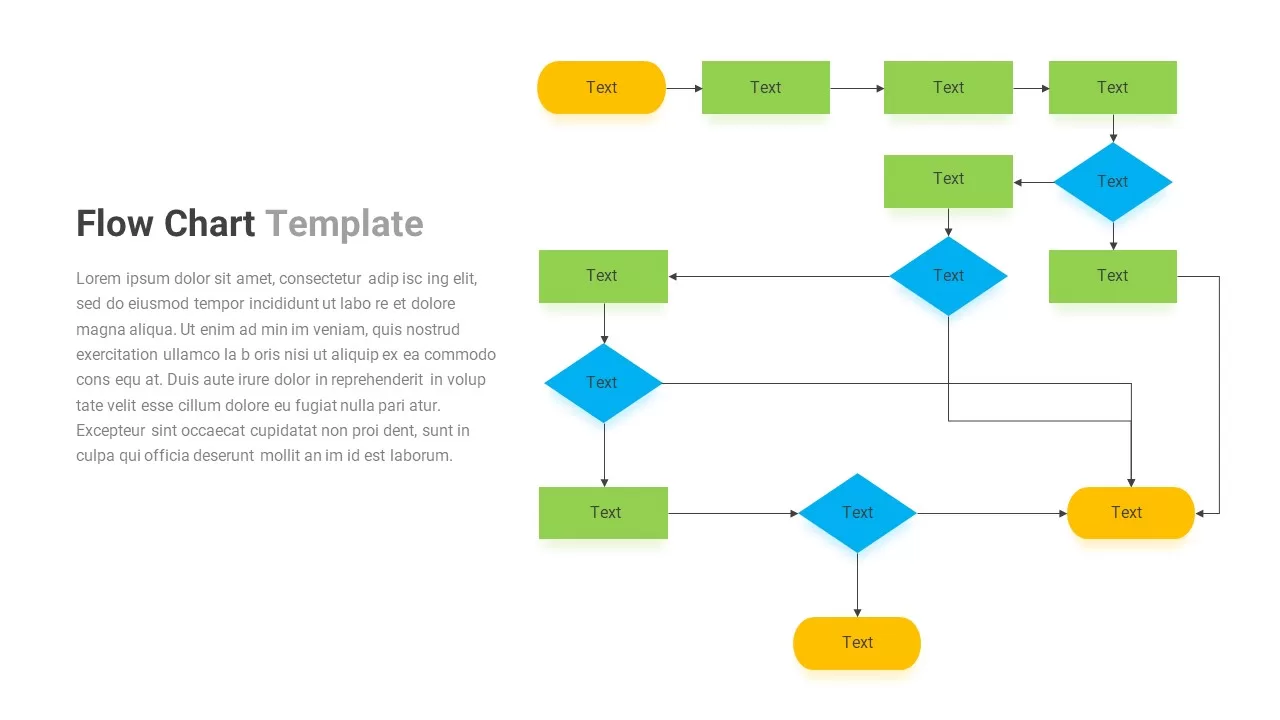
Flow Chart template for PowerPoint & Google Slides
Flow Charts
Donut Chart Split Template for PowerPoint & Google Slides
Charts
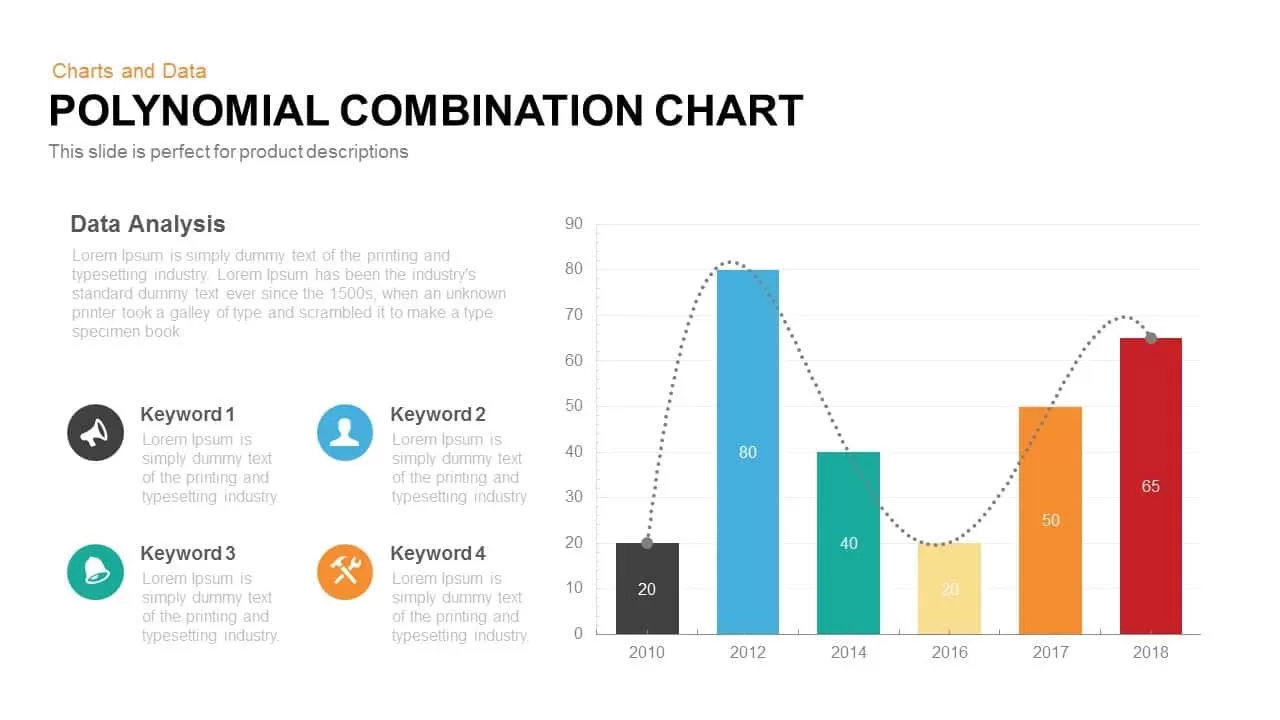
Combination Chart template for PowerPoint & Google Slides
Charts
Comparison Bar Chart template for PowerPoint & Google Slides
Comparison Chart
3D Cylinder Bar Chart Template for PowerPoint & Google Slides
Bar/Column
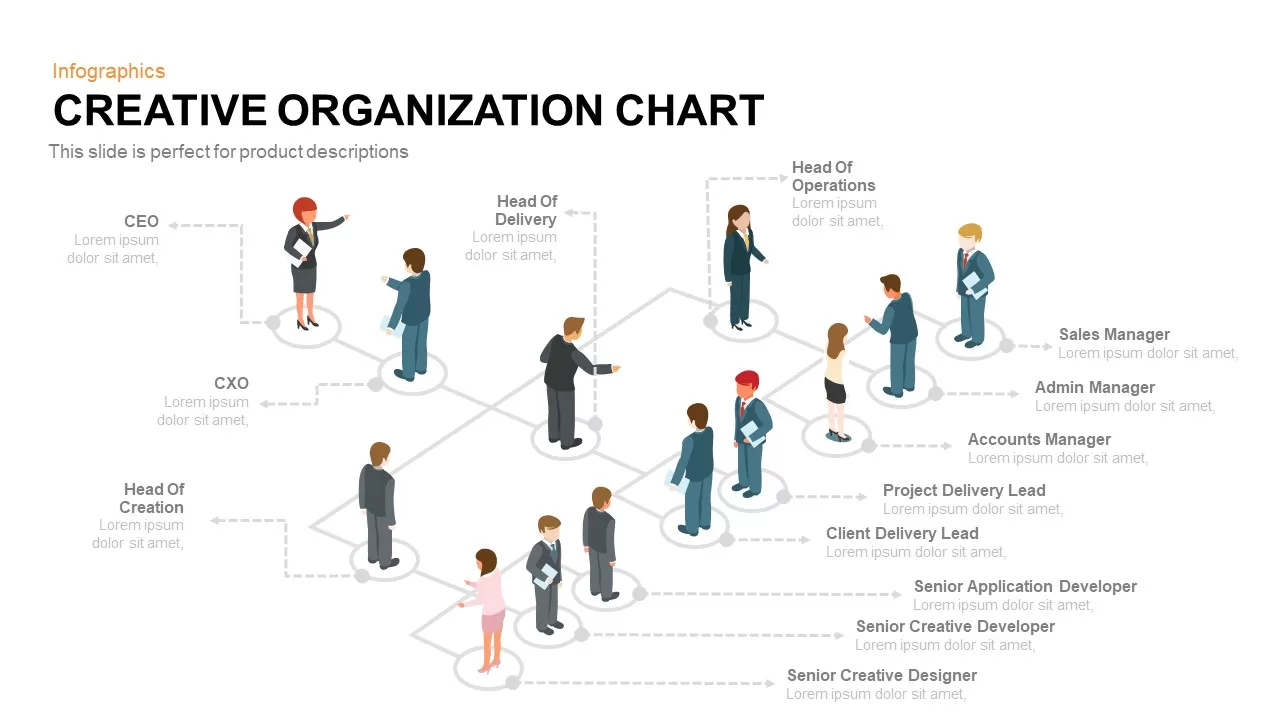
Isometric Organization Chart Diagram Template for PowerPoint & Google Slides
Org Chart
Success Key Diagram with Donut Chart Template for PowerPoint & Google Slides
Pie/Donut
Comparison Chart Overview template for PowerPoint & Google Slides
Comparison Chart
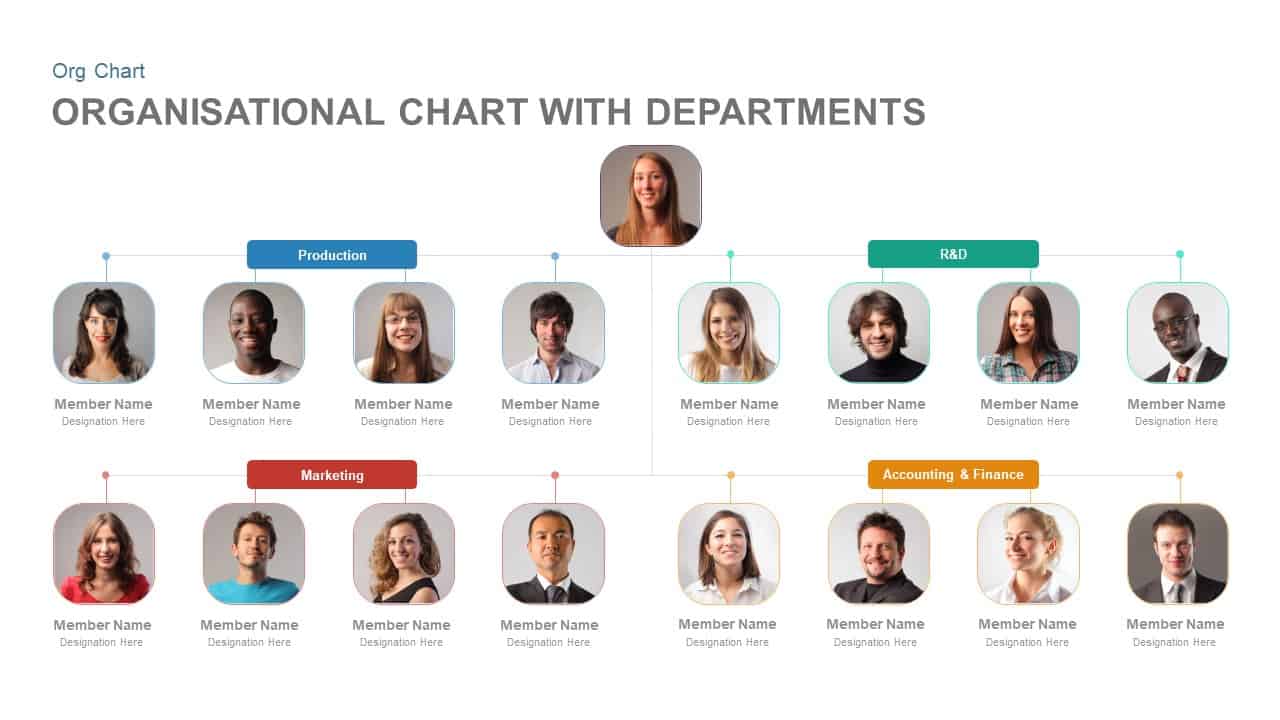
Organisational Chart with Departments Template for PowerPoint & Google Slides
Org Chart
For and Against Vote Count Bar Chart Template for PowerPoint & Google Slides
Bar/Column
Capital Structure Dynamic Split Chart Template for PowerPoint & Google Slides
Comparison Chart
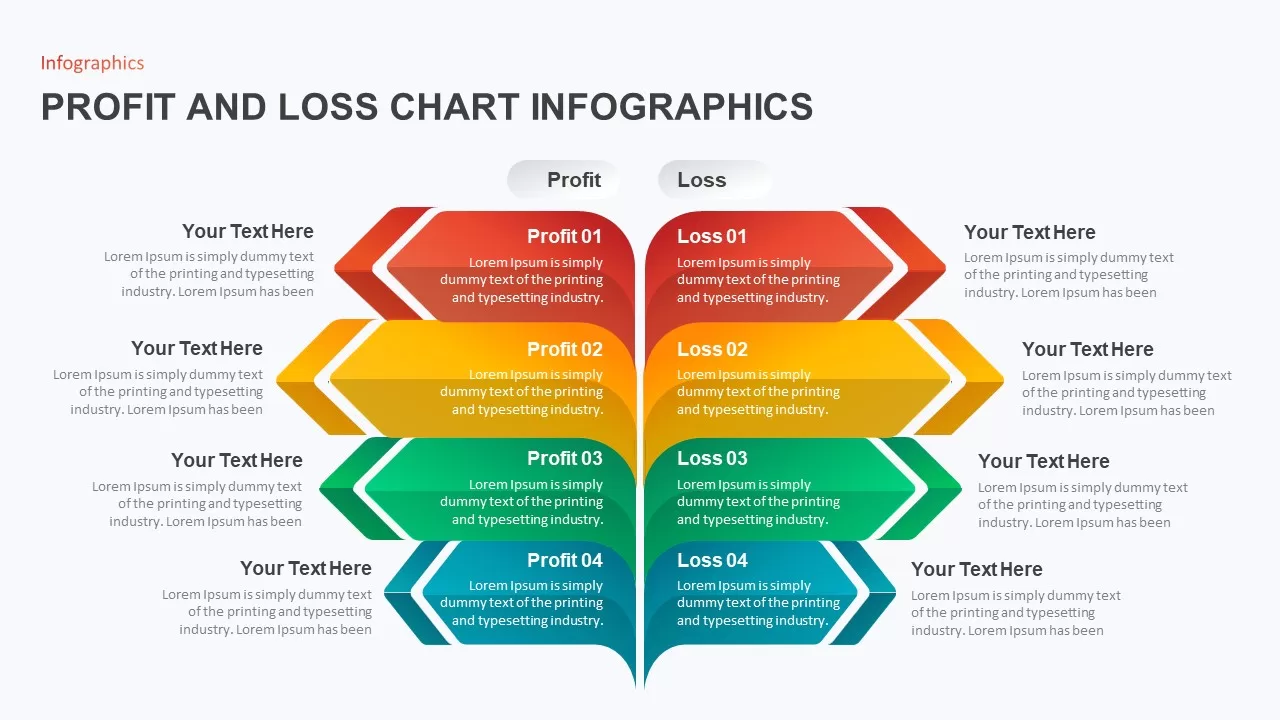
Profit and Loss Chart Infographics for PowerPoint & Google Slides
Business Report
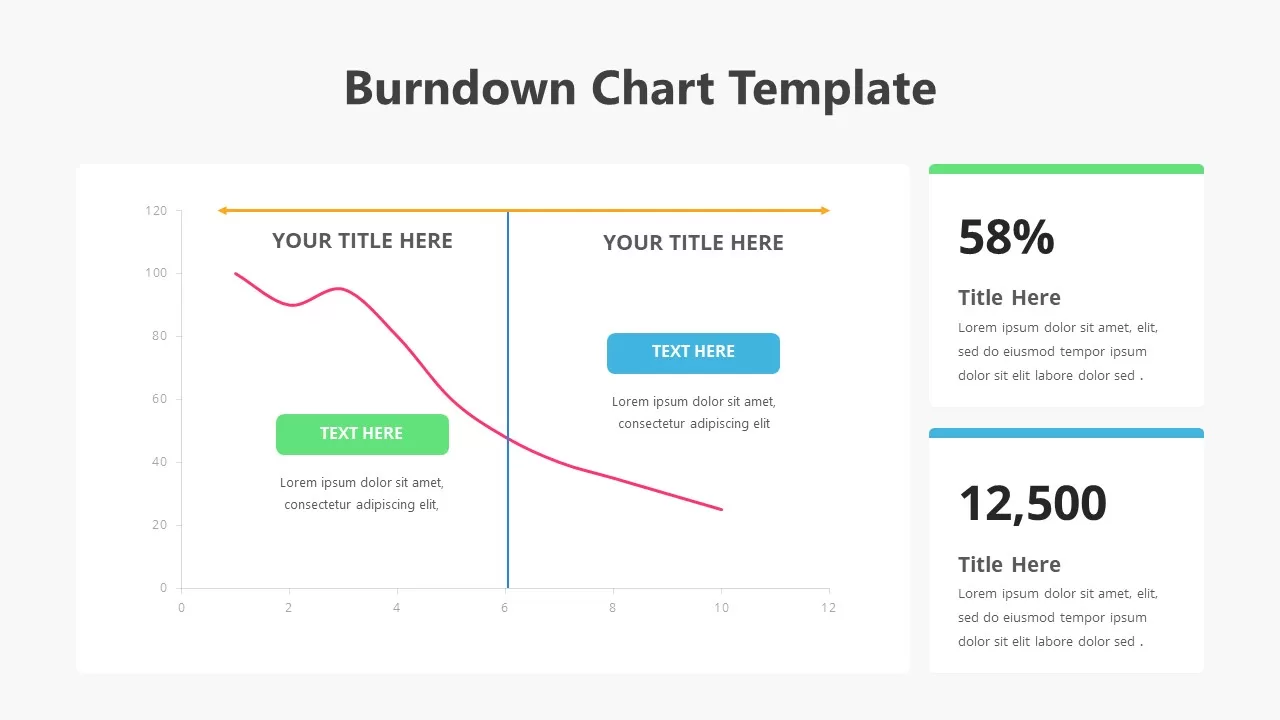
Burndown Chart Template for PowerPoint & Google Slides
Charts
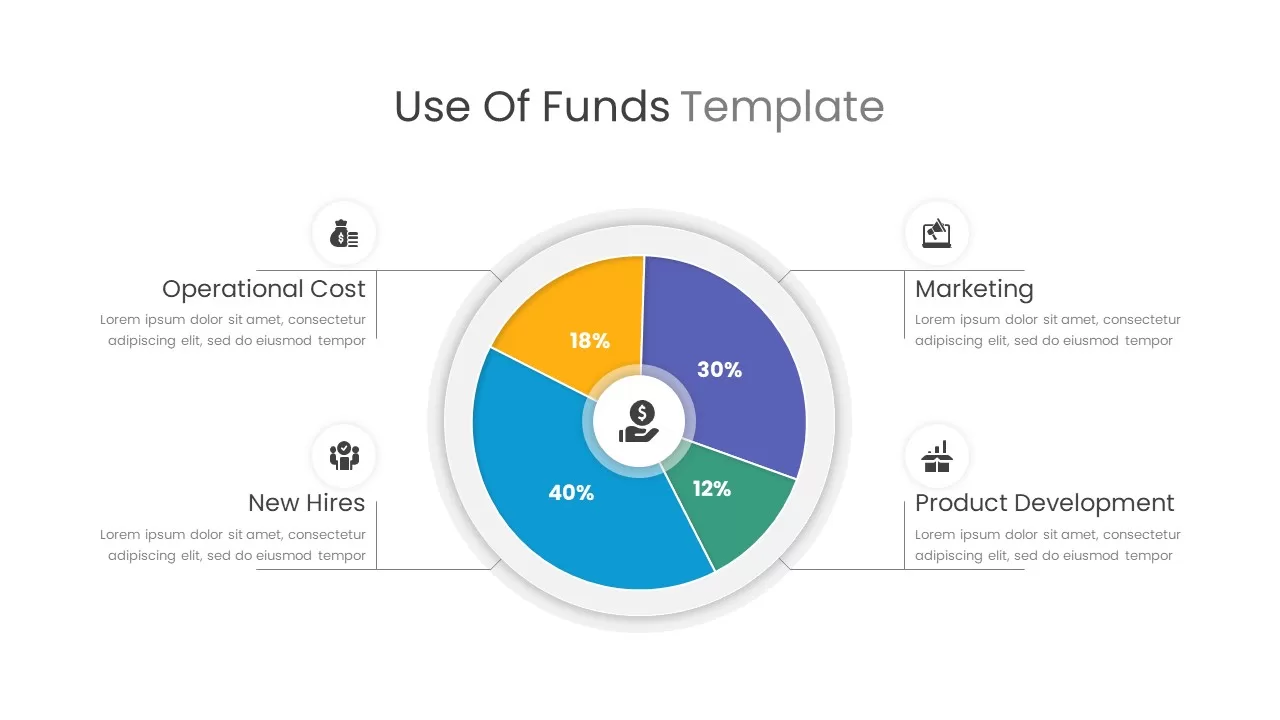
Use of Funds Donut Chart Infographic Template for PowerPoint & Google Slides
Circular
Flow Chart template for PowerPoint & Google Slides
Flow Charts
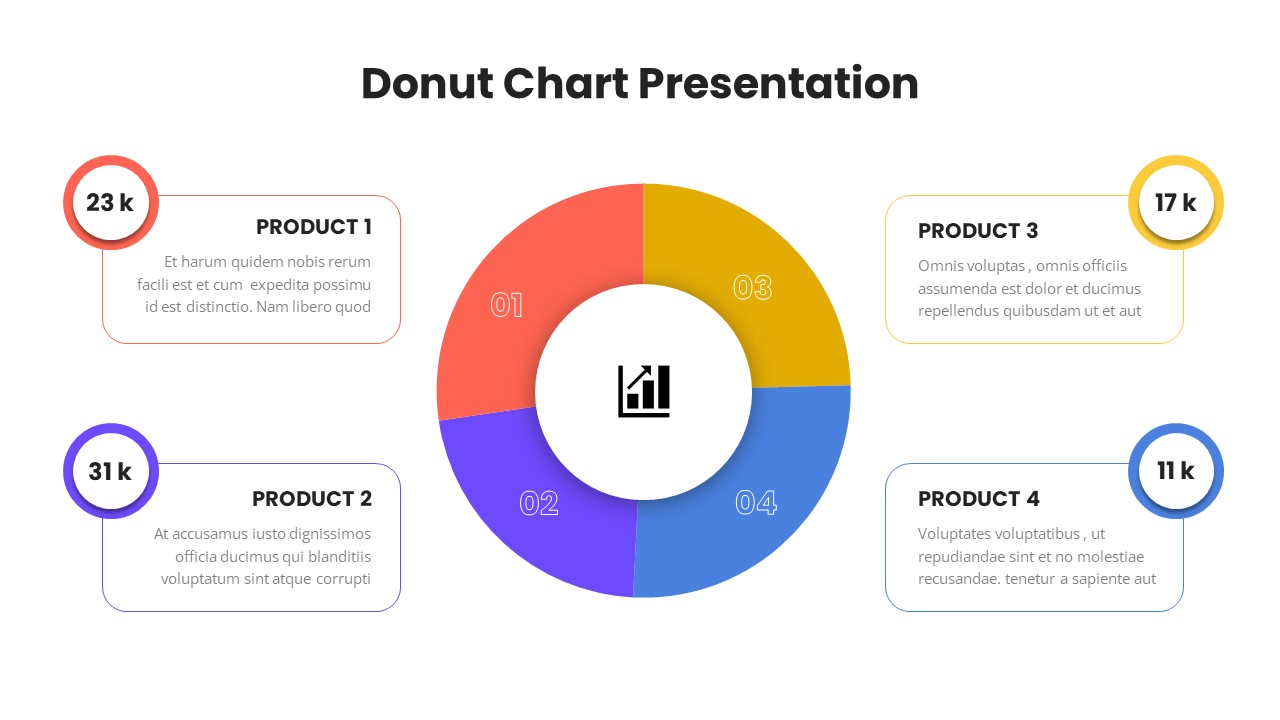
Donut Chart Presentation for PowerPoint & Google Slides
Pie/Donut
Monthly Recurring Revenue KPI Bar Chart Template for PowerPoint & Google Slides
Bar/Column
Population Pyramid Chart Analysis Template for PowerPoint & Google Slides
Bar/Column
Combination Bar and Line Chart Template for PowerPoint & Google Slides
Bar/Column
Professional Clustered Column Chart Template for PowerPoint & Google Slides
Bar/Column
Simple Scatter Chart Analysis Template for PowerPoint & Google Slides
Comparison Chart
Waterfall Bar Chart Analysis Template for PowerPoint & Google Slides
Bar/Column
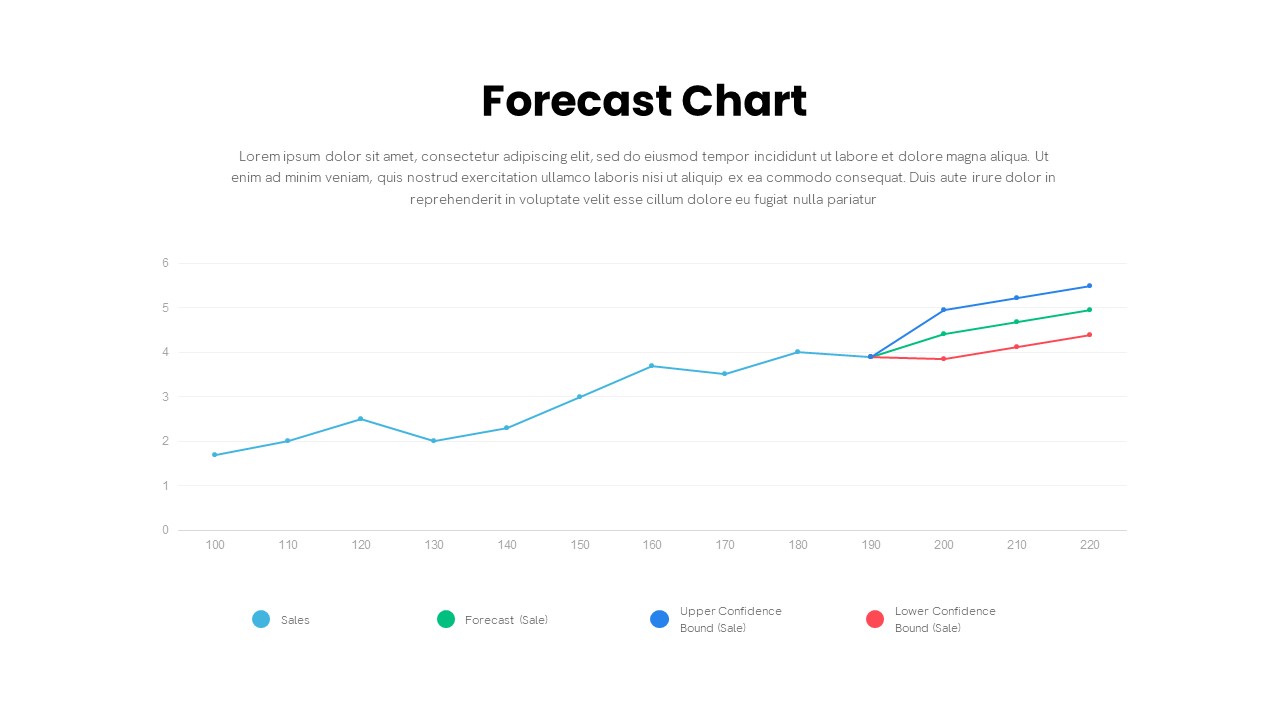
Forecast Chart with Confidence Bounds Template for PowerPoint & Google Slides
Comparison Chart
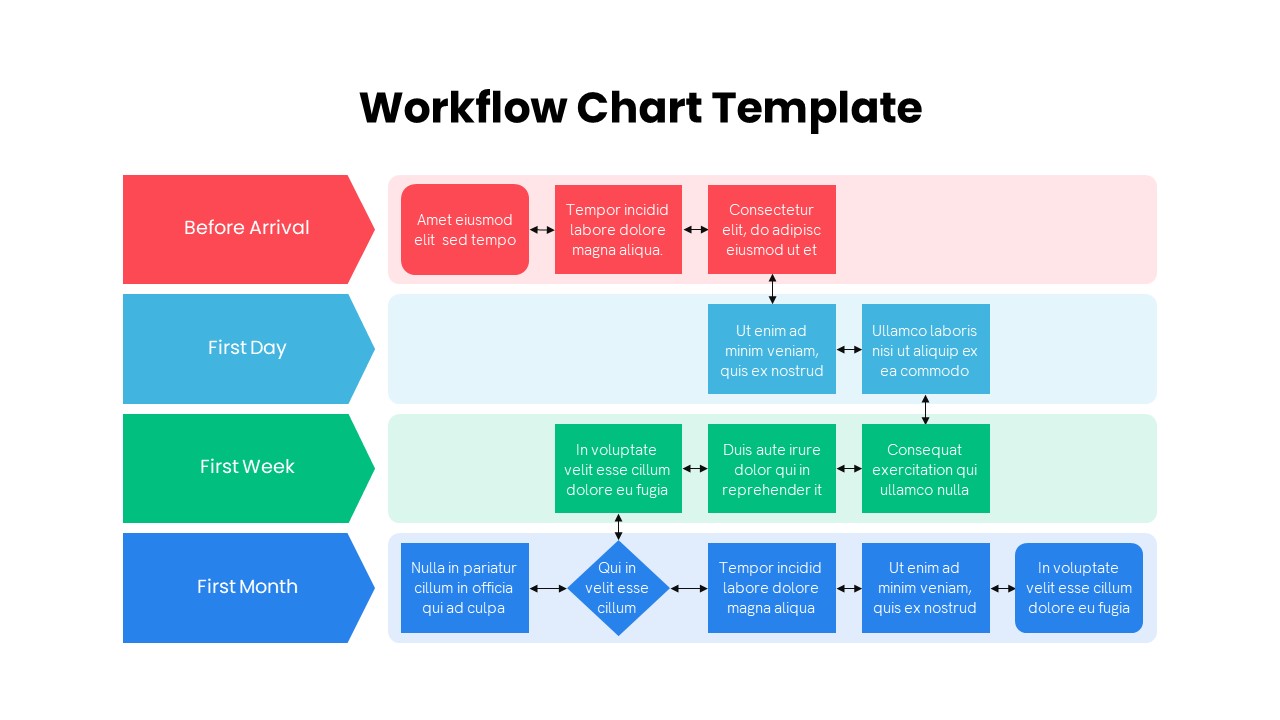
Colorful Multistage Workflow Chart Template for PowerPoint & Google Slides
Flow Charts
Dynamic Three-Series Stacked Area Chart Template for PowerPoint & Google Slides
Comparison Chart
Professional Milestone Timeline Chart Template for PowerPoint & Google Slides
Timeline
Team-Based Organizational Chart Template for PowerPoint & Google Slides
Org Chart
Dynamic Sunburst Chart Visualization Template for PowerPoint & Google Slides
Charts
Dynamic Bar-of-Pie Chart Comparison Template for PowerPoint & Google Slides
Pie/Donut
Profile Comparison Chart template for PowerPoint & Google Slides
Comparison Chart
Sales Growth Comparison Chart & Table Template for PowerPoint & Google Slides
Bar/Column
Team Gantt Chart Overview template for PowerPoint & Google Slides
Project Status
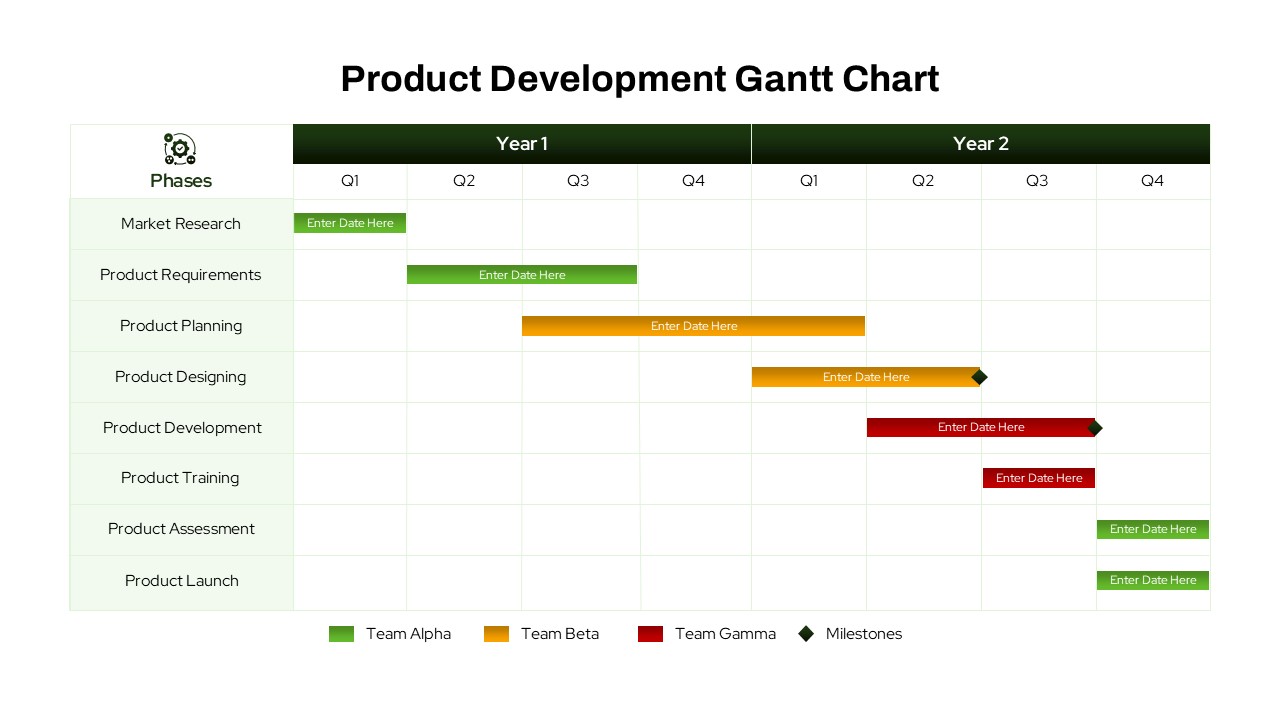
Product Development Gantt Chart template for PowerPoint & Google Slides
Gantt Chart
Three Segment Donut Chart KPI Infographic Template for PowerPoint & Google Slides
Pie/Donut