Social Media Statistics 2023 Dashboard Template for PowerPoint & Google Slides


Description
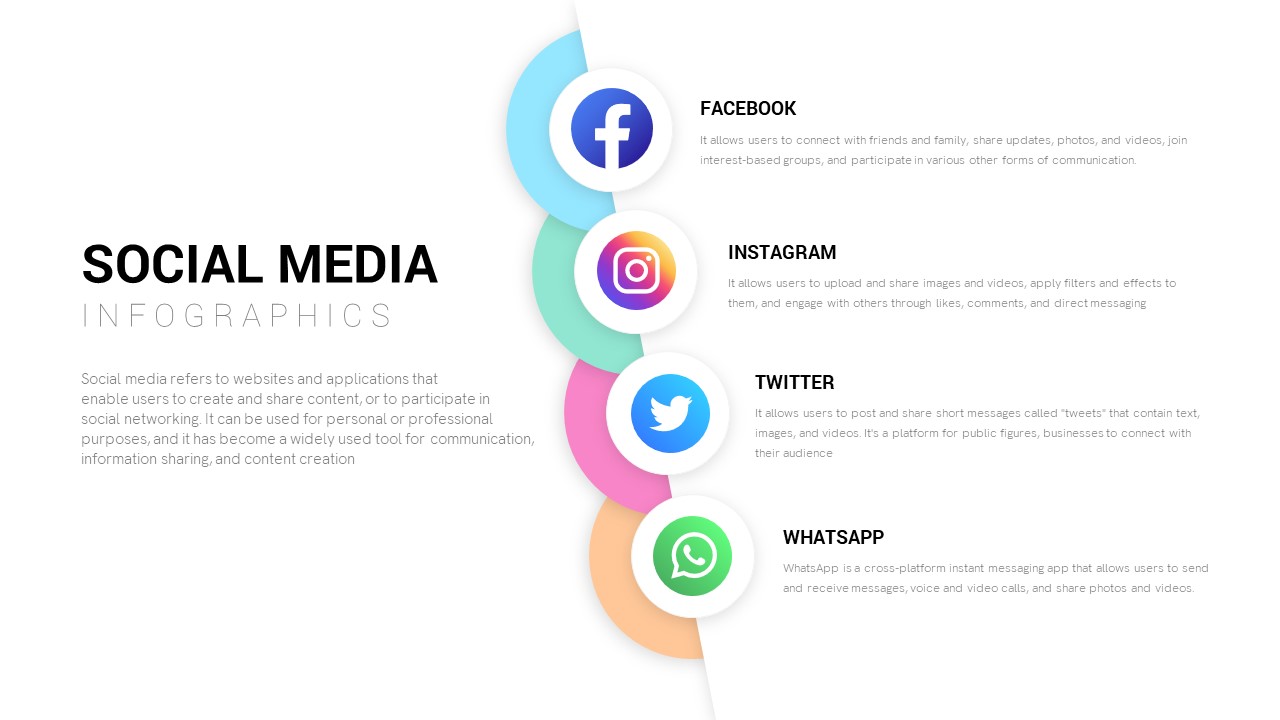
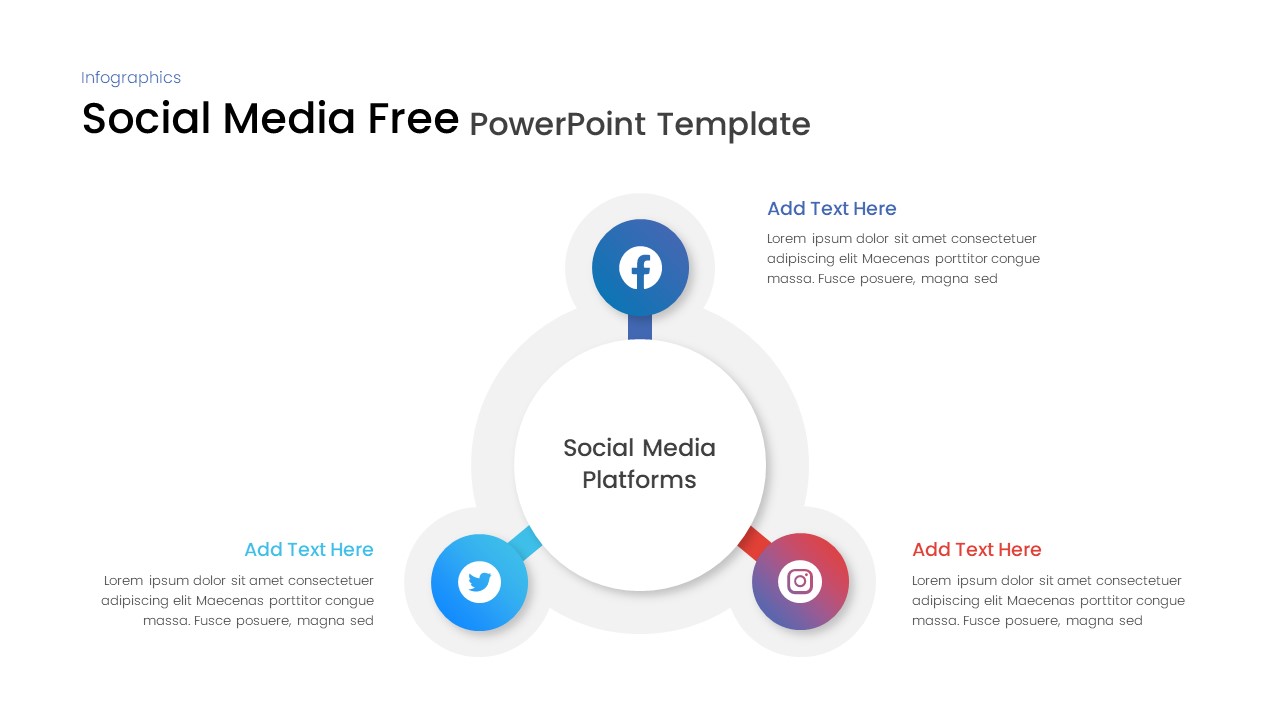
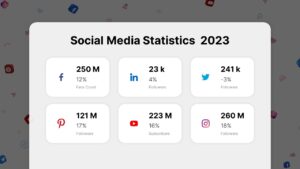
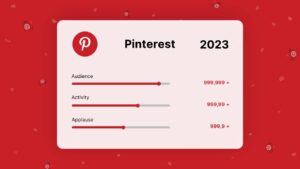
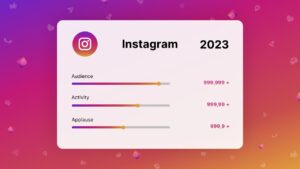
Leverage this social media statistics slide to visualize six crucial platform metrics in a clean, audience-friendly infographic tailored for 2023 reporting. The slide presents six rounded-corner cards arranged in a two-row grid, each featuring a familiar social icon—Facebook, LinkedIn, Twitter, Pinterest, YouTube, and Instagram—paired with bold headline figures and percentage indicators for fan counts, follower growth, or engagement changes. A subtle pattern of floating social logos on a neutral white canvas adds depth without distracting from the data. Organized into editable master slides, the template includes structured layers, vector-based shapes, and intuitive placeholders for text and icons, ensuring full-resolution clarity on any display.
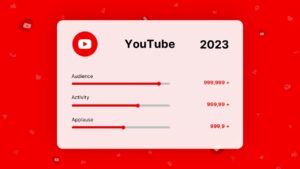
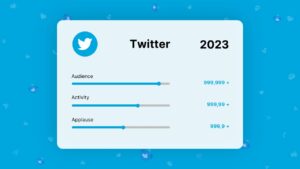
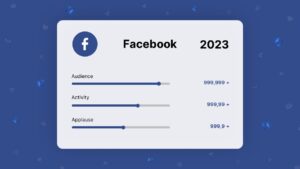
Customize every element in PowerPoint or Google Slides: swap icons to highlight alternate networks, adjust percentage values to reflect real-time analytics, or recolor the glowing rings to match your corporate palette. The grid layout supports rapid updates—reorder cards to emphasize priority channels, insert additional platforms using the same card style, or integrate charts directly into each tile. Master-slide integration enforces design consistency across large decks and streamlines version control for remote collaboration.
Ideal for marketing performance reviews, executive dashboards, and client presentations, this asset helps storytellers guide stakeholders through comparative social metrics with precision and flair. The balanced composition directs viewer attention sequentially, making complex data instantly digestible. Use the slide to benchmark campaign effectiveness, highlight audience growth trends, or inform budget allocation decisions, all while maintaining a polished, professional aesthetic.
Who is it for
Social media managers, digital marketing teams, and analytics professionals will find this slide invaluable for quarterly reviews, stakeholder briefings, and performance workshops.
Other Uses
Repurpose this grid-card framework for product feature comparisons, quarterly sales dashboards, team KPI reports, or competitive benchmarking by updating icons and metrics.
Login to download this file

Item ID
SB03422
Related Templates

Social Media Performance Dashboard Template for PowerPoint & Google Slides
Bar/Column
Social Media Analytics Dashboard Template for PowerPoint & Google Slides
Digital Marketing
Free Infographic Statistics Dashboard Slide for PowerPoint & Google Slides
Bar/Column
Free
Free New Year’s Resolution Slides Pack for PowerPoint & Google Slides 2023
Graphics
Free
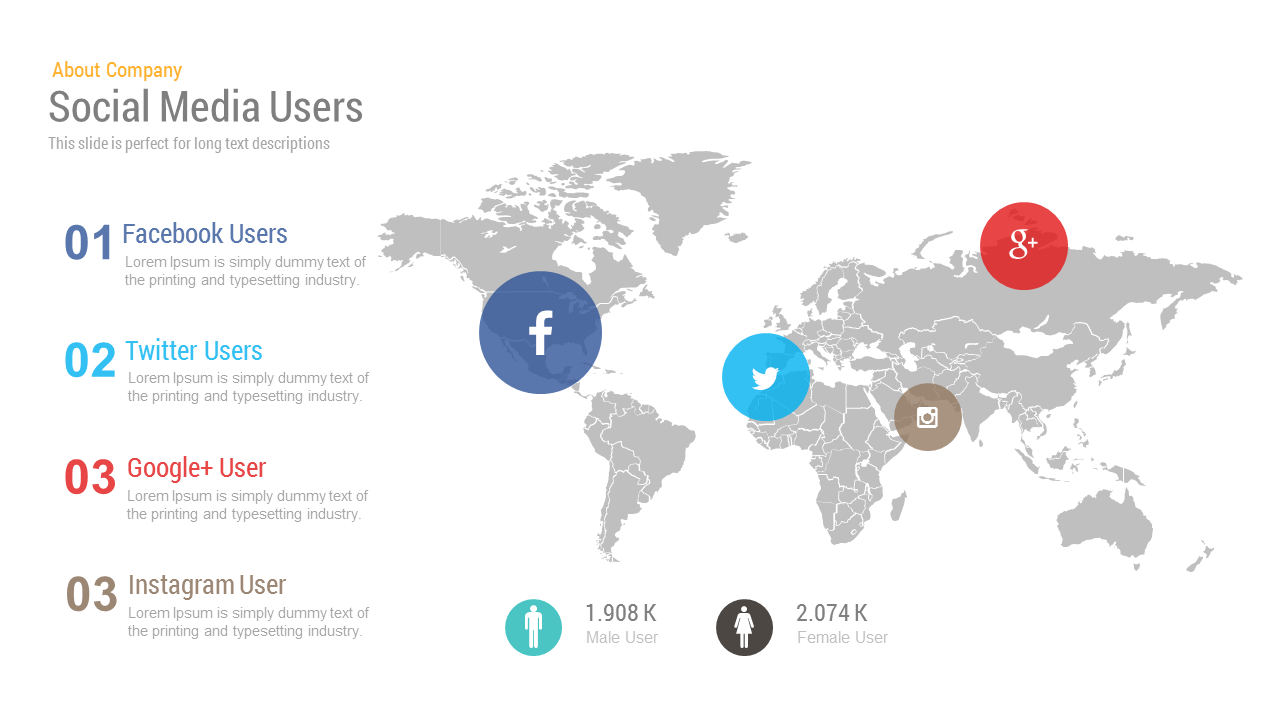
Free Social Media Users Map template for PowerPoint & Google Slides
World Maps
Free
Social Media Metrics template for PowerPoint & Google Slides
Comparison Chart
Comprehensive Social Media Icons Slide Template for PowerPoint & Google Slides
Advertising

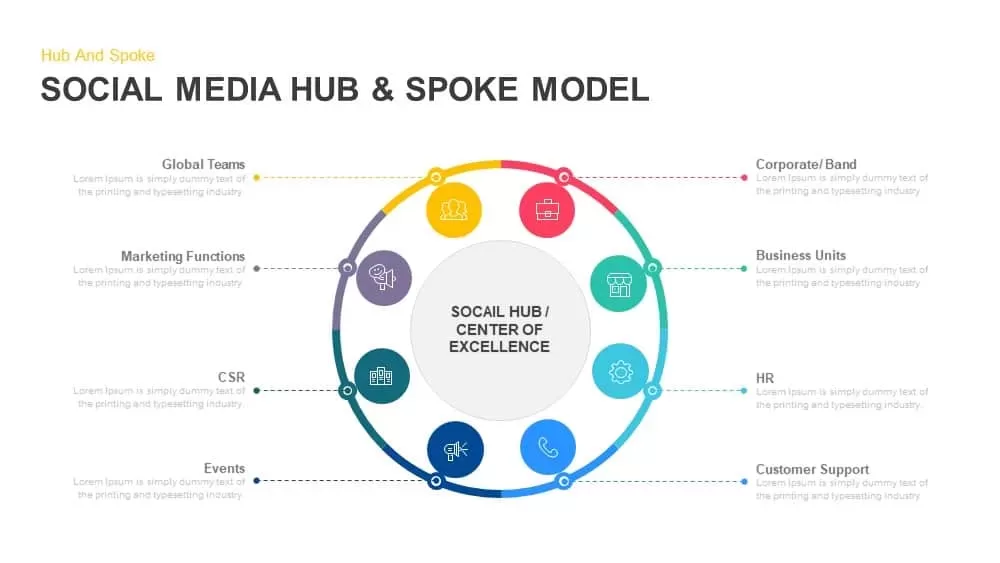
Social Media Hub & Spoke Model Template for PowerPoint & Google Slides
Process
Social Media Market Share Pie Charts Template for PowerPoint & Google Slides
Pie/Donut
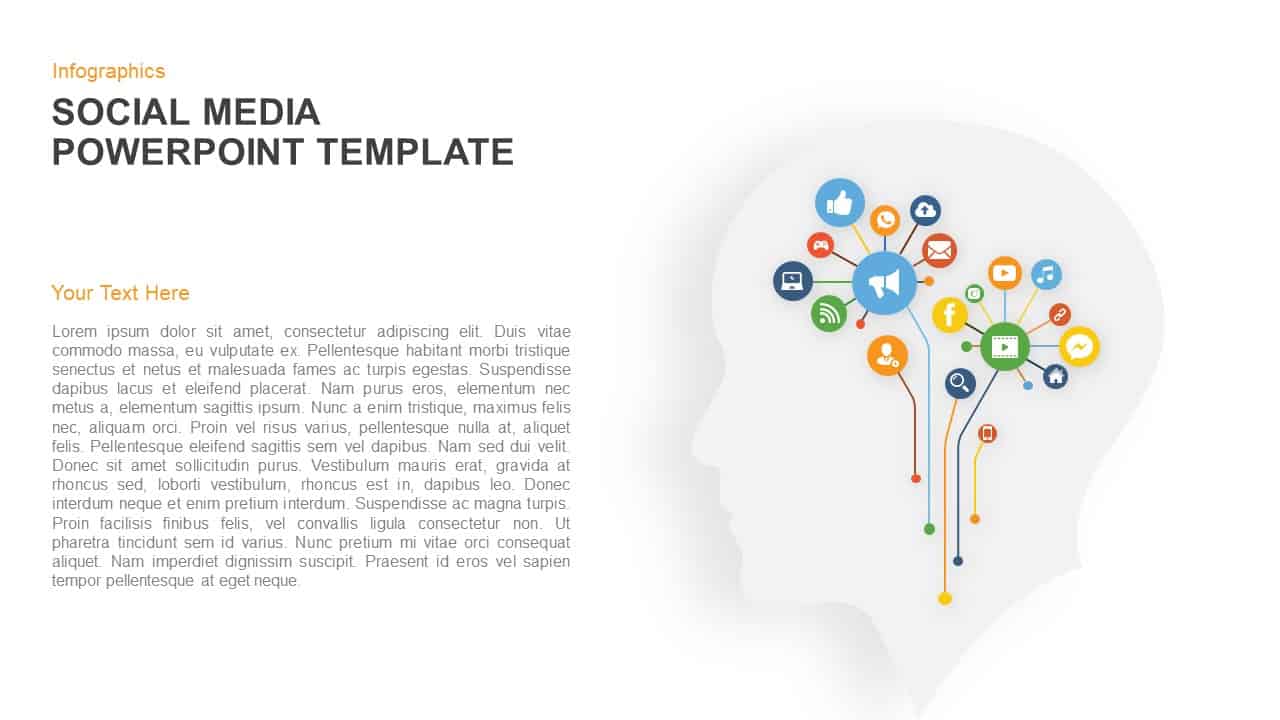
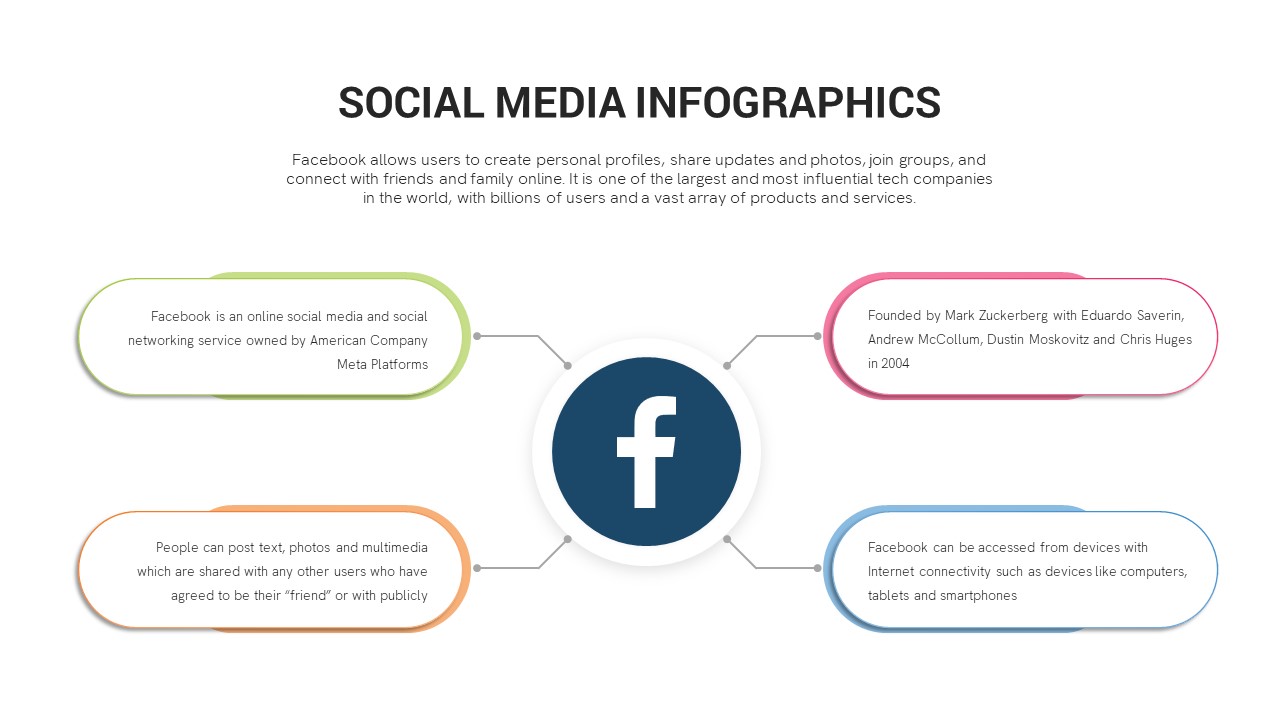
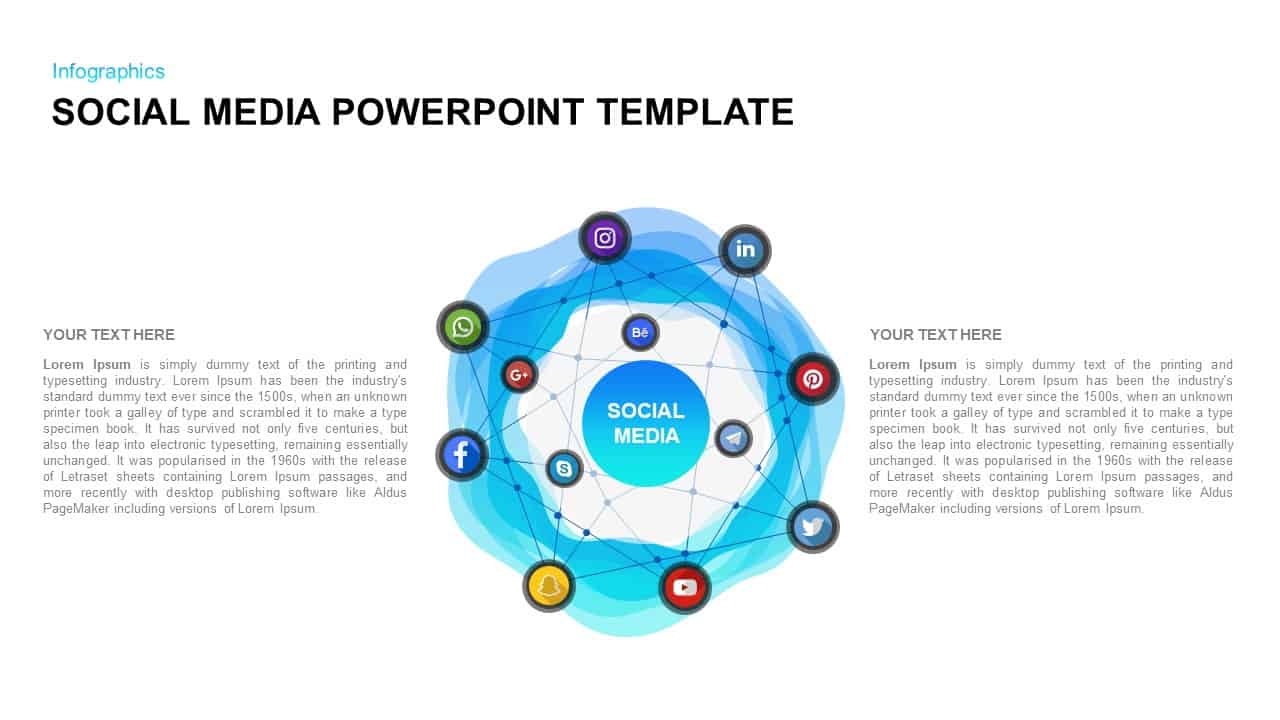
Social Media Mind Network Infographic Template for PowerPoint & Google Slides
Digital Marketing
Social Media Rocket Launch Infographic Template for PowerPoint & Google Slides
Marketing
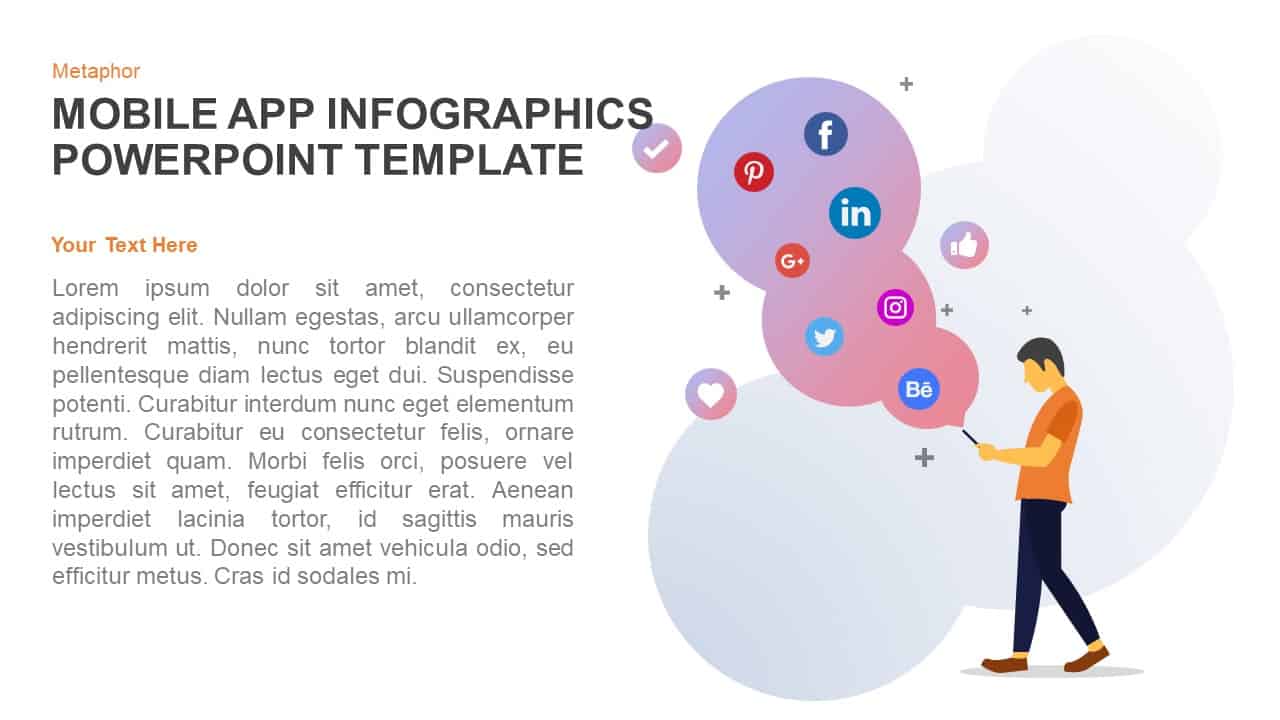
Mobile App Social Media Metaphor Template for PowerPoint & Google Slides
Infographics
Social Media Network Infographic Template for PowerPoint & Google Slides
Circular
Social Media Metaphor Illustration Template for PowerPoint & Google Slides
Digital Marketing
Social Media Marketing Tool Template for PowerPoint & Google Slides
Digital Marketing
Free 3D Social Media Icons template for PowerPoint & Google Slides
Digital Marketing
Free
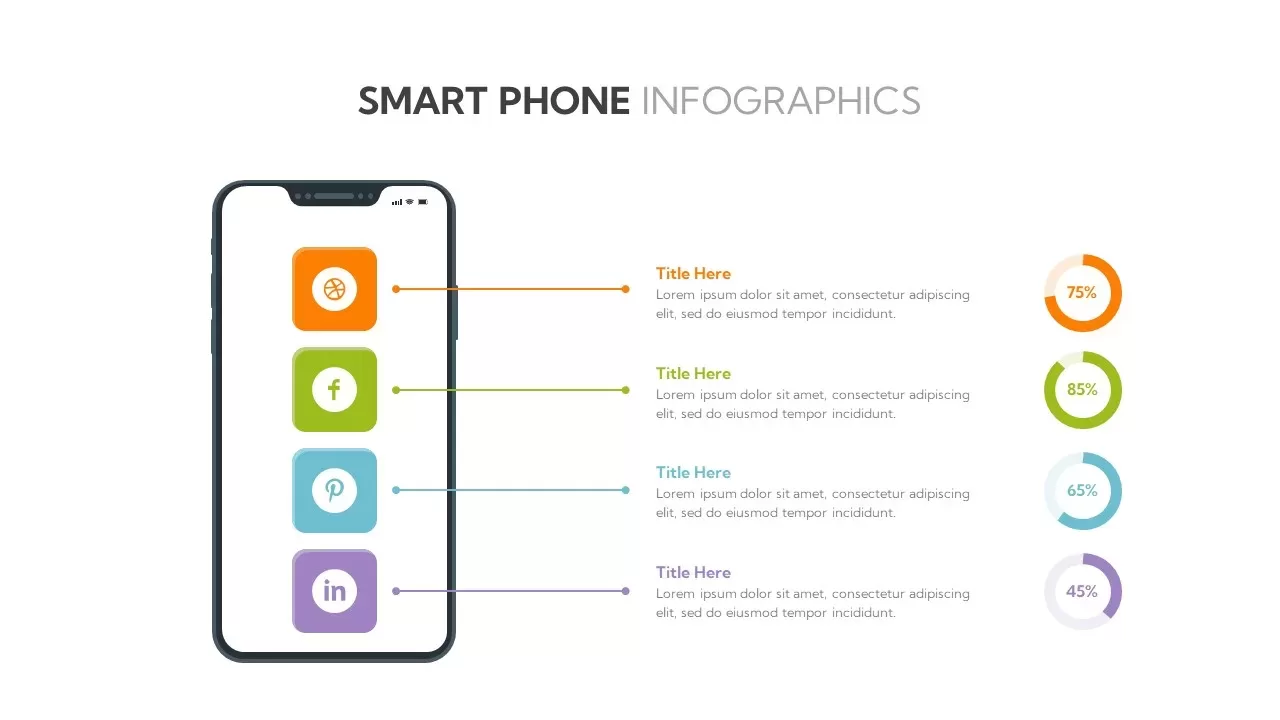
Social Media Smartphone Infographic Template for PowerPoint & Google Slides
Pie/Donut
Popular Social Media Comparison Grid Template for PowerPoint & Google Slides
Digital Marketing

Social Media Marketing Agency Pitch Deck Template for PowerPoint & Google Slides
Pitch Deck
Social Media Community Network Slide Template for PowerPoint & Google Slides
Circular
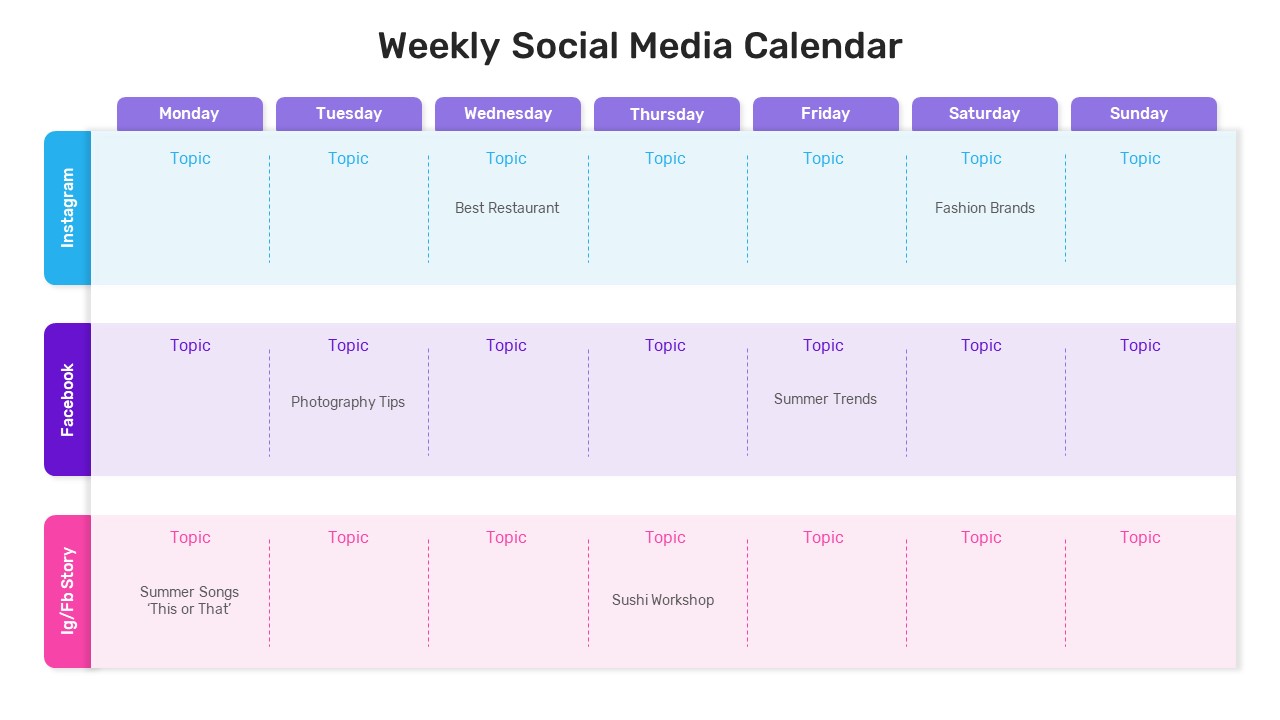
Weekly Social Media Calendar Editable Template for PowerPoint & Google Slides
Digital Marketing
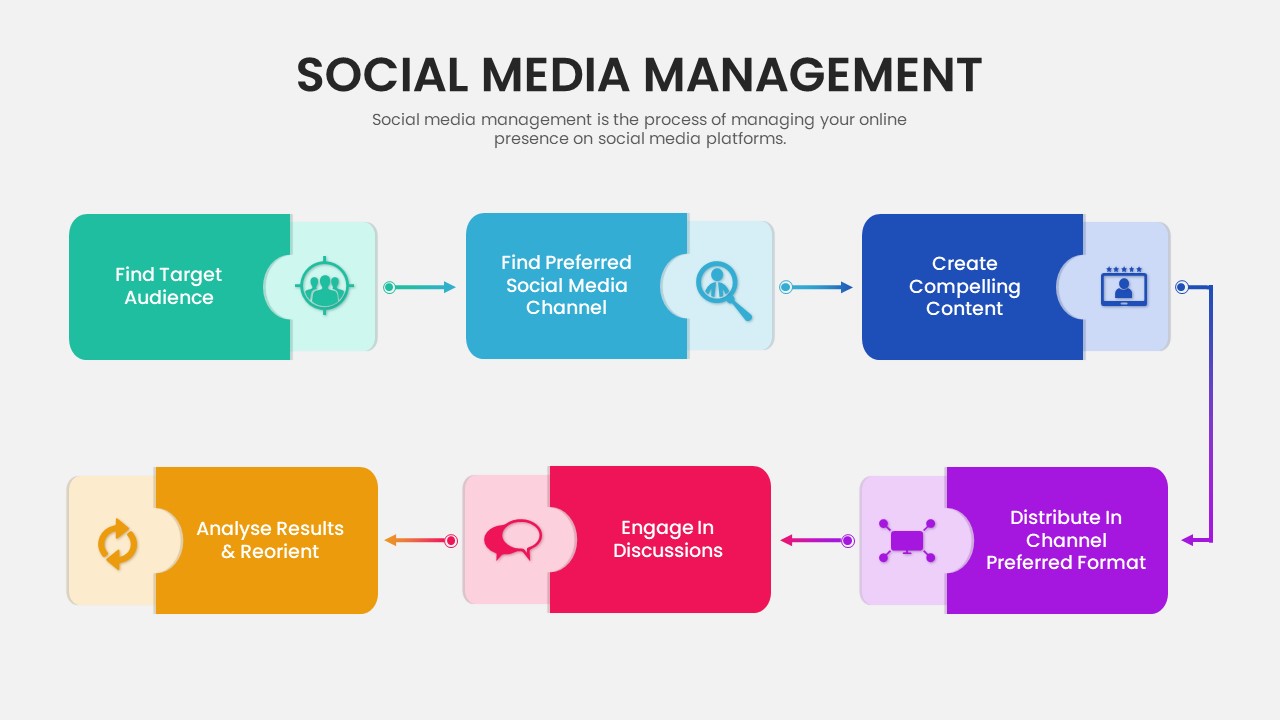
Six-Step Social Media Management Process Template for PowerPoint & Google Slides
Process
Modern Social Media Infographics Template for PowerPoint & Google Slides
Digital Marketing
Social Media Infographic Arrow Layout Template for PowerPoint & Google Slides
Arrow
Social Media Plan Table Slide Deck Template for PowerPoint & Google Slides
Process
Social Media Marketing Connection Template for PowerPoint & Google Slides
Digital Marketing
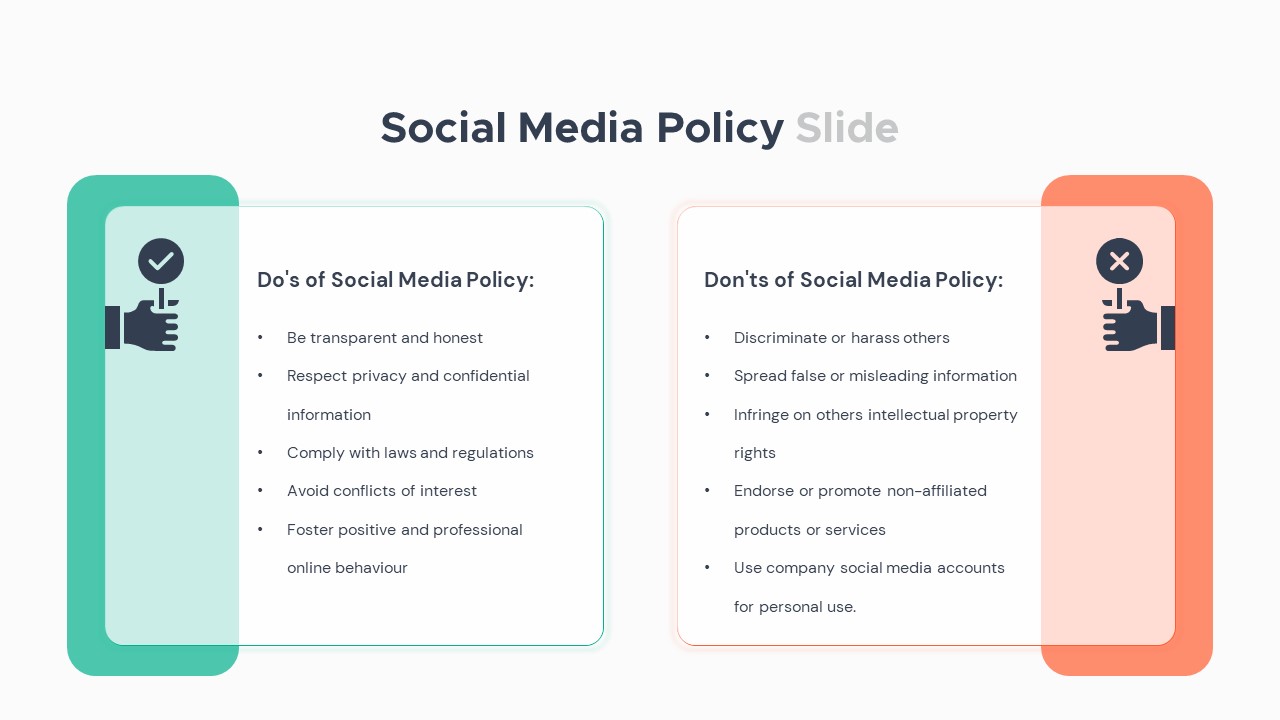
Social Media Policy Dos & Don’ts Slide Template for PowerPoint & Google Slides
Comparison
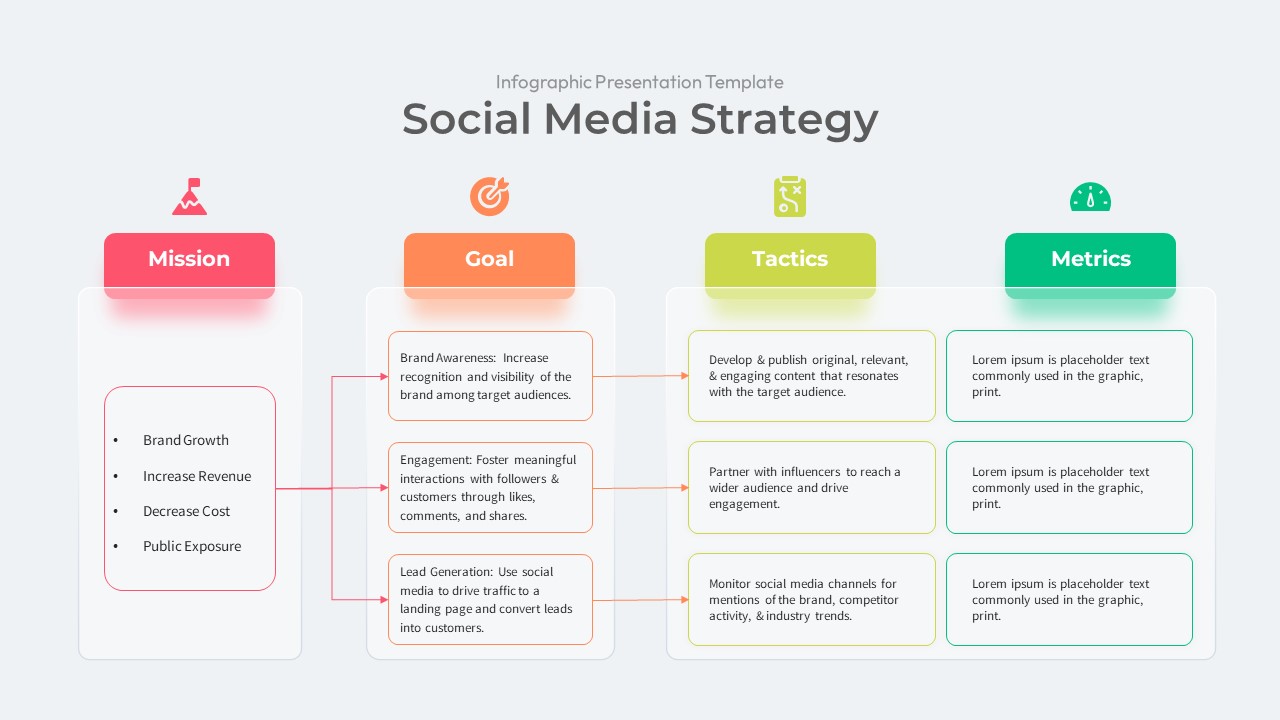
Social Media Marketing Strategy Template for PowerPoint & Google Slides
Digital Marketing
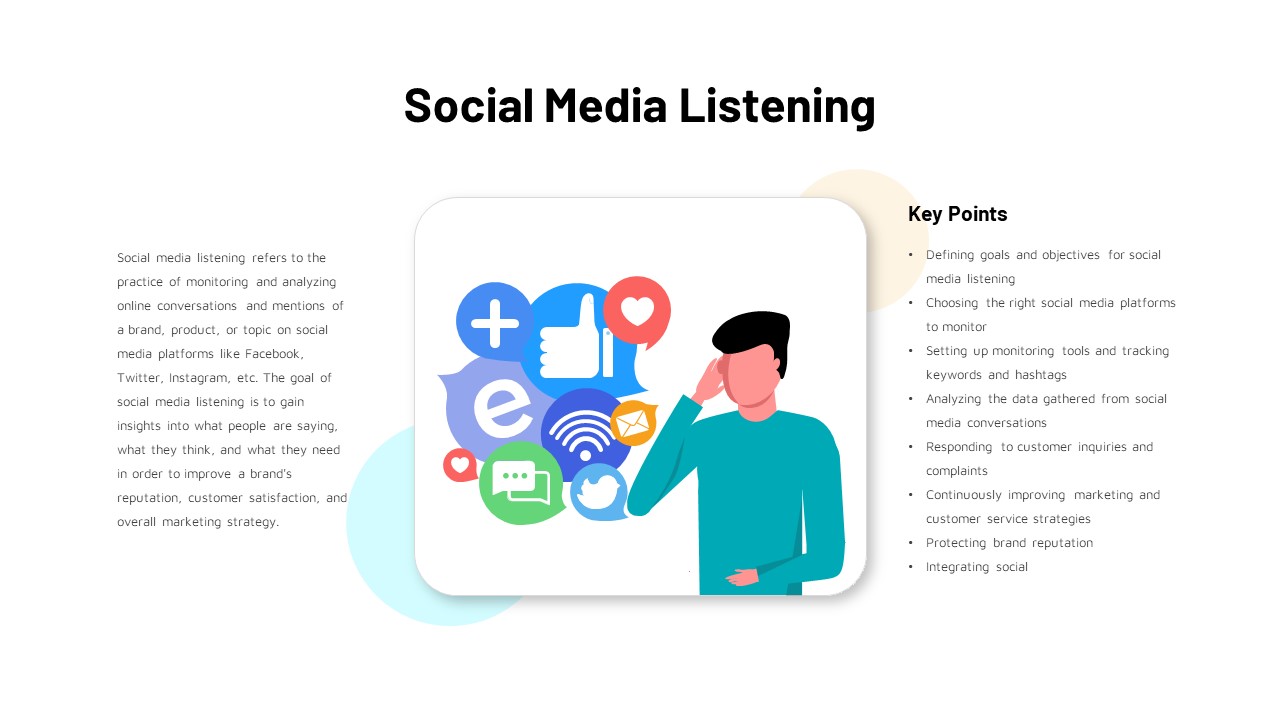
Social Media Listening Overview Slide Template for PowerPoint & Google Slides
Customer Experience
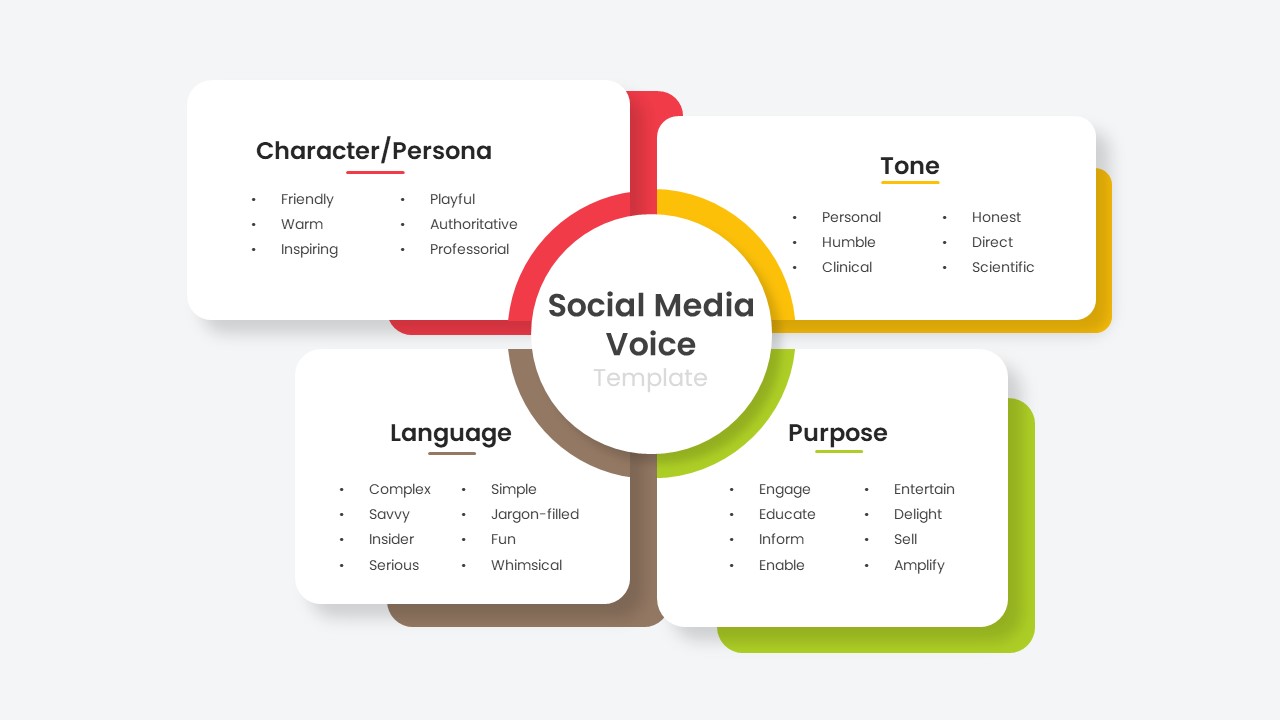
Social Media Voice Template for PowerPoint & Google Slides
Customer Experience
Social Media Hub-and-Spoke Infographics Template for PowerPoint & Google Slides
Circular
Social Media Analysis Metrics Slide Deck Template for PowerPoint & Google Slides
Digital Marketing
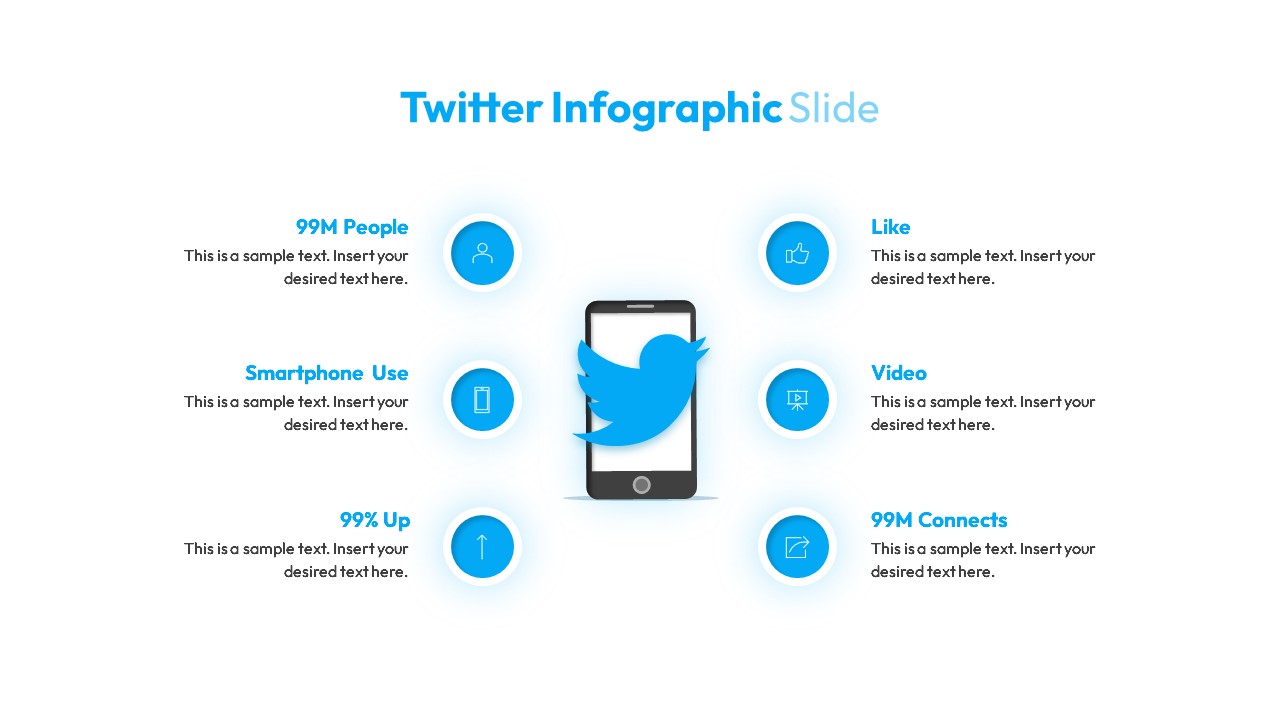
Twitter Social Media Infographic Template for PowerPoint & Google Slides
Circular
Social Media Report Presentation Template for PowerPoint & Google Slides
Digital Marketing
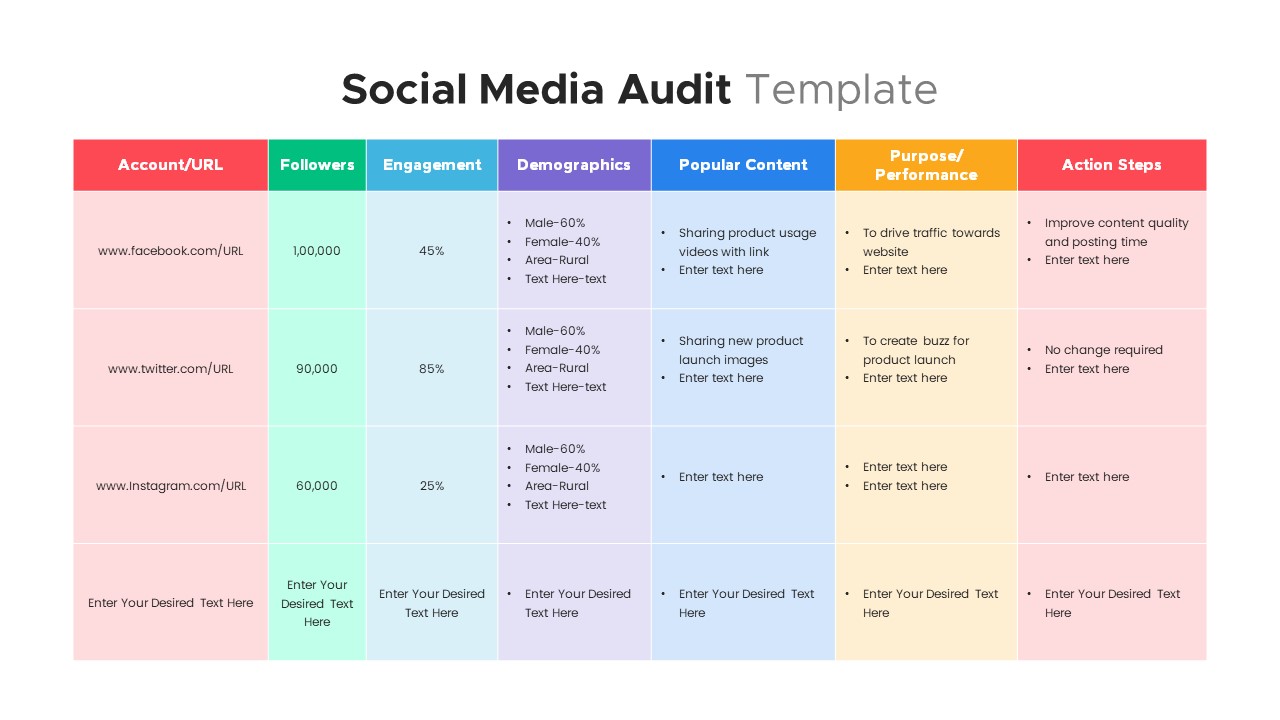
Comprehensive Social Media Audit Template for PowerPoint & Google Slides
Digital Marketing
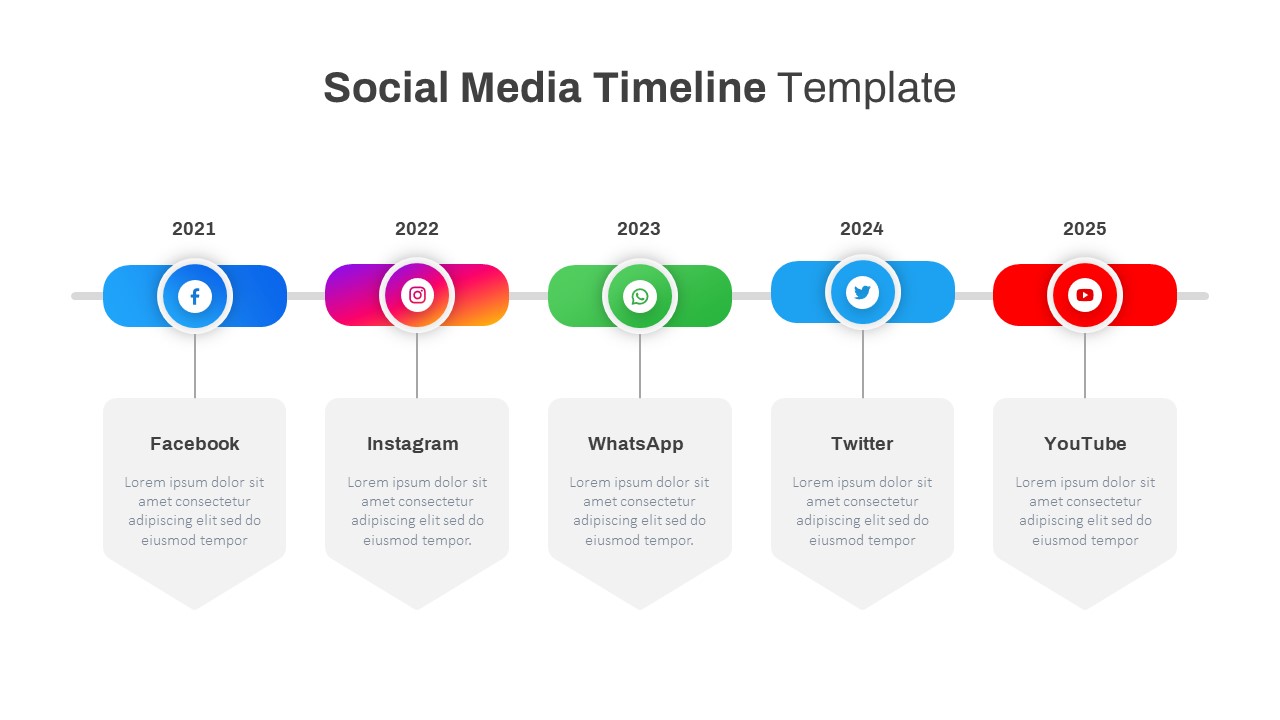
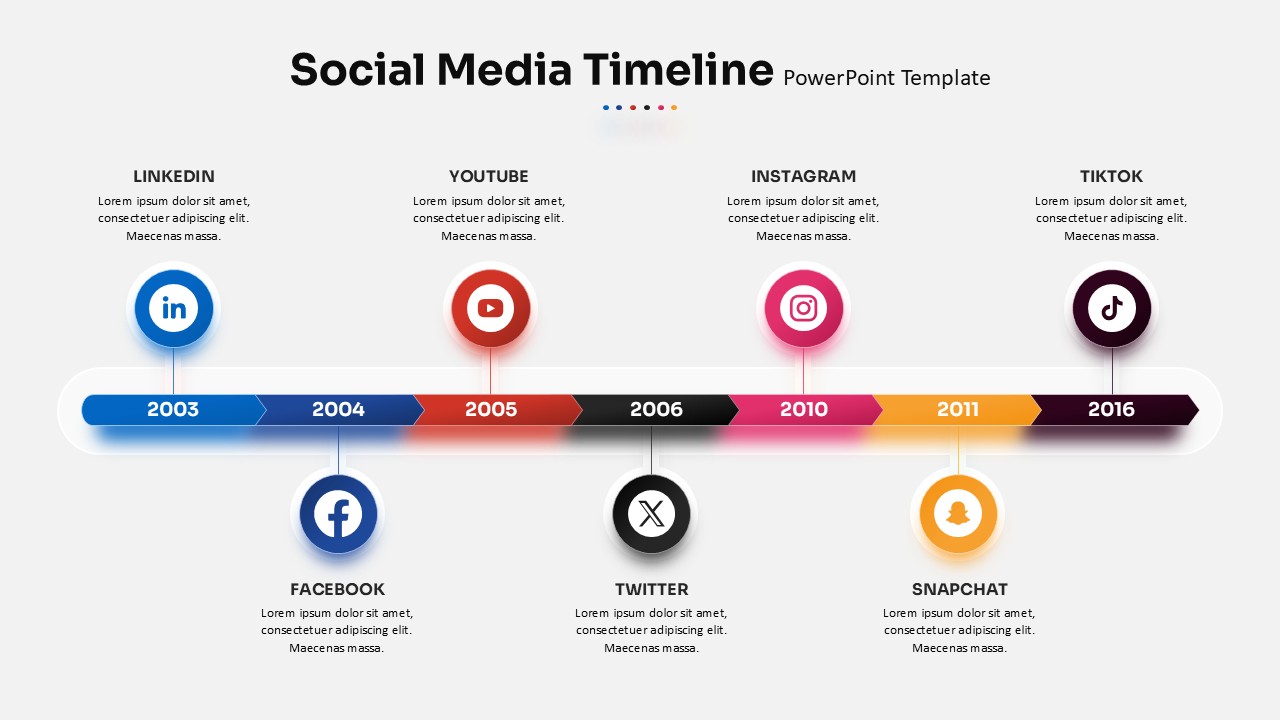
Modern Social Media Timeline Roadmap Template for PowerPoint & Google Slides
Timeline

Social Media Marketing Presentation Template for PowerPoint & Google Slides
Decks
Free Social Media Hub-and-Spoke Infographic Template for PowerPoint & Google Slides
Circular
Free
Social Media Presentation Template for PowerPoint & Google Slides
Pitch Deck
Social Media Marketing Overview Template for PowerPoint & Google Slides
Advertising
Social Media Timeline template for PowerPoint & Google Slides
Timeline
Social Media Recruiting Strategy template for PowerPoint & Google Slides
Business
Social Media Network Hub Diagram Slide for PowerPoint & Google Slides
Process
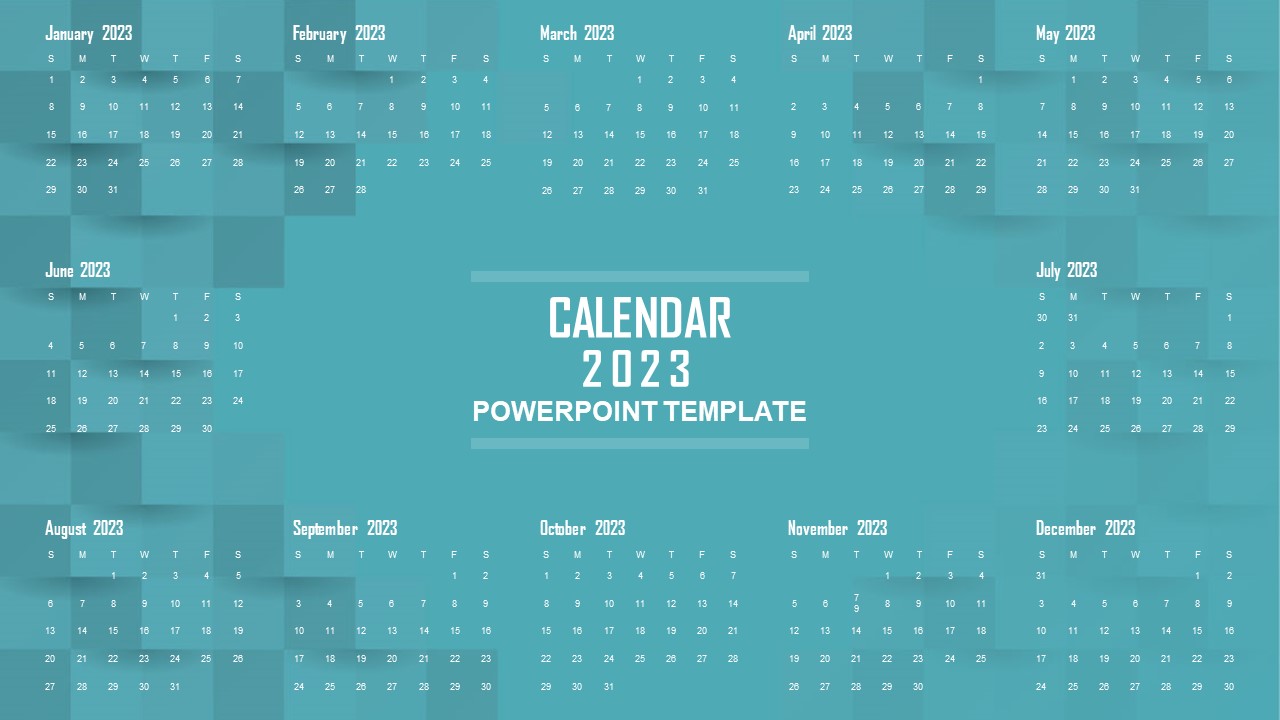
Elegant 2023 Annual Calendar Overview Template for PowerPoint & Google Slides
Timeline
2023 Calendar Monthly Overview template for PowerPoint & Google Slides
Business
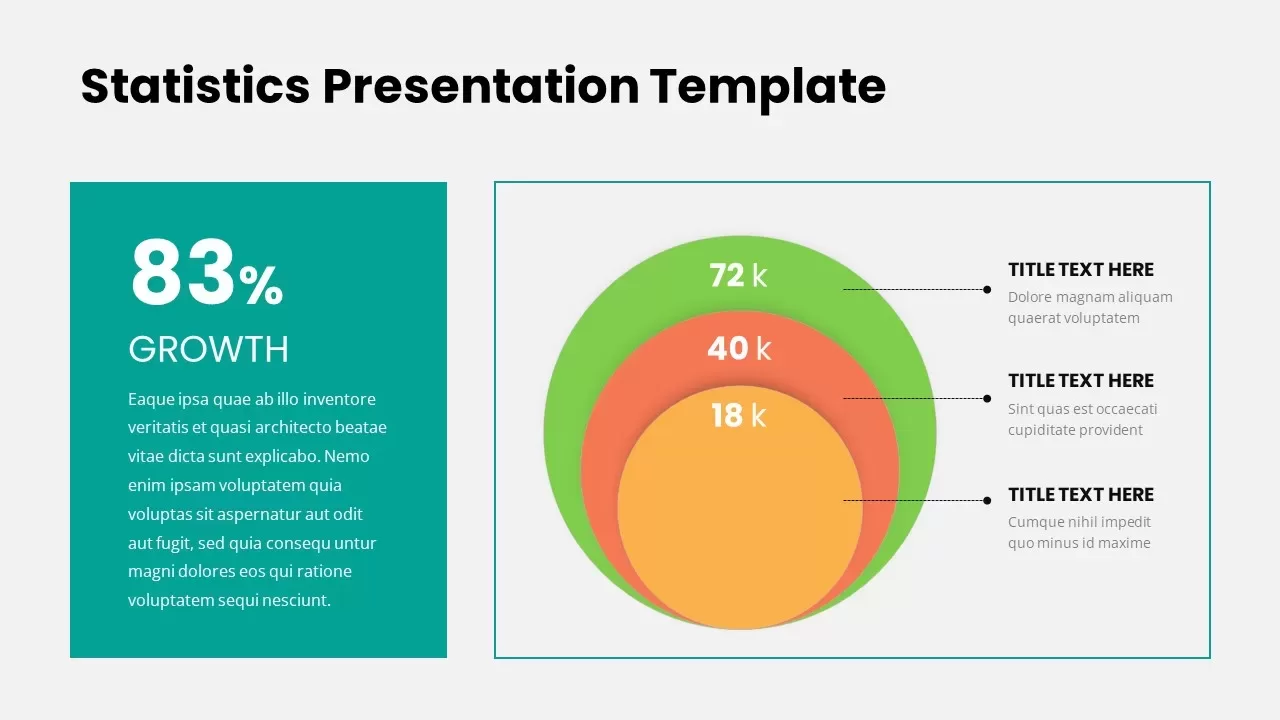
Statistics Presentation Template for PowerPoint & Google Slides
Business Report
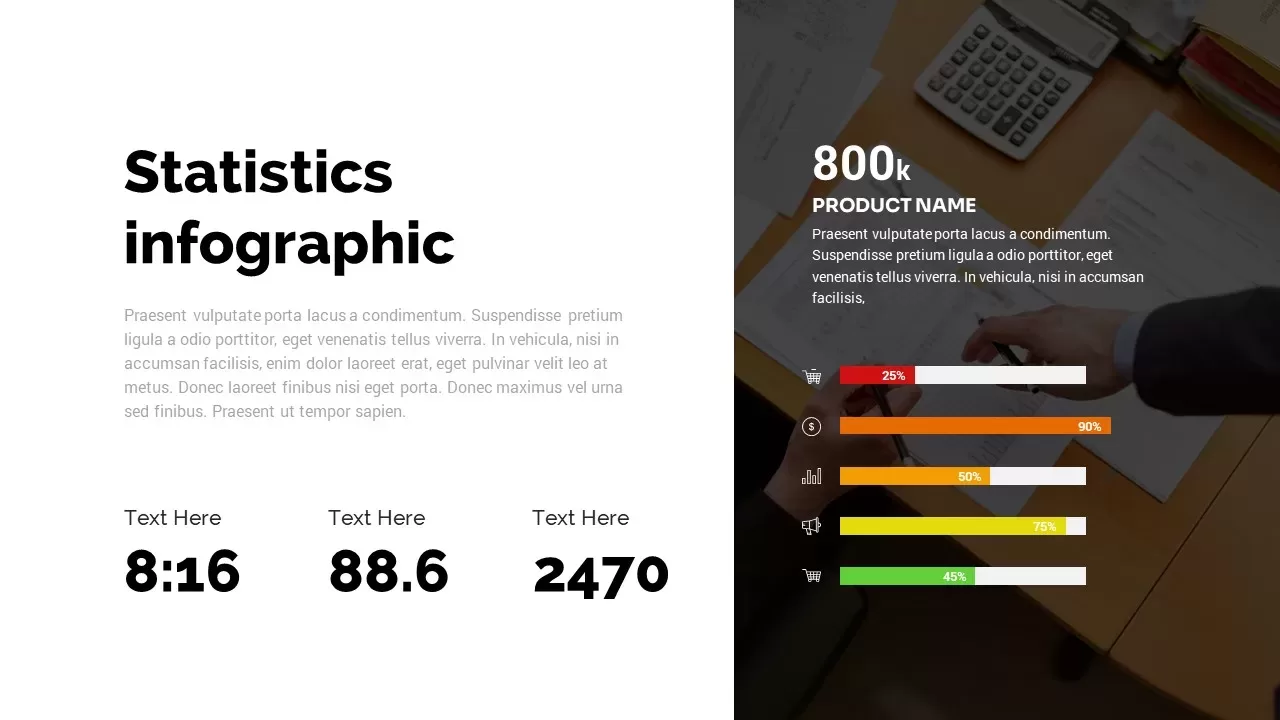
Statistics Infographic Template for PowerPoint & Google Slides
Infographics
Statistics Infographic & KPI Bar Chart Template for PowerPoint & Google Slides
Bar/Column
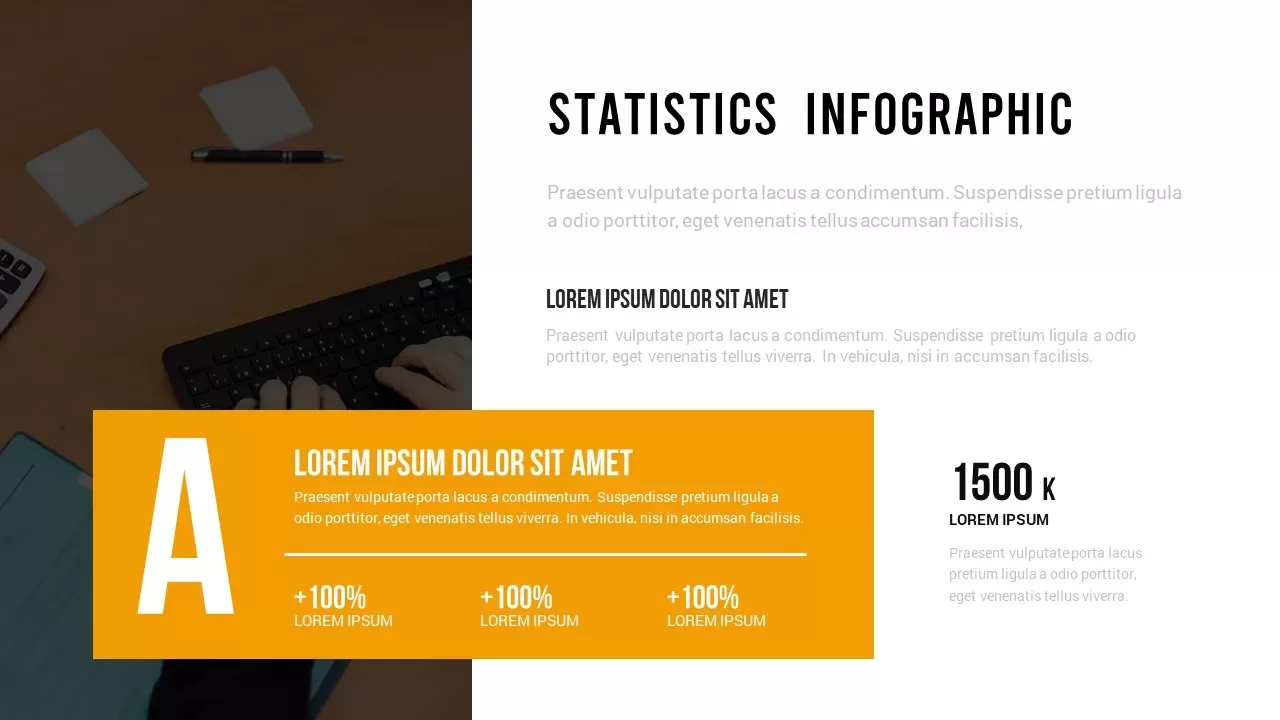
Statistics Infographic Template for PowerPoint & Google Slides
Bar/Column
Statistics Infographic Template for PowerPoint & Google Slides
Infographics
Dynamic Statistics & Progress Charts Template for PowerPoint & Google Slides
Pie/Donut
Statistics & Global Metrics Infographic Template for PowerPoint & Google Slides
Bar/Column
Free KPI Dashboard PowerPoint Template for PowerPoint & Google Slides
Charts
Free

Dynamic Data Dashboard Infographic Template for PowerPoint & Google Slides
Bar/Column
Product Usage Analytics Dashboard Chart Template for PowerPoint & Google Slides
Bar/Column

Efficiency KPI Dashboard Metaphor Template for PowerPoint & Google Slides
Infographics
Business Dashboard Analytics & KPIs Template for PowerPoint & Google Slides
Bar/Column

Professional Team Efficiency Dashboard Template for PowerPoint & Google Slides
Business Report
Project Management Dashboard Template for PowerPoint & Google Slides
Project
Employee Skill Analysis Dashboard Template for PowerPoint & Google Slides
Employee Performance
Net Promoter Score Dashboard Template for PowerPoint & Google Slides
Customer Experience
Bull and Bear Stock Market Dashboard Template for PowerPoint & Google Slides
Infographics
KPI Dashboard Overview template for PowerPoint & Google Slides
Finance
Professional Nurse Infographic Dashboard Template for PowerPoint & Google Slides
Nursing
Project Status Dashboard with Metrics Template for PowerPoint & Google Slides
Project Status
Weekly Update Schedule Dashboard Template for PowerPoint & Google Slides
Agenda
Project Status Dashboard Template for PowerPoint & Google Slides
Project Status
Weekly Status Report Dashboard Template for PowerPoint & Google Slides
HR
Free Metro UI Dashboard Infographic Template for PowerPoint & Google Slides
Business Report
Free
Website Performance Monitoring Dashboard Template for PowerPoint & Google Slides
Business Report
One Pager Annual Report Dashboard Template for PowerPoint & Google Slides
Business Report
Soccer Match Stats Dashboard Slide Template for PowerPoint & Google Slides
Graphics
Employee Satisfaction Survey Dashboard Template for PowerPoint & Google Slides
Employee Performance
Customer Satisfaction KPI Dashboard Template for PowerPoint & Google Slides
Customer Experience
Weekly Project Status Dashboard Template for PowerPoint & Google Slides
Project Status
Freight Logistics Dashboard Infographic Template for PowerPoint & Google Slides
Comparison Chart
Free Quarterly Business Review Dashboard Template for PowerPoint & Google Slides
Business
Free
Cost Cutting Savings Dashboard Template for PowerPoint & Google Slides
Pie/Donut
Macroeconomic Indicators Dashboard Template for PowerPoint & Google Slides
PEST
Banking Financial Overview Dashboard Template for PowerPoint & Google Slides
Finance
Quarterly Business Review Dashboard Template for PowerPoint & Google Slides
Pitch Deck
Monthly Business Review Dashboard Deck Template for PowerPoint & Google Slides
Business Report
DevOps KPI Dashboard Performance Metrics Template for PowerPoint & Google Slides
Software Development
Procurement KPI Dashboard & Metrics Template for PowerPoint & Google Slides
Business Report
Project Progress Dashboard Pie Charts Template for PowerPoint & Google Slides
Project
HR Report Dashboard Template for PowerPoint & Google Slides
Employee Performance
Budget Forecast Dashboard & Donut Charts Template for PowerPoint & Google Slides
Pie/Donut
Digital Marketing KPIs Dashboard Dark Template for PowerPoint & Google Slides
Business Report
Employee Performance Metrics Dashboard Template for PowerPoint & Google Slides
Employee Performance
Turnover Analysis Dashboard Template for PowerPoint & Google Slides
Employee Performance
Customer Interview Insights Dashboard Template for PowerPoint & Google Slides
Customer Experience
Project Status Update Dashboard Table Template for PowerPoint & Google Slides
Project Status
Cohort Analysis Retention Dashboard Template for PowerPoint & Google Slides
Comparison Chart
Project Status Dashboard Template for PowerPoint & Google Slides
Project Status
Dashboard Project Status Template for PowerPoint & Google Slides
Project Status
Task Completion Rate Dashboard Template for PowerPoint & Google Slides
Business
Project Status Dashboard with RAG Legend Template for PowerPoint & Google Slides
Project Status
End of Year Review Dashboard Template for PowerPoint & Google Slides
Business Report
Construction Project Dashboard Template for PowerPoint & Google Slides
Project
Employee Headcount Dashboard Report Template for PowerPoint & Google Slides
Employee Performance