Social Media Smartphone Infographic Template for PowerPoint & Google Slides
Description
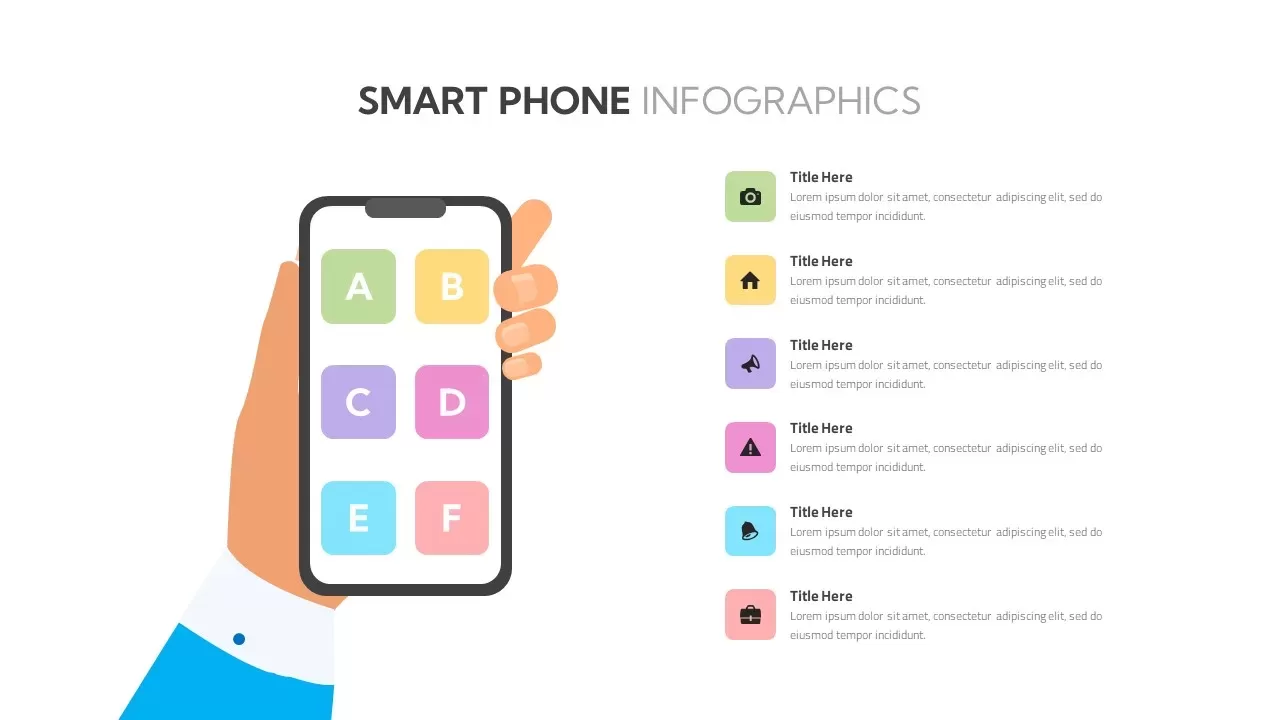
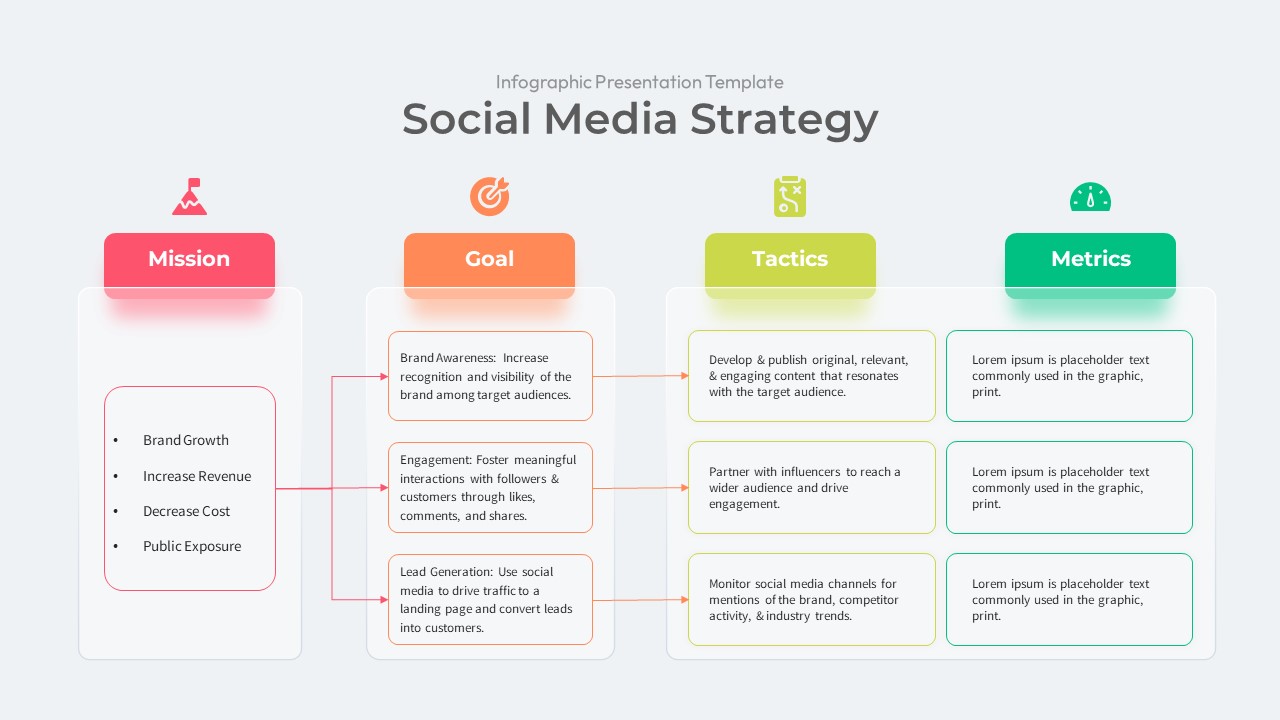
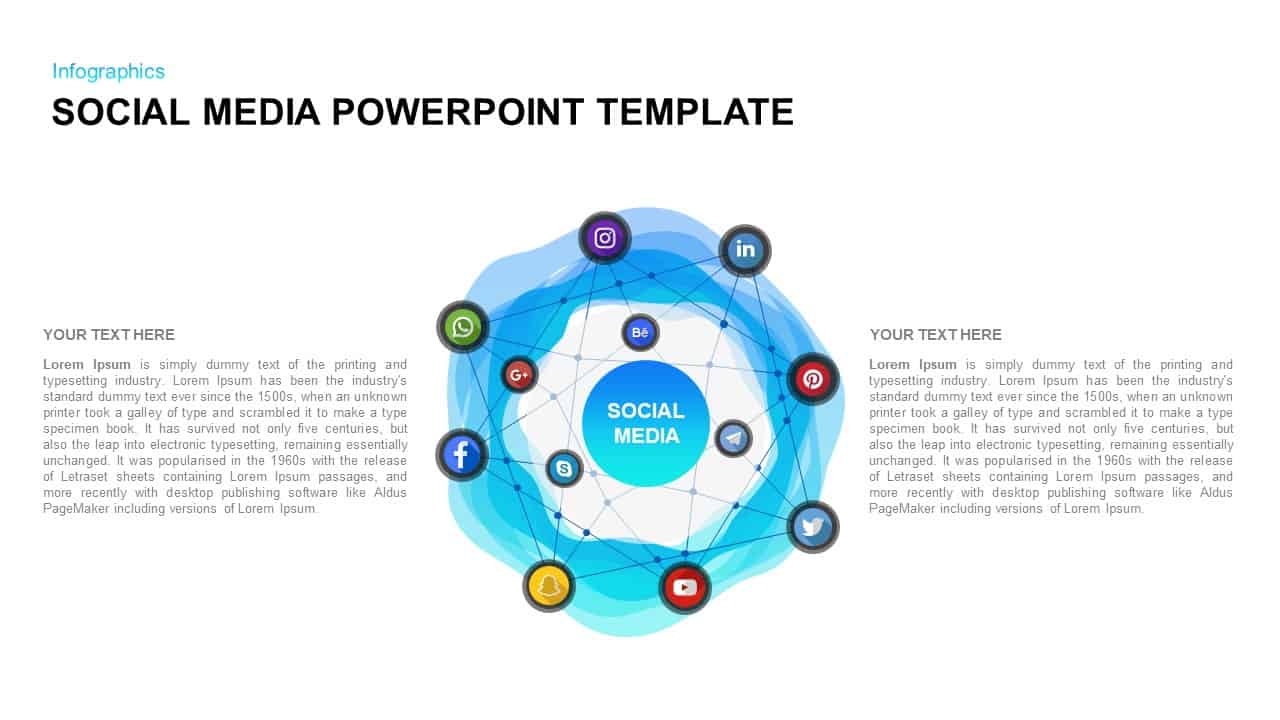
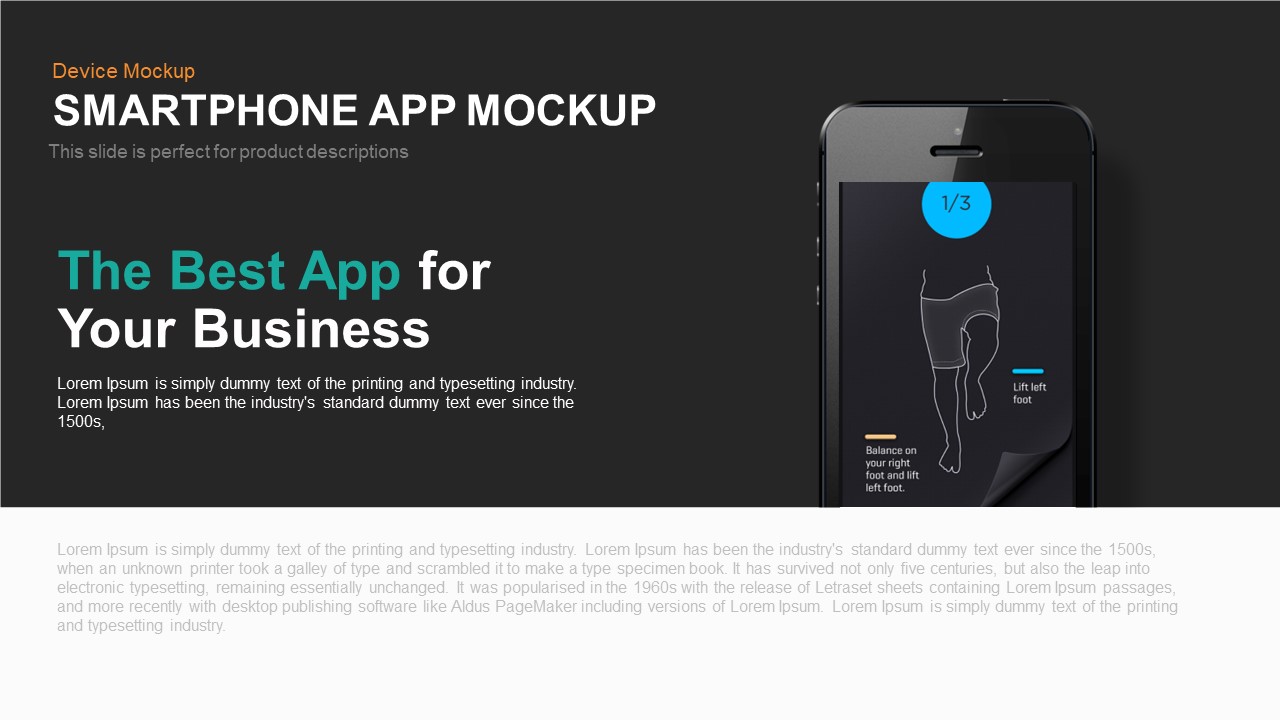
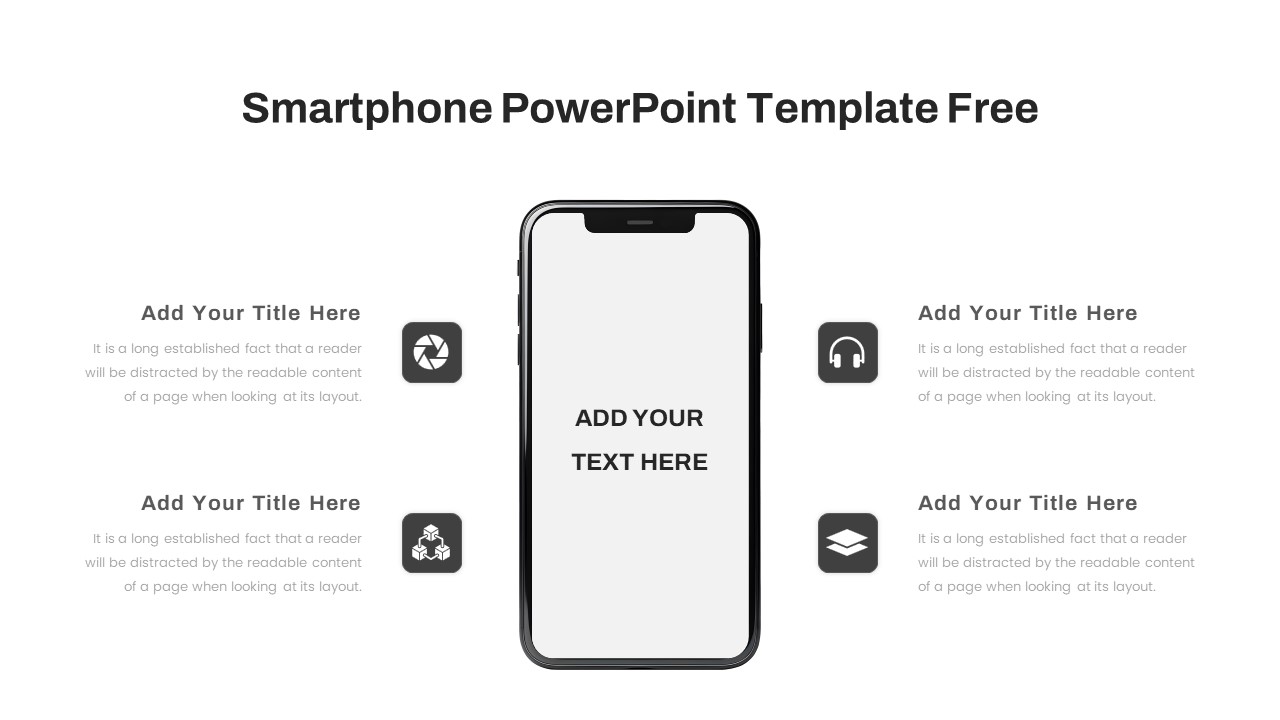
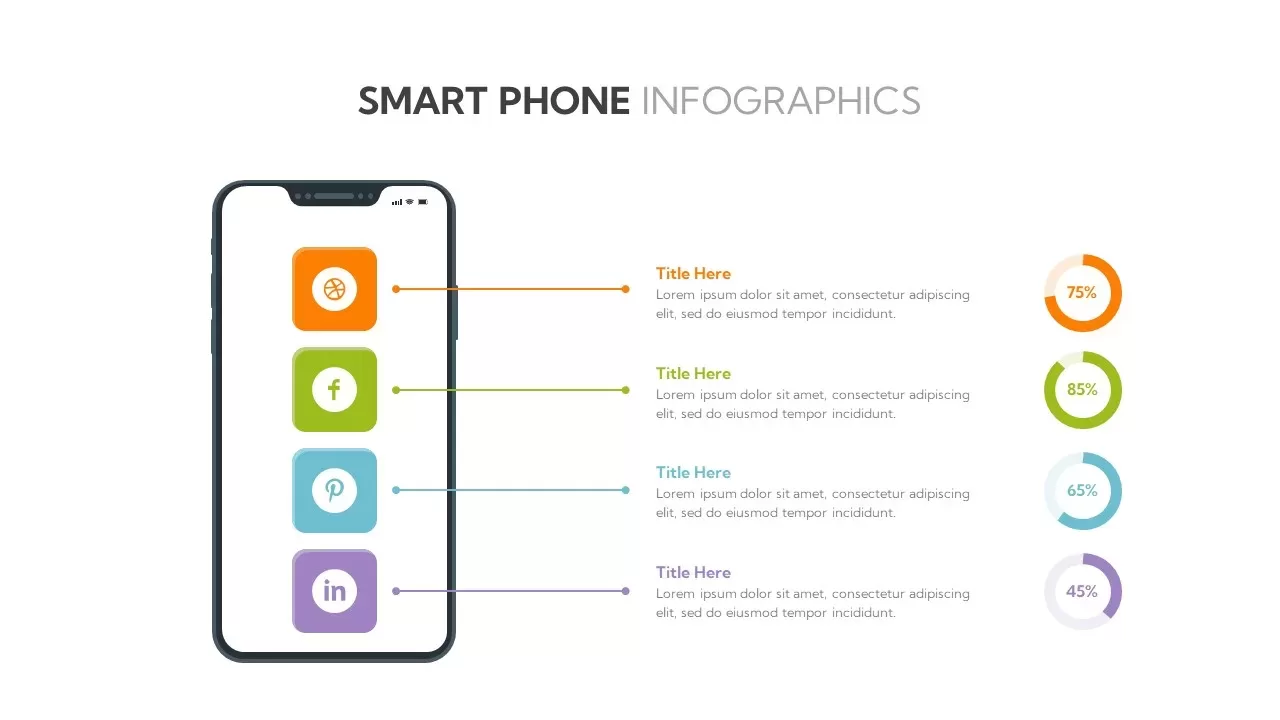
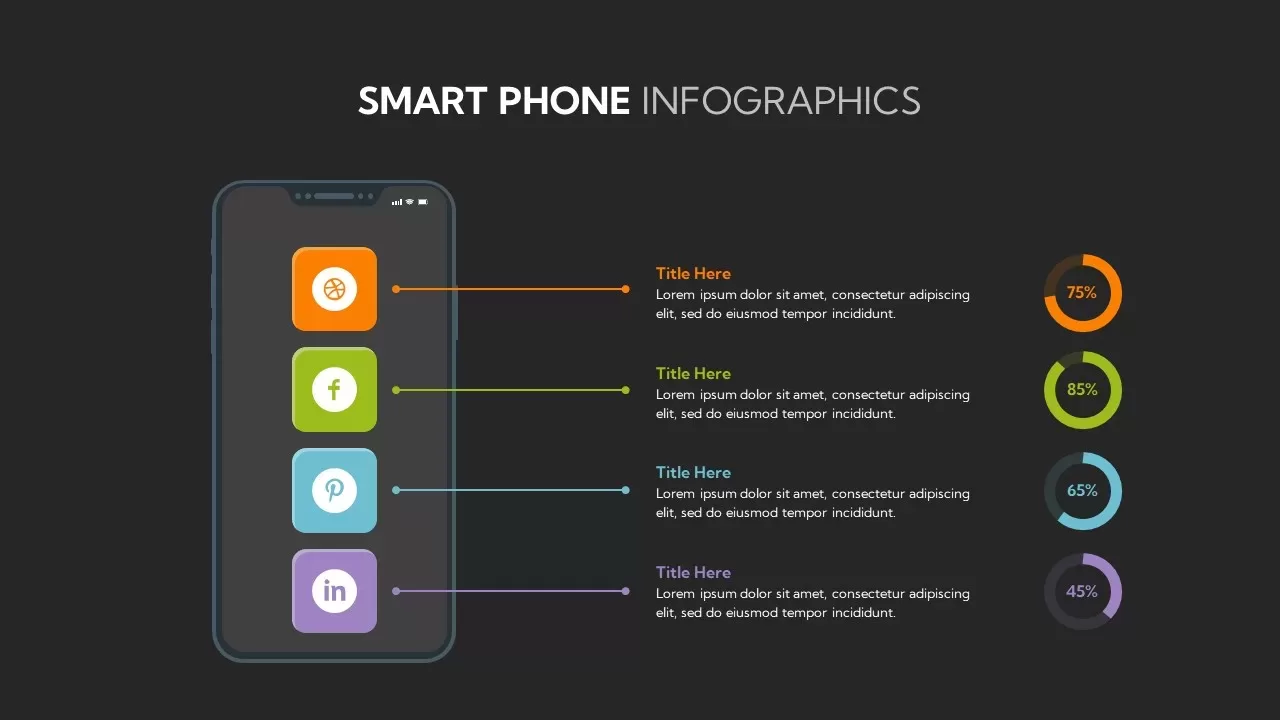
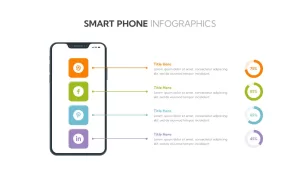
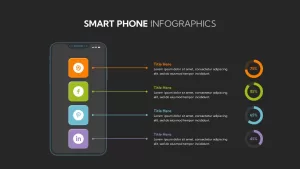
Leverage this smartphone infographic slide to showcase four social media metrics with vivid iconography and matching donut charts. A sleek device outline contains four rounded squares—orange, green, cyan, and purple—each housing a recognizable social icon. Connecting lines guide viewers to concise text placeholders for titles and descriptions. On the right, color-coordinated donut charts display percentages (75%, 85%, 65%, 45%), reinforcing the visual hierarchy and enabling rapid data interpretation. Built on master slides with editable shapes, colors, and text, this template offers polished typography, ample white space, and refined accents that align with corporate or startup branding. Ready to adapt in seconds, it ensures consistency across presentations while maintaining full resolution on PowerPoint and Google Slides. Ideal for illustrating performance dashboards, engagement stats, or campaign KPIs, this layout transforms complex data into an engaging, easy-to-follow narrative.
Who is it for
Social media managers, digital marketers, and data analysts will benefit from this slide when presenting channel performance, campaign results, or audience engagement metrics. Consultants, executives, and marketing teams can leverage its clarity to drive strategic discussions and stakeholder buy-in.
Other Uses
Beyond social metrics, repurpose this slide to display project milestones, feature adoption rates, customer satisfaction scores, or resource allocation overviews. Swap icons and percentages to tailor it for product roadmaps, survey insights, or operational dashboards across industries.
Login to download this file

Item ID
SB02920
Related Templates

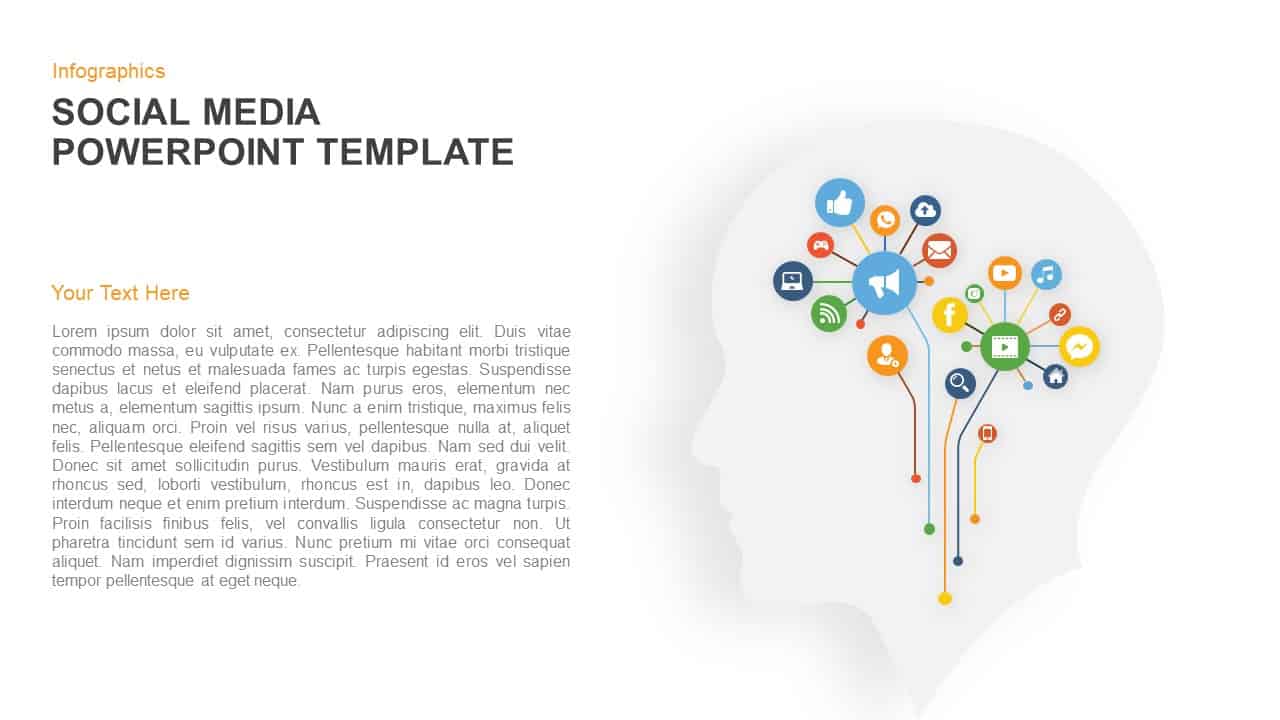
Social Media Mind Network Infographic Template for PowerPoint & Google Slides
Digital Marketing
Social Media Rocket Launch Infographic Template for PowerPoint & Google Slides
Marketing
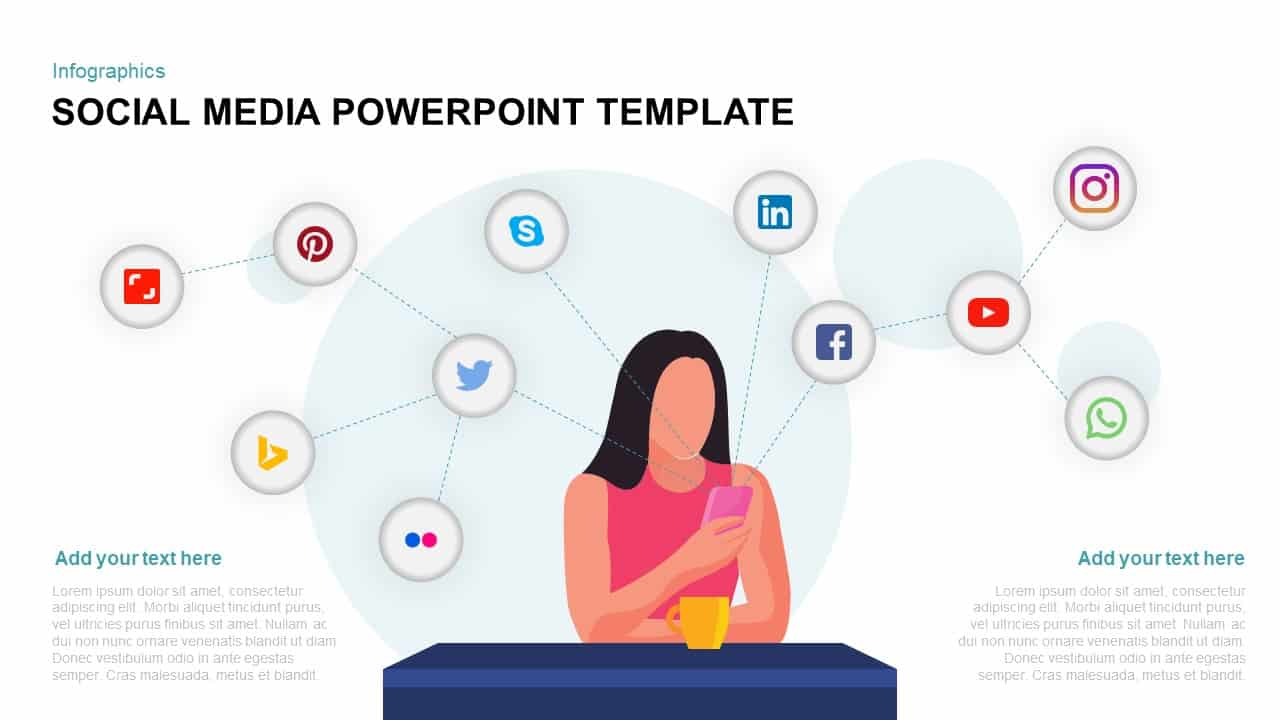
Social Media Network Infographic Template for PowerPoint & Google Slides
Circular
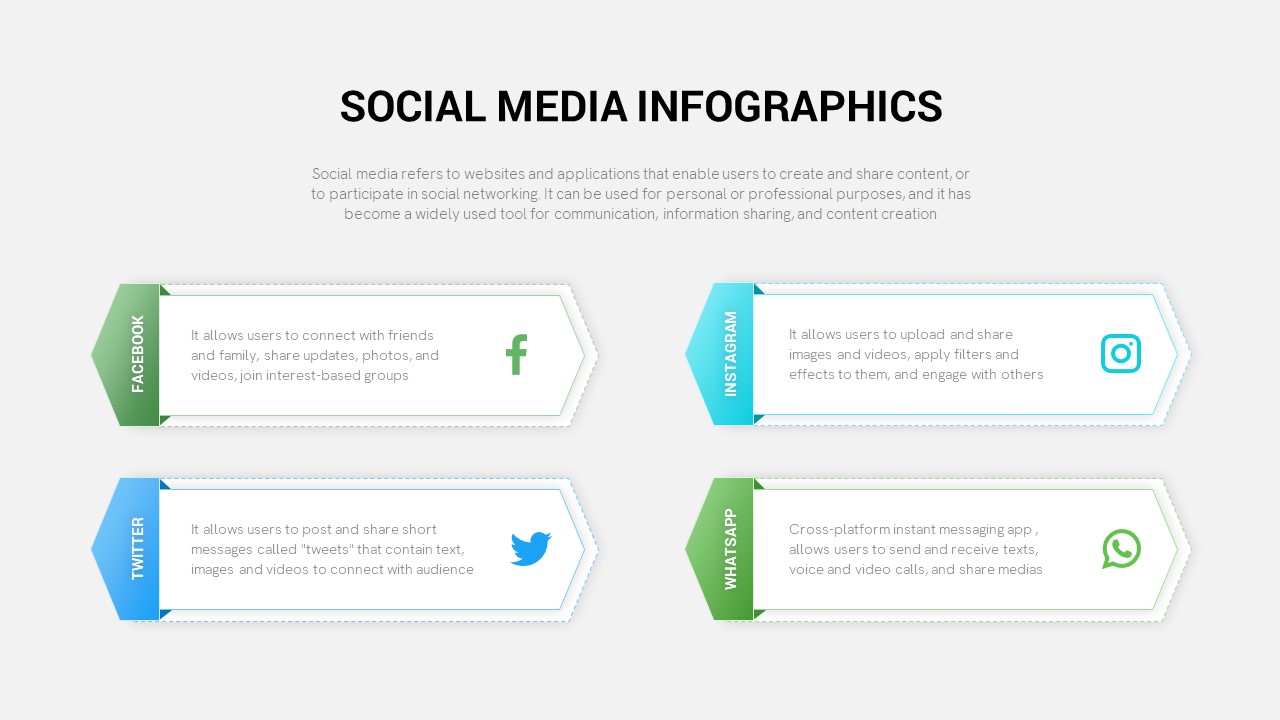
Social Media Infographic Arrow Layout Template for PowerPoint & Google Slides
Arrow
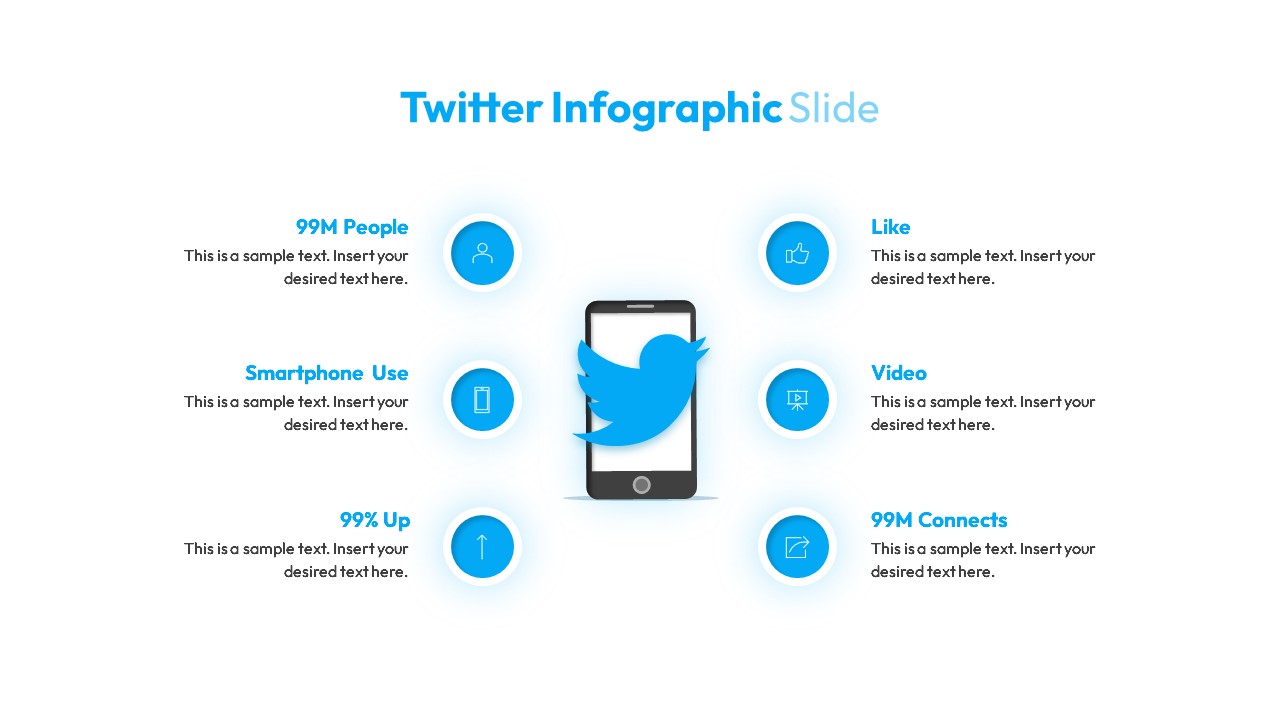
Twitter Social Media Infographic Template for PowerPoint & Google Slides
Circular
Free Social Media Hub-and-Spoke Infographic Template for PowerPoint & Google Slides
Circular
Free
Smartphone Infographic Diagram Template for PowerPoint & Google Slides
Comparison
Free Social Media Users Map template for PowerPoint & Google Slides
World Maps
Free
Social Media Metrics template for PowerPoint & Google Slides
Comparison Chart
Comprehensive Social Media Icons Slide Template for PowerPoint & Google Slides
Advertising

Social Media Hub & Spoke Model Template for PowerPoint & Google Slides
Process
Social Media Market Share Pie Charts Template for PowerPoint & Google Slides
Pie/Donut
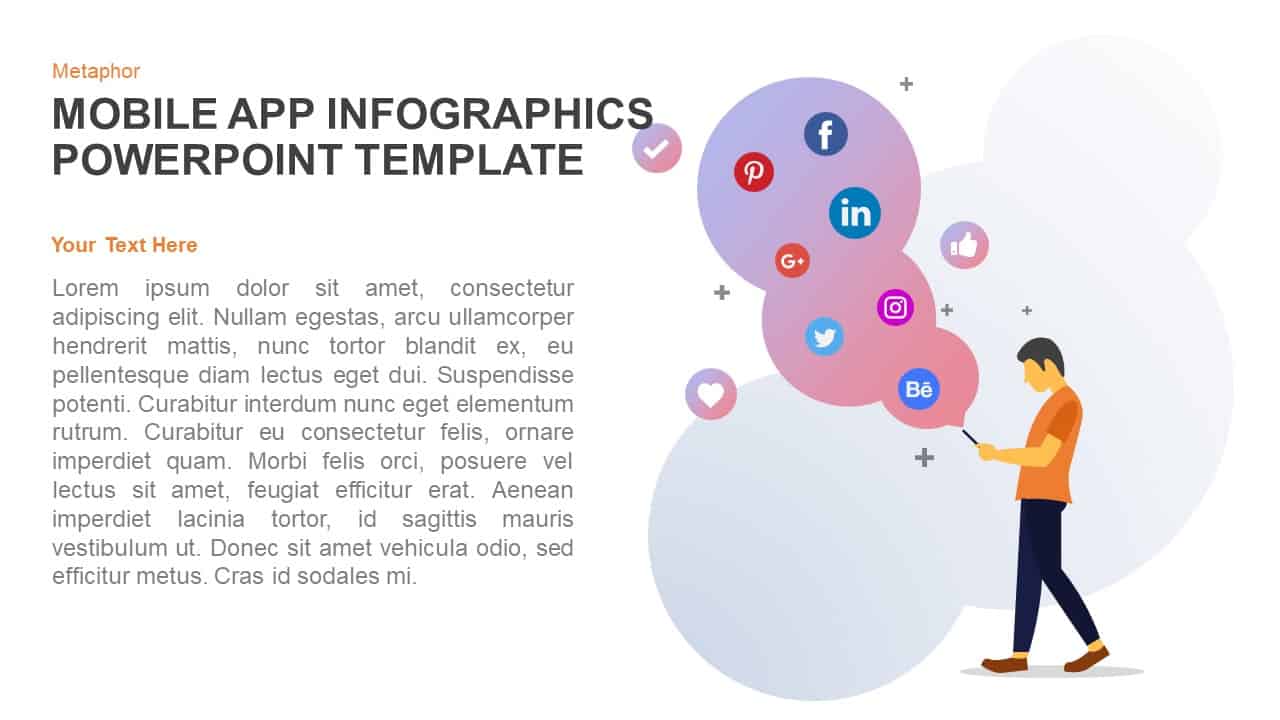
Mobile App Social Media Metaphor Template for PowerPoint & Google Slides
Infographics
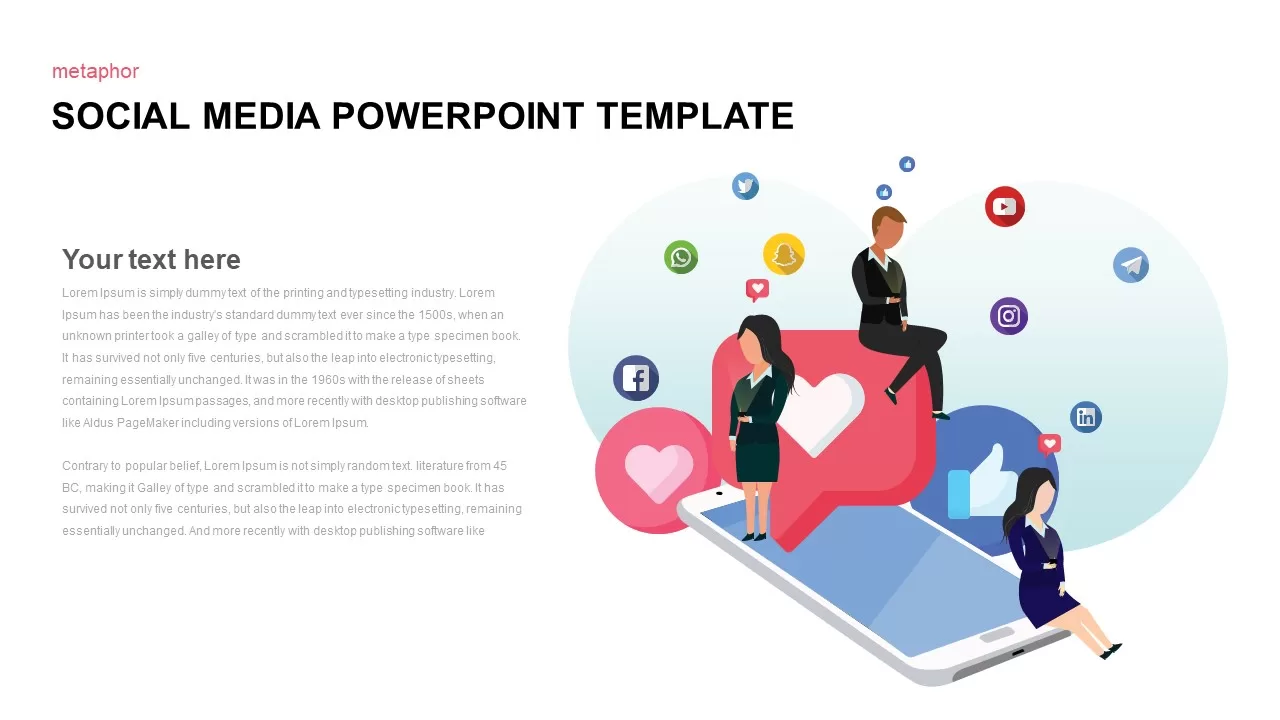
Social Media Metaphor Illustration Template for PowerPoint & Google Slides
Digital Marketing
Social Media Performance Dashboard Template for PowerPoint & Google Slides
Bar/Column
Social Media Marketing Tool Template for PowerPoint & Google Slides
Digital Marketing
Free 3D Social Media Icons template for PowerPoint & Google Slides
Digital Marketing
Free
Popular Social Media Comparison Grid Template for PowerPoint & Google Slides
Digital Marketing
Social Media Analytics Dashboard Template for PowerPoint & Google Slides
Digital Marketing

Social Media Marketing Agency Pitch Deck Template for PowerPoint & Google Slides
Pitch Deck
Social Media Community Network Slide Template for PowerPoint & Google Slides
Circular
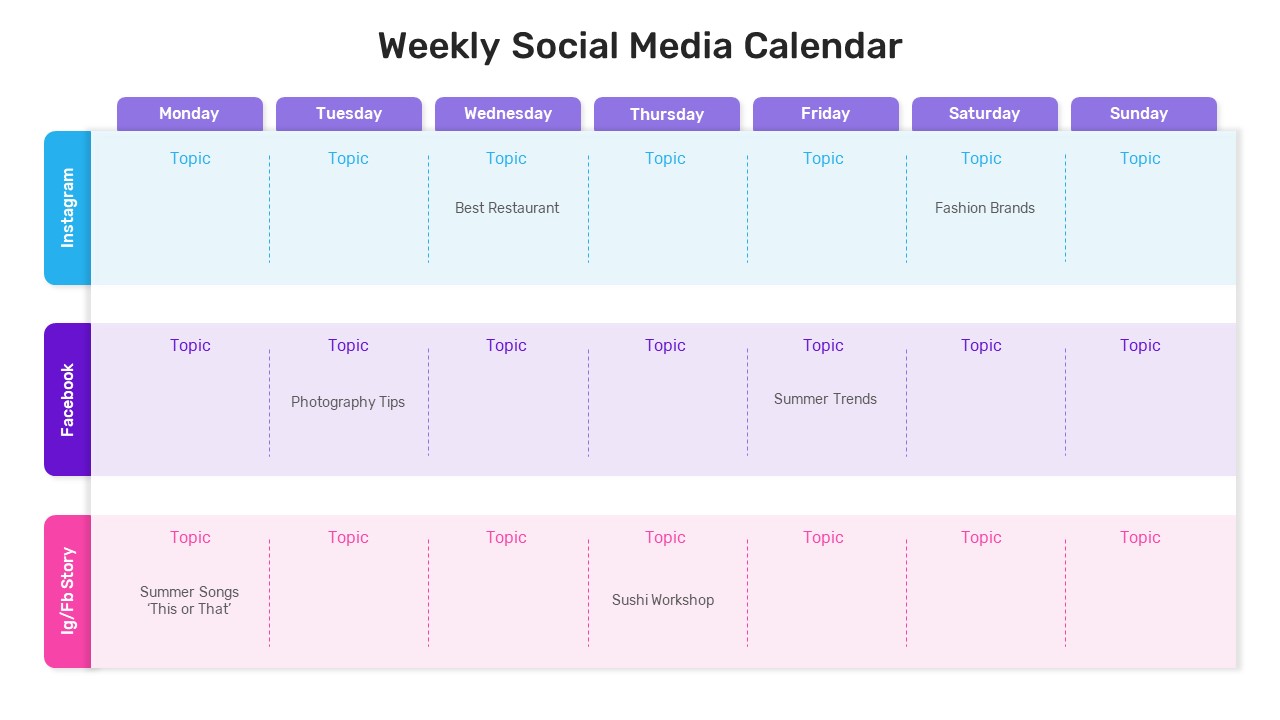
Weekly Social Media Calendar Editable Template for PowerPoint & Google Slides
Digital Marketing
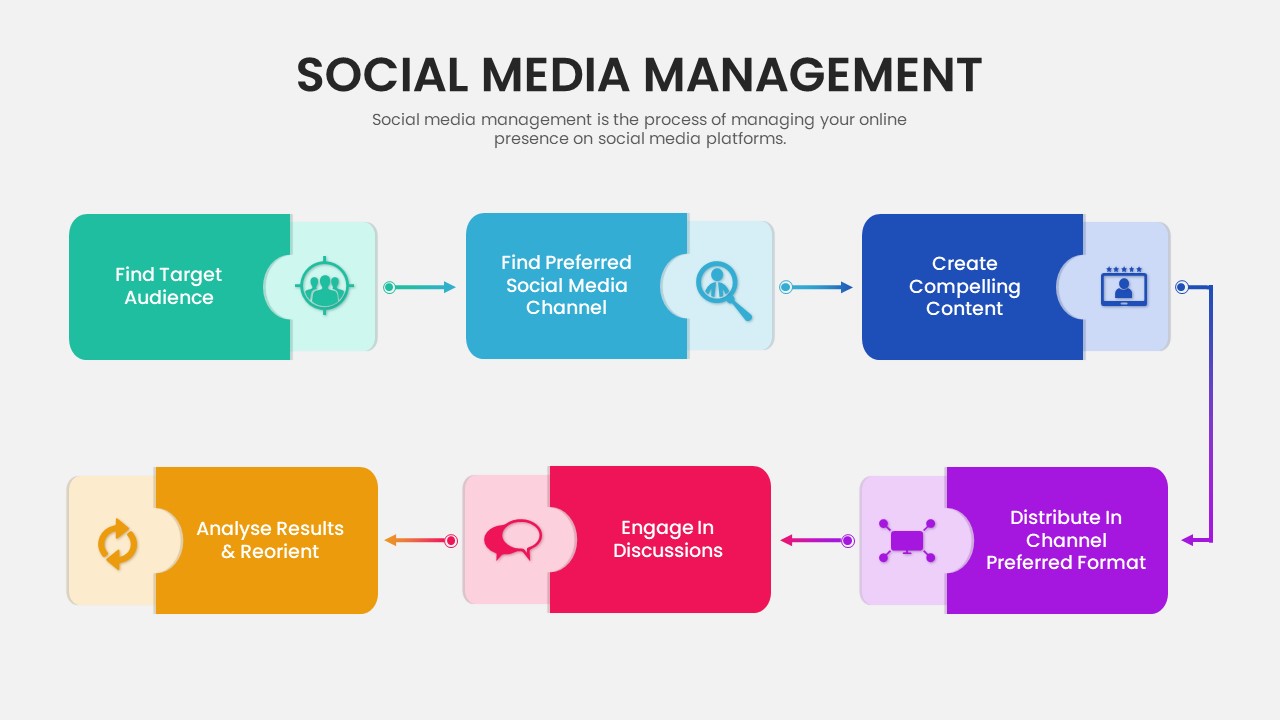
Six-Step Social Media Management Process Template for PowerPoint & Google Slides
Process
Modern Social Media Infographics Template for PowerPoint & Google Slides
Digital Marketing
Social Media Plan Table Slide Deck Template for PowerPoint & Google Slides
Process
Social Media Marketing Connection Template for PowerPoint & Google Slides
Digital Marketing
Social Media Policy Dos & Don’ts Slide Template for PowerPoint & Google Slides
Comparison
Social Media Marketing Strategy Template for PowerPoint & Google Slides
Digital Marketing
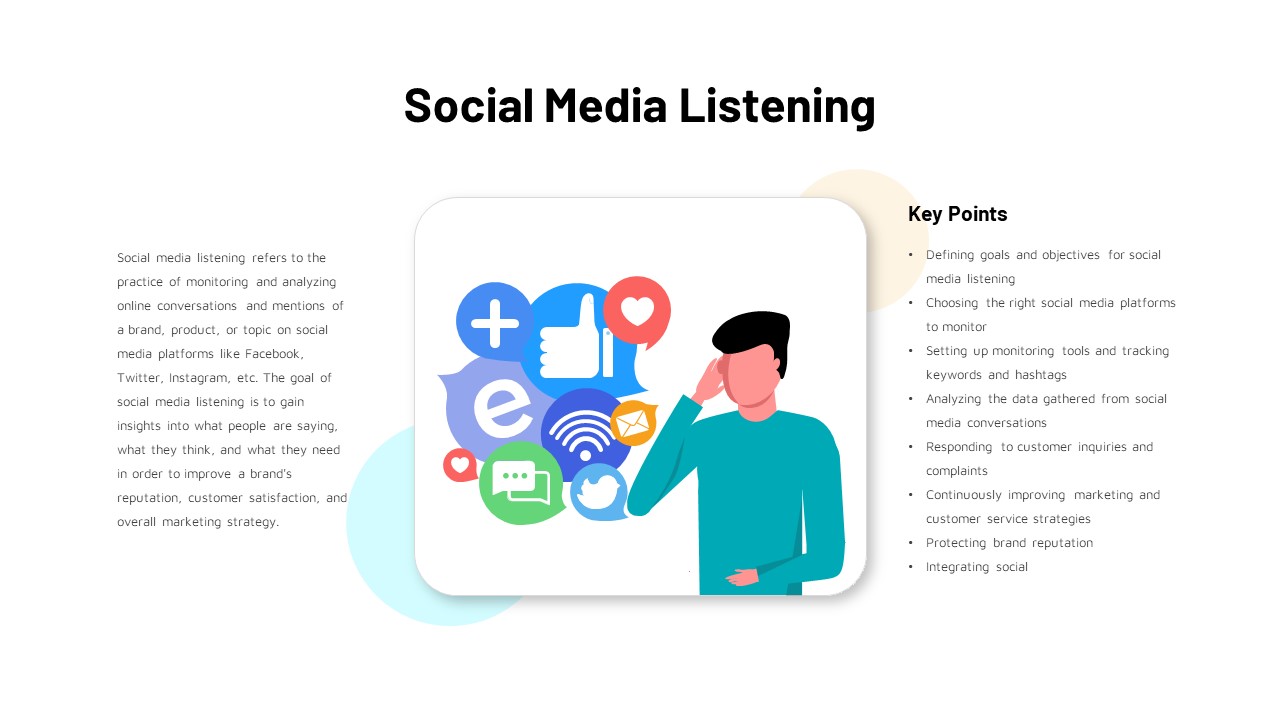
Social Media Listening Overview Slide Template for PowerPoint & Google Slides
Customer Experience
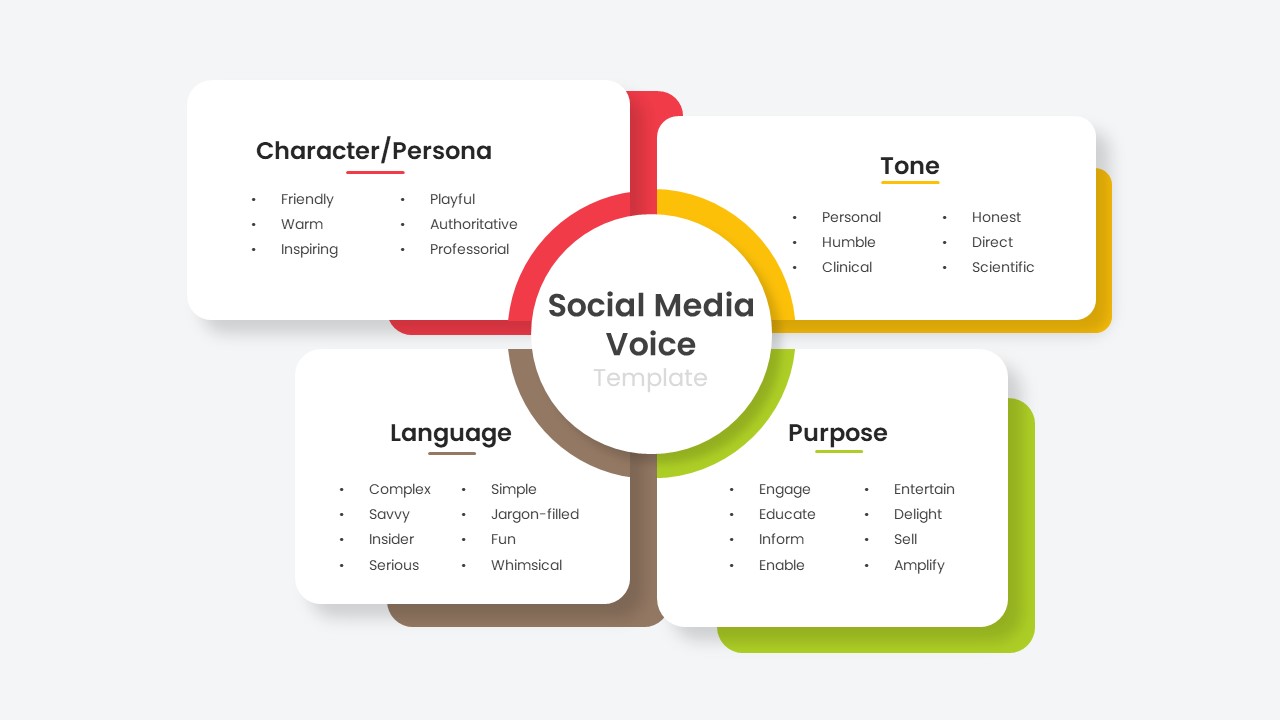
Social Media Voice Template for PowerPoint & Google Slides
Customer Experience
Social Media Hub-and-Spoke Infographics Template for PowerPoint & Google Slides
Circular
Social Media Analysis Metrics Slide Deck Template for PowerPoint & Google Slides
Digital Marketing
Social Media Statistics 2023 Dashboard Template for PowerPoint & Google Slides
Comparison
Social Media Report Presentation Template for PowerPoint & Google Slides
Digital Marketing
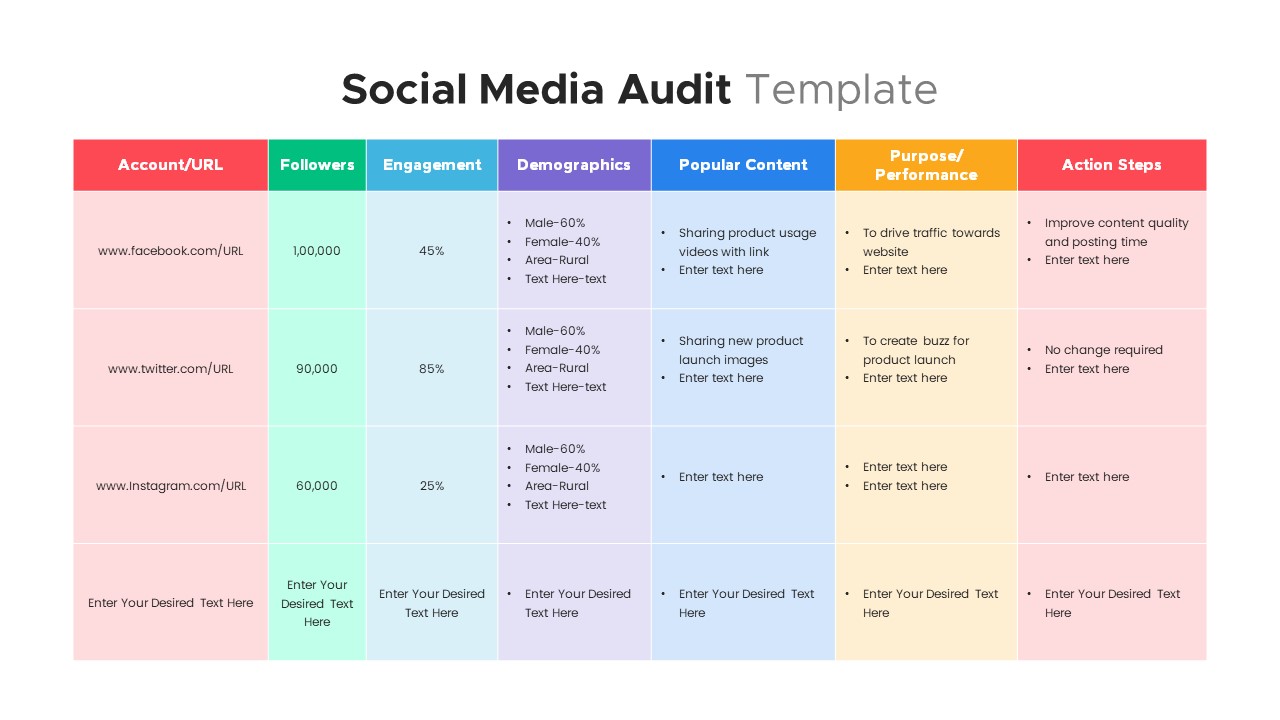
Comprehensive Social Media Audit Template for PowerPoint & Google Slides
Digital Marketing
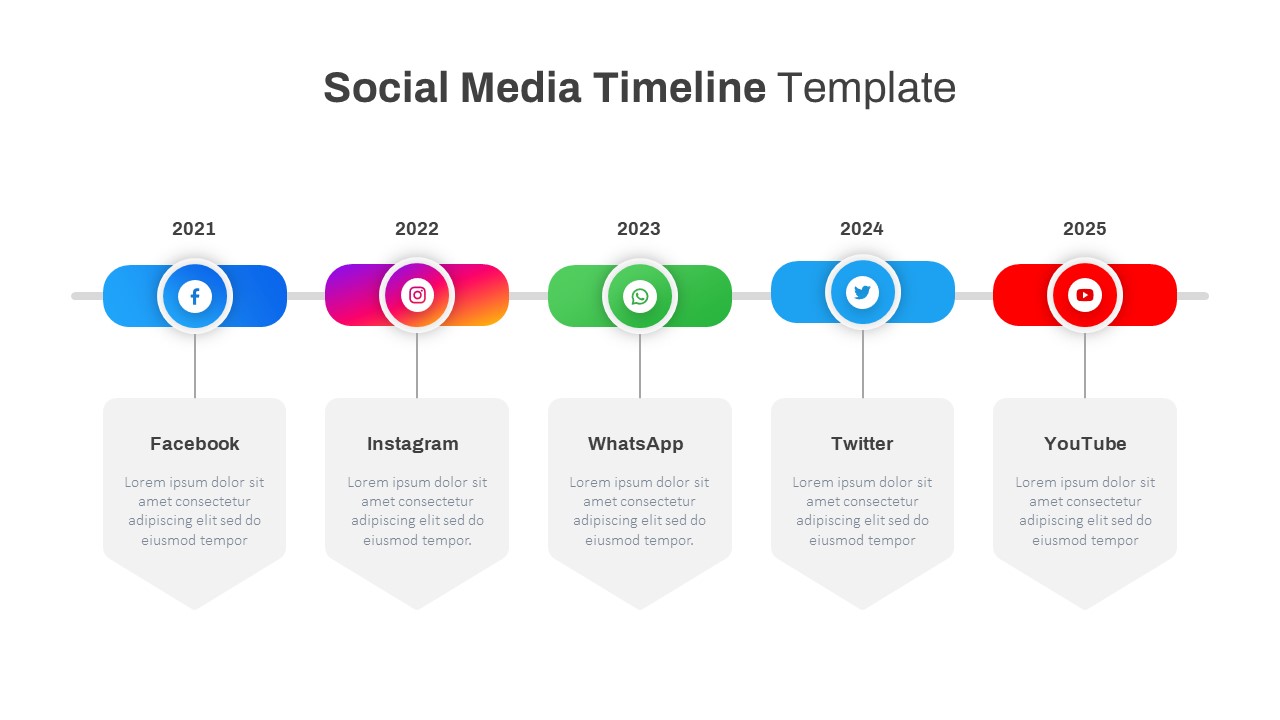
Modern Social Media Timeline Roadmap Template for PowerPoint & Google Slides
Timeline

Social Media Marketing Presentation Template for PowerPoint & Google Slides
Decks
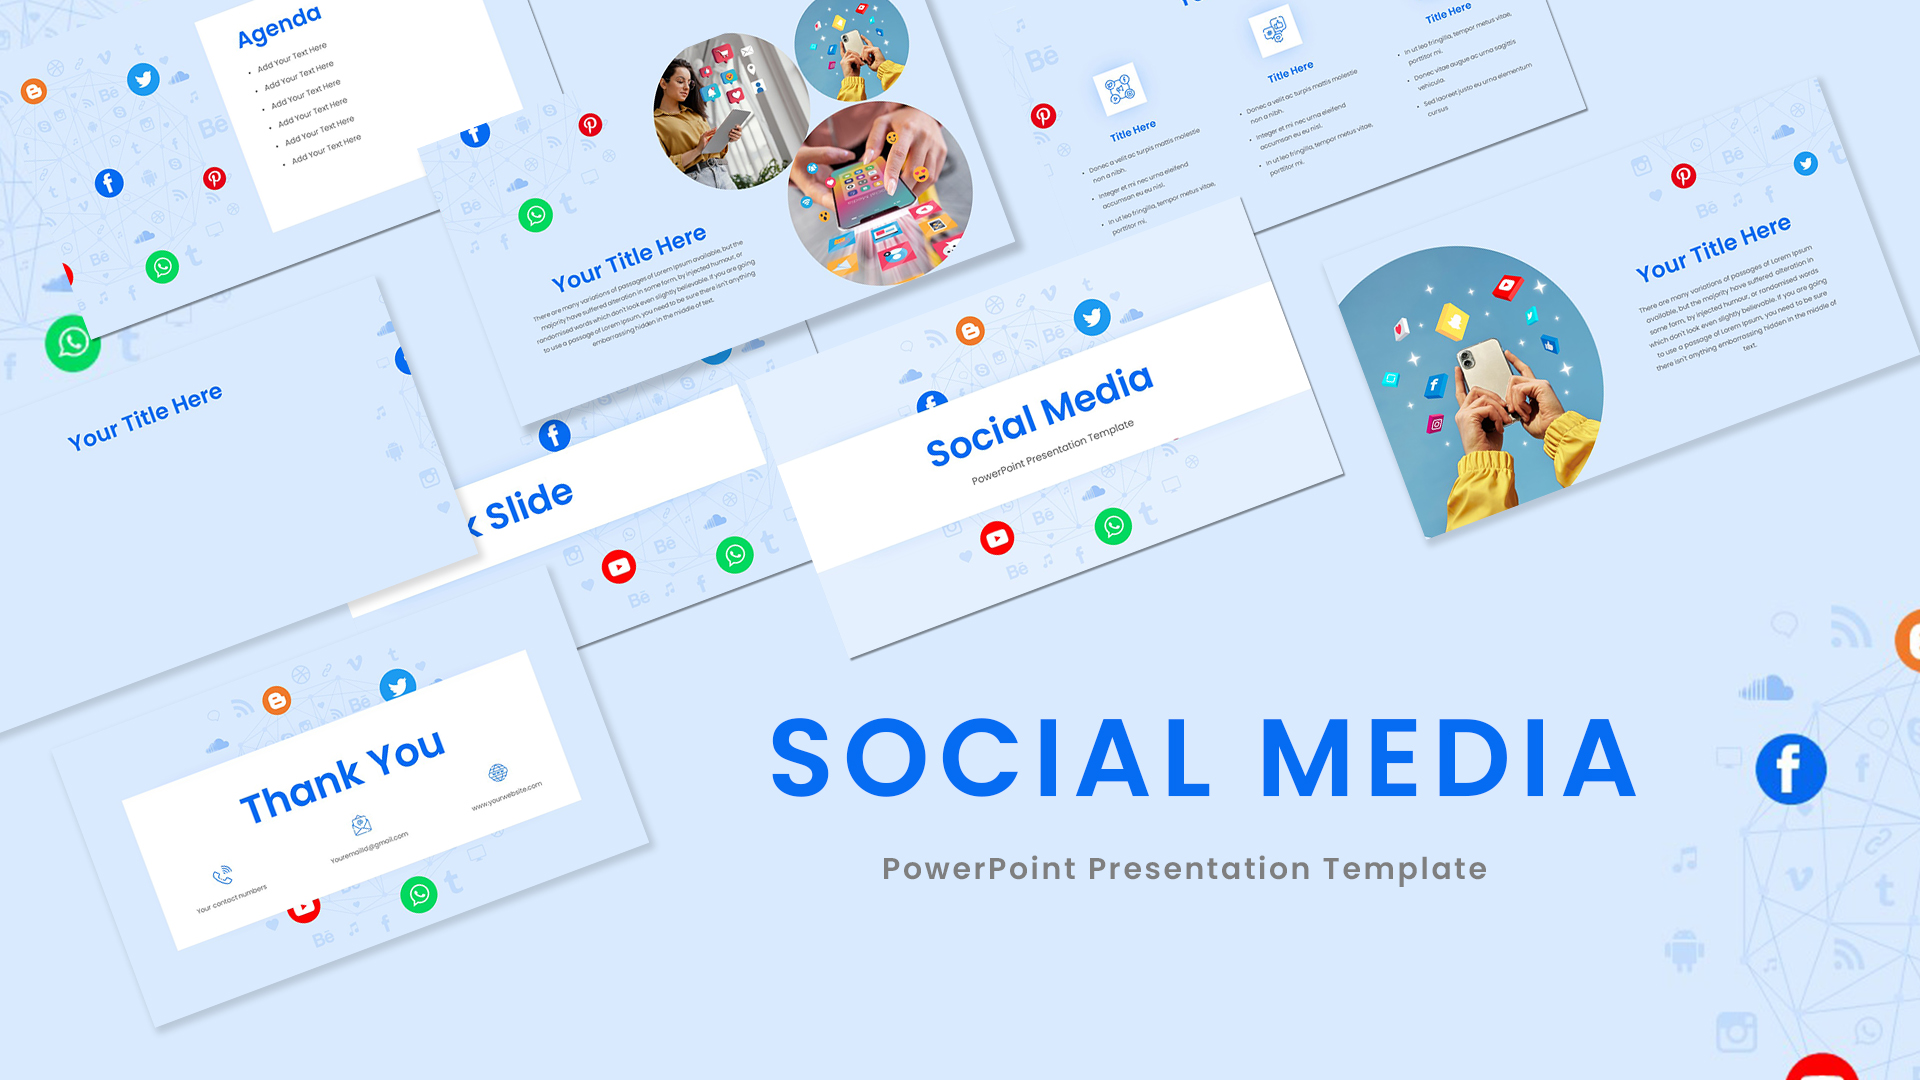
Social Media Presentation Template for PowerPoint & Google Slides
Pitch Deck
Social Media Marketing Overview Template for PowerPoint & Google Slides
Advertising
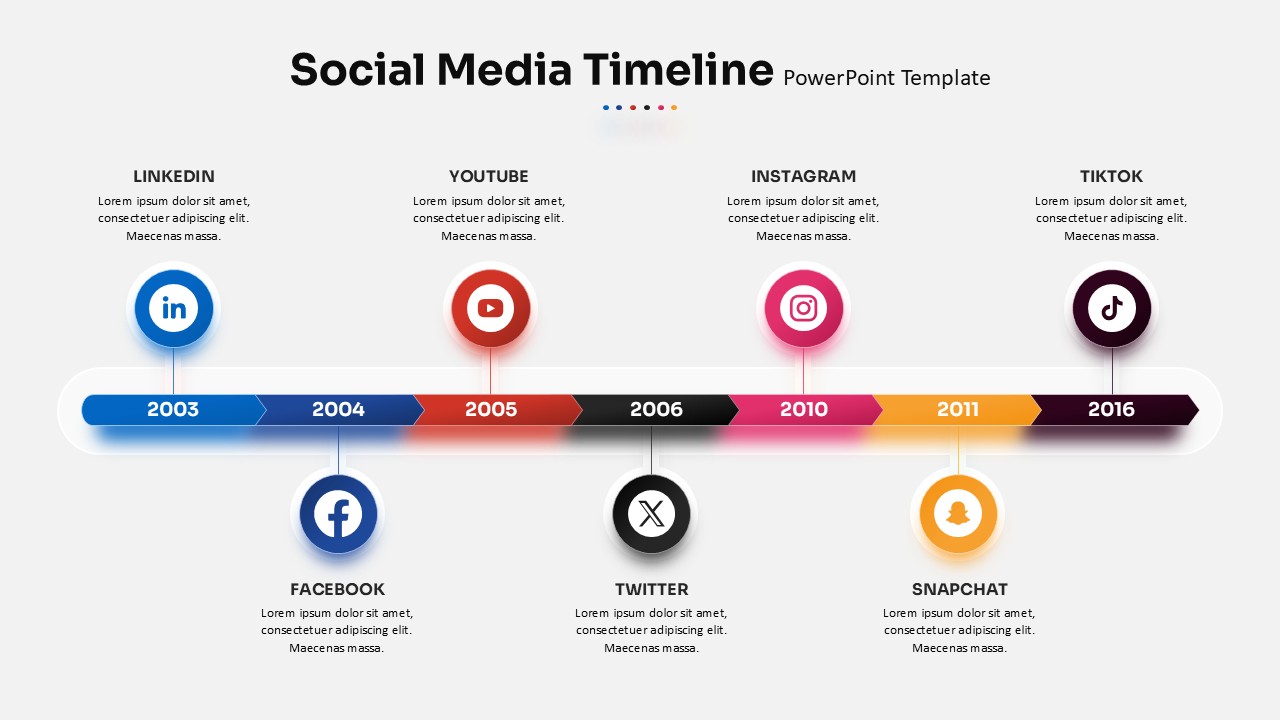
Social Media Timeline template for PowerPoint & Google Slides
Timeline
Social Media Recruiting Strategy template for PowerPoint & Google Slides
Business
Social Media Network Hub Diagram Slide for PowerPoint & Google Slides
Process
Application Smartphone Features template for PowerPoint & Google Slides
Technology
Smartphone Data User template for PowerPoint & Google Slides
Charts

Smartphone Feature Highlights template for PowerPoint & Google Slides
Business
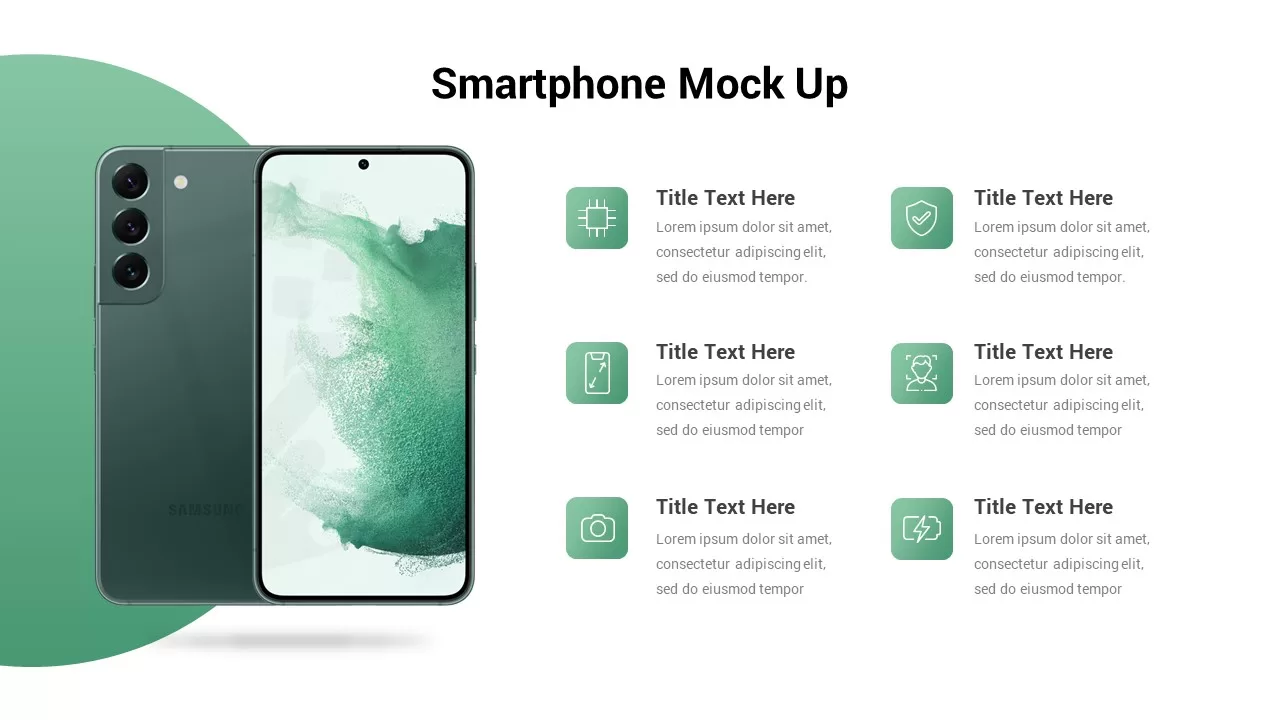
Smartphone Mockup template for PowerPoint & Google Slides
Information Technology
Smartphone App Mockup for Business Template for PowerPoint & Google Slides
Software Development
Smartphone App Features Mockup Template for PowerPoint & Google Slides
Software Development

Smartphone & Web Application Features template for PowerPoint & Google Slides
Software Development
Galaxy S10 Smartphone Mockup Slide Template for PowerPoint & Google Slides
Infographics
Smartphone App Pitch Deck Presentation Template for PowerPoint & Google Slides
Pitch Deck
Smartphone Mockup Feature Overview Template for PowerPoint & Google Slides
Graphics
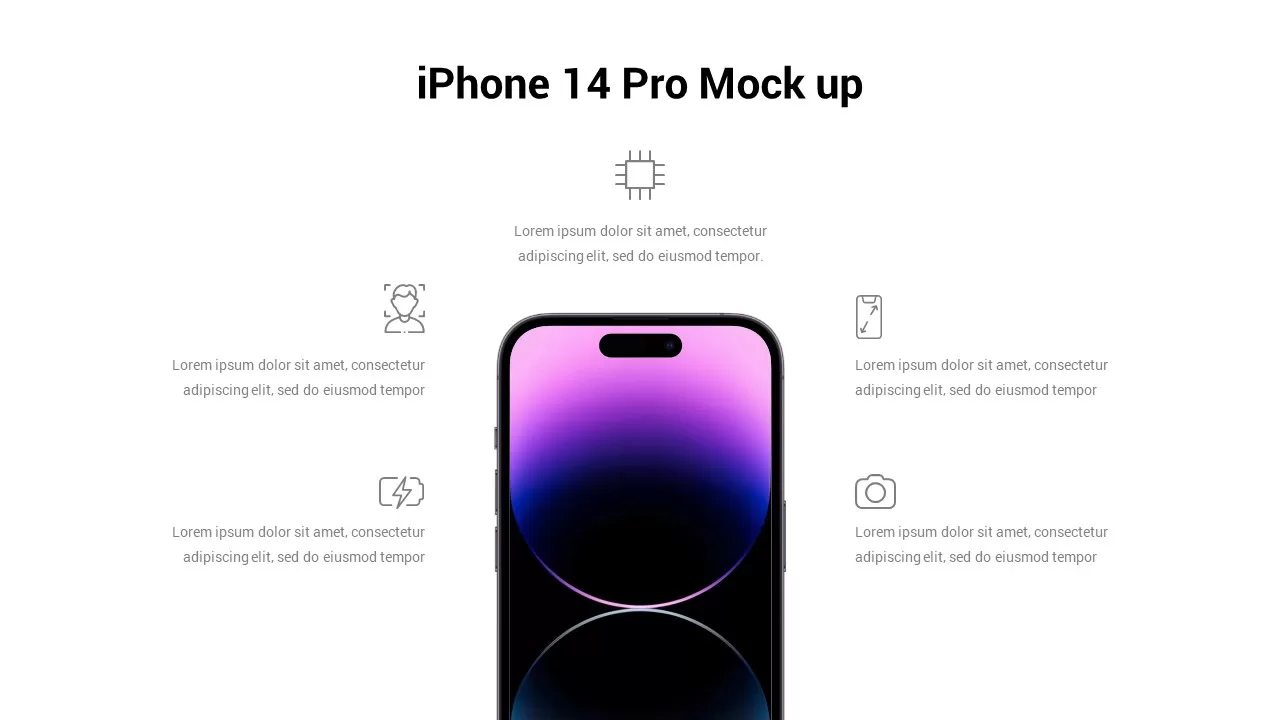
iPhone 14 Pro Smartphone Mockup Slide Template for PowerPoint & Google Slides
Graphics
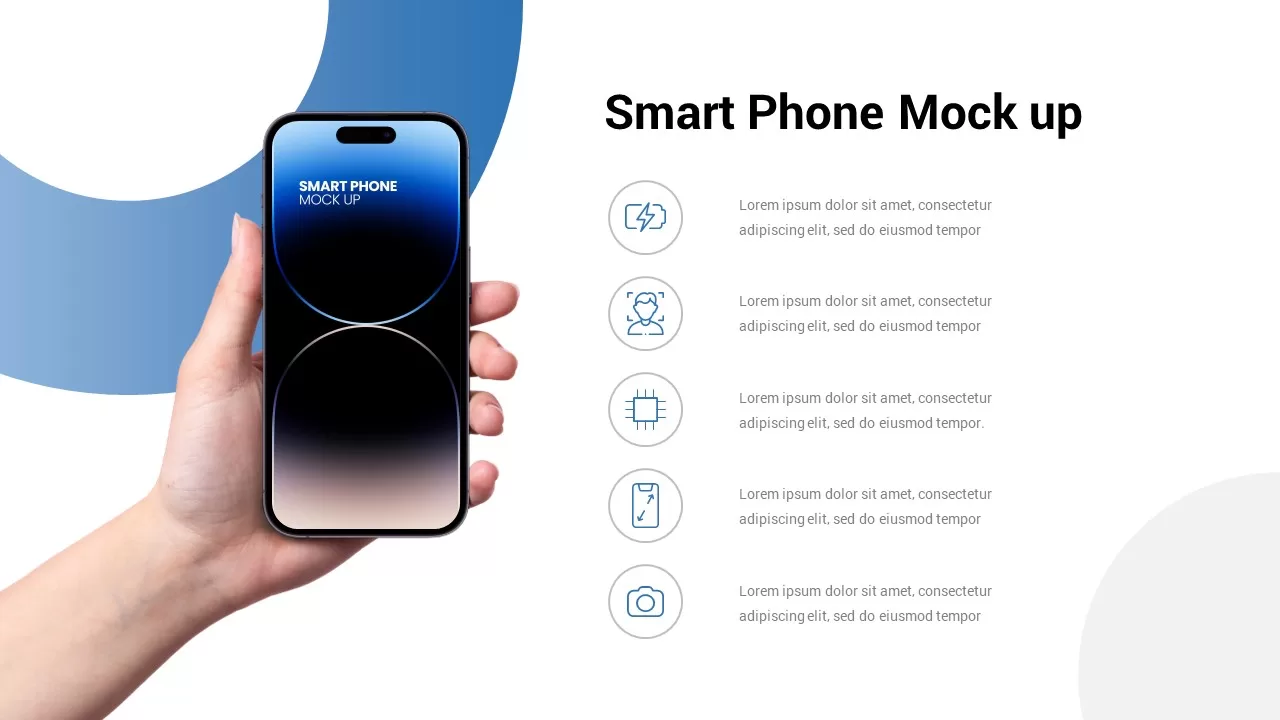
Handheld Smartphone Mockup Slide Template for PowerPoint & Google Slides
Graphics
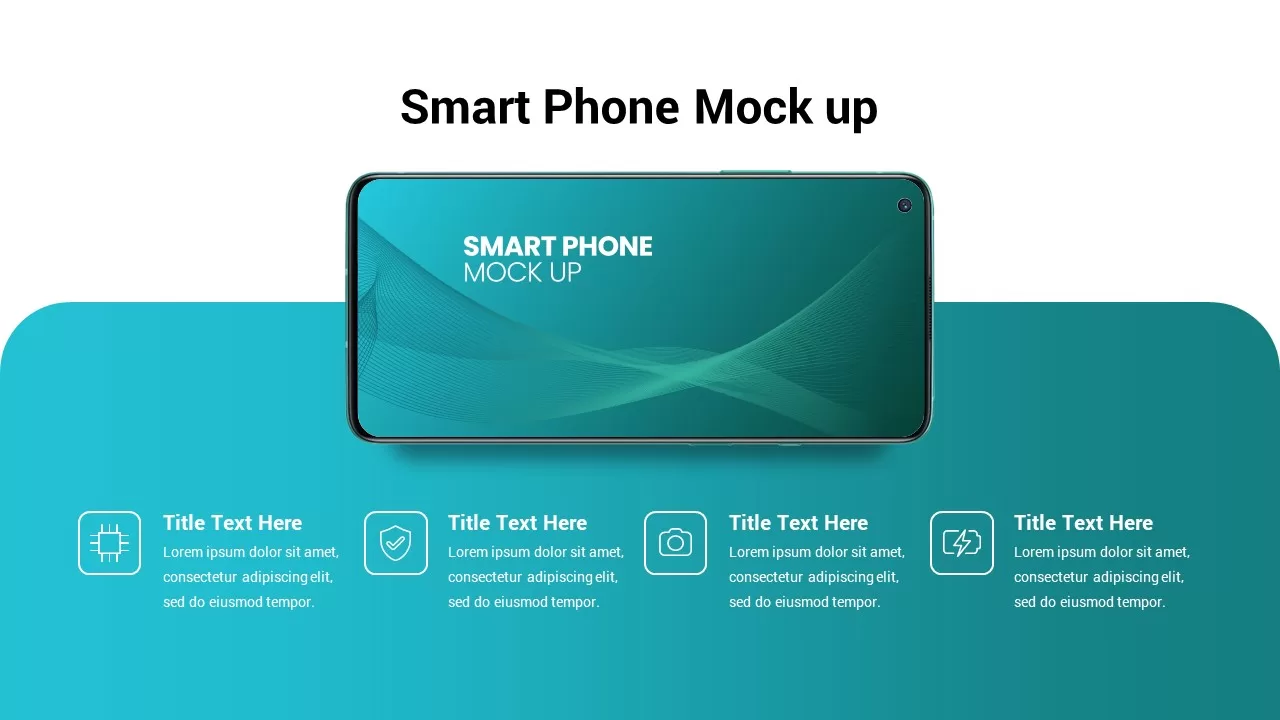
Horizontal Smartphone Feature Highlights Template for PowerPoint & Google Slides
Graphics
Free Minimal Smartphone Feature Overview Slide for PowerPoint & Google Slides
Information Technology
Free
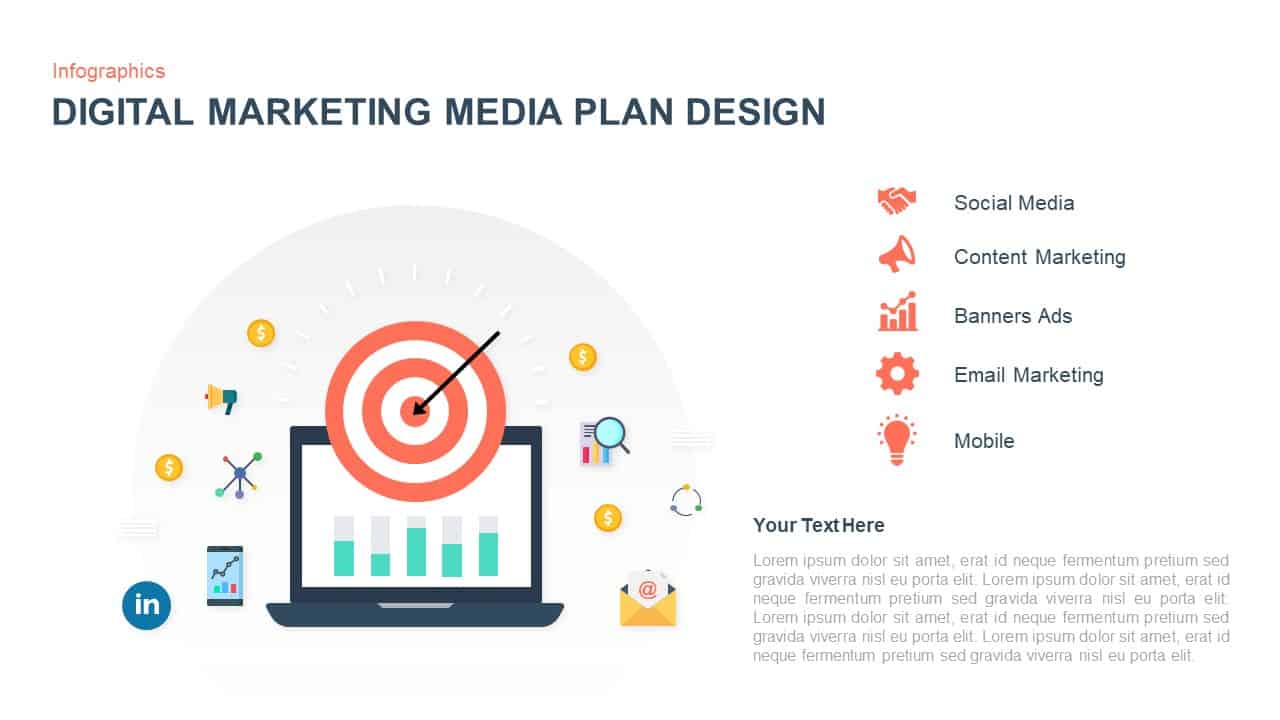
Digital Marketing Media Plan Infographic Template for PowerPoint & Google Slides
Digital Marketing
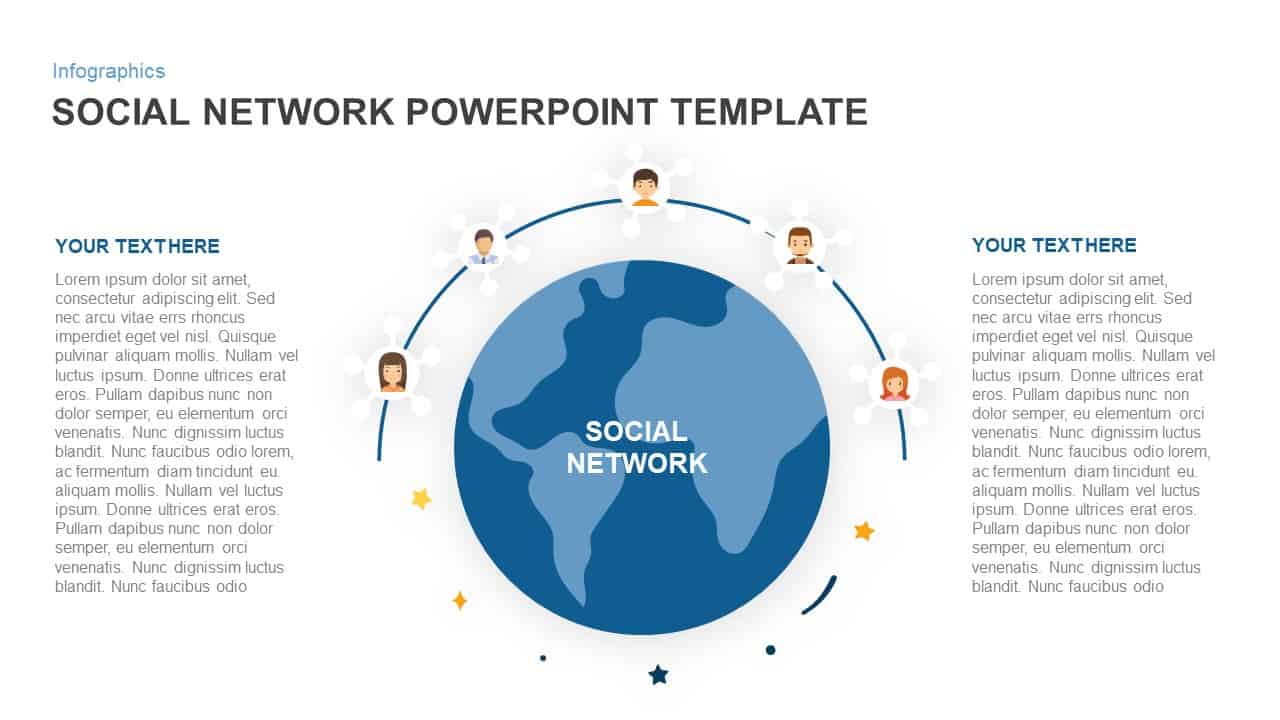
Social Network Connectivity Infographic Template for PowerPoint & Google Slides
Infographics
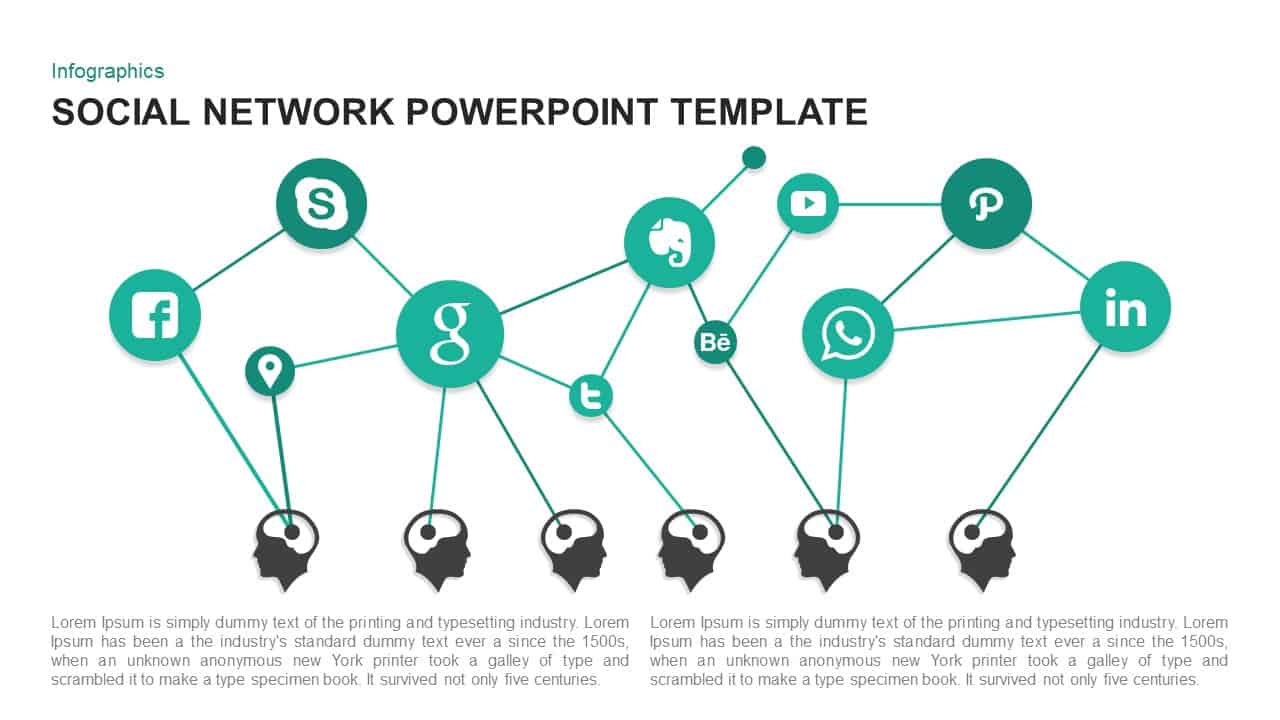
Social Network Infographic Diagram Template for PowerPoint & Google Slides
Digital Marketing
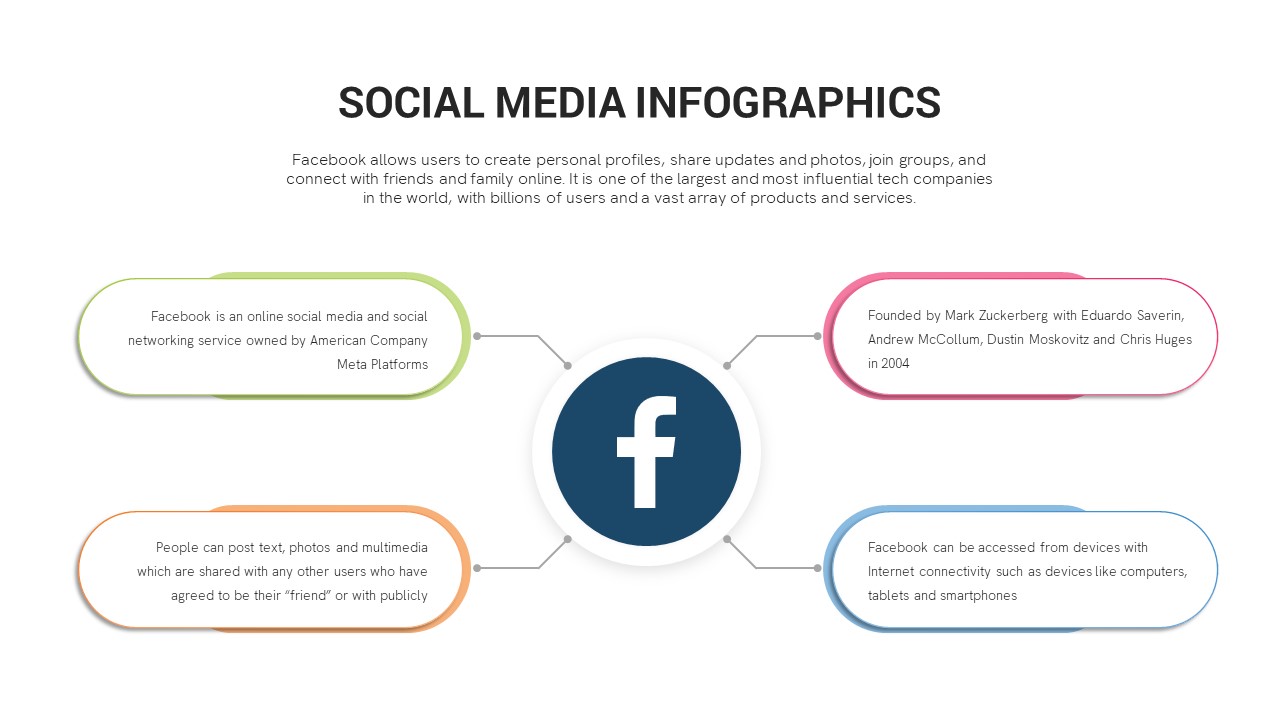
Facebook Social Metrics Infographic Template for PowerPoint & Google Slides
Graphics
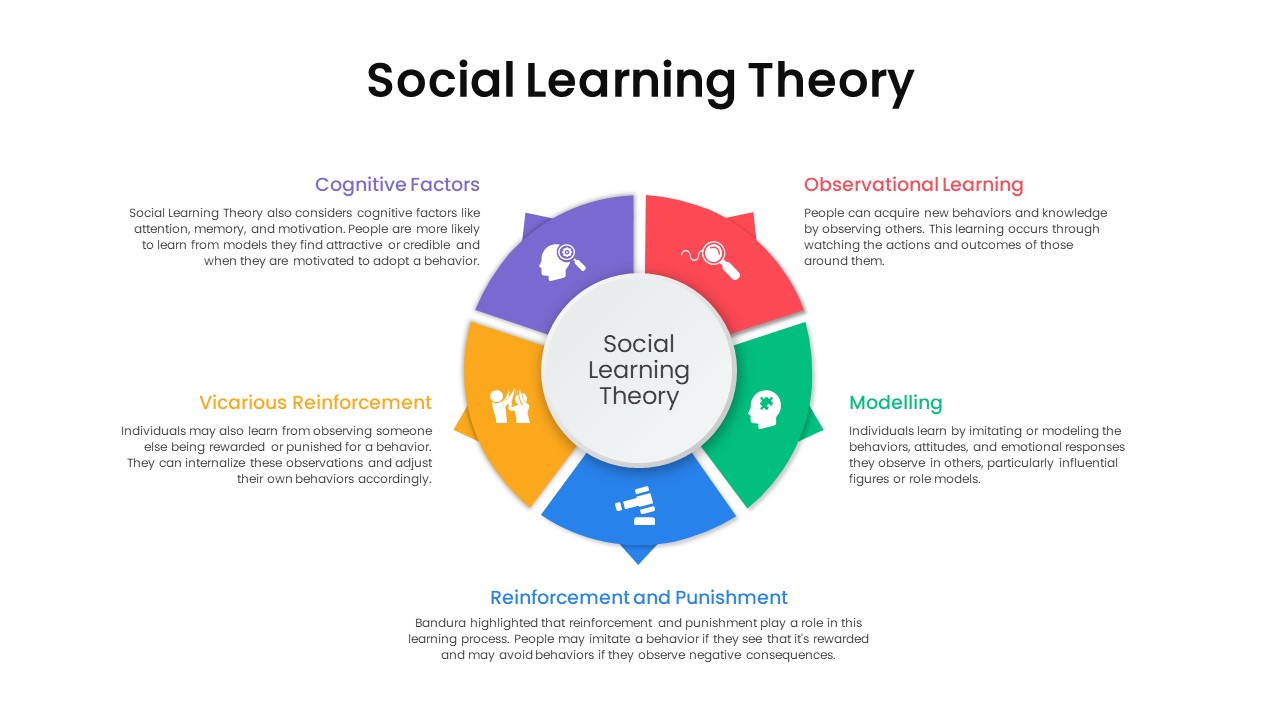
Social Learning Theory Infographic Template for PowerPoint & Google Slides
Circular
News Metaphor Media Communication Slide Template for PowerPoint & Google Slides
Business Report
Influencer Media Kit Company Profile Template for PowerPoint & Google Slides
Company Profile
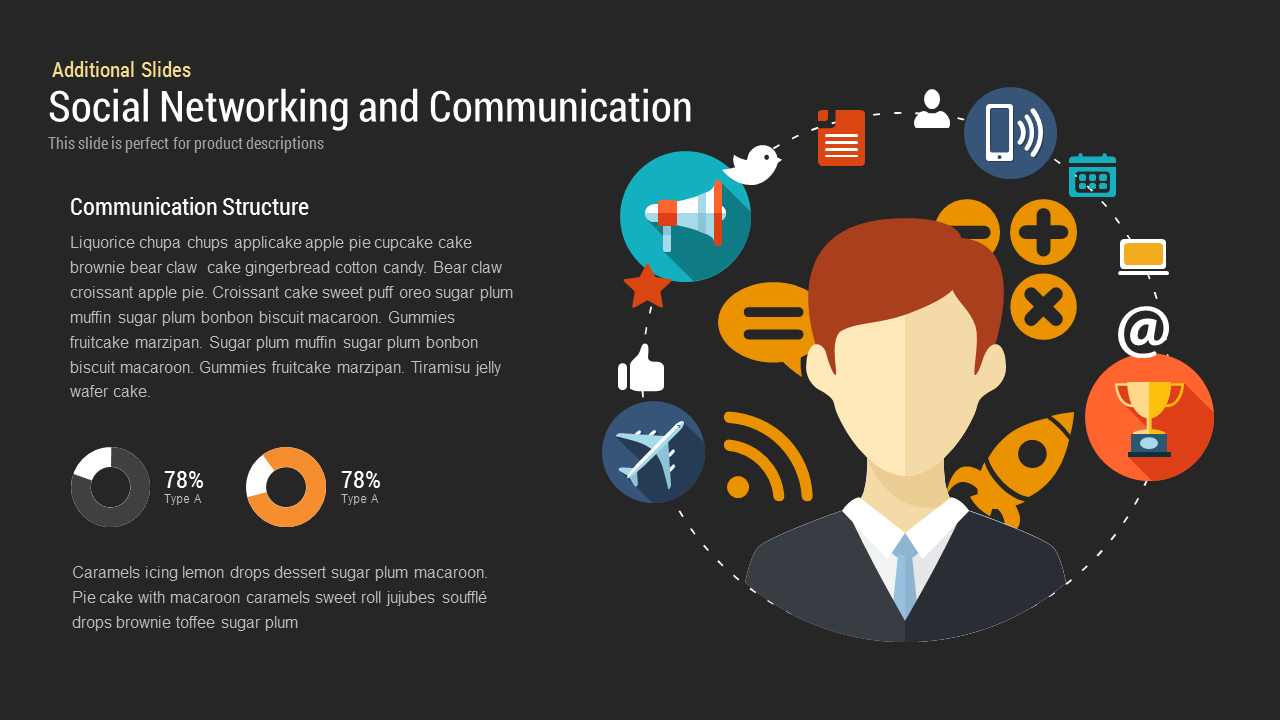
Social Networking and Communication template for PowerPoint & Google Slides
Digital Marketing
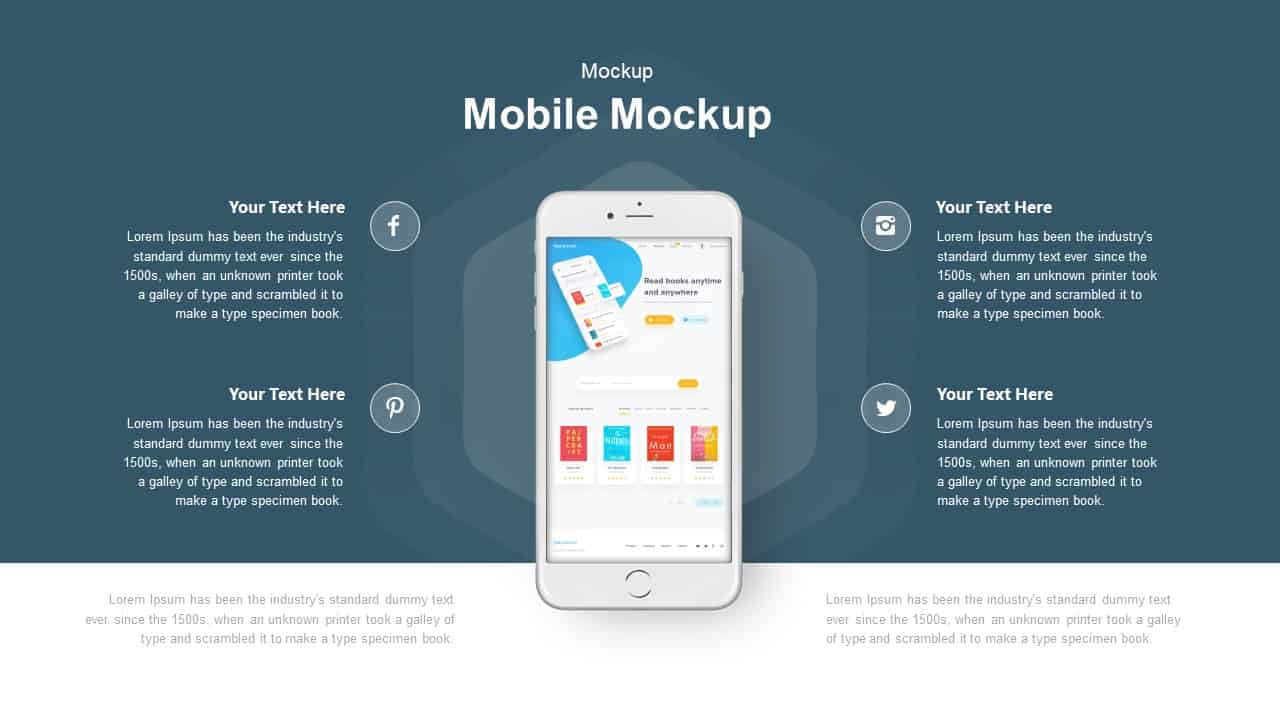
Mobile Mockup with Social Callouts Template for PowerPoint & Google Slides
Software Development
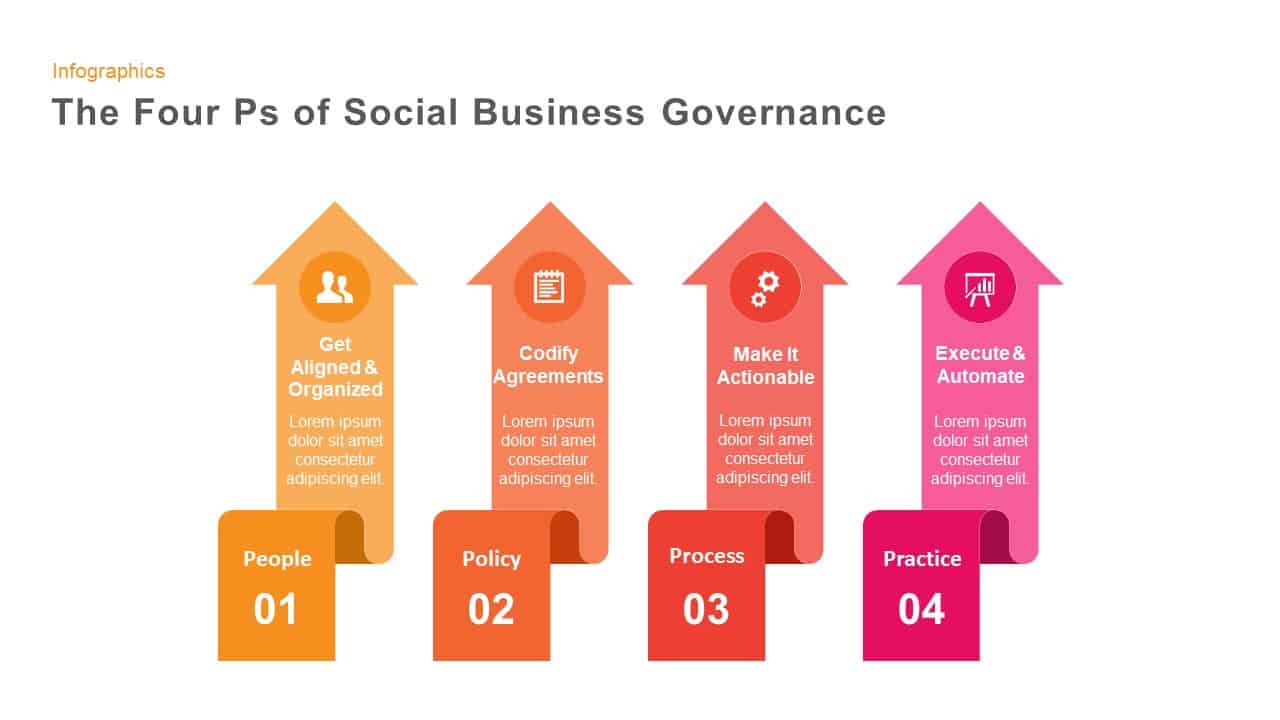
Four Ps of Social Business Governance template for PowerPoint & Google Slides
Business Strategy
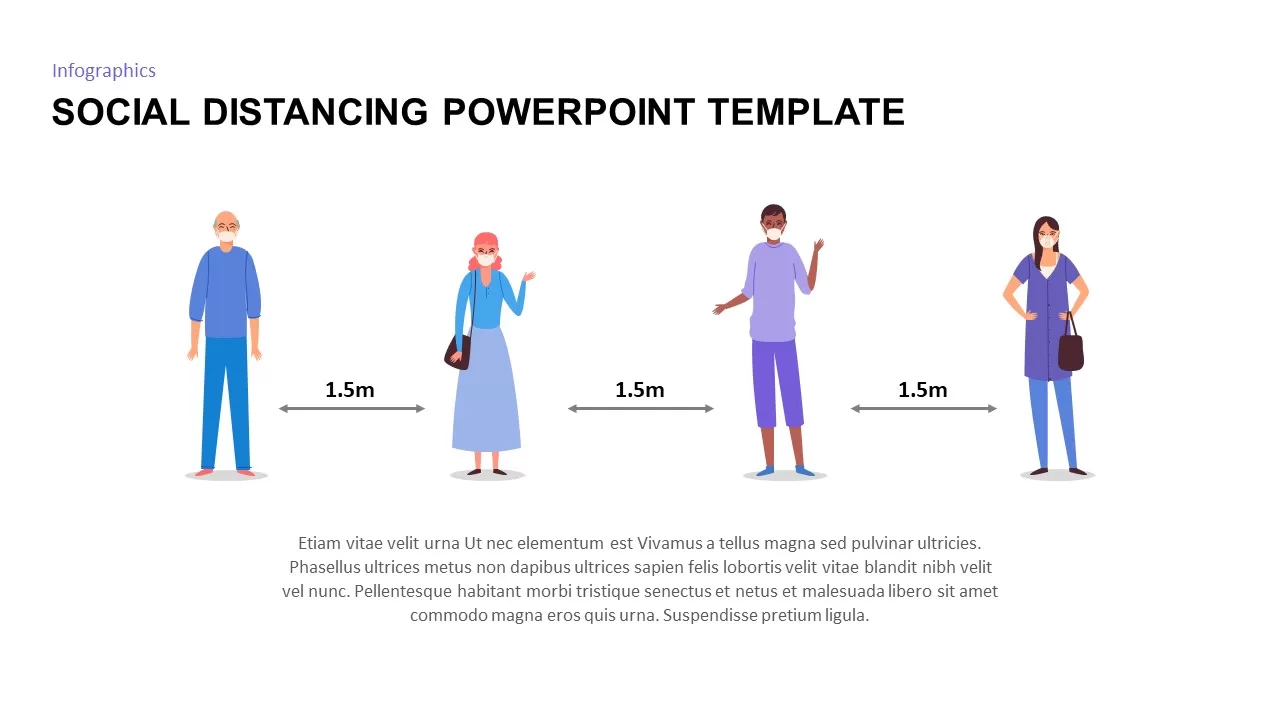
Social Distancing PowerPoint & Google Slides Template
Business Strategy
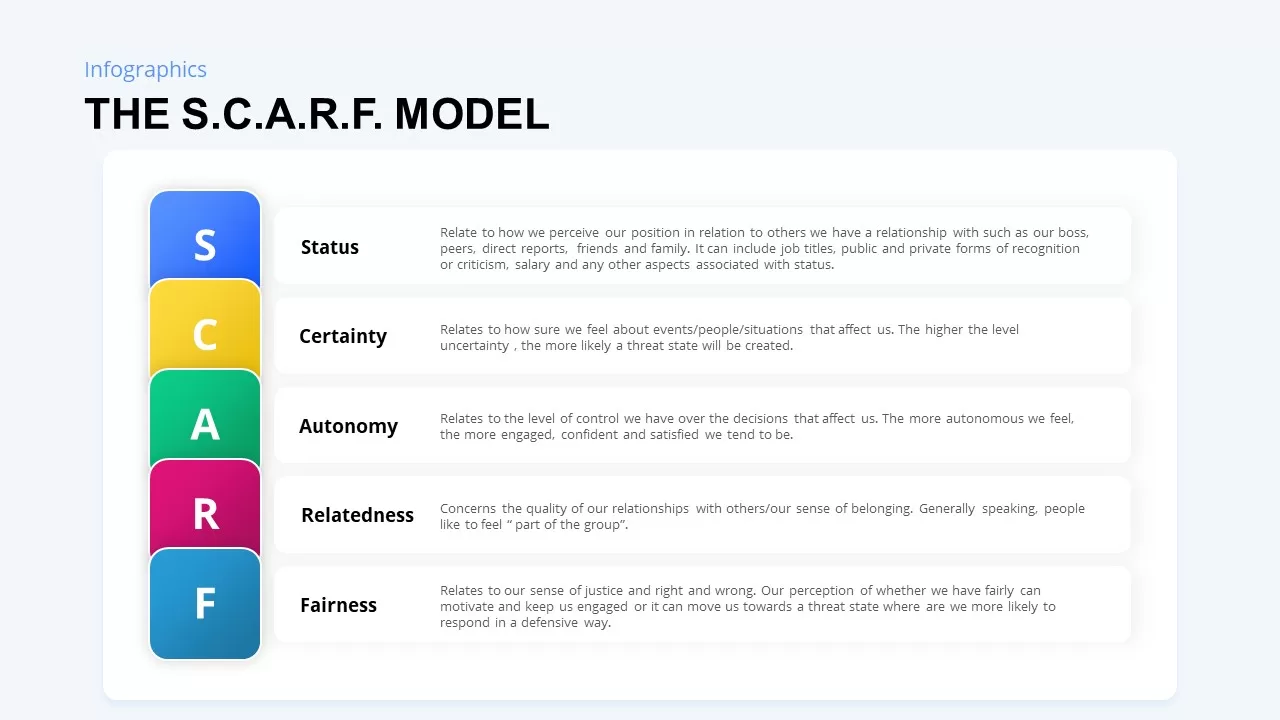
SCARF Model Social Threats & Rewards Template for PowerPoint & Google Slides
Business Strategy
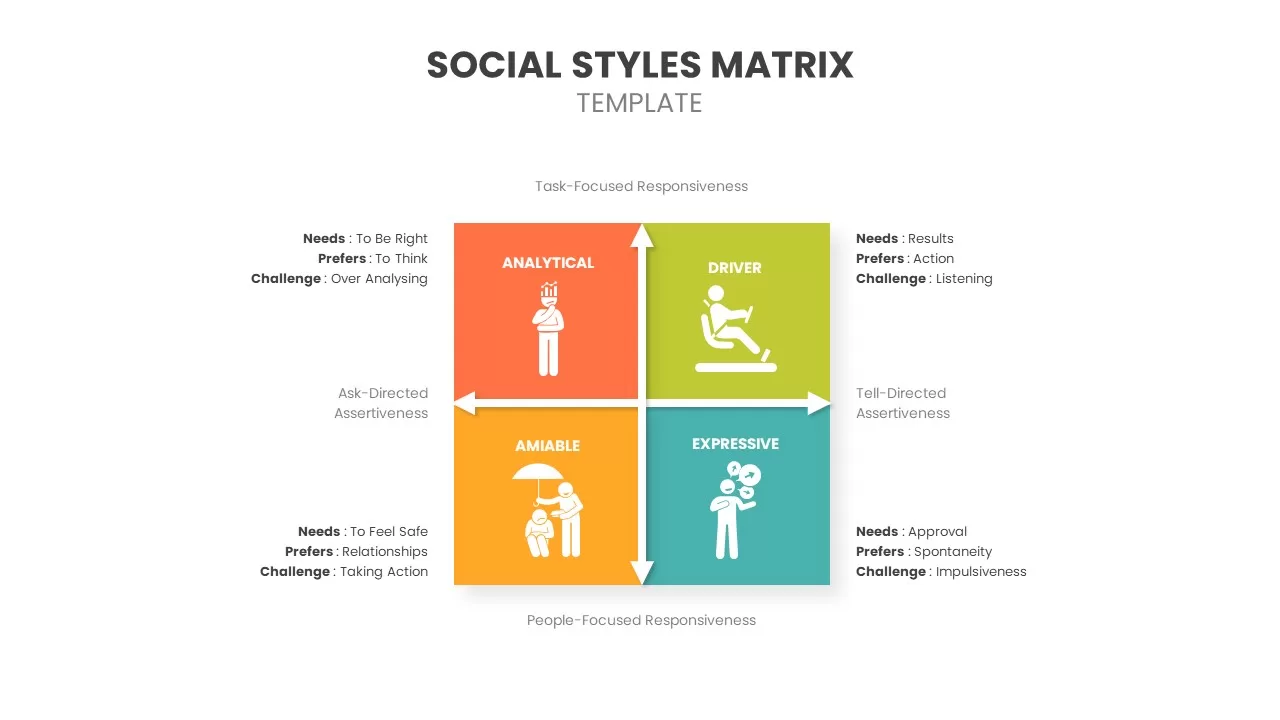
Social Styles Matrix Template for PowerPoint & Google Slides
Business
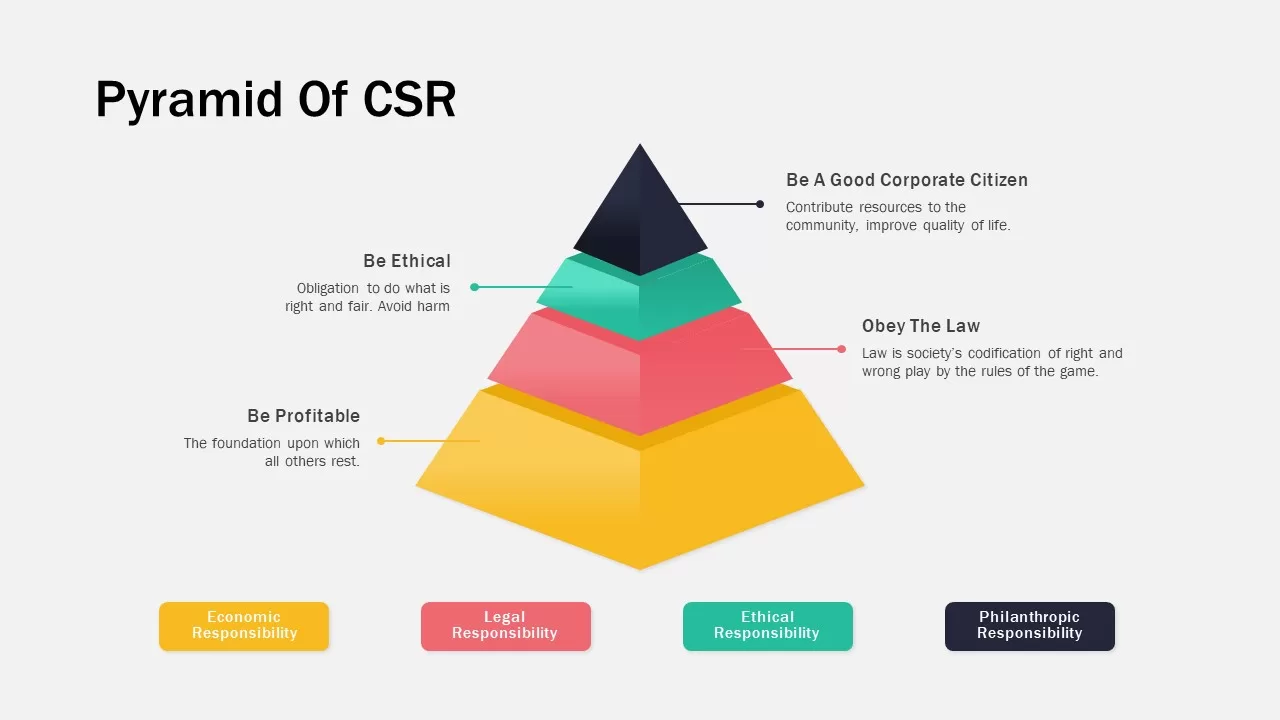
Corporate Social Responsibility Pyramid Template for PowerPoint & Google Slides
Pyramid
Corporate Social Responsibility Strategy Template for PowerPoint & Google Slides
Company Profile
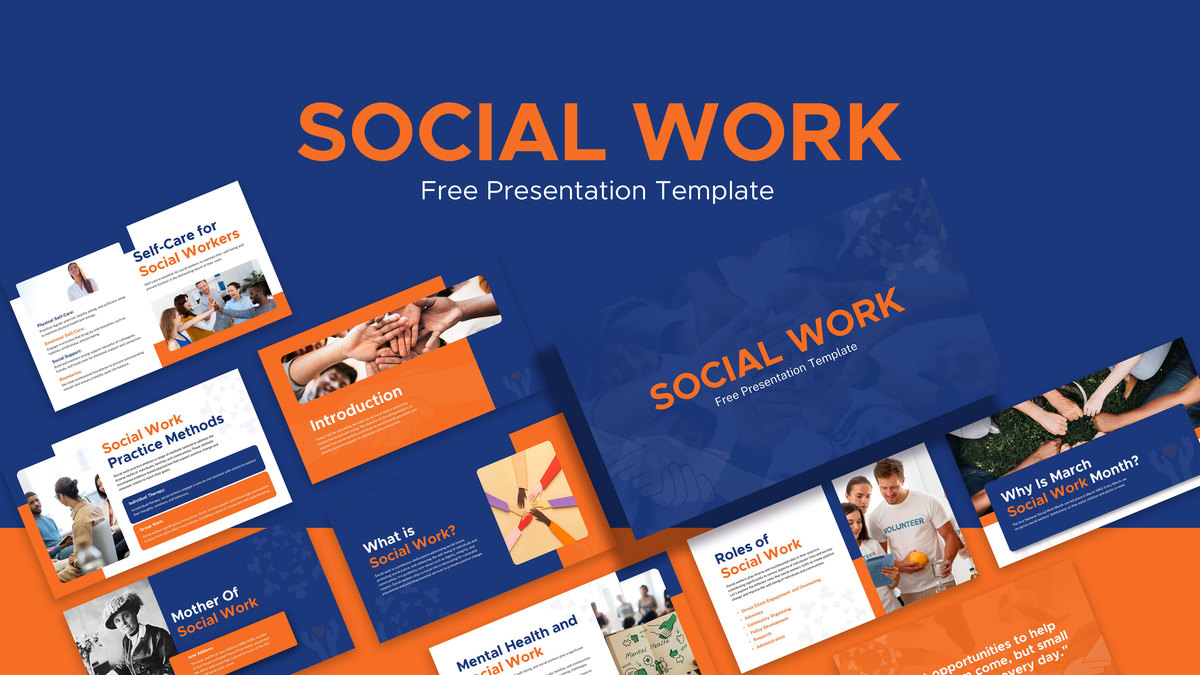
Free Comprehensive Social Work Presentation Template for PowerPoint & Google Slides
Pitch Deck
Free
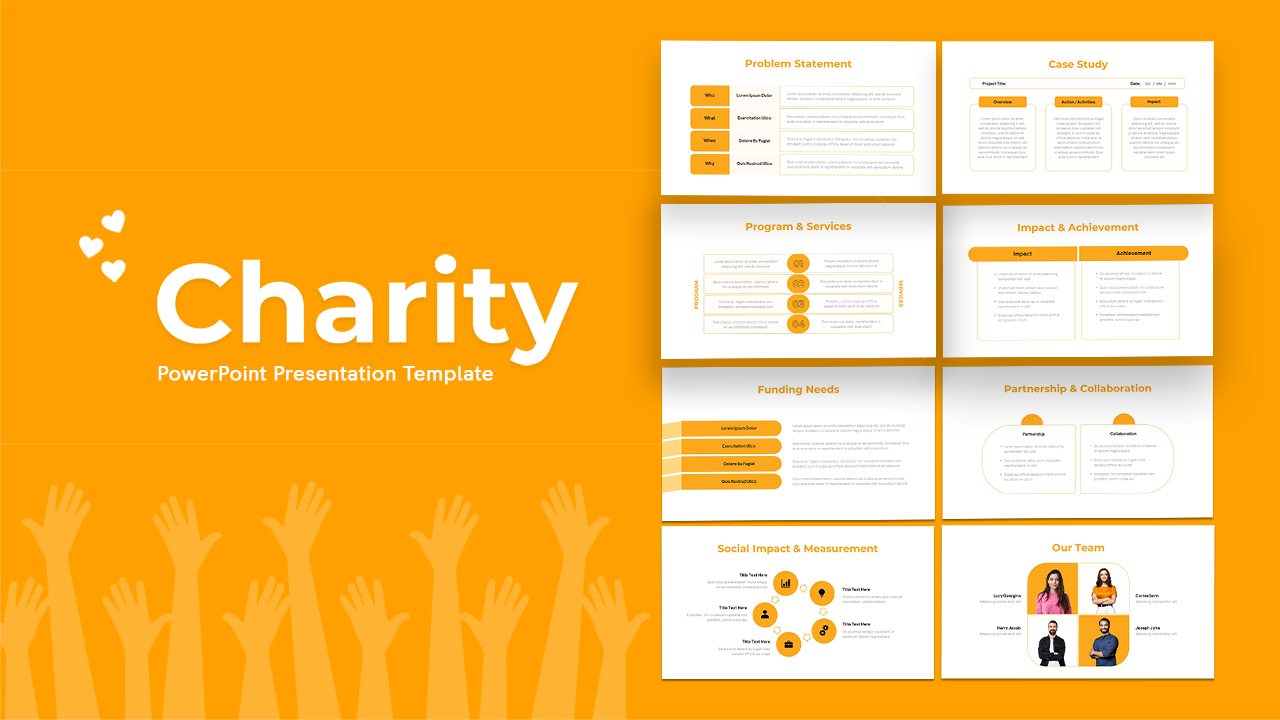
Free Nonprofit Charity Social Impact Deck Template for PowerPoint & Google Slides
Pitch Deck
Free
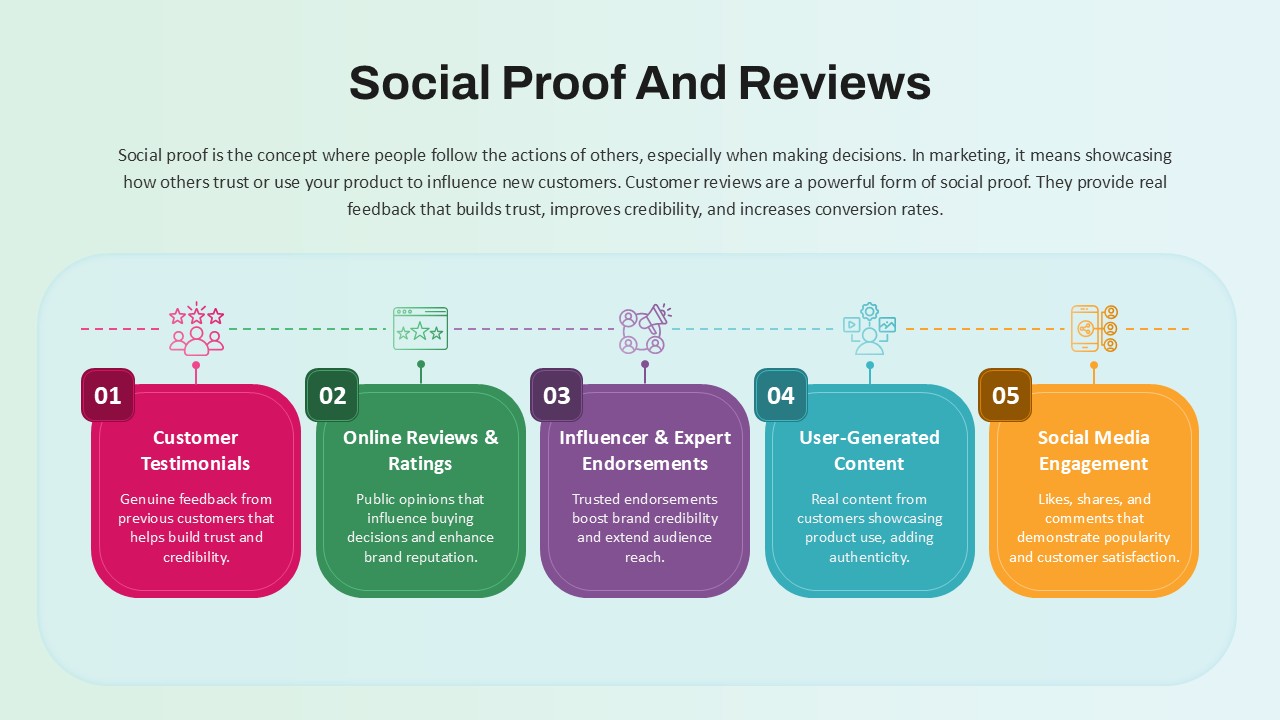
Social Proof and Reviews in Marketing template for PowerPoint & Google Slides
Customer Journey
Google Ads Optimization & Performance Infographic Template for PowerPoint & Google Slides
Digital Marketing
SQ3R Study Strategy Infographic Slides Template for PowerPoint & Google Slides
Business Strategy
Six Double Diamond Infographic Slides Template for PowerPoint & Google Slides
Process
Sales Process Infographic Slides Pack Template for PowerPoint & Google Slides
Process
Casino/Poker Chips Infographic Slides template for PowerPoint & Google Slides
Business Strategy
Agenda Infographic Pack of 2 Slides Template for PowerPoint & Google Slides
Agenda
Quad Chart Infographic Pack of 8 Slides Template for PowerPoint & Google Slides
Comparison Chart
Four Options Infographic Slides Template for PowerPoint & Google Slides
Comparison
Game Plan Infographic Slides Pack Template for PowerPoint & Google Slides
Infographics
Teamwork PowerPoint Infographic Template for PowerPoint & Google Slides
Leadership
Kite Infographic PowerPoint Template for PowerPoint & Google Slides
Process
Cladogram Infographic Di Template for PowerPoint & Google Slides Template
Decision Tree
Workflow PowerPoint Process infographic for PowerPoint & Google Slides
Process
Free Infographic Deck PowerPoint Pack for PowerPoint & Google Slides
Infographics
Free
Six Section Circular Infographic Diagram Template for PowerPoint & Google Slides
Circular
Curved Five-Section Timeline Infographic template for PowerPoint & Google Slides
Timeline

Arrow Infographic Template for PowerPoint & Google Slides
Arrow
North Korea Map with Provinces Infographic Pack Template for PowerPoint & Google Slides
Maps
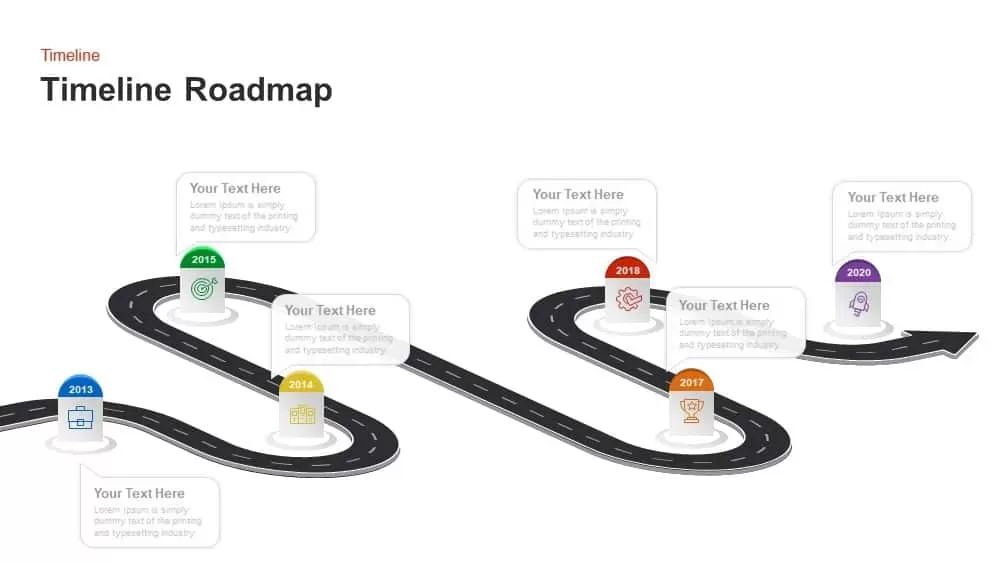
Timeline Roadmap Milestones Infographic Template for PowerPoint & Google Slides
Roadmap
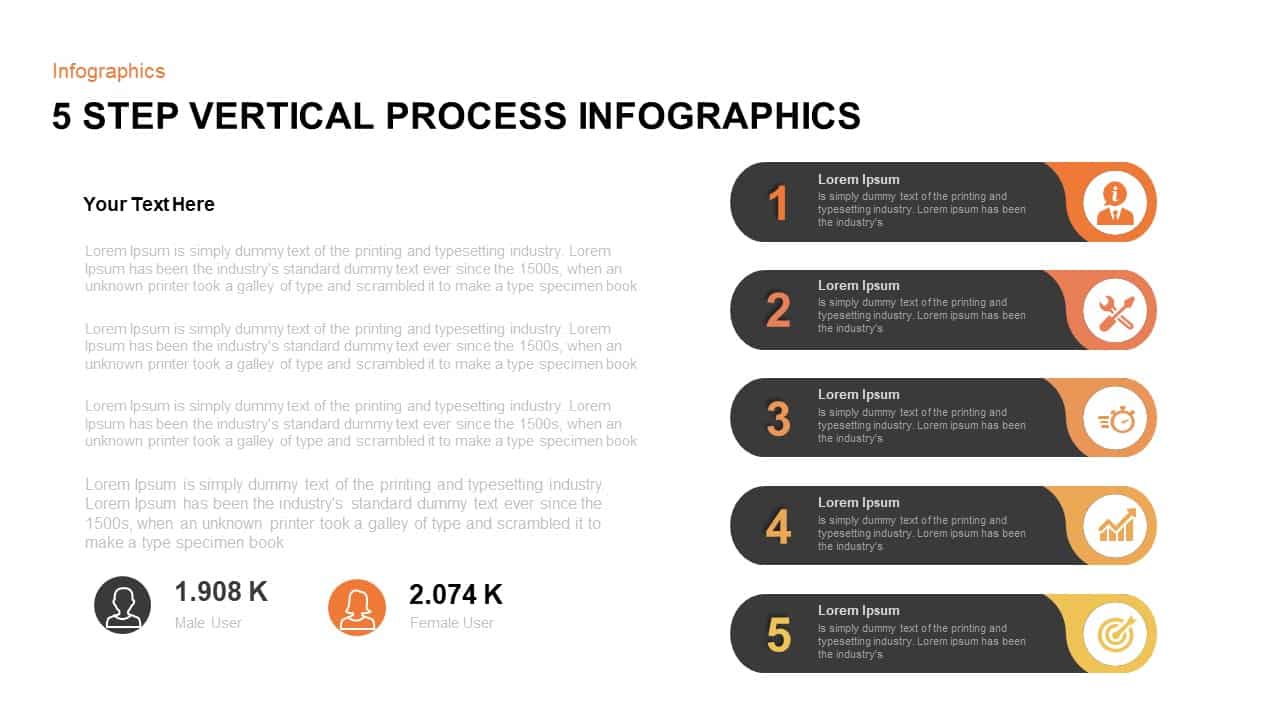
Five-Step Vertical Process Infographic Template for PowerPoint & Google Slides
Process

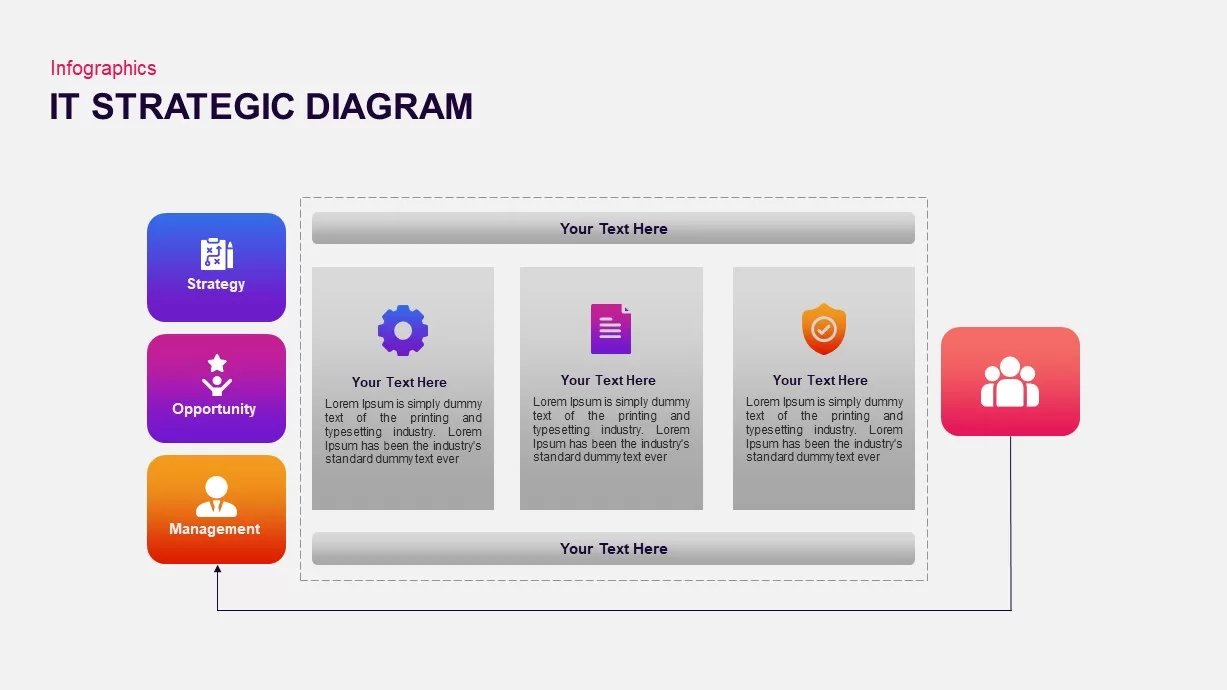
IT Strategic Diagram Infographic Pack Template for PowerPoint & Google Slides
Business Strategy
Free Five-Step Circular Timeline Infographic Template for PowerPoint & Google Slides
Timeline
Free
Professional Nurse Infographic Dashboard Template for PowerPoint & Google Slides
Nursing
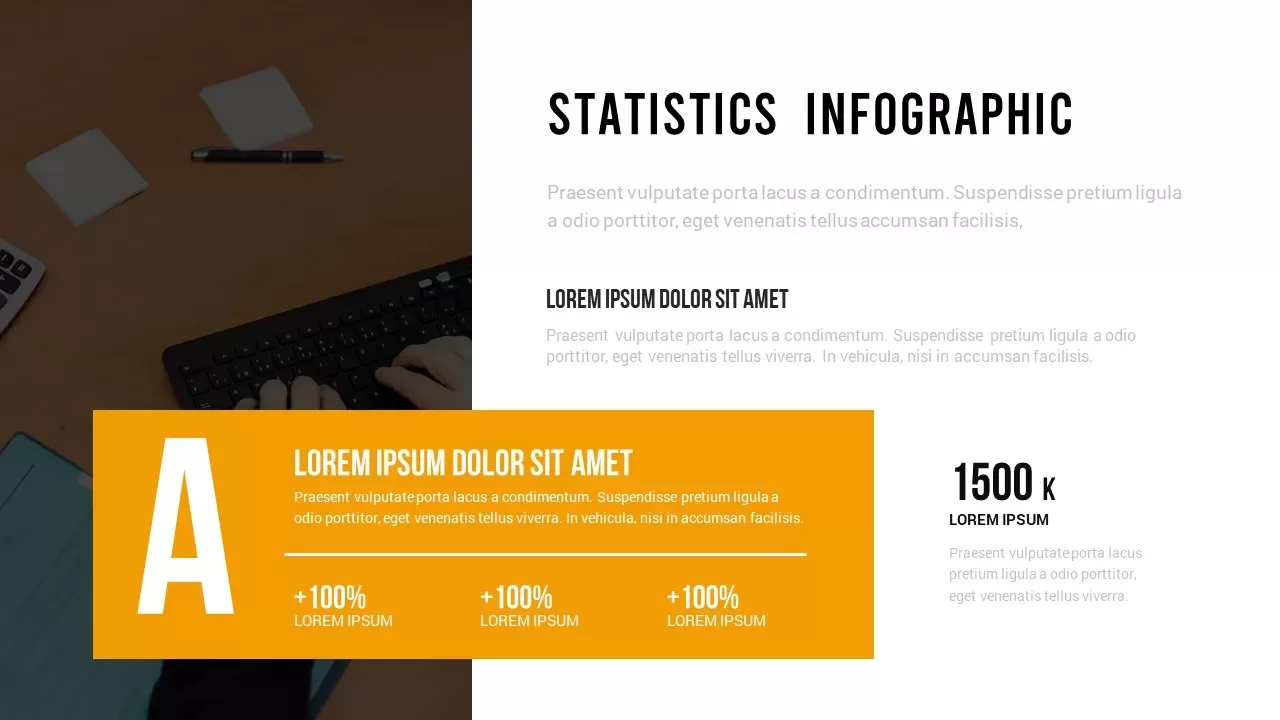
Statistics Infographic Template for PowerPoint & Google Slides
Infographics
Transformation Journey Infographic Template for PowerPoint & Google Slides
Process
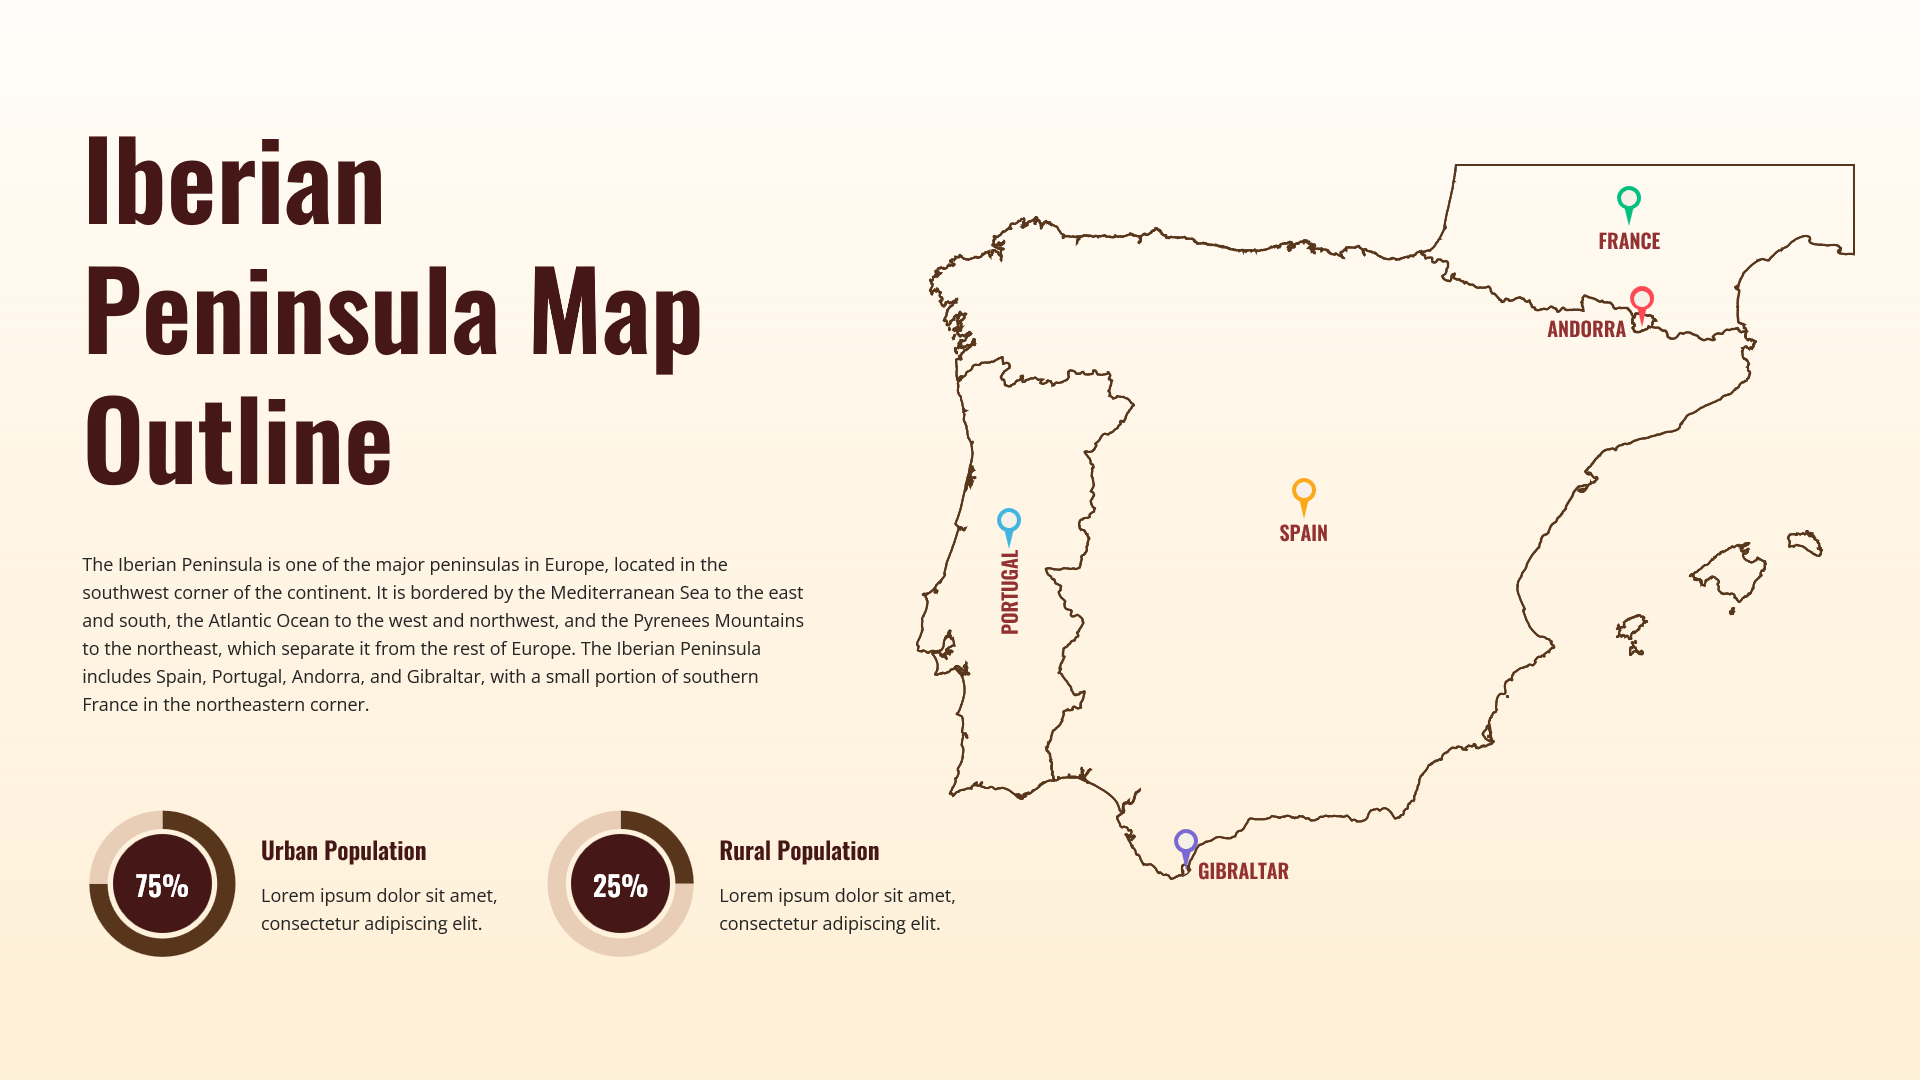
Iberian Peninsula Map Outline Infographic Template for PowerPoint & Google Slides
World Maps