Smartphone Data User template for PowerPoint & Google Slides

Description
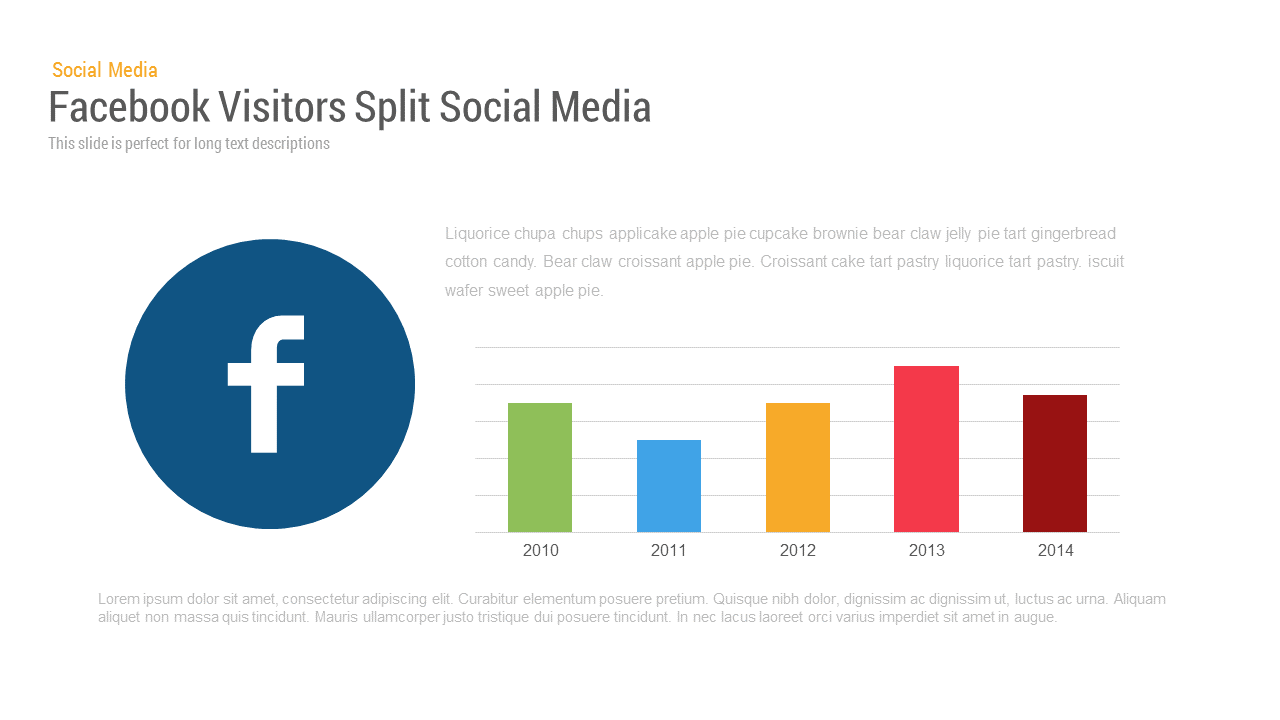
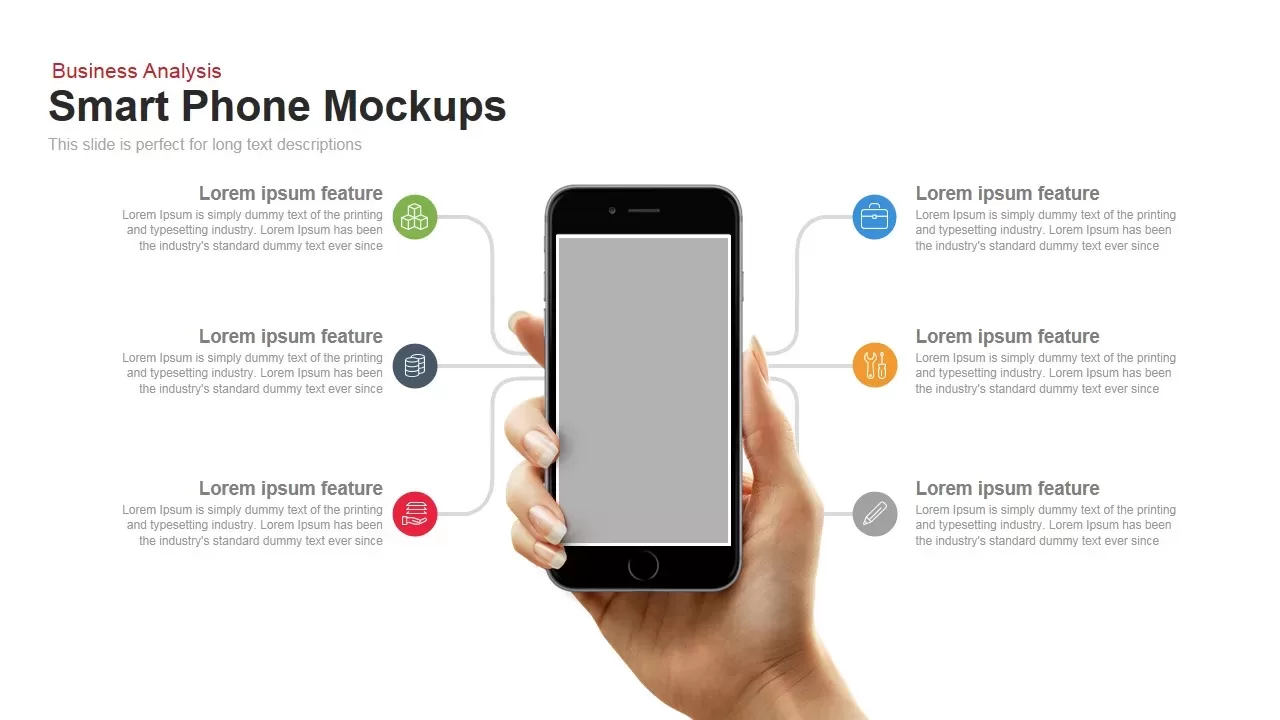
This Smartphone Data User slide features a dark background with a large smartphone mockup on the left, perfect for showcasing app screenshots or mobile interfaces. On the right, a multi-series bar chart displays user metrics from 2010 to 2014 using three distinct accent colors. Above the chart, a headline placeholder and subtitle area allow concise context-setting, while below, a stylized quote box with a vertical highlight bar invites additional narrative or key insights. Built on master slides, the template supports drag-and-drop image updates, color scheme adjustments via theme colors, and font changes with free Google Fonts. The high-contrast white text, grid lines, and chart axes ensure legibility on projectors, dark mode settings, and virtual meeting backgrounds. Rounded corners, pixel-perfect vector graphics, and subtle drop shadows create a polished, professional aesthetic.
Fully editable in PowerPoint and Google Slides, the slide scales seamlessly across 16:9 and 4:3 formats while remaining crisp on retina displays. Leverage built-in chart tools to update data values instantly or swap in line, pie, or area charts for alternate visuals. The modular layout lets you replace the smartphone frame with tablet or laptop mockups and repurpose the quote panel as a testimonial, KPI highlight, or call-out. Animate the chart and mockup with entrance transitions to captivate audiences, or use morph effects between data states for smooth storytelling. You can embed live screen recordings or video demos within the smartphone frame to showcase app experiences. Easily adjust axis labels, legend positions, and bar fills—apply gradient or semi-transparent overlays for focused highlights. The template also includes a hidden slide with alternate color themes and layout variations, streamlining global restyling across your deck and minimizing design work.
Who is it for
Product managers, data analysts, mobile marketers, and UX designers who need to present user engagement trends. Startups, app developers, and digital agencies will find it ideal for investor pitches and stakeholder demos. Educators and researchers can use it to illustrate mobile usage case studies and technological adoption.
Other Uses
Repurpose the slide to display sales performance dashboards, quarterly KPI reports, or tabletop device comparisons. Swap the mockup for other hardware frames, convert the bar chart into a timeline, or use the quote box for client testimonials or regulatory compliance notes. Its versatile dark theme works equally well for technical briefings, security overviews, or product roadmaps.
Login to download this file

Item ID
SB00060
Related Templates

Mobile User Data Analysis Infographic for PowerPoint & Google Slides
Process
Facebook User Split template for PowerPoint & Google Slides
Bar/Column

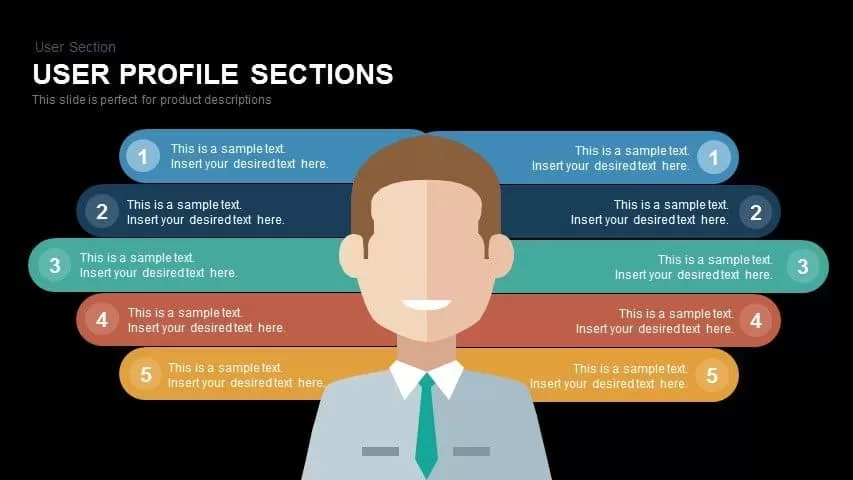
User Profile Hub-and-Spoke Diagram Template for PowerPoint & Google Slides
Our Team
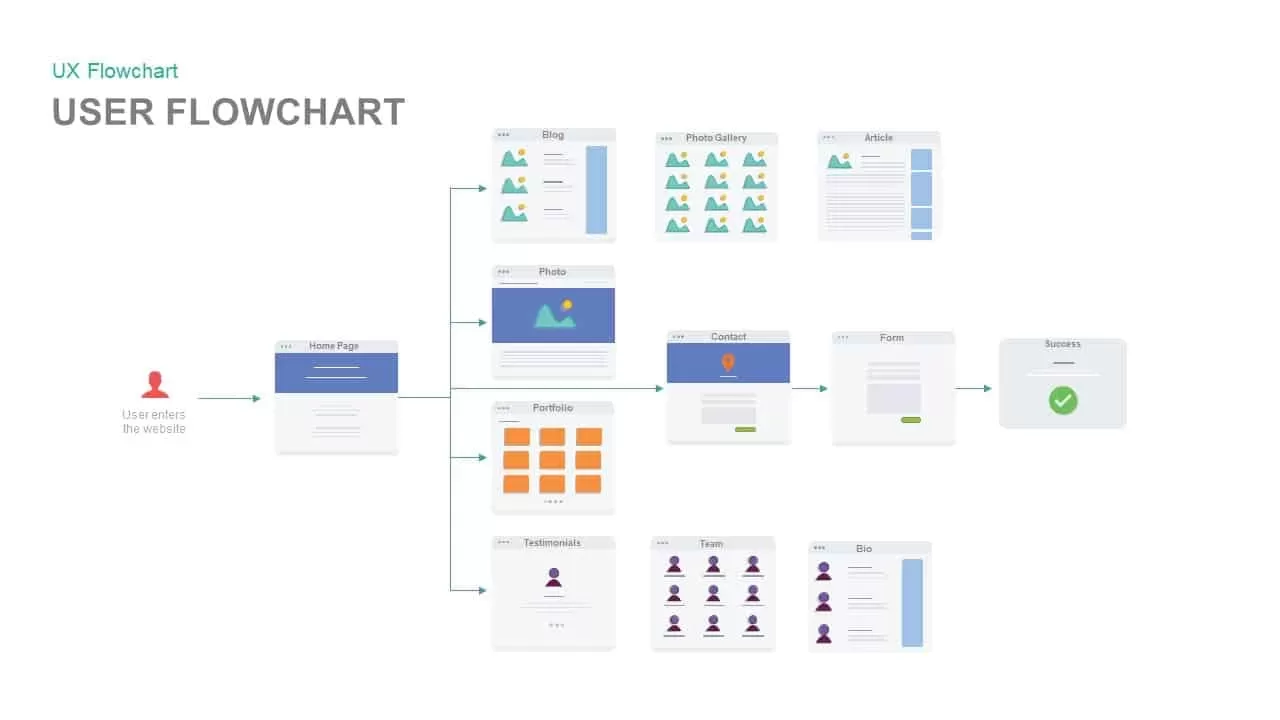
Website User Flowchart Diagram Template for PowerPoint & Google Slides
Process

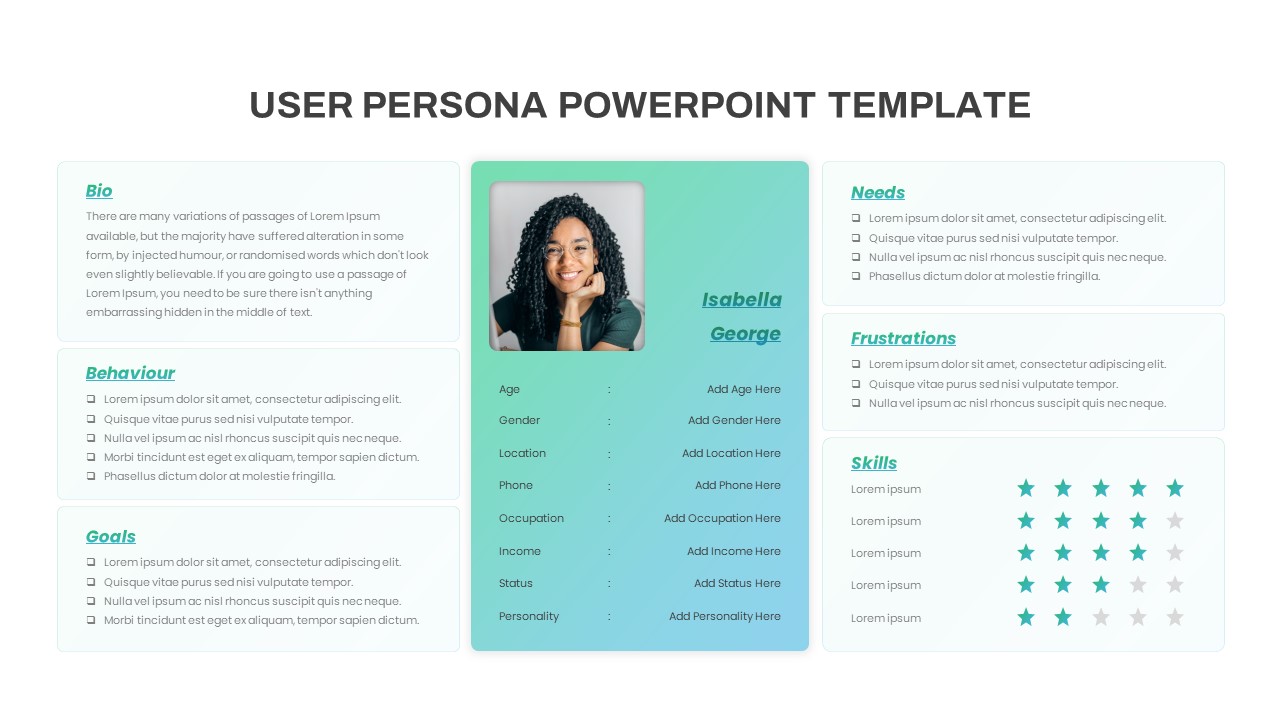
User Persona template for PowerPoint & Google Slides
Company Profile
User Persona template for PowerPoint & Google Slides
Customer Journey
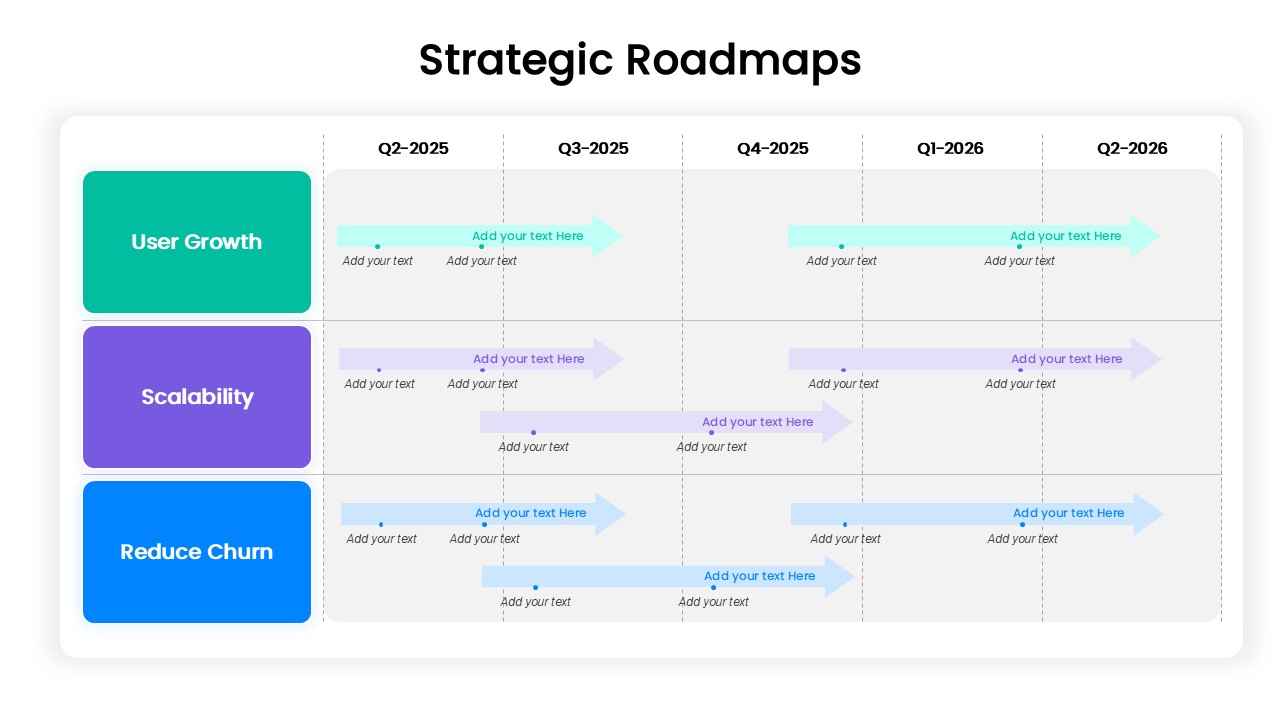
Strategic Roadmap for User Growth, Scalability, and Reducing Churn template for PowerPoint & Google Slides
Business
Free Gradient User Persona Profile Slide for PowerPoint & Google Slides
Recruitment
Free
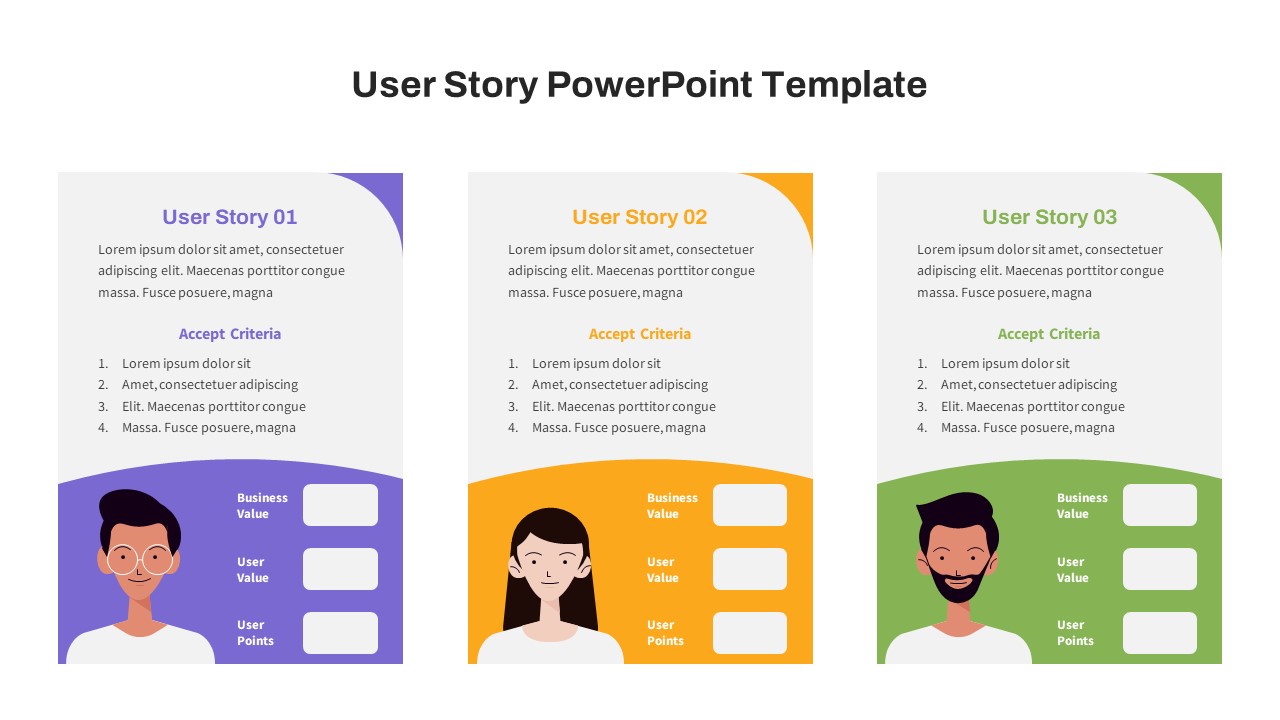
Free Agile User Story Card Slide for PowerPoint & Google Slides
Infographics
Free
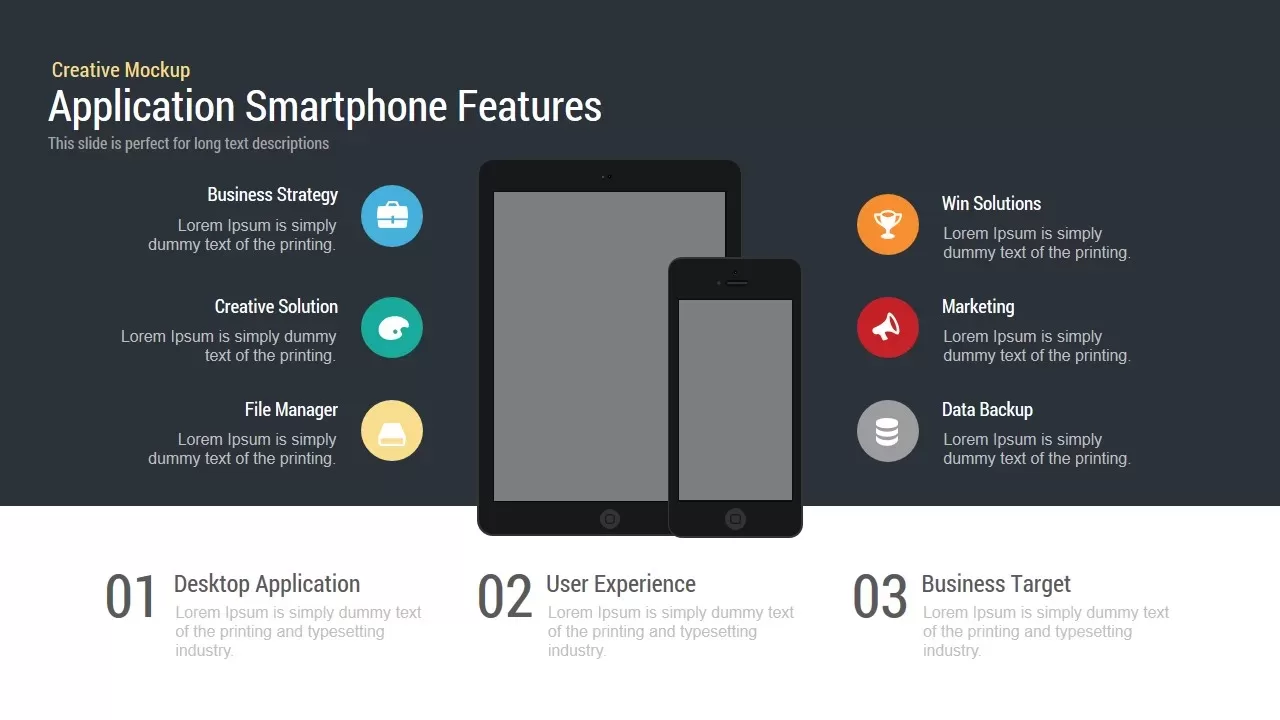
Application Smartphone Features template for PowerPoint & Google Slides
Technology

Smartphone Feature Highlights template for PowerPoint & Google Slides
Business
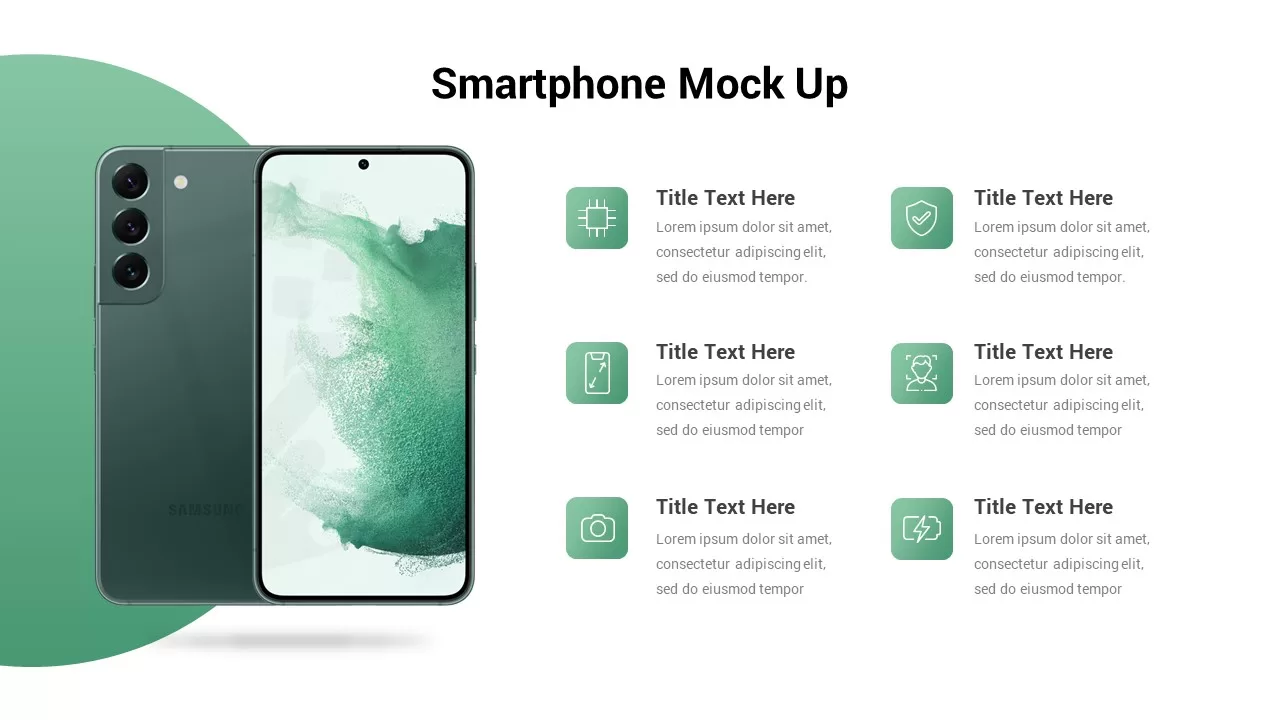
Smartphone Mockup template for PowerPoint & Google Slides
Information Technology
Smartphone App Mockup for Business Template for PowerPoint & Google Slides
Software Development
Smartphone App Features Mockup Template for PowerPoint & Google Slides
Software Development

Smartphone & Web Application Features template for PowerPoint & Google Slides
Software Development
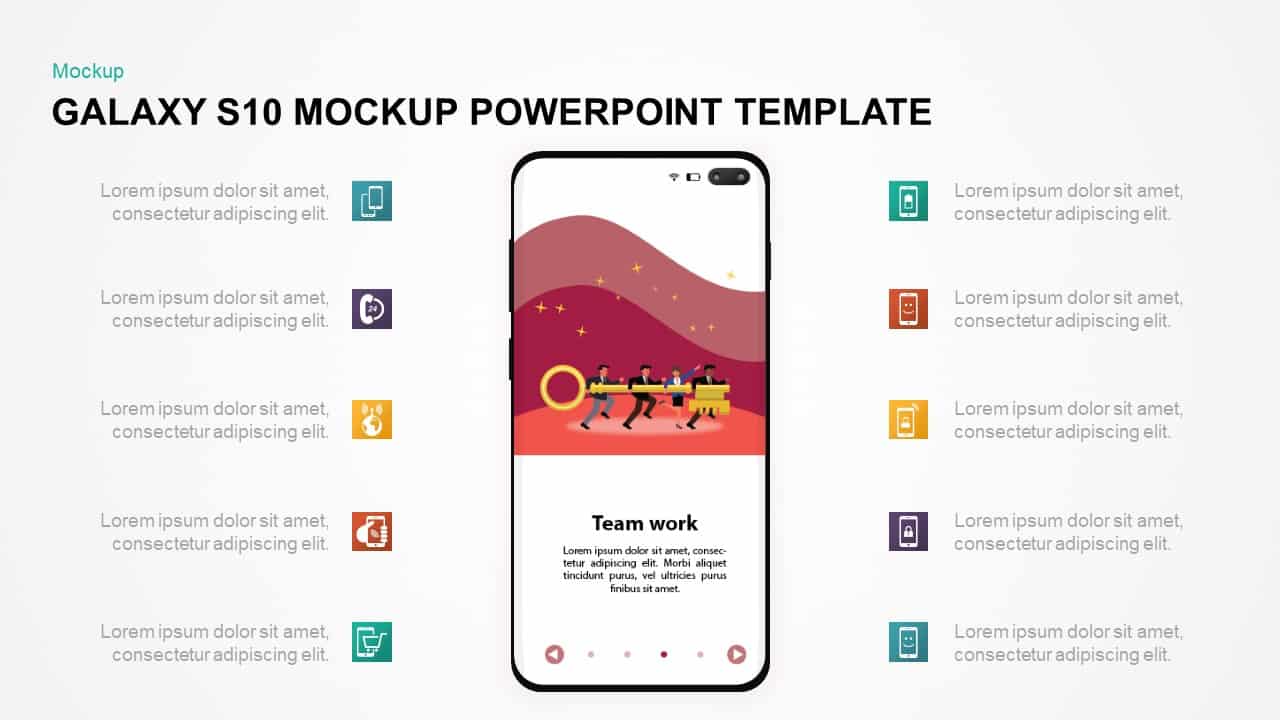
Galaxy S10 Smartphone Mockup Slide Template for PowerPoint & Google Slides
Infographics
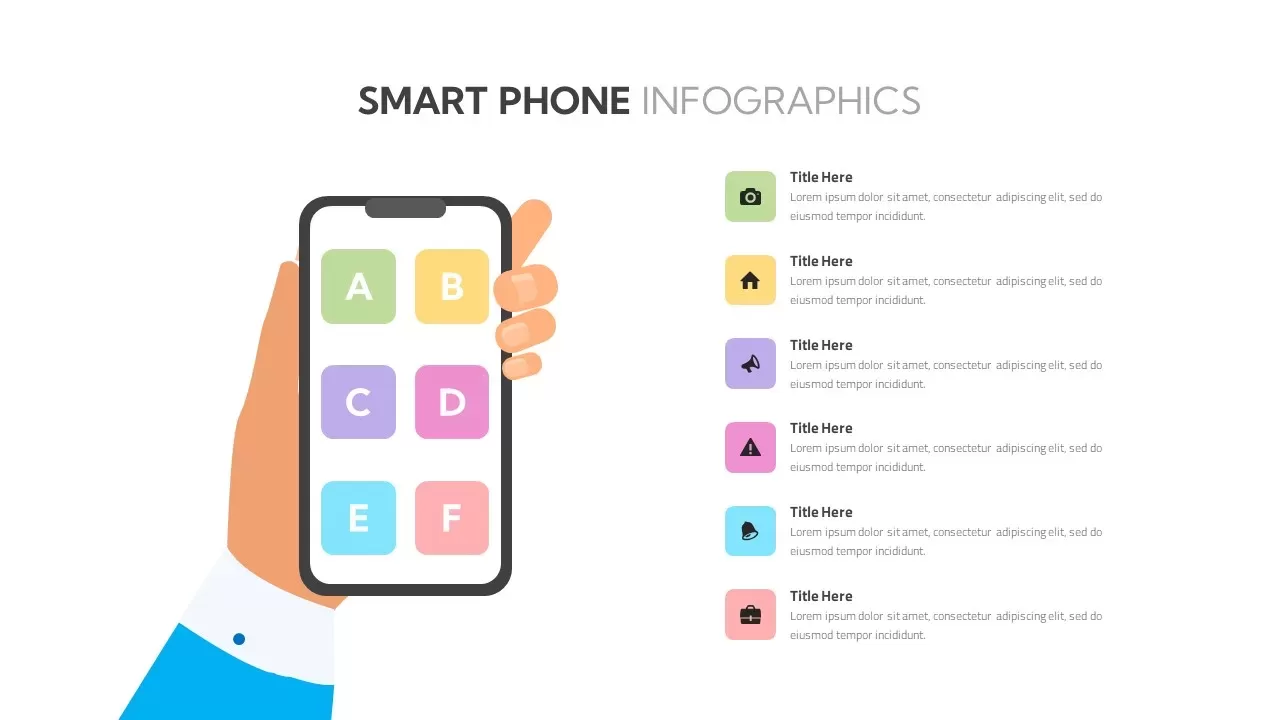
Smartphone Infographic Diagram Template for PowerPoint & Google Slides
Comparison
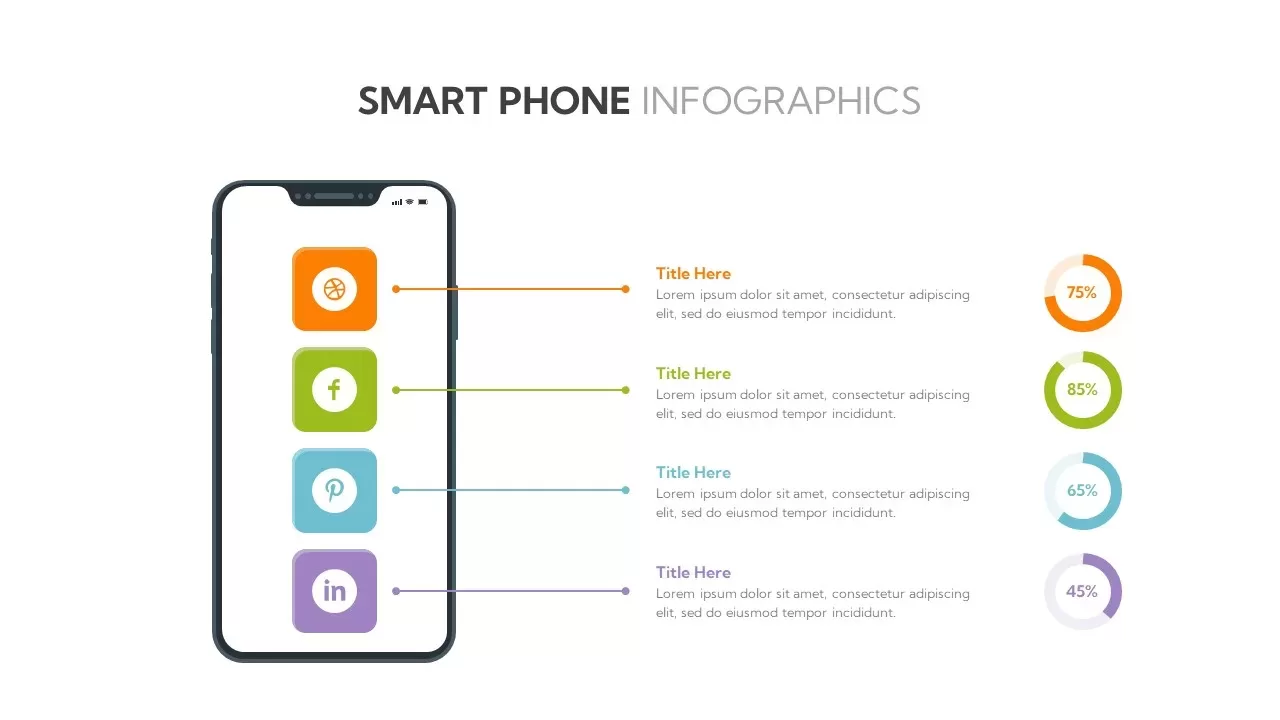
Social Media Smartphone Infographic Template for PowerPoint & Google Slides
Pie/Donut

Smartphone App Pitch Deck Presentation Template for PowerPoint & Google Slides
Pitch Deck
Smartphone Mockup Feature Overview Template for PowerPoint & Google Slides
Graphics
iPhone 14 Pro Smartphone Mockup Slide Template for PowerPoint & Google Slides
Graphics
Handheld Smartphone Mockup Slide Template for PowerPoint & Google Slides
Graphics
Horizontal Smartphone Feature Highlights Template for PowerPoint & Google Slides
Graphics
Free Minimal Smartphone Feature Overview Slide for PowerPoint & Google Slides
Information Technology
Free
Data Science PowerPoint Presentation Template for PowerPoint & Google Slides
Pitch Deck
Data Center PowerPoint Template for PowerPoint & Google Slides
Information Technology

Creative data chart analytics template for PowerPoint & Google Slides
Charts
Mobile Data Analysis Chart template for PowerPoint & Google Slides
Charts
World Map Data template for PowerPoint & Google Slides
World Maps
Circle Chart Data template for PowerPoint & Google Slides
Pie/Donut
Creative Data Analysis Bar Chart template for PowerPoint & Google Slides
Bar/Column
Interactive US Population Data Map Slide Template for PowerPoint & Google Slides
World Maps
3D Bar Chart Data Infographics Template for PowerPoint & Google Slides
Bar/Column
3D Stacked Infographic Layers Data Template for PowerPoint & Google Slides
Pyramid
Circle Graph Data Visualization Template for PowerPoint & Google Slides
Circular
Pencil Bar Chart Data Analysis Template for PowerPoint & Google Slides
Bar/Column
3D Cone Chart Data Visualization template for PowerPoint & Google Slides
Bar/Column
Creative Lab Beakers Data Infographic template for PowerPoint & Google Slides
Infographics
Dynamic Data Dashboard Infographic Template for PowerPoint & Google Slides
Bar/Column
Data Analytics Dashboard Design template for PowerPoint & Google Slides
Bar/Column
Gear Pie Diagram Data Visualization Template for PowerPoint & Google Slides
Pie/Donut
Data-Driven Marketing Cycle Diagram Template for PowerPoint & Google Slides
Customer Journey
Tornado Chart Data Comparison Slide Template for PowerPoint & Google Slides
Bar/Column
Bottle Data Percentage Infographic Template for PowerPoint & Google Slides
Infographics
Immigration Data Dashboard Template for PowerPoint & Google Slides
Bar/Column
Leaf Infographic Data Visualization Template for PowerPoint & Google Slides
Infographics
Mobile Infographics Data Visualization Template for PowerPoint & Google Slides
Infographics
Data Management and Analytics Diagram Template for PowerPoint & Google Slides
Circular
Data Migration Life Cycle Curved Diagram Template for PowerPoint & Google Slides
Process
Medical Infographics Data Visualization Template for PowerPoint & Google Slides
Health
DIKW Data to Wisdom Pyramid Model Template for PowerPoint & Google Slides
Pyramid
Data-driven GDP Growth Infographic Pack Template for PowerPoint & Google Slides
Infographics
KPI Dashboard Data Visualization Template for PowerPoint & Google Slides
Bar/Column
KPI Dashboard Data Overview Slide Template for PowerPoint & Google Slides
Bar/Column
North America Data Map Callouts Template for PowerPoint & Google Slides
World Maps
Professional Heatmap Data Visualization Template for PowerPoint & Google Slides
Infographics
Donut Chart Data Breakdown template for PowerPoint & Google Slides
Pie/Donut

Modern Big Data Infographic Deck Template for PowerPoint & Google Slides
Decks
Waffle Chart Data Visualization Template for PowerPoint & Google Slides
Comparison Chart
Layered Data Governance Maturity Model Template for PowerPoint & Google Slides
Process
Free Stacked Column Chart Data Visualization Template for PowerPoint & Google Slides
Bar/Column
Free
Simple Bar Chart Data Visualization Template for PowerPoint & Google Slides
Bar/Column
XY Bubble Chart Data Visualization Template for PowerPoint & Google Slides
Comparison Chart
Simple Area Chart Data Trends Analysis Template for PowerPoint & Google Slides
Comparison Chart
Data Over Time Line Chart template for PowerPoint & Google Slides
Charts
Waterfall Chart Data Visualization Template for PowerPoint & Google Slides
Comparison Chart
Multipurpose Spline Chart Data Trend Template for PowerPoint & Google Slides
Bar/Column
Editable Africa Map Infographic Data Template for PowerPoint & Google Slides
World Maps
UK Counties Map Data Visualization Template for PowerPoint & Google Slides
World Maps
Advanced Data Flow Diagram Pack Template for PowerPoint & Google Slides
Flow Charts
Interactive Jump Line Data Chart Template for PowerPoint & Google Slides
Comparison Chart
Segmented Scatter Chart Data Visualization Template for PowerPoint & Google Slides
Business Strategy
Free Big Data Network Visualization Template for PowerPoint & Google Slides
Circular
Free
Syria Regional Data Map Infographic Template for PowerPoint & Google Slides
World Maps
Data Analysis Bar Chart with Insights Template for PowerPoint & Google Slides
Bar/Column
Free
Data Lake Hub-and-Spoke Diagram Template for PowerPoint & Google Slides
Cloud Computing
ETL Data Pipeline Workflow Diagram Template for PowerPoint & Google Slides
Process
Data Privacy template for PowerPoint & Google Slides
Information Technology
Data Protection Strategies template for PowerPoint & Google Slides
Information Technology
Comprehensive Data & AI Capability Model Template for PowerPoint & Google Slides
AI
Data Flywheel Strategy template for PowerPoint & Google Slides
Business
Data Privacy and Compliance in ML template for PowerPoint & Google Slides
Technology
Data-Driven AI in Insurance Infographic Template for PowerPoint & Google Slides
Circular
AI and Data Ecosystem Map Template for PowerPoint & Google Slides
AI
Data Studio Insights template for PowerPoint & Google Slides
Business Report
Data Protection & Encryption in the Cloud Overview template for PowerPoint & Google Slides
Cloud Computing
Customer Data Platform Workflow Diagram Template for PowerPoint & Google Slides
Information Technology
Data-Driven Marketing Lifecycle Diagram Template for PowerPoint & Google Slides
Process
Data-Driven Decision Making overview template for PowerPoint & Google Slides
Business
First Party Data Overview Template for PowerPoint & Google Slides
Business
Data Governance Roles Pyramid Diagram Template for PowerPoint & Google Slides
Pyramid
Business Data Table Template for PowerPoint & Google Slides
Table
Colorful Business Data Comparison Table Template for PowerPoint & Google Slides
Table
Six Column Data Table Template for PowerPoint & Google Slides
Table
Data Gap Analysis Template for PowerPoint & Google Slides
Business
Data-Driven Sales Strategy Diagram Template for PowerPoint & Google Slides
Marketing
Bar Data Chart Slide for PowerPoint & Google Slides
Bar/Column
Weekly Data Chart Slide for PowerPoint & Google Slides
Comparison Chart

Cone Data Chart for PowerPoint & Google Slides
Charts
4 Business Data Infographics Diagram for PowerPoint & Google Slides
Process