Six-Staged Gear Diagram Framework Template for PowerPoint & Google Slides

Description
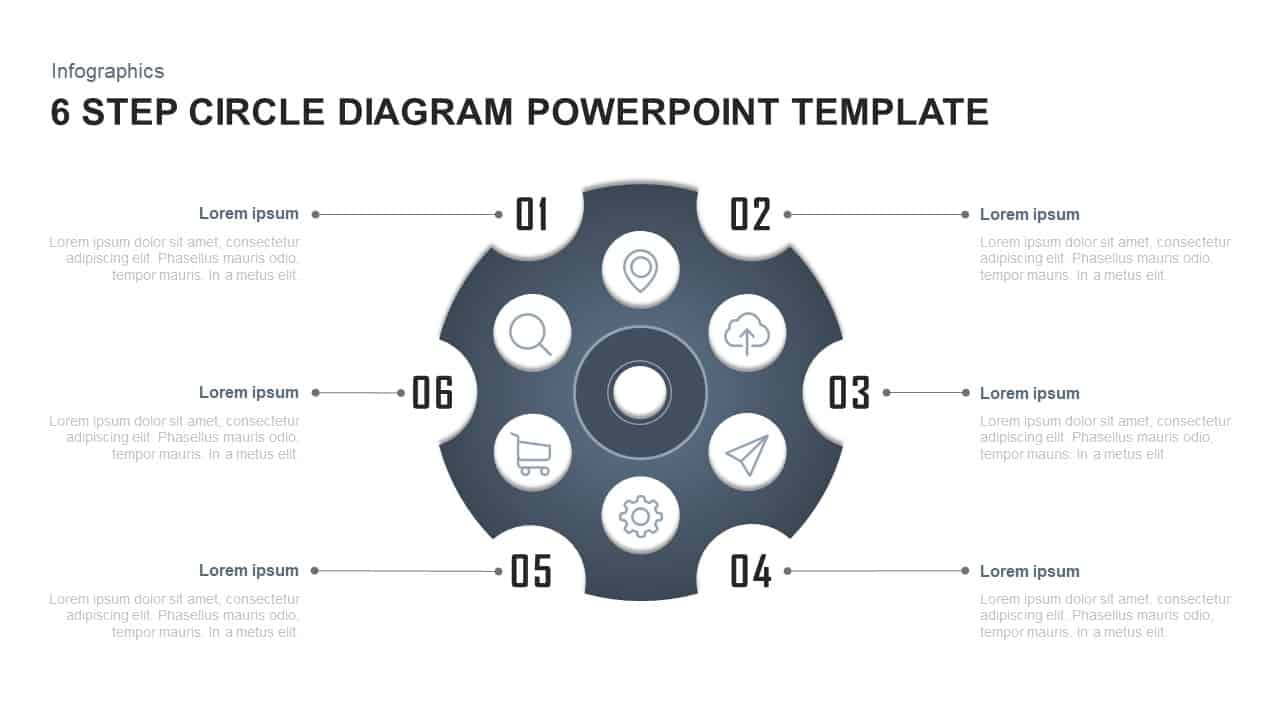
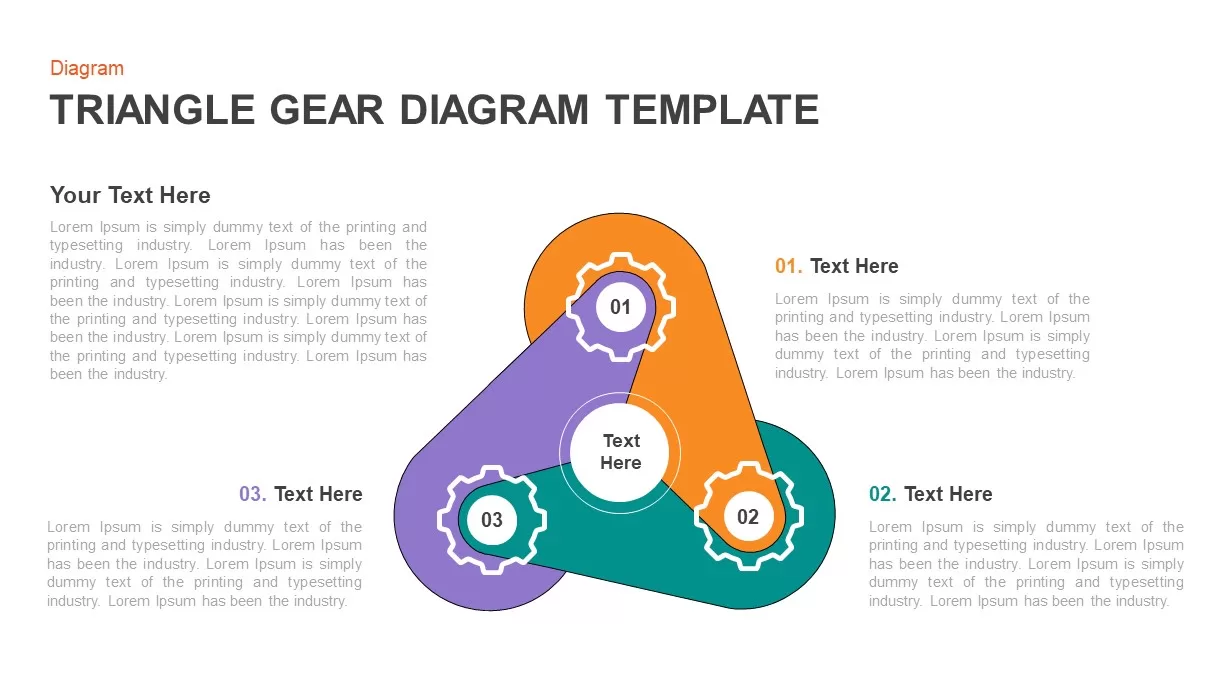
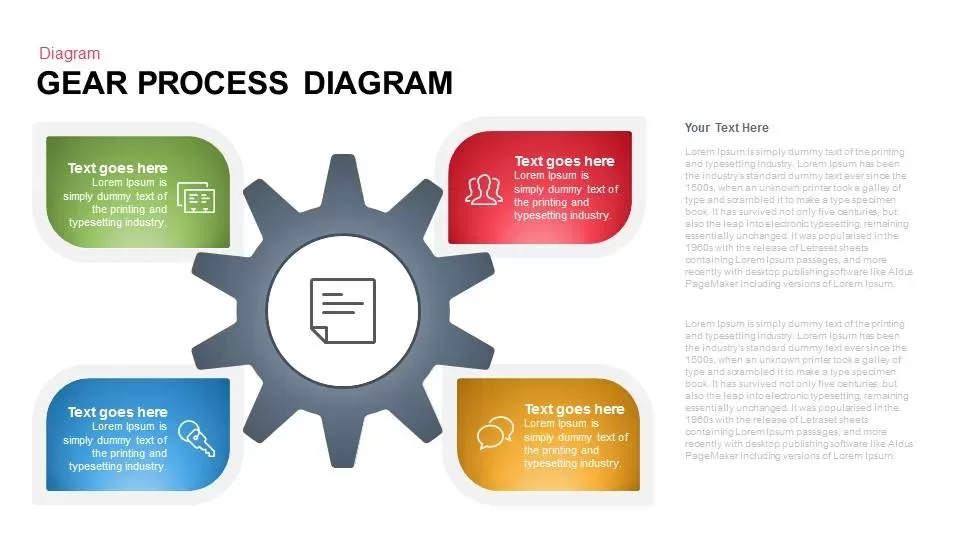
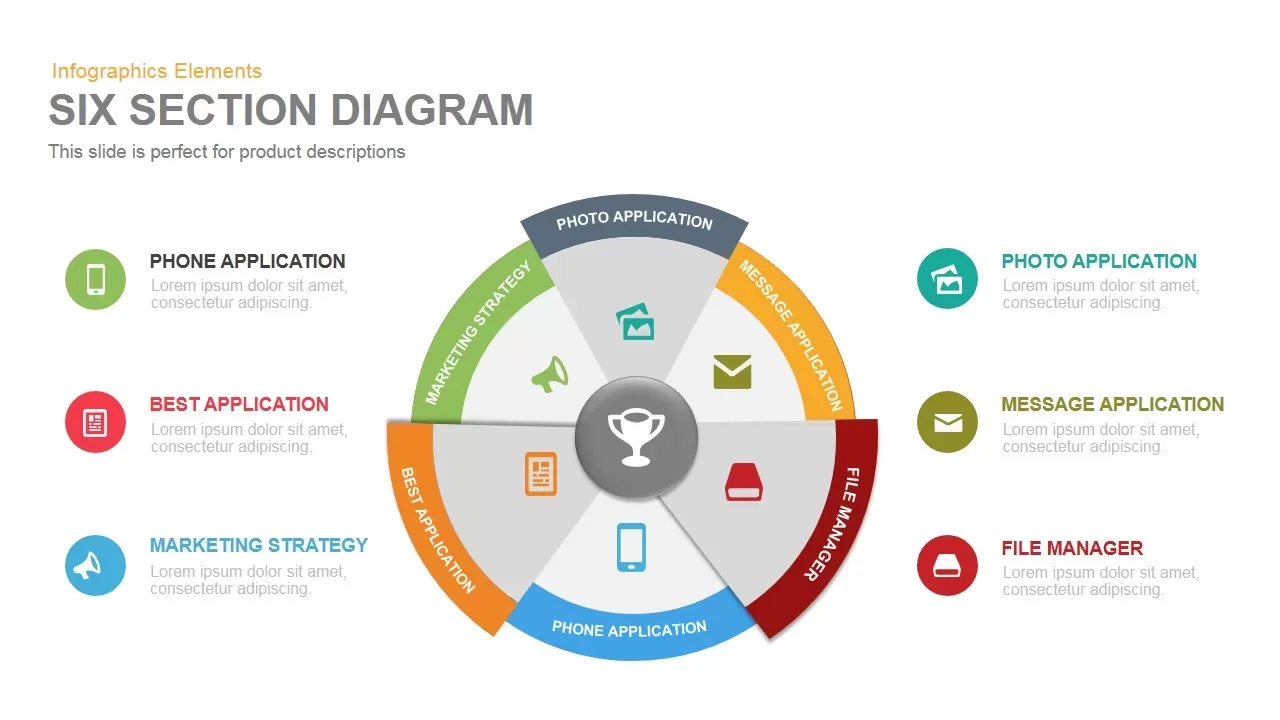
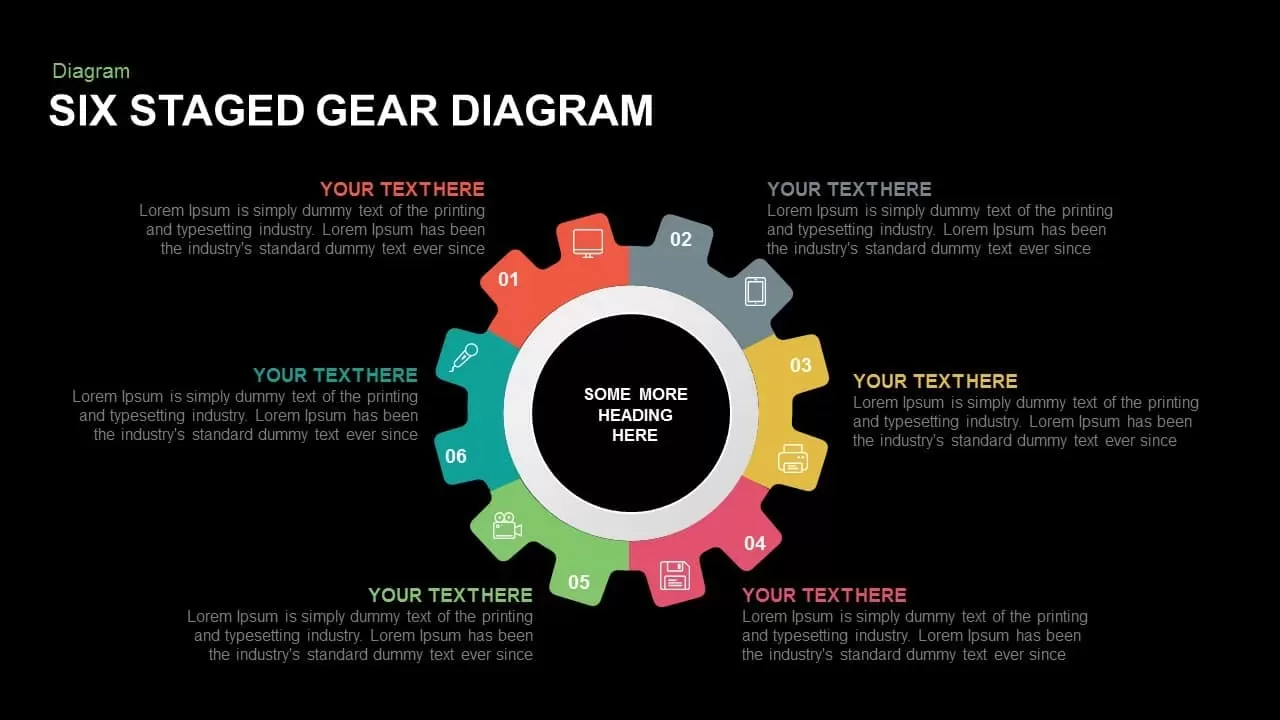
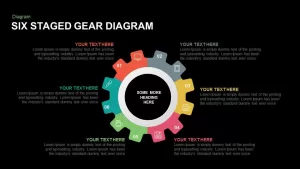
Leverage this modern six-stage gear diagram slide to visualize interlinked processes, operational workflows, and performance metrics with mechanical elegance and clarity. The design features a central hub for your core theme or KPI at its heart, surrounded by six colorful gear segments—labeled 01 through 06—each representing a distinct phase or milestone. Each gear segment includes a vector icon placeholder, a bold headline, and a concise text block for contextual details. Precision snap-to-grid alignment and optional drop shadows ensure a crisp, professional aesthetic, while the flat vector shapes allow for seamless resizing and color adjustments without loss of fidelity.
Built on master slides in both PowerPoint and Google Slides, every element is fully customizable: recolor gear segments to match your brand palette, swap icons from an embedded library of over 50 vector symbols, adjust segment sizes, or modify typography in seconds. Snap-to-grid guides and locked layout placeholders maintain consistent symmetry when duplicating, removing, or reordering segments. The modular framework supports expansion beyond six stages or contraction to highlight key insights, making it ideal for iterative reviews, strategic roadmaps, or operational dashboards.
Intuitive placeholders streamline content updates and facilitate collaborative editing, enabling distributed teams to refine presentations in real time. High-definition clarity across devices ensures your diagrams remain crisp in boardroom meetings, virtual workshops, or executive briefings. Use the central hub to anchor core objectives such as efficiency targets, growth initiatives, or innovation metrics, while leveraging the surrounding gears to illustrate supporting strategies and action plans. This gear diagram also incorporates optional data callouts and percentage markers to visualize performance variances, budget allocations, or project progress. With its balanced layout and modern visual metaphor, this slide transforms complex, multi-phase narratives into a coherent, data-driven story that engages stakeholders and drives strategic alignment.
Who is it for
Process consultants, project managers, operations leads, and business analysts will benefit from this slide when mapping multi-phase workflows, strategic roadmaps, or continuous improvement cycles in executive presentations and stakeholder workshops.
Other Uses
Beyond process visualization, repurpose this gear diagram for performance dashboards, KPI tracking, product development cycles, risk-management workflows, or change management reviews. Customize segments to highlight departmental functions, budget allocations, or training modules.
Login to download this file

Item ID
SB00608
Related Templates

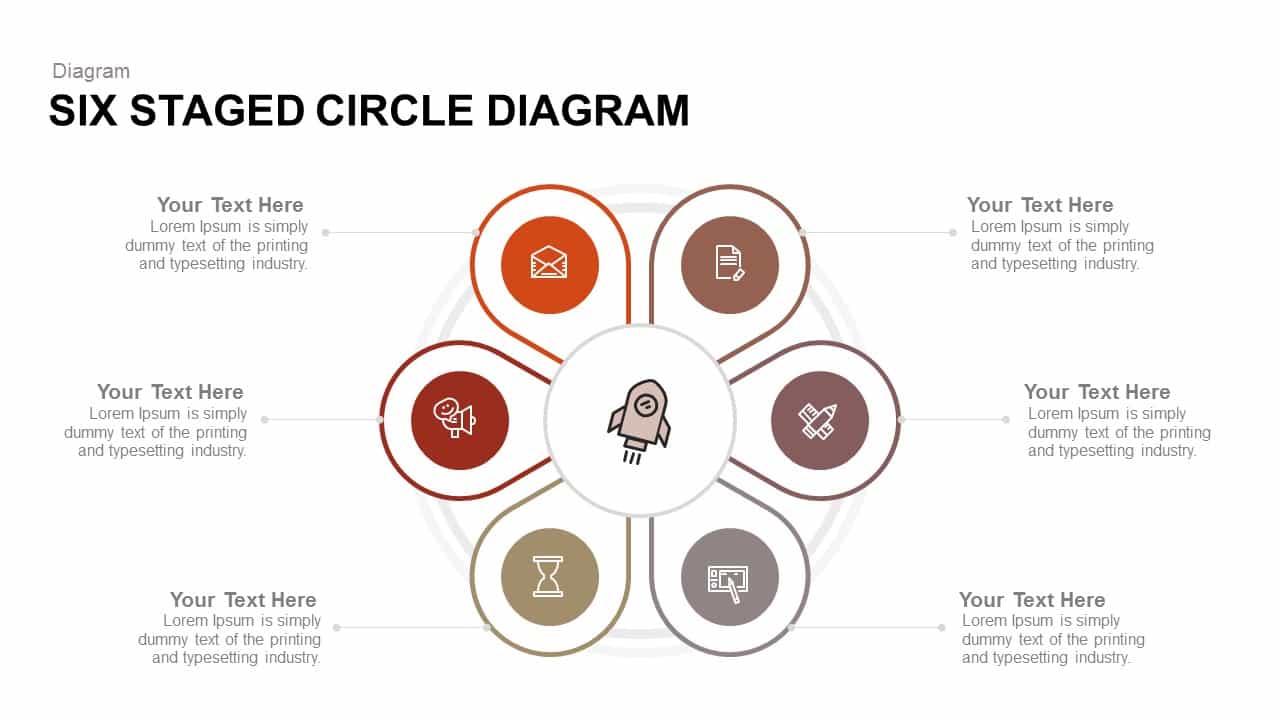
Six Staged Circle Diagram template for PowerPoint & Google Slides
Circular
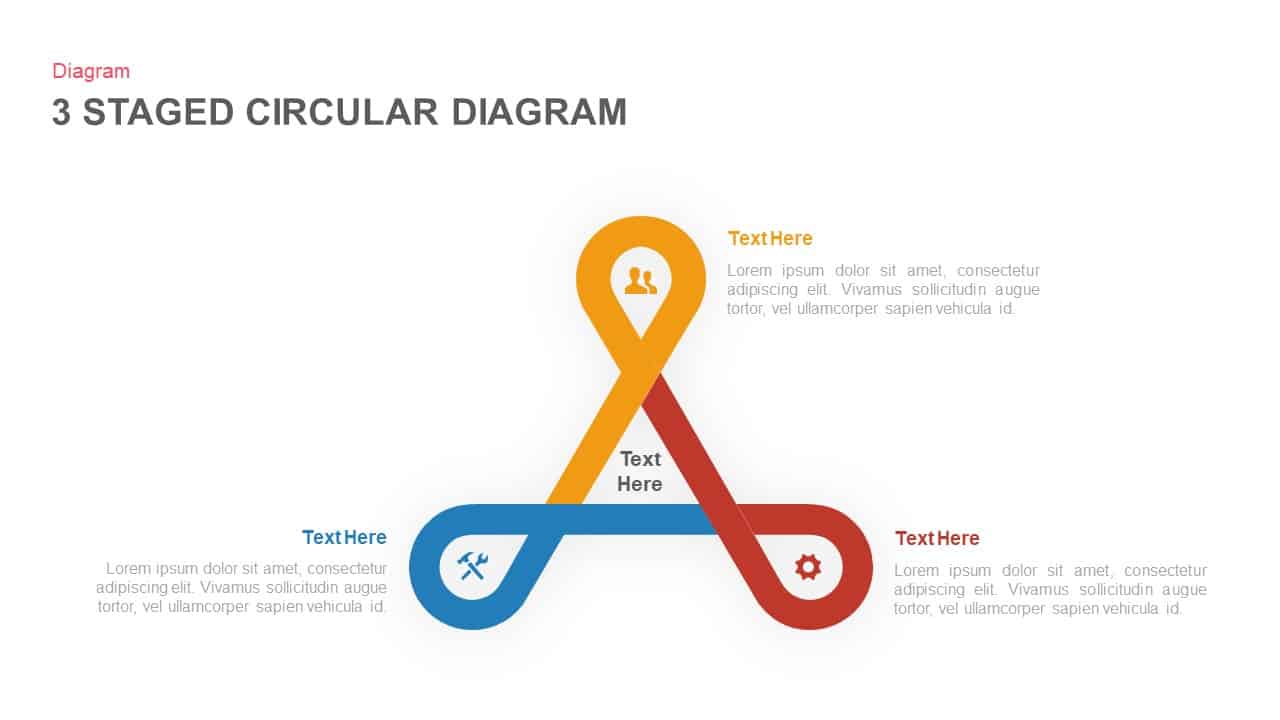
Three to Six Staged Circular Diagram Template for PowerPoint & Google Slides
Process
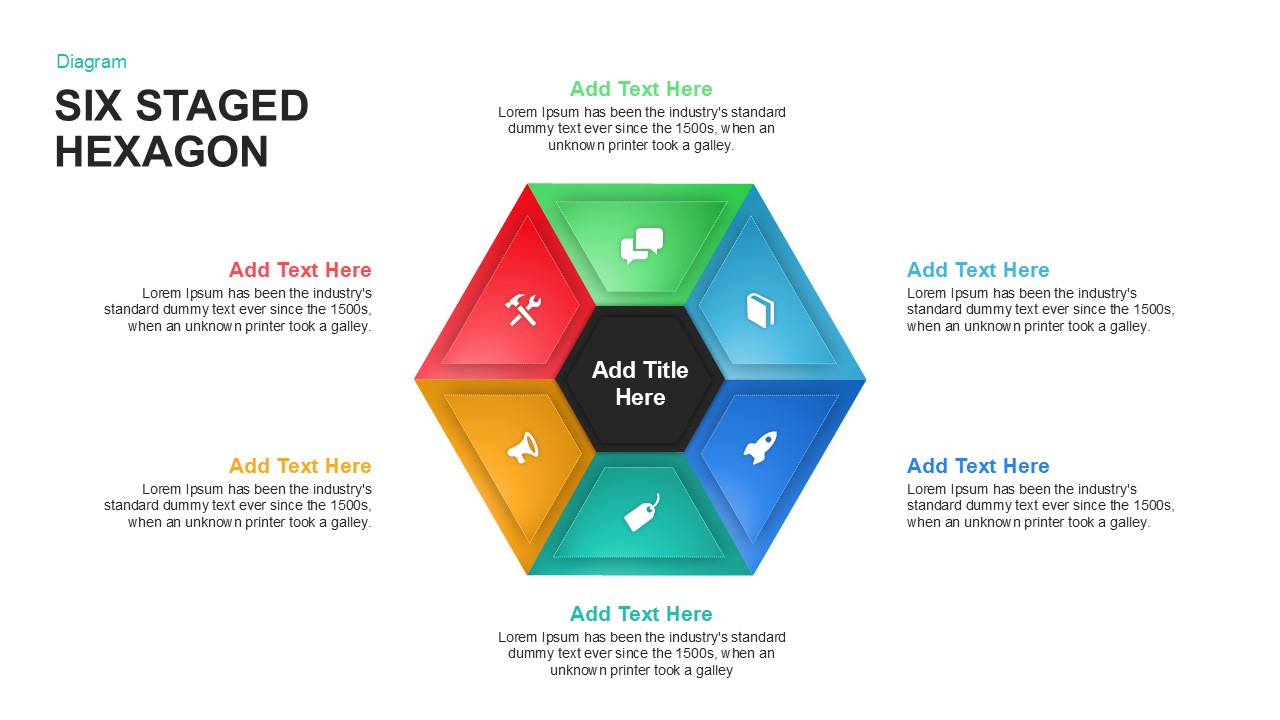
Six Staged Hexagon Diagram for PowerPoint & Google Slides
Process

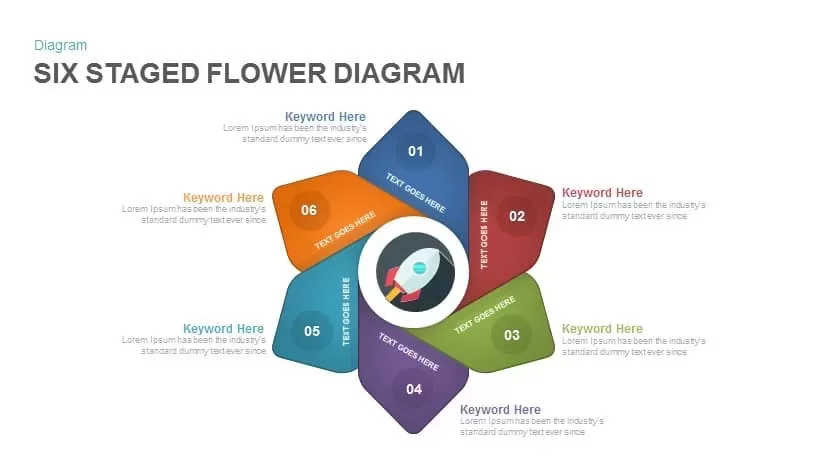
Six Staged Flower Diagram for PowerPoint & Google Slides
Process
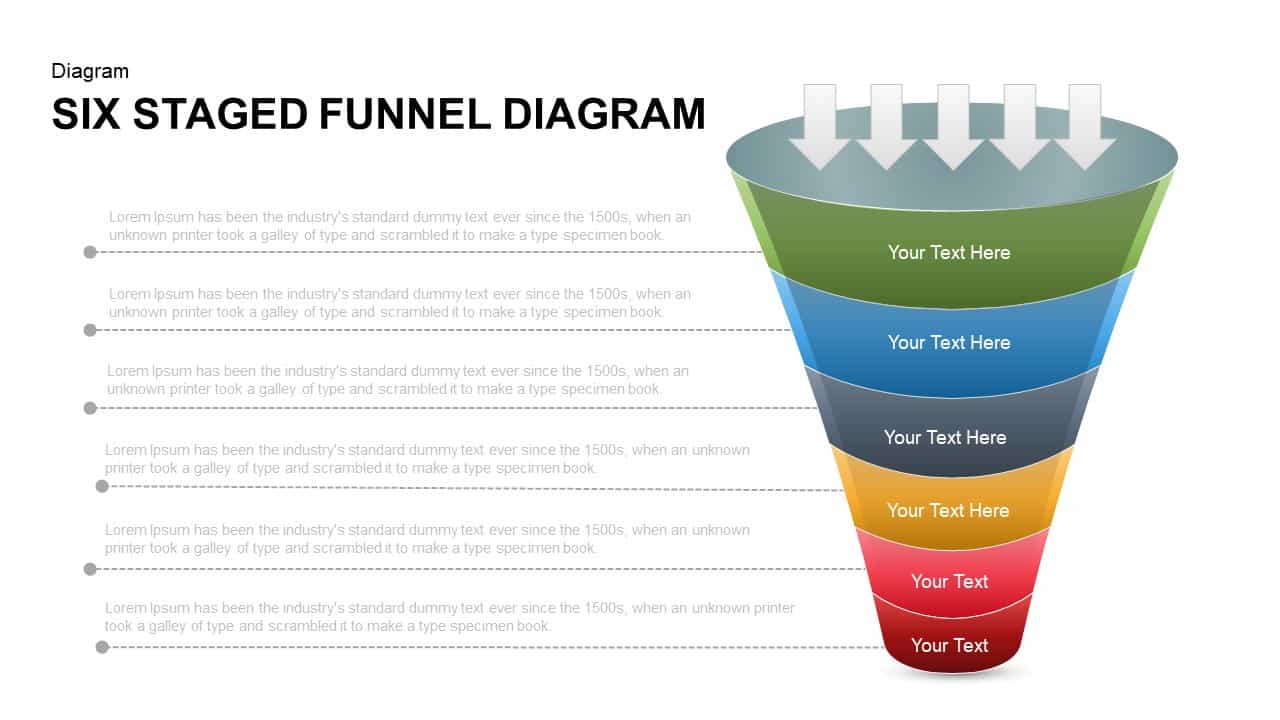
Six Staged Funnel Diagram for PowerPoint & Google Slides
Funnel
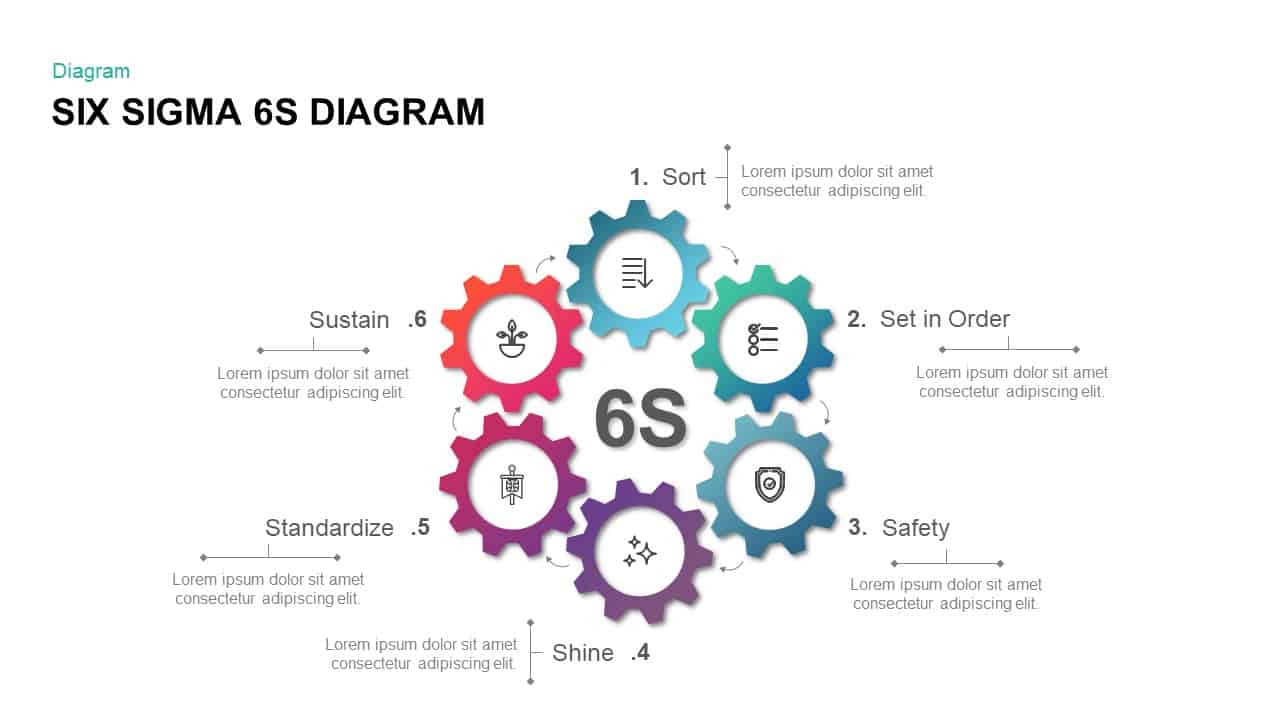
Six Sigma Gear Process Diagram Template for PowerPoint & Google Slides
Process
Six-Stage Gear Wheel Diagram Template for PowerPoint & Google Slides
Circular
Six-Option Gear Diagram Slide Template for PowerPoint & Google Slides
Circular
Six Colorful Gear Shapes Infographic Template for PowerPoint & Google Slides
Process
Free
Five-Staged Circle Sections Diagram Template for PowerPoint & Google Slides
Circular
Elegant Five Staged Banner Diagram Template for PowerPoint & Google Slides
Process

Eight Staged Diagram with Icons template for PowerPoint & Google Slides
Process
Free

Four-Staged Business Arrow Diagram Template for PowerPoint & Google Slides
Process
Four-Staged Puzzle Diagram Slide Template for PowerPoint & Google Slides
Process
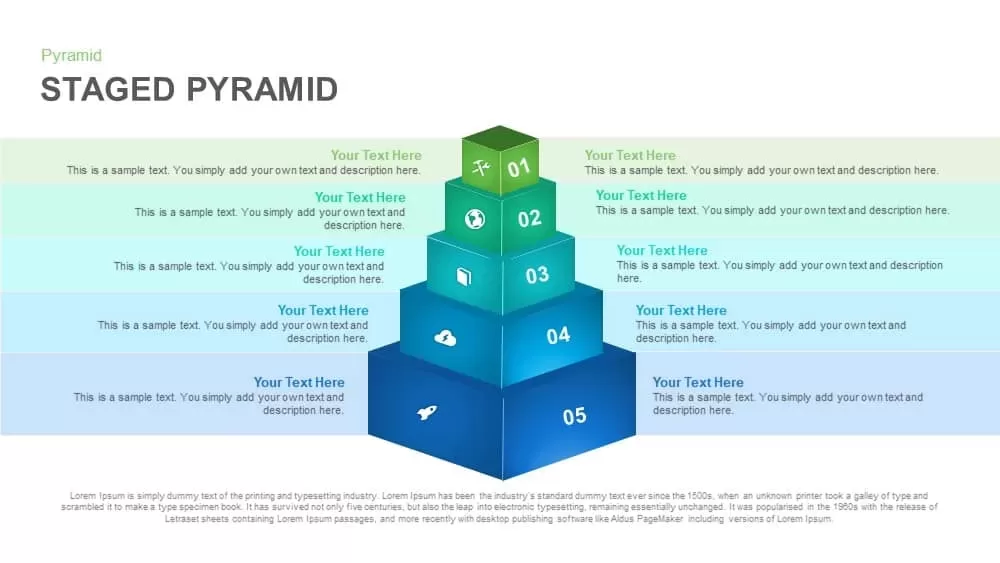
Five-Level Staged Pyramid Diagram Template for PowerPoint & Google Slides
Pyramid
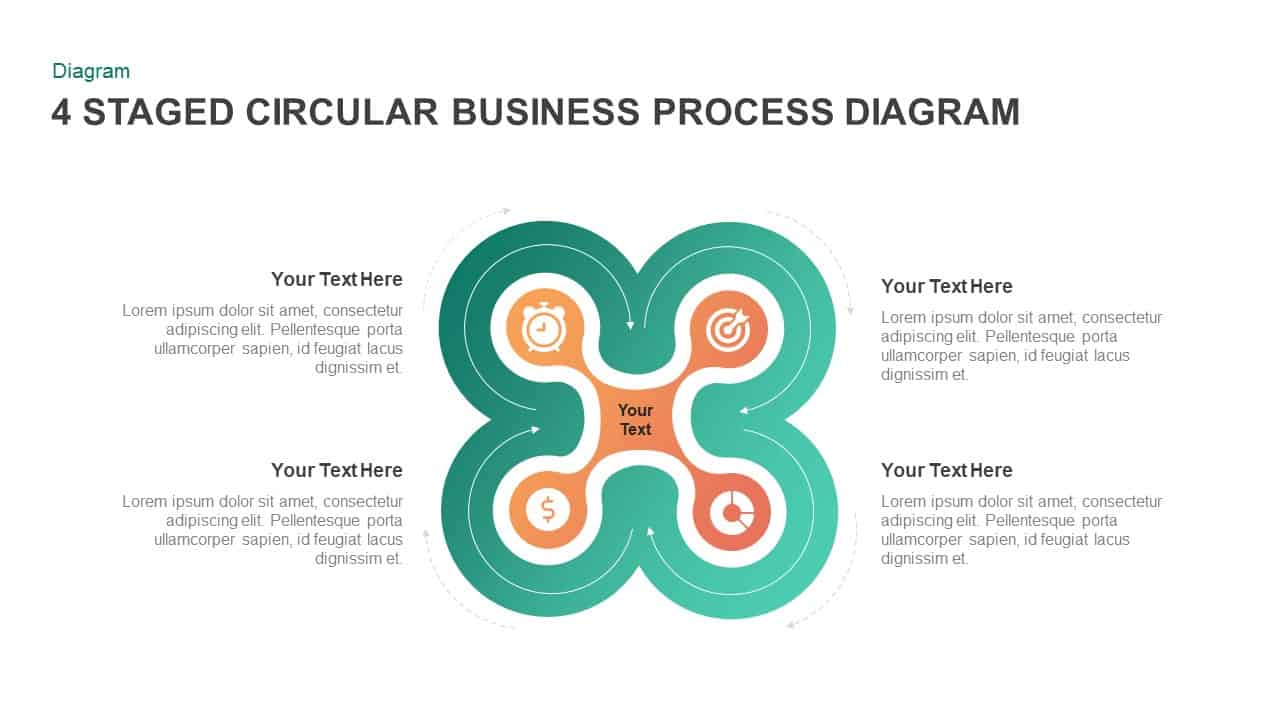
4 Staged Circular Business Process Diagram template for PowerPoint & Google Slides
Process

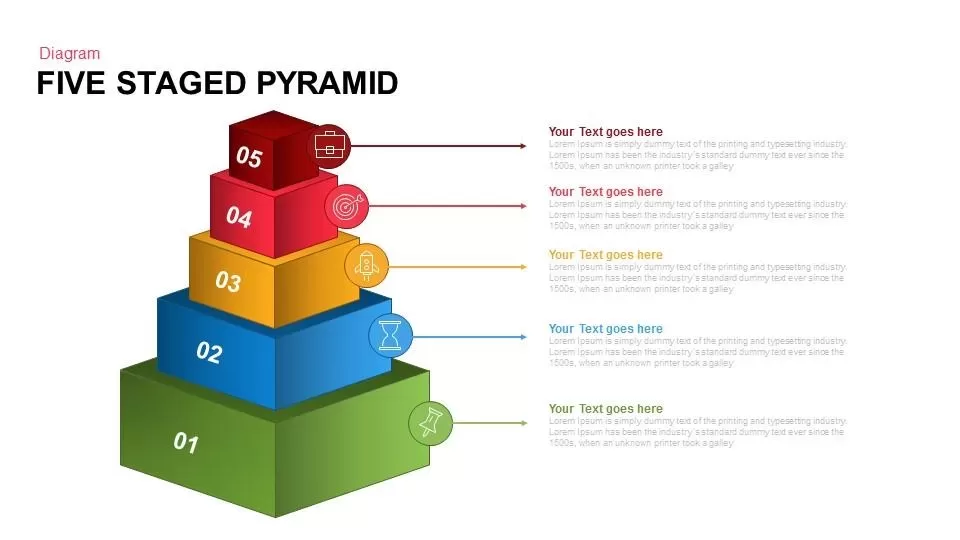
Five Staged Pyramid Diagram for PowerPoint & Google Slides
Pyramid

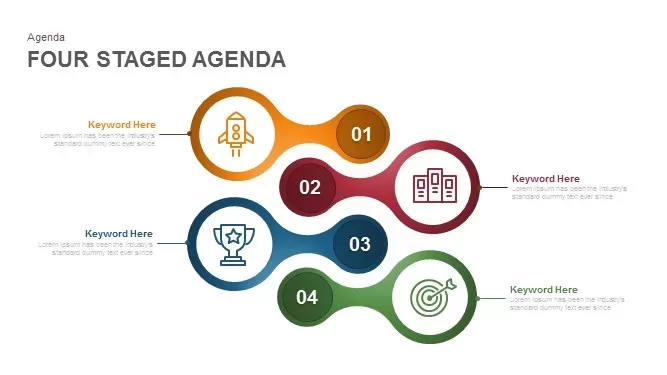
Four Staged Agenda Diagram for PowerPoint & Google Slides
Agenda
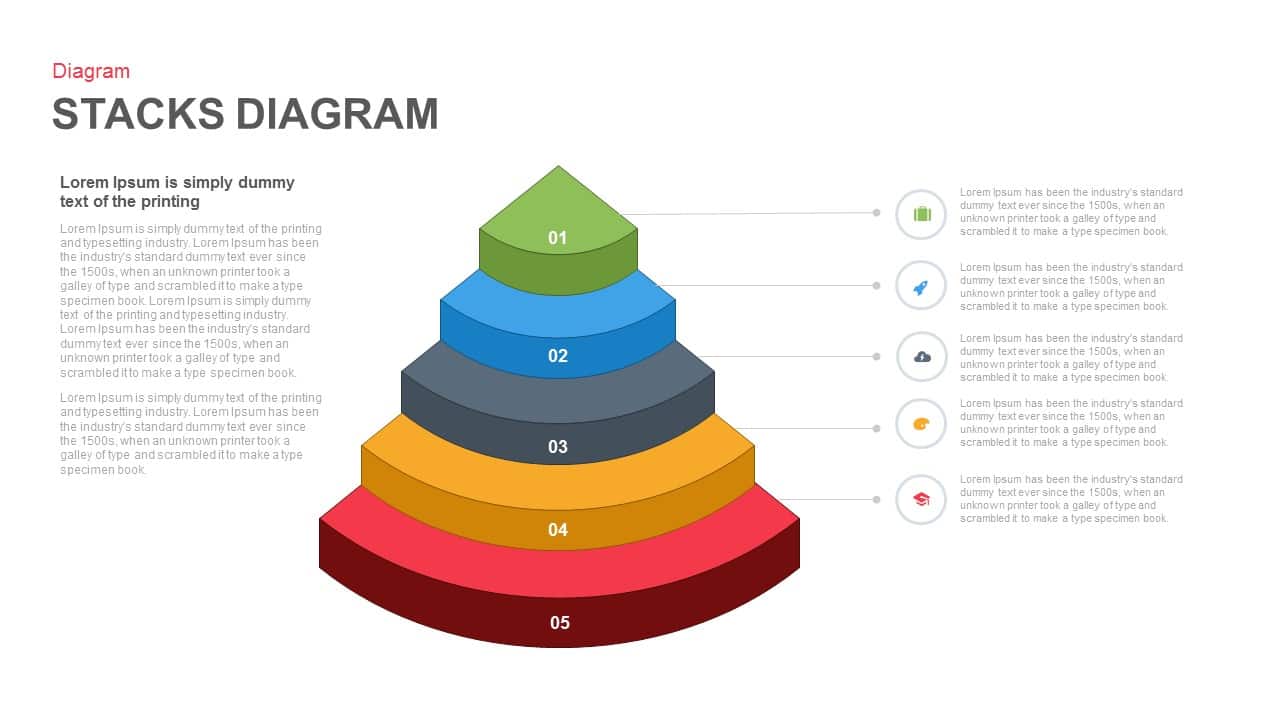
Five Staged Stacks Diagram for PowerPoint & Google Slides
Process
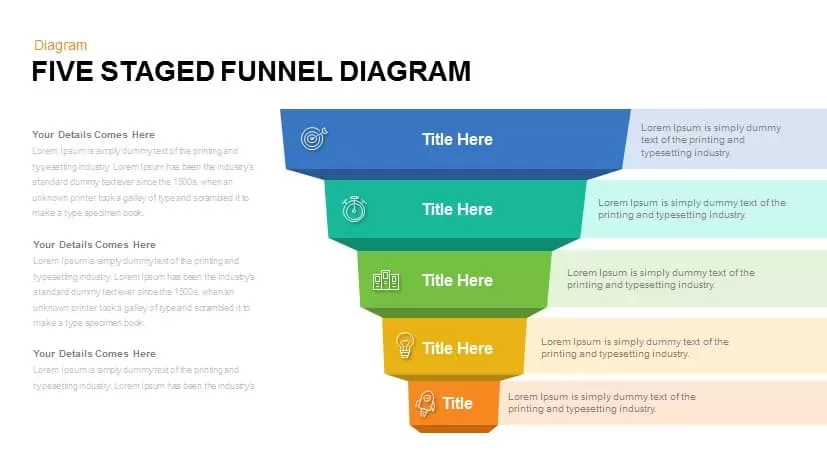
Five Staged Funnel Diagram for PowerPoint & Google Slides
Funnel
4 Staged Circular Business Process Diagram for PowerPoint & Google Slides
Process
Gear Process Diagram PowerPoint Template for PowerPoint & Google Slides
Process
Gear Process Diagram template for PowerPoint & Google Slides
Process
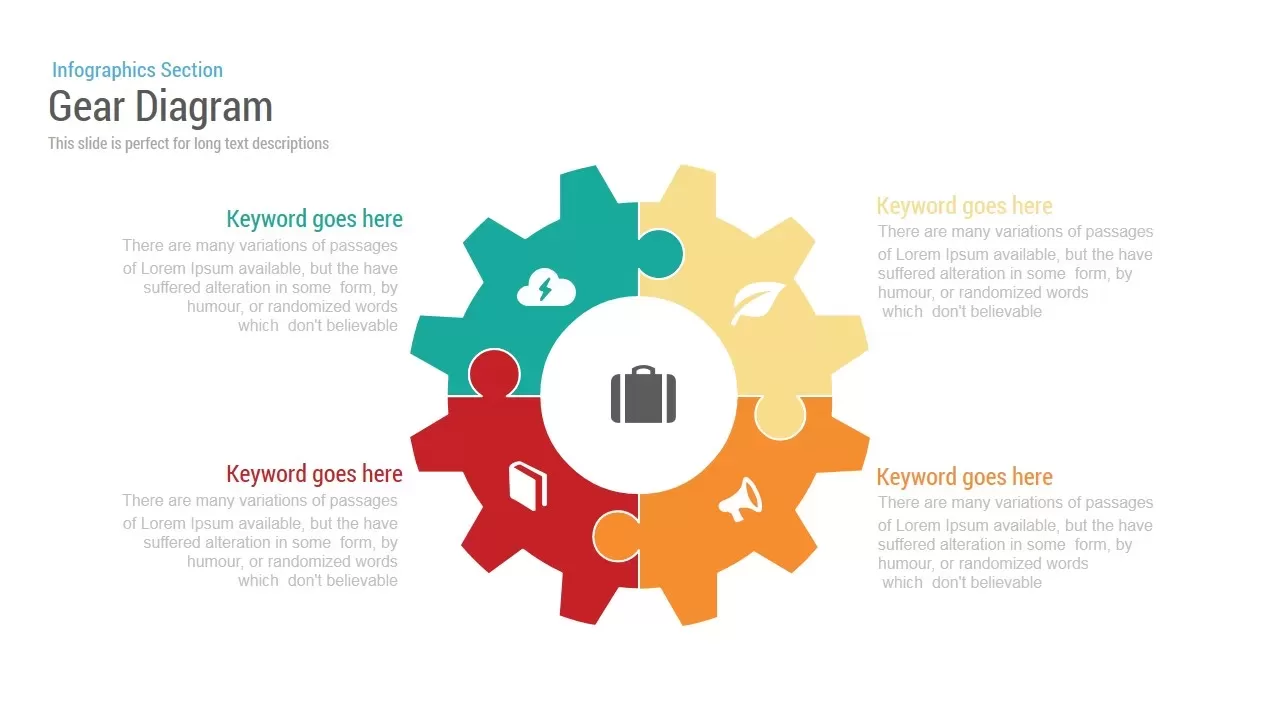
Gear Diagram template for PowerPoint & Google Slides
Process
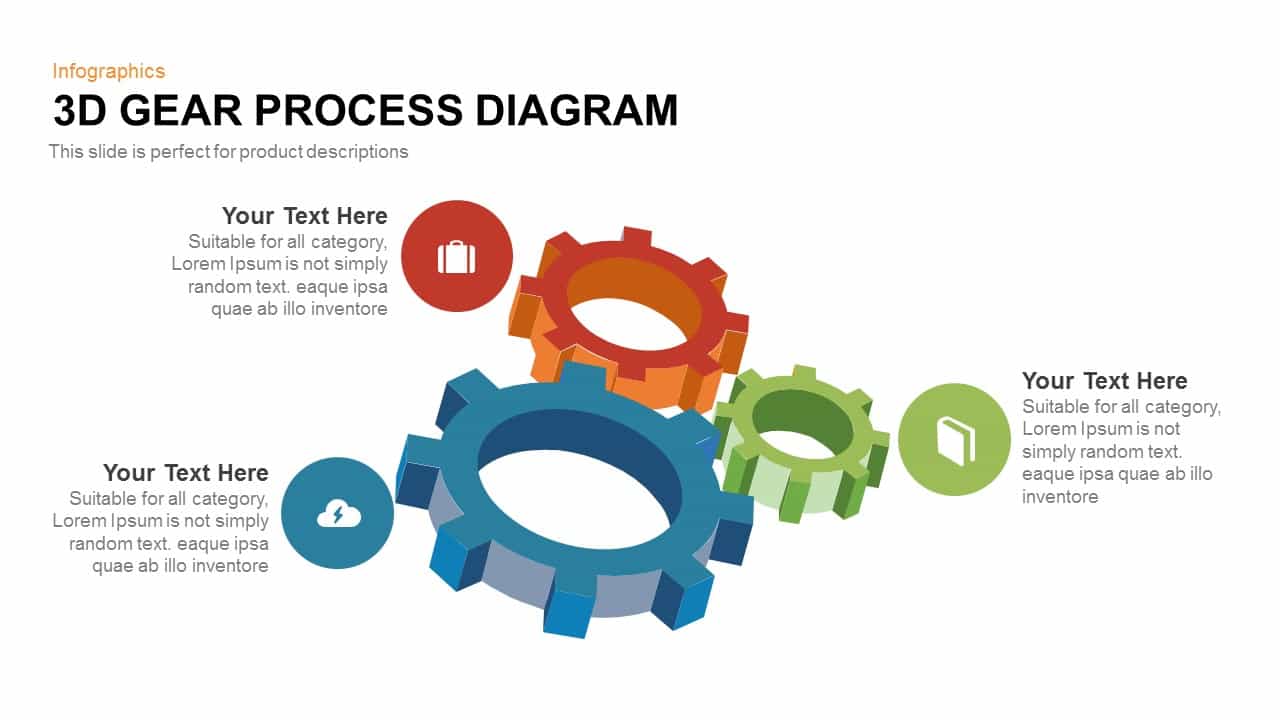
Professional 3D Gear Process Diagram Template for PowerPoint & Google Slides
Process
Gear Process Phase Diagram template for PowerPoint & Google Slides
Process

Five-Step Gear Process Diagram Template for PowerPoint & Google Slides
Process
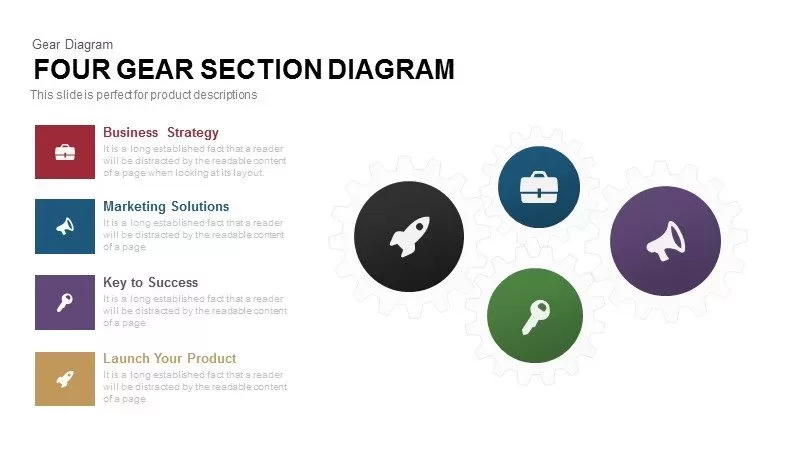
Four Gear Section Diagram Template for PowerPoint & Google Slides
Circular

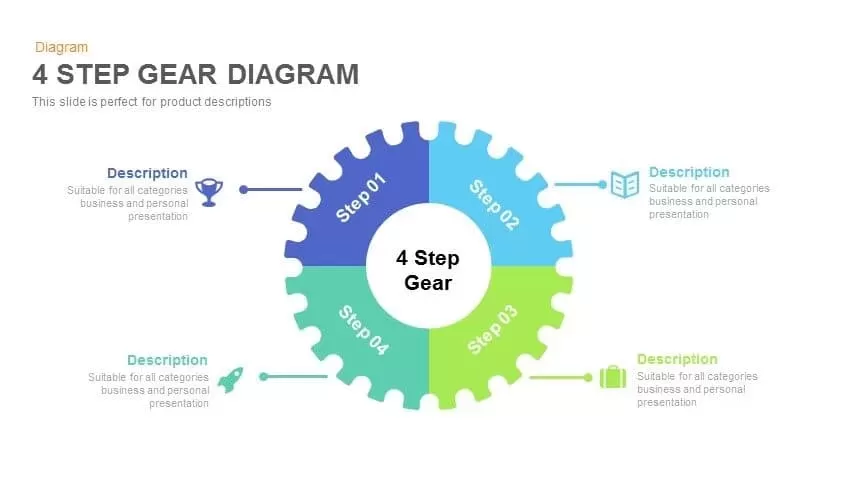
4 Step Gear Diagram Template for PowerPoint & Google Slides
Process
Dynamic 4 Gear Process Diagram Template for PowerPoint & Google Slides
Process
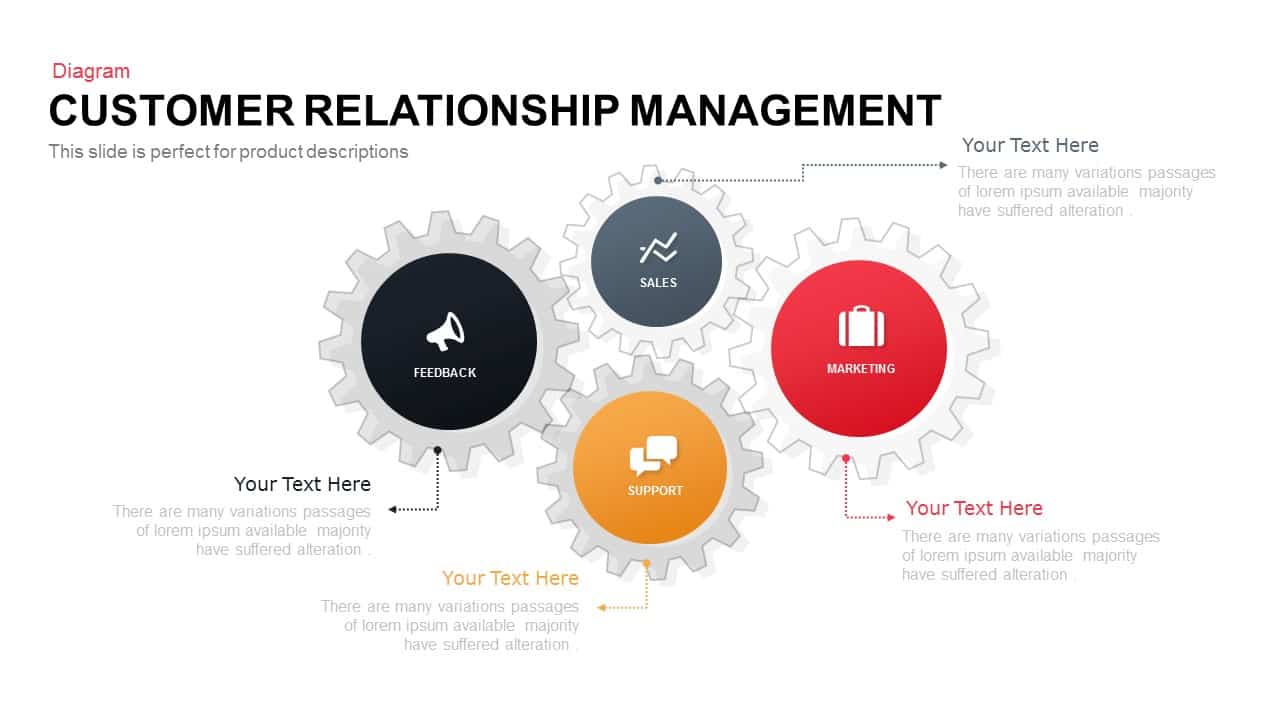
Colorful Modern CRM Gear Diagram Template for PowerPoint & Google Slides
Customer Experience
Gear Pie Diagram Data Visualization Template for PowerPoint & Google Slides
Pie/Donut
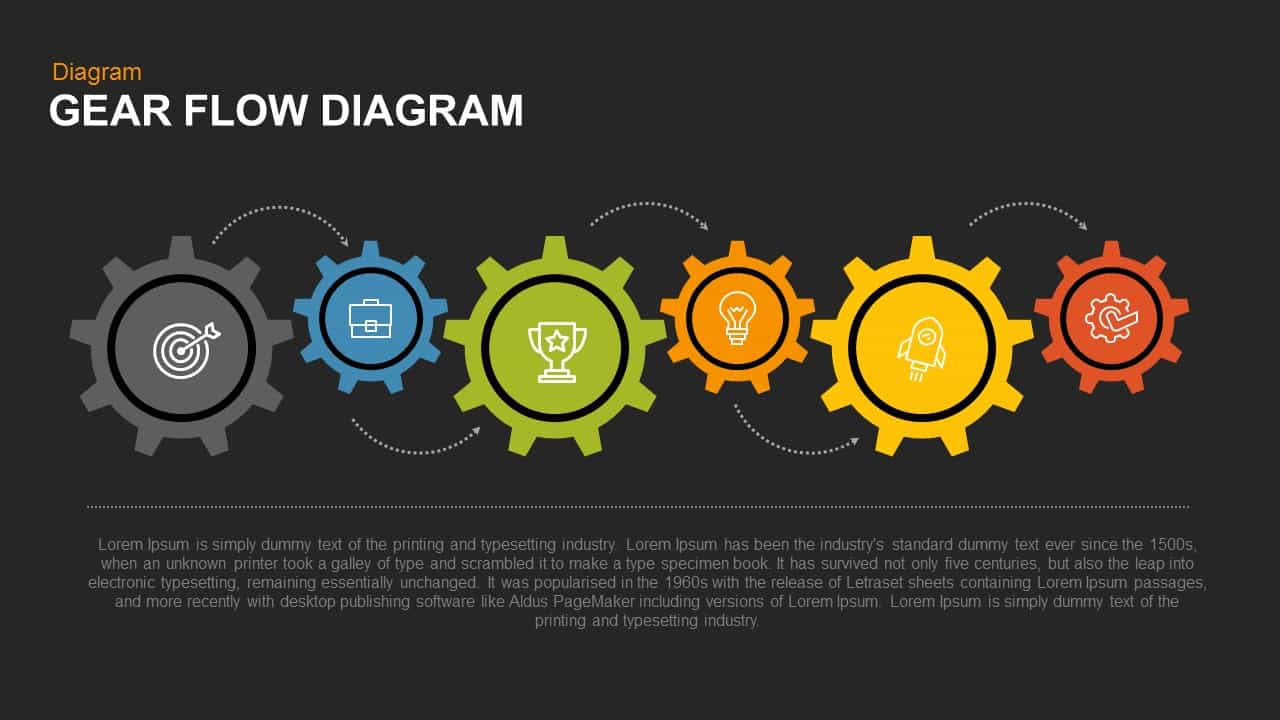
Gear Flow Diagram template for PowerPoint & Google Slides
Process
Modern Four Stage Gear Diagram Template for PowerPoint & Google Slides
Process
Artificial Intelligence Gear Diagram Template for PowerPoint & Google Slides
Process
Marketing Risk Management Gear Diagram Template for PowerPoint & Google Slides
Risk Management
SWOT Analysis Gear Diagram Slide Template for PowerPoint & Google Slides
SWOT
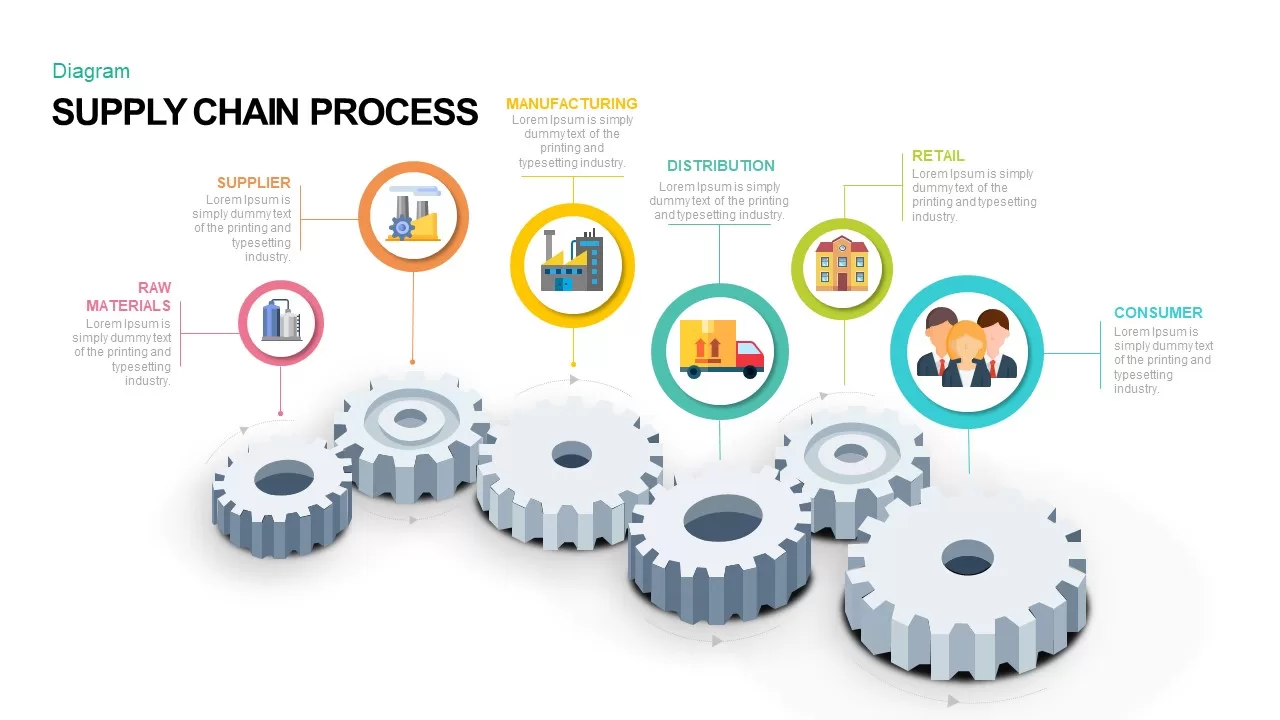
Supply Chain Process Gear Diagram Template for PowerPoint & Google Slides
Process
Four-Stage Gear Process Diagram Template for PowerPoint & Google Slides
Process
5-Stage Gear Process Flow Diagram Template for PowerPoint & Google Slides
Process
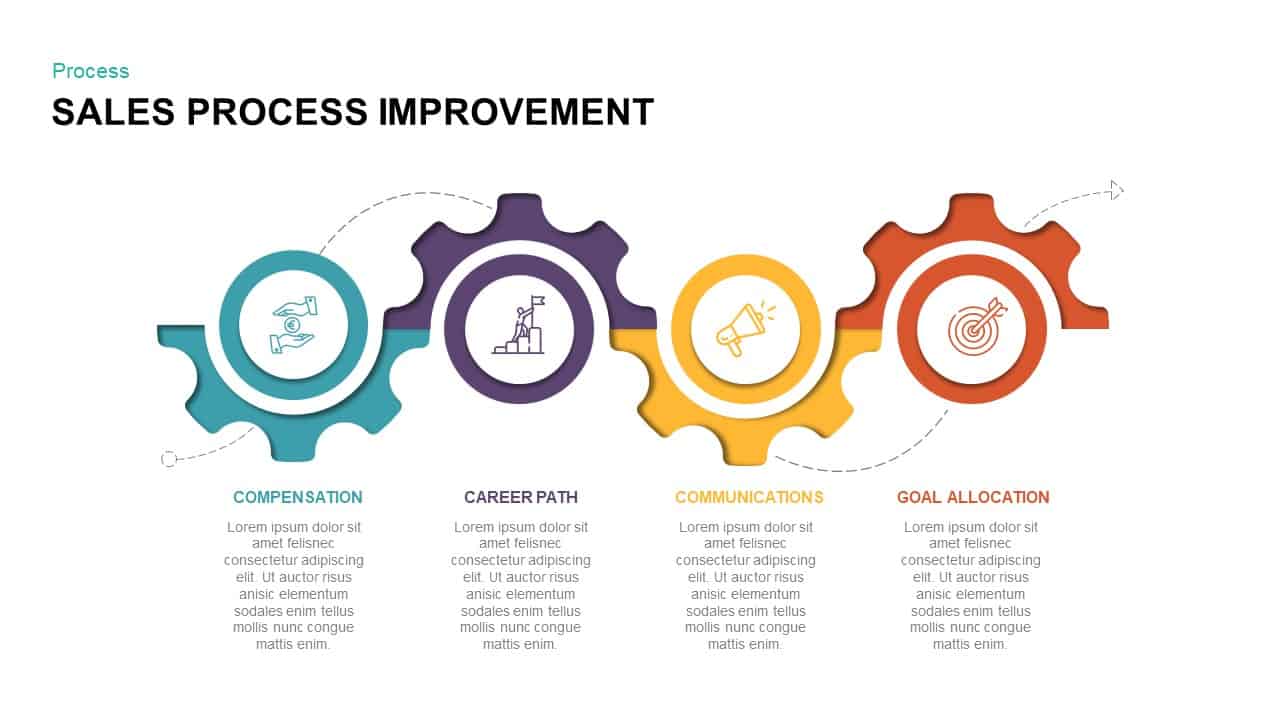
Sales Process Improvement Gear Diagram Template for PowerPoint & Google Slides
Process
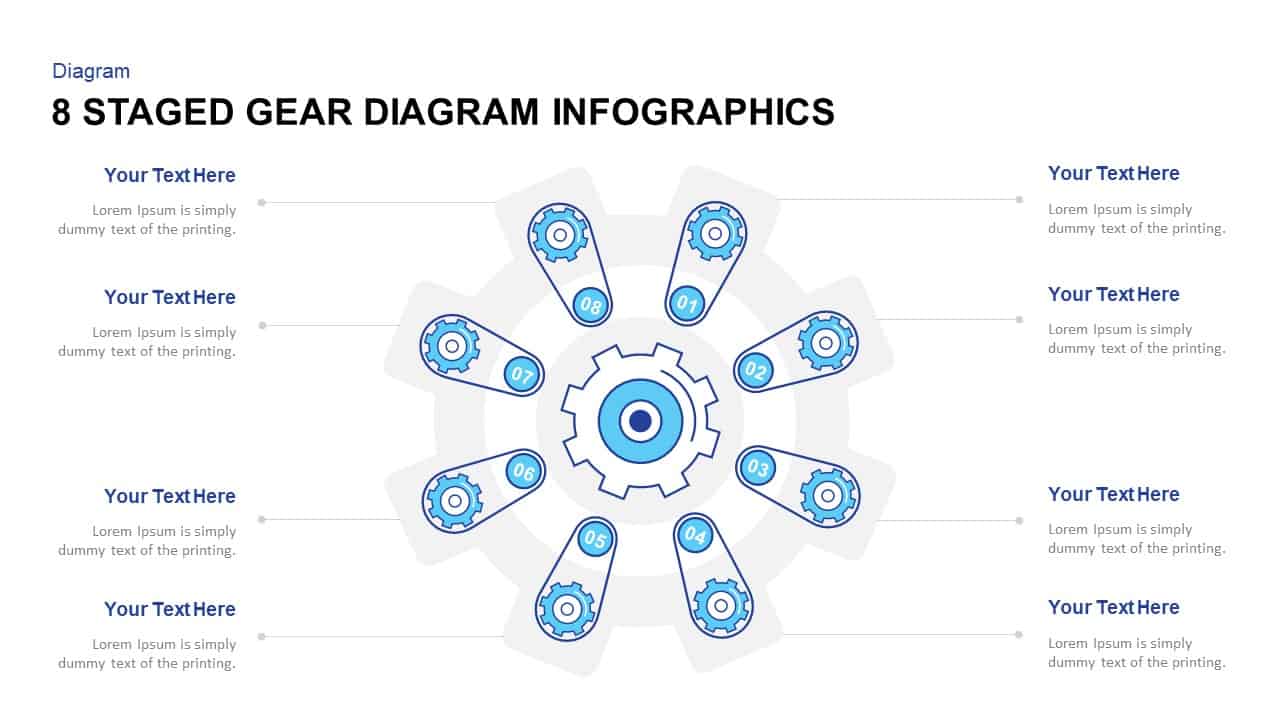
8-Step Circular Gear Infographic Diagram Template for PowerPoint & Google Slides
Circular
Eight-Stage Gear Diagram Process Template for PowerPoint & Google Slides
Process
Modern Gear Venn Diagram Infographic Template for PowerPoint & Google Slides
Comparison
6-Part Circular Gear Infographic Diagram Template for PowerPoint & Google Slides
Process

Three-Step Triangular Gear Diagram Template for PowerPoint & Google Slides
Process
Dynamic Gear Diagram Infographics Template for PowerPoint & Google Slides
Process
Gear Process Diagram Template for PowerPoint & Google Slides
Process
Gear Process Diagram Template for PowerPoint & Google Slides
Process
Cloud Gear Automation Diagram Template for PowerPoint & Google Slides
Cloud Computing
Gear Process Diagram for PowerPoint & Google Slides
Process
8-Step Circular Gear Infographics Diagram for PowerPoint & Google Slides
Process
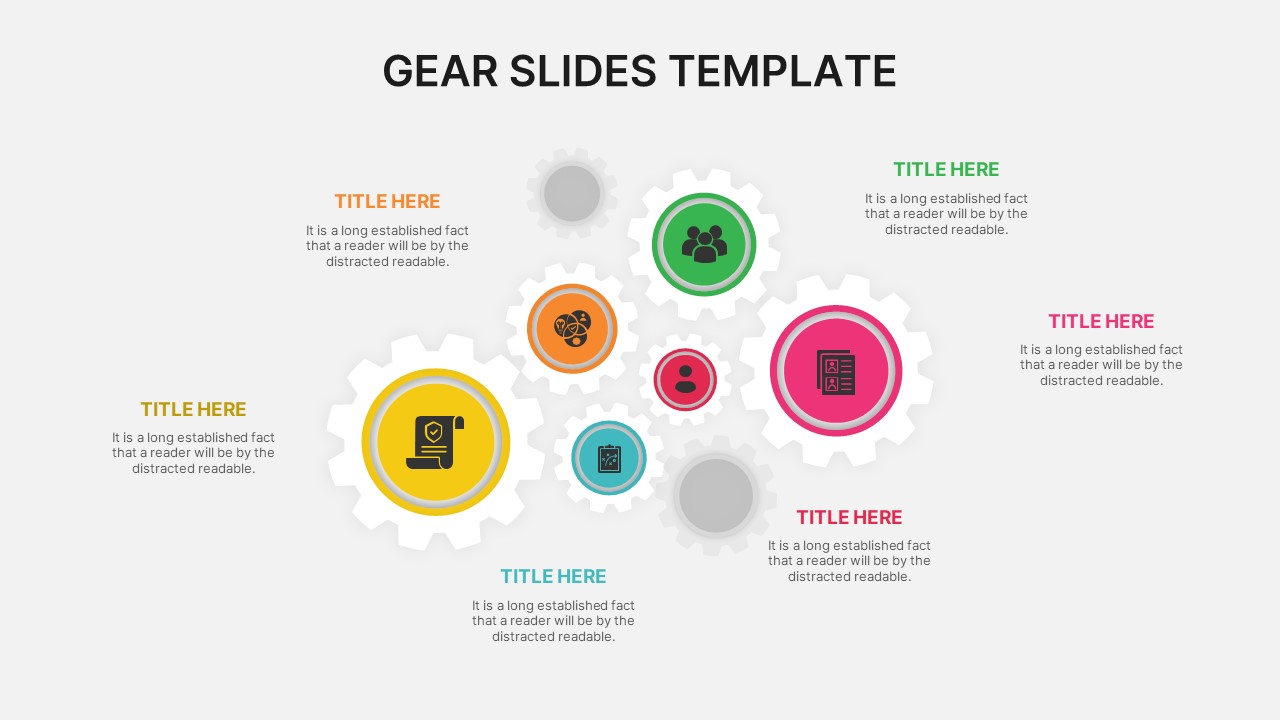
Gear Slides for PowerPoint & Google Slides
Infographics
Four-Staged Textbox Infographic Template for PowerPoint & Google Slides
Process
Four Staged Inward Arrows Infographic Template for PowerPoint & Google Slides
Arrow
Four Staged Road Map template for PowerPoint & Google Slides
Roadmap
Three Staged Business Workflow template for PowerPoint & Google Slides
Business
4 Staged Business Arrows Infographic Template for PowerPoint & Google Slides
Arrow
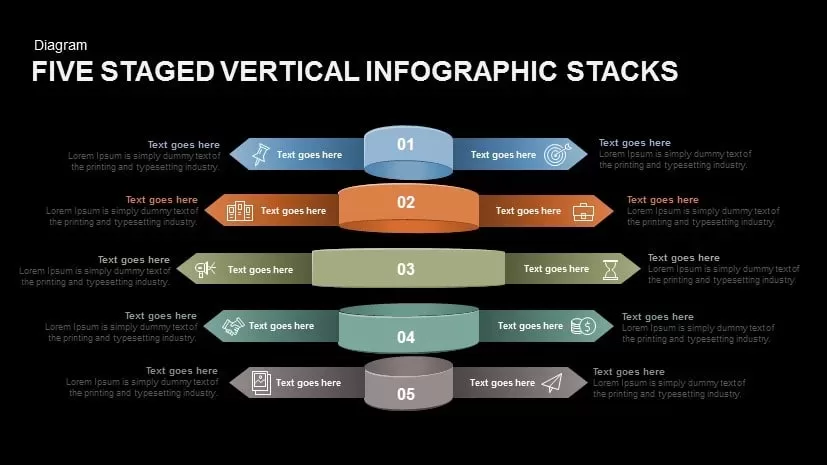
Five Staged Vertical Infographic Stacks for PowerPoint & Google Slides
Process
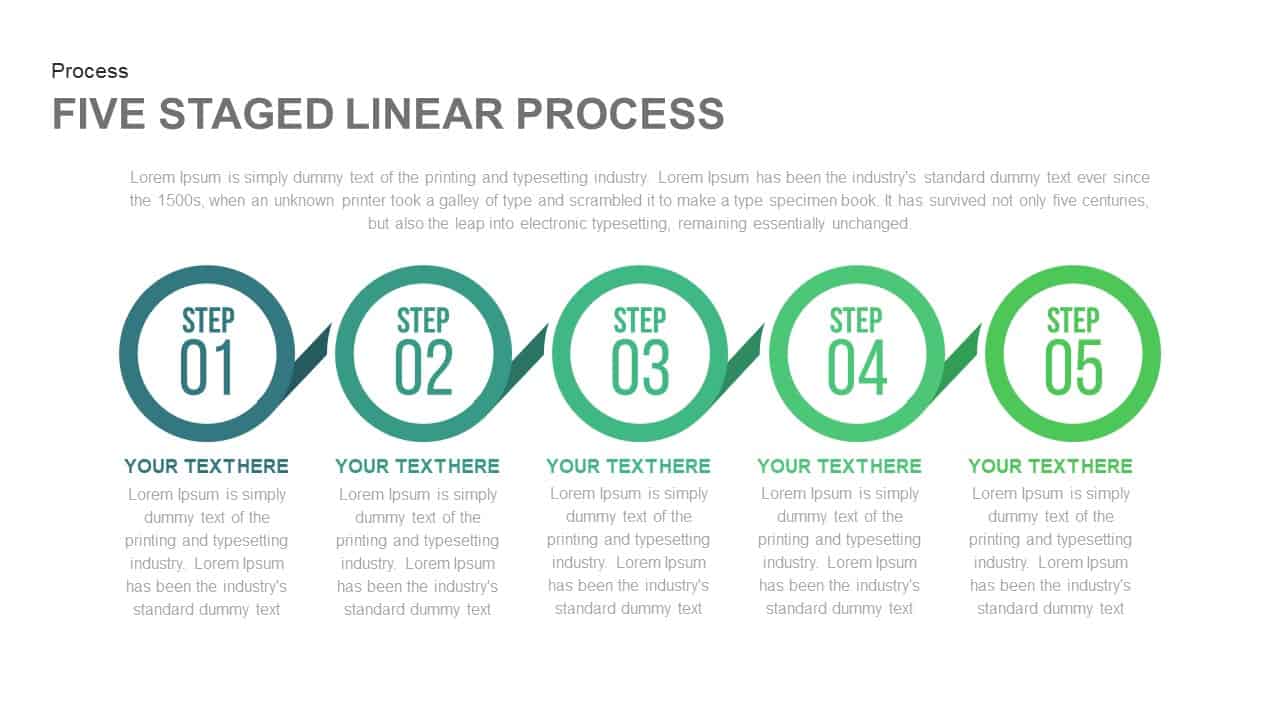
Five Staged Linear Process for PowerPoint & Google Slides
Process
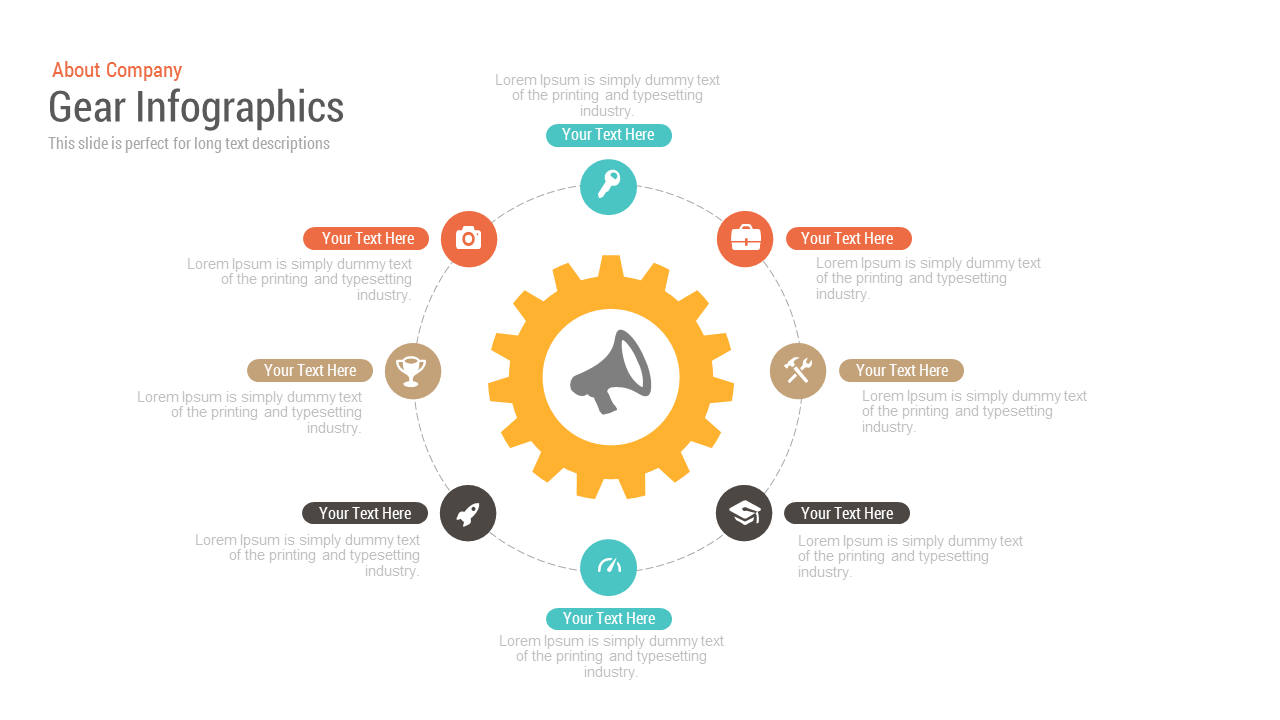
Free Gear Infographics template for PowerPoint & Google Slides
Process
Free
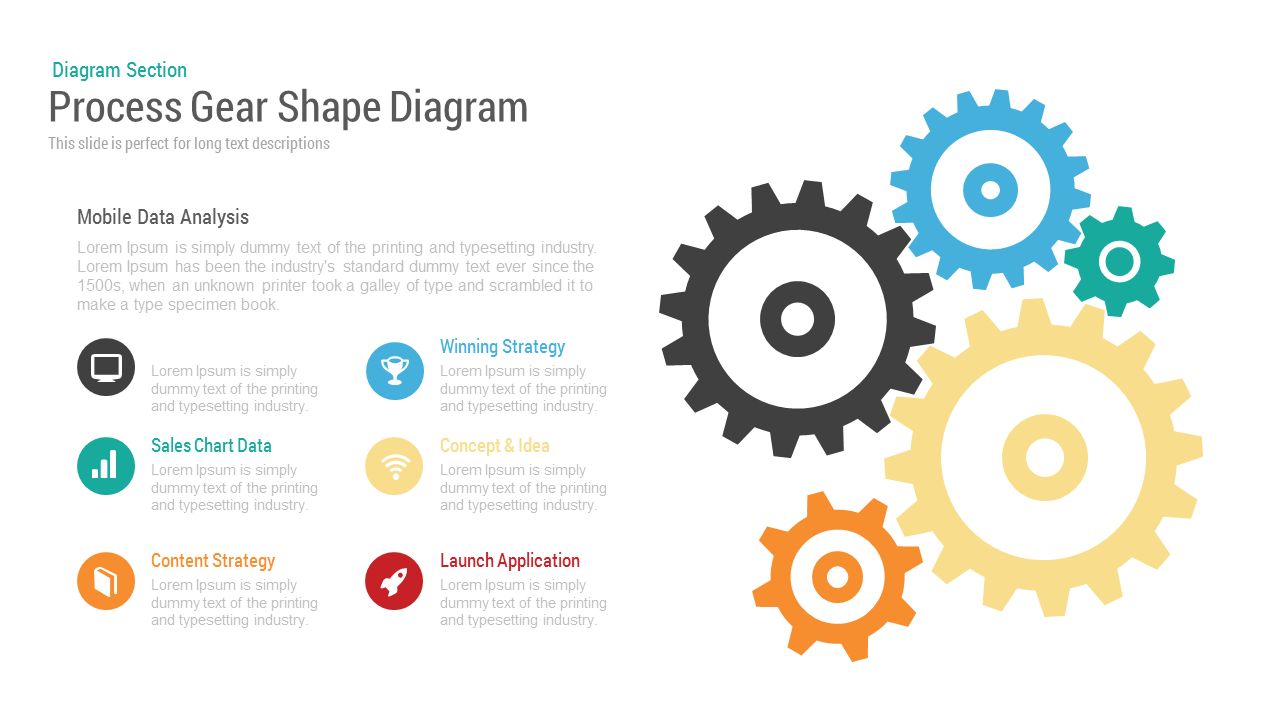
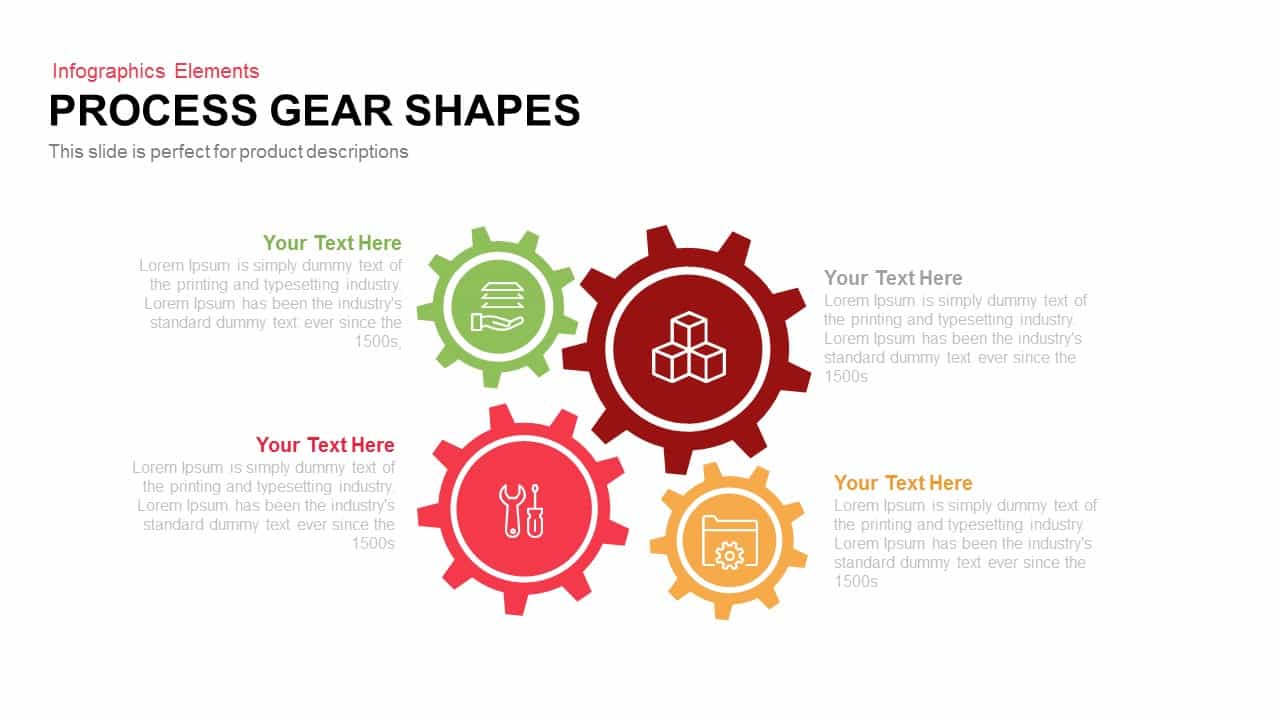
Process Gear Shapes Template for PowerPoint & Google Slides
Infographics
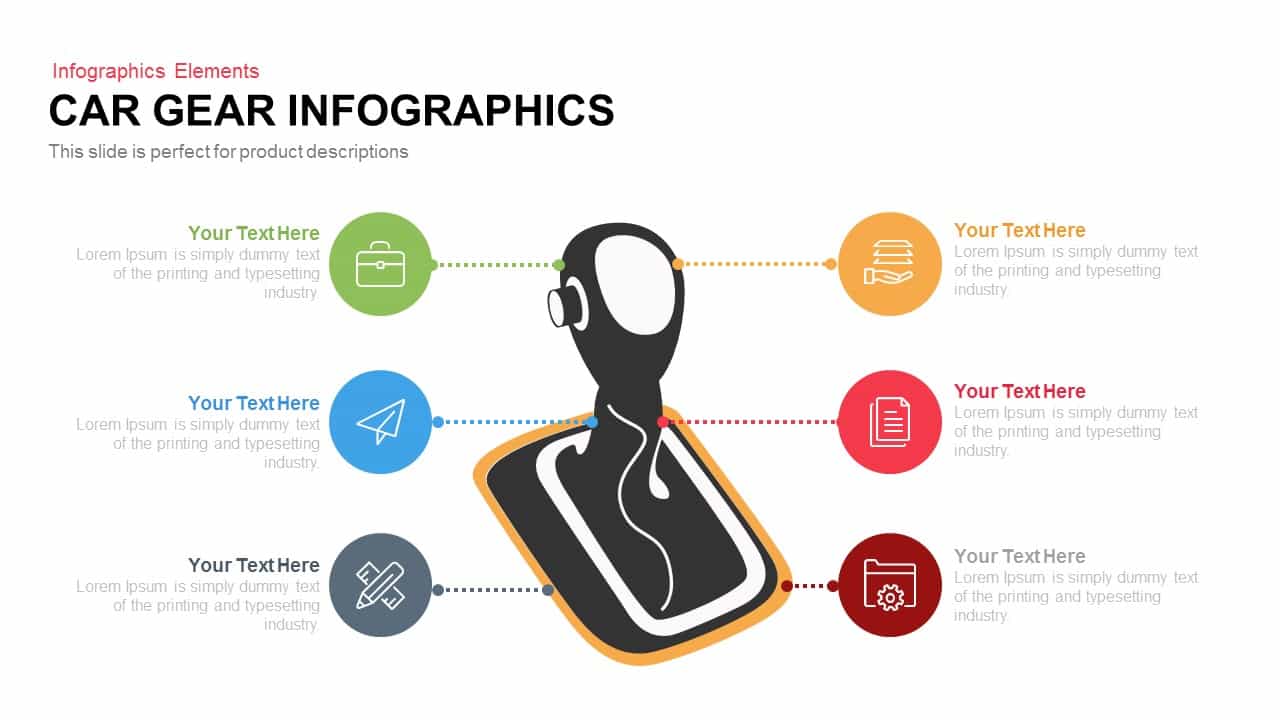
Car Gear Infographics Template for PowerPoint & Google Slides
Infographics
Brain Gear Hub-and-Spoke Infographics template for PowerPoint & Google Slides
Org Chart

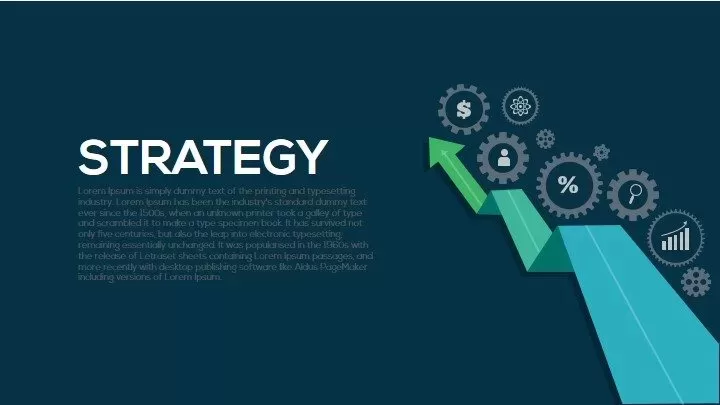
Strategy Arrow and Gear Icons Template for PowerPoint & Google Slides
Infographics
Support Services Gear Infographic Template for PowerPoint & Google Slides
Business
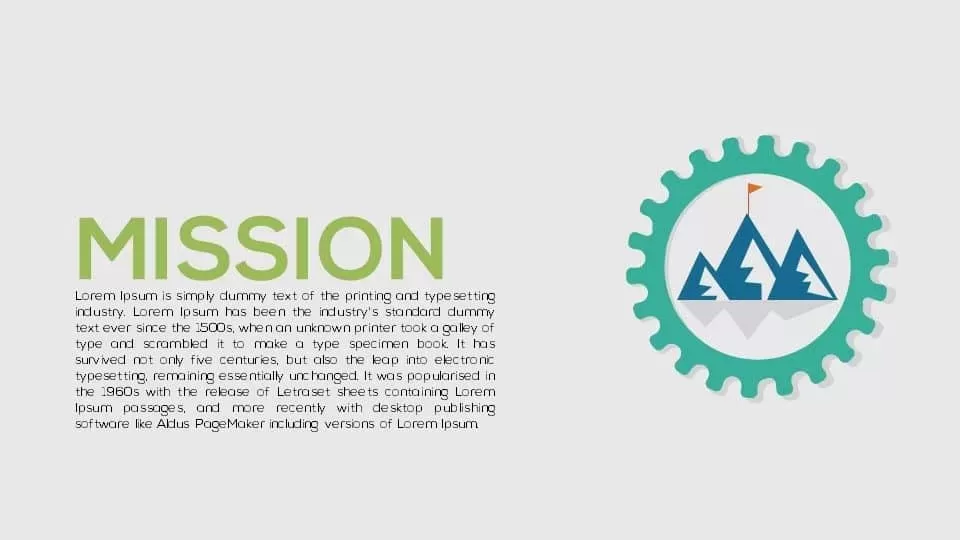
Corporate Mission Statement Gear Slide Template for PowerPoint & Google Slides
Vision and Mission
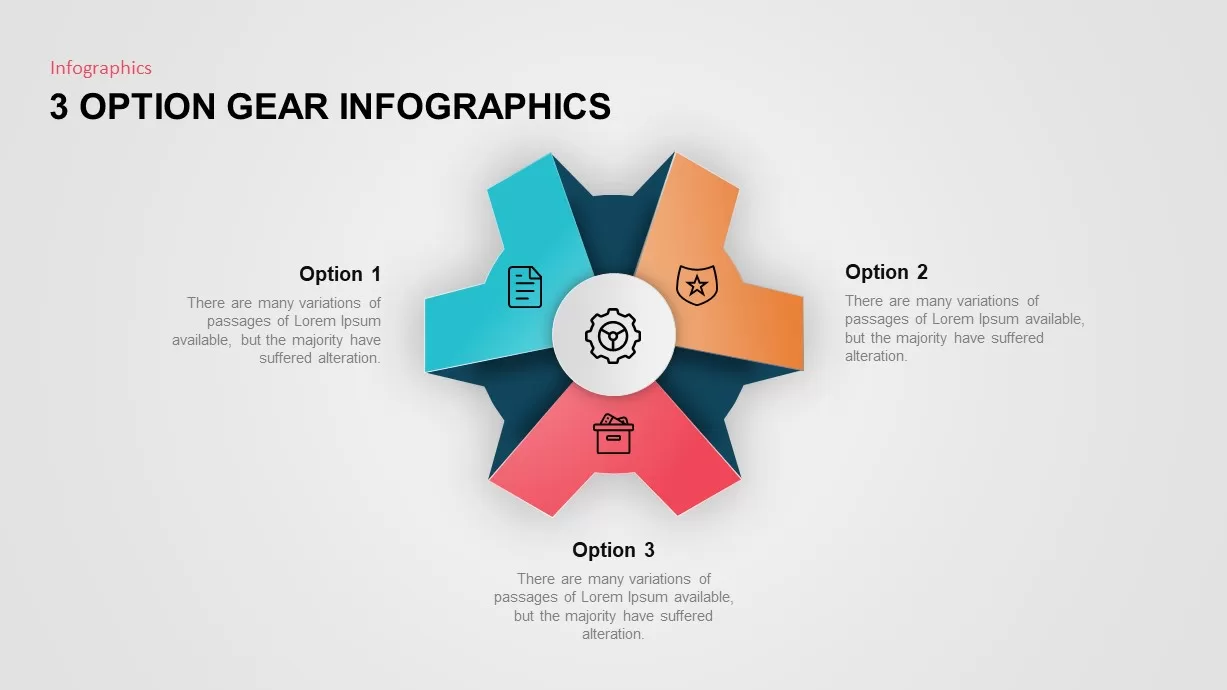
Three-Option Gear Infographic Pro Template for PowerPoint & Google Slides
Process
Three-Phase Planning Gear Infographic Template for PowerPoint & Google Slides
Process
3, 4, and 5 Step Gear Infographics Template for PowerPoint & Google Slides
Process
Animated Gear Slide for Process Mapping Template for PowerPoint & Google Slides
Process
Animated Multi-Gear Cluster Infographic Template for PowerPoint & Google Slides
Process
Dynamic Four-Step Gear Process Template for PowerPoint & Google Slides
Process
Six Section Diagram template for PowerPoint & Google Slides
Circular
Six Arrow Radial Process Diagram template for PowerPoint & Google Slides
Infographics
Six Step Creative Circular Diagram Template for PowerPoint & Google Slides
Circular
Six Stage Zigzag Process Diagram Template for PowerPoint & Google Slides
Process
Six Section Circular Infographic Diagram Template for PowerPoint & Google Slides
Circular
Roadmap Six-Step Process Diagram Template for PowerPoint & Google Slides
Roadmap
Six-Stage Circular Cycle Diagram Template for PowerPoint & Google Slides
Process
Editable Six-Step Bubble Process Diagram Template for PowerPoint & Google Slides
Process
Free Six Stage Bubble Process Diagram template for PowerPoint & Google Slides
Process
Free
Six-Section Star Infographic Diagram Template for PowerPoint & Google Slides
Circular
Six-Step Two-Sided Arrow Diagram Template for PowerPoint & Google Slides
Process
Six-Step Hexagonal Diagram Slide Template for PowerPoint & Google Slides
Circular
Six-Stage Circle Process Diagram Template for PowerPoint & Google Slides
Process
Six-Step Vertical Process Diagram Template for PowerPoint & Google Slides
Process
Six-Stage Circular Diagram Process Template for PowerPoint & Google Slides
Circular
Six-Stage Clockwise Circular Diagram Template for PowerPoint & Google Slides
Circular
Six Stage Agenda Timeline Diagram template for PowerPoint & Google Slides
Agenda
Six-Step Infinity Loop Process Diagram Template for PowerPoint & Google Slides
Process
Six Sigma 6S Process Infographic Diagram Template for PowerPoint & Google Slides
Process
Six-Circle Process Infographic Diagram Template for PowerPoint & Google Slides
Circular
Circular 3D Cube Six-Segment Diagram Template for PowerPoint & Google Slides
Infographics
Stacked Cubes Pyramid Six-Option Diagram Template for PowerPoint & Google Slides
Pyramid
Six-Step Business Analysis Diagram template for PowerPoint & Google Slides
Circular
Six-Step Colorful Flywheel Diagram Template for PowerPoint & Google Slides
Circular
3D Six-Level Pyramid Diagram Infographic Template for PowerPoint & Google Slides
Pyramid
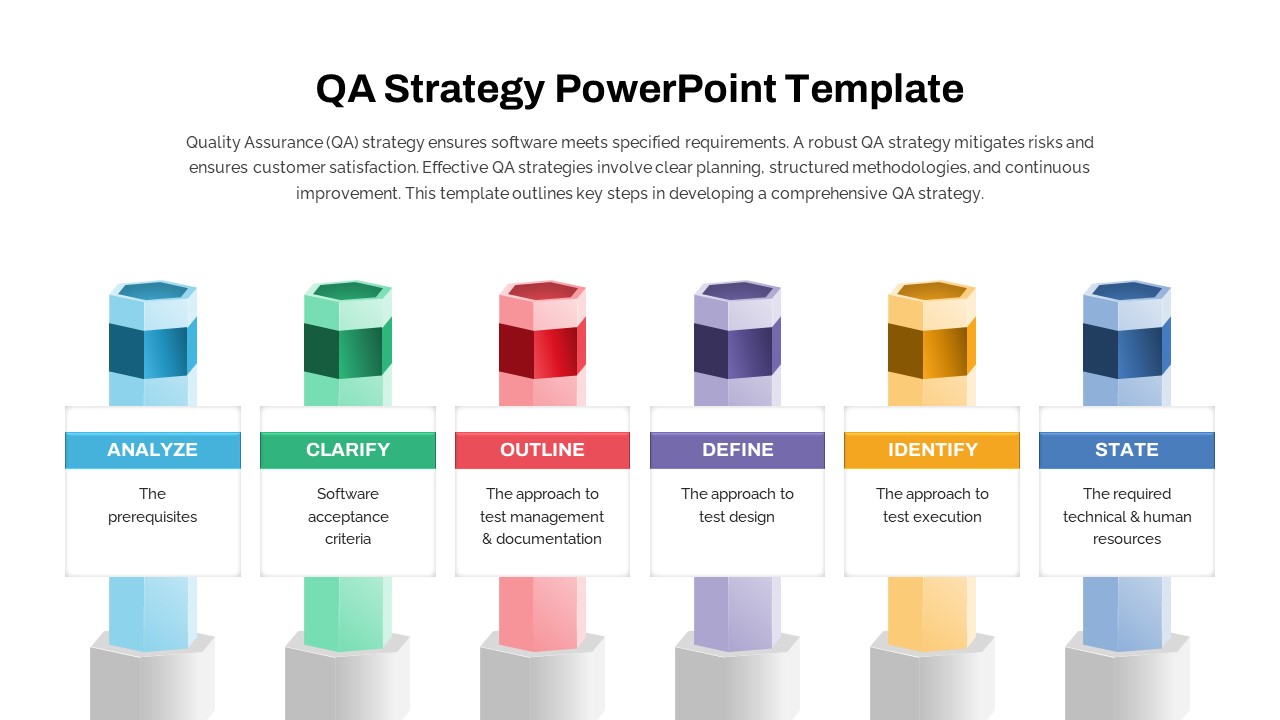
Six-Step QA Strategy Pillar Diagram Template for PowerPoint & Google Slides
Software Development
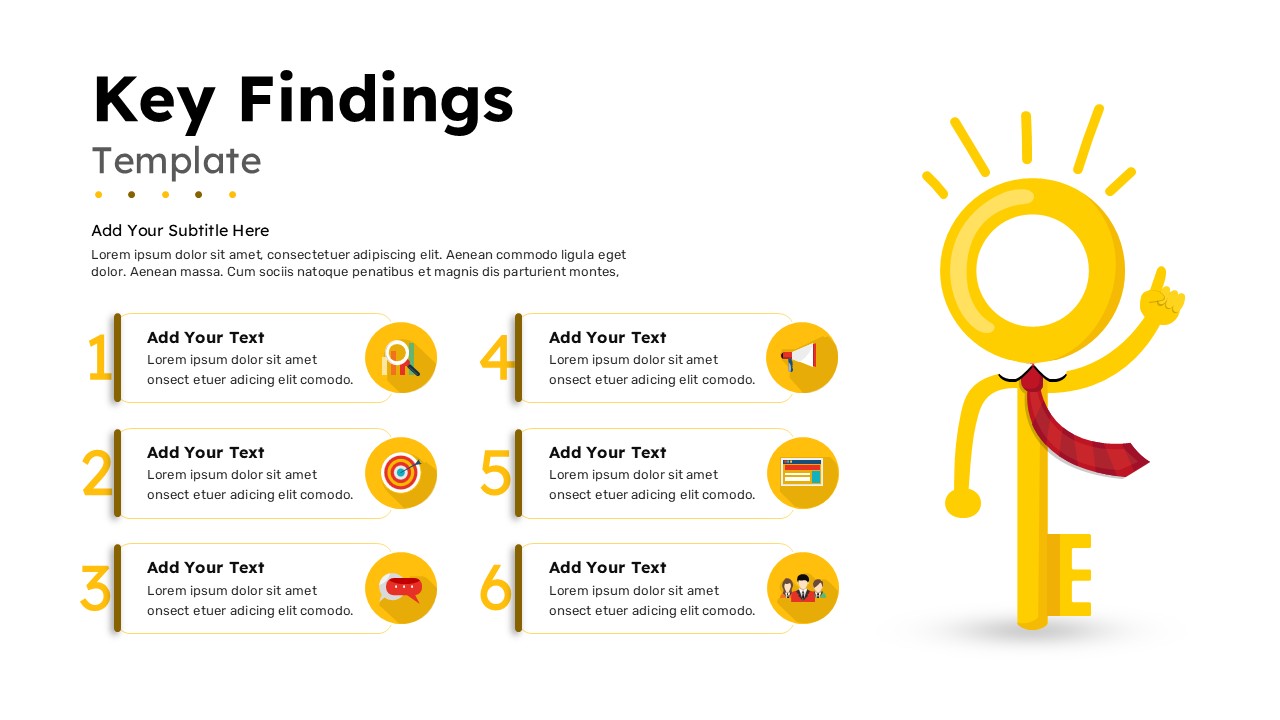
Key Findings Six-Step Diagram Template for PowerPoint & Google Slides
Business Report