Six Sigma Gear Process Diagram Template for PowerPoint & Google Slides

Description
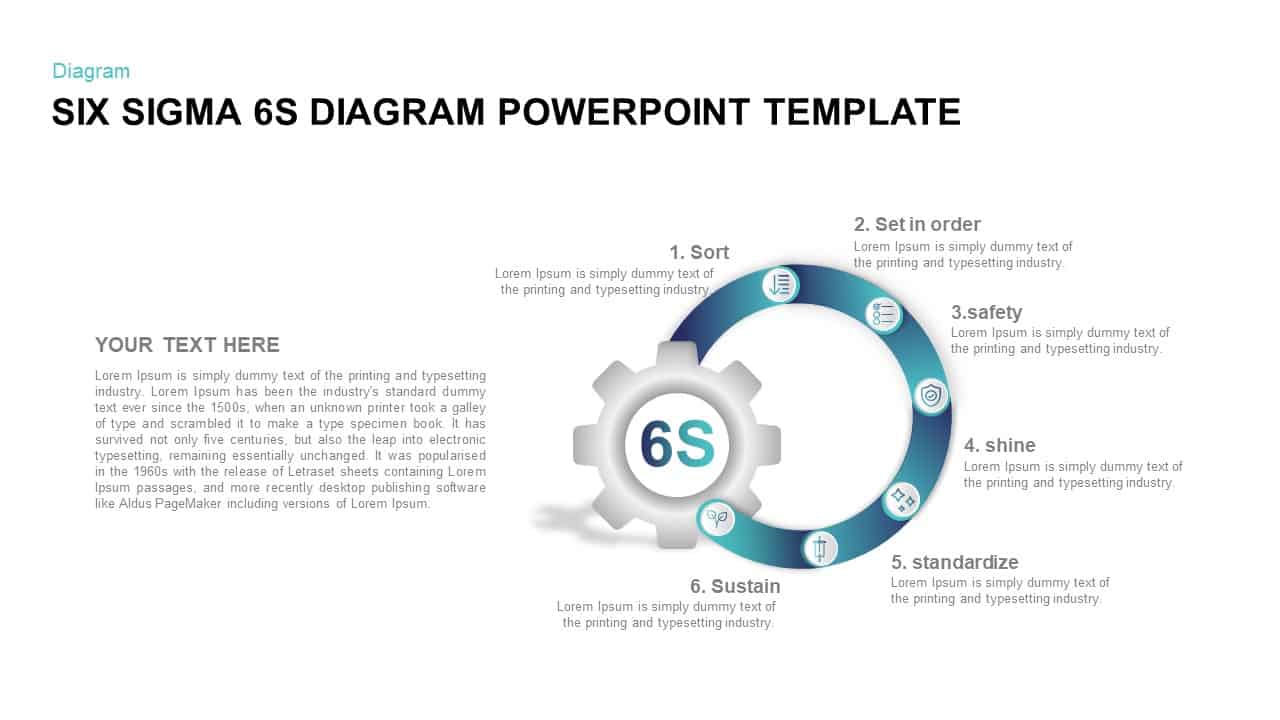
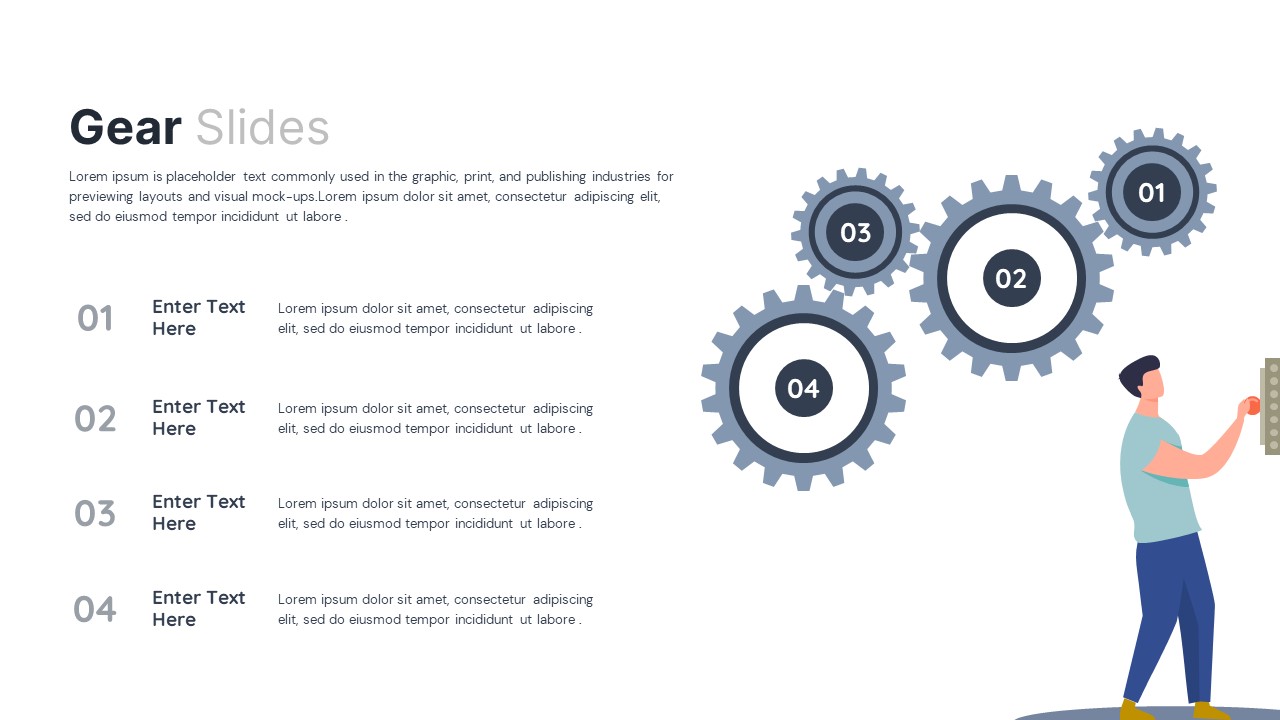
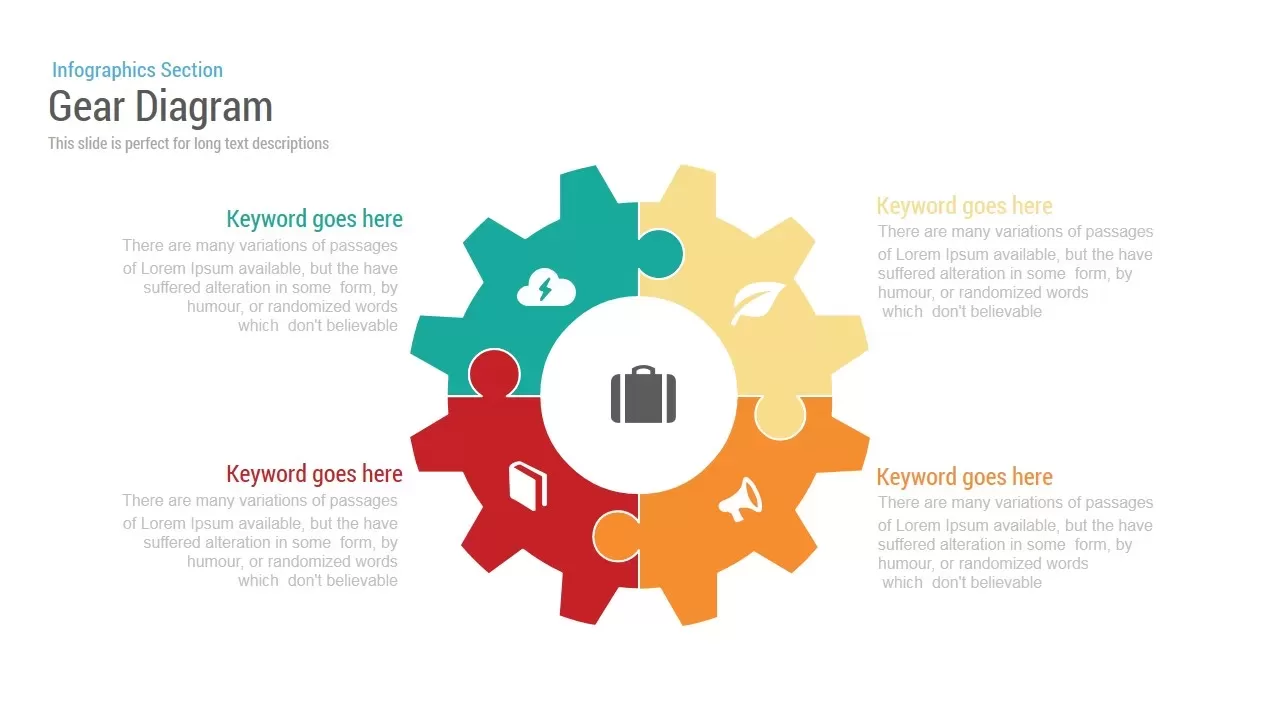
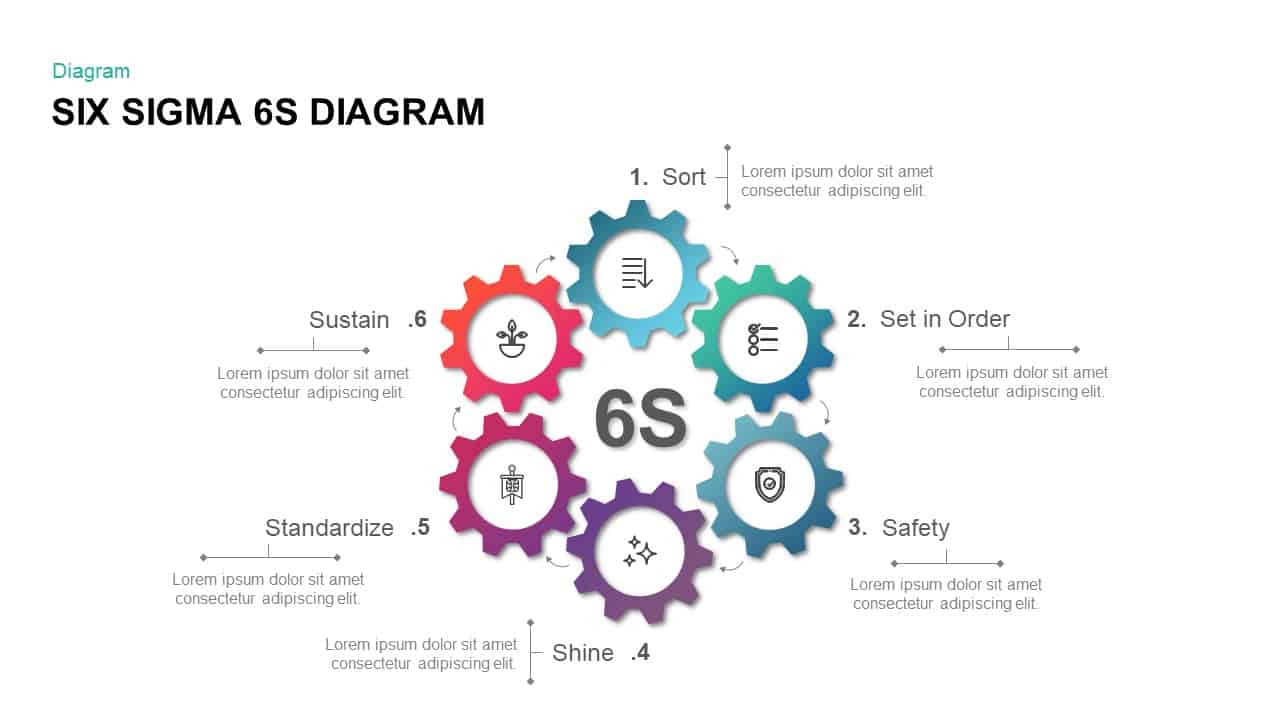
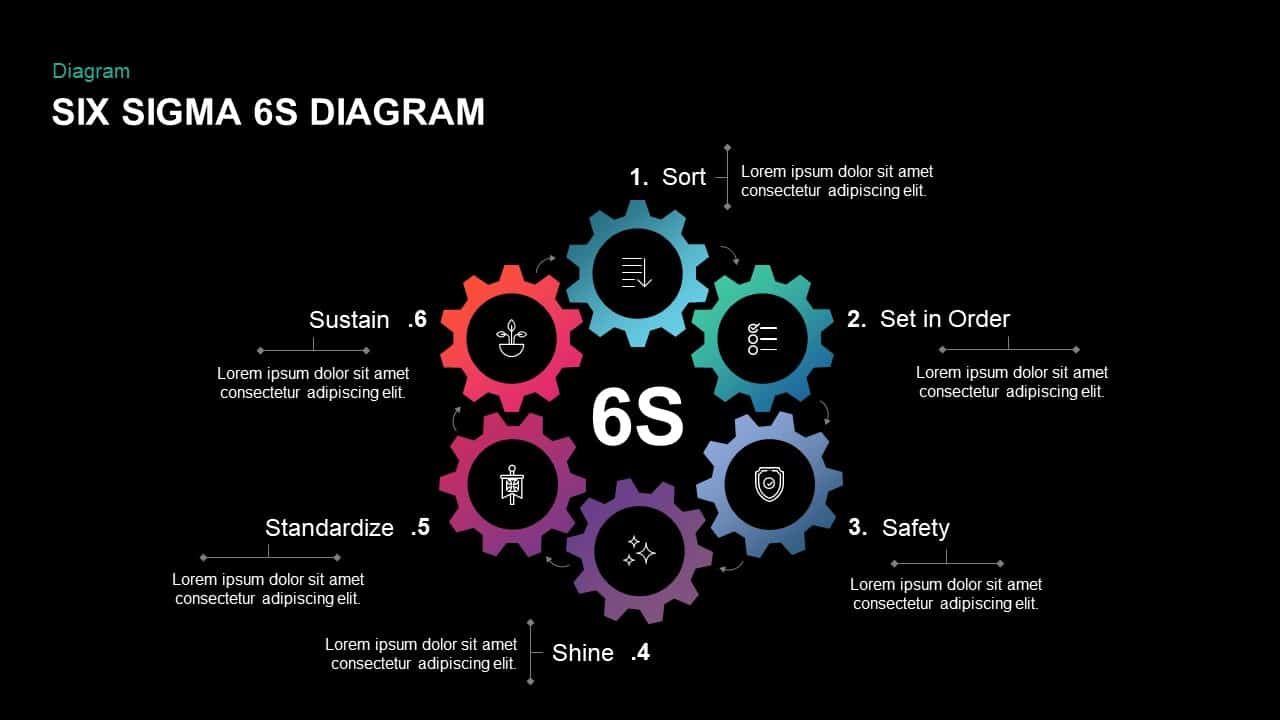
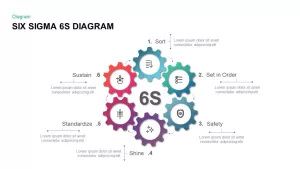
Visualize the Six Sigma 6S methodology with this striking gear-based process diagram, designed to map Sort, Set in Order, Safety, Shine, Standardize, and Sustain in a continuous improvement cycle. Six gradient-filled gears arranged in a circular layout drive home the concept of interlinked steps, while clean white icon placeholders and subtle connector arrows guide viewers through each phase. Built on master slides for both PowerPoint and Google Slides, every element is fully editable and vector-based—swap icons, adjust gear colors, or reposition text callouts in seconds without any loss of quality.
Leverage intuitive text placeholders to add step descriptions and best-practice notes, with automatic text-box resizing for consistent formatting. Apply entrance animations on each gear to introduce the 6S framework sequentially, ensuring audience attention stays focused on your narrative. High-resolution vectors guarantee crisp rendering on large-format screens, printed handouts, or PDF exports, making this template an ideal asset for boardroom presentations, training workshops, and stakeholder briefings.
Who is it for
Process engineers, quality managers, and continuous-improvement consultants will find this slide indispensable for mapping Six Sigma 6S workflows. Project managers, Lean practitioners, and operational leaders can also leverage the gear diagram to align teams on best practices and performance benchmarks.
Other Uses
Beyond Six Sigma, repurpose this gear-cycle layout to illustrate RACI models, DevOps toolchains, or product-development stages. Customize icons and labels to showcase departmental handoffs, machinery workflows, or cyclical audit processes—making it a versatile asset for any process-oriented presentation.
Login to download this file

Item ID
SB00966
Related Templates

Six Sigma 6S Process Infographic Diagram Template for PowerPoint & Google Slides
Process
Six Sigma 6S Process Diagram Template for PowerPoint & Google Slides
Process
Six-Staged Gear Diagram Framework Template for PowerPoint & Google Slides
Process
Six-Stage Gear Wheel Diagram Template for PowerPoint & Google Slides
Circular
Six-Option Gear Diagram Slide Template for PowerPoint & Google Slides
Circular
Six Colorful Gear Shapes Infographic Template for PowerPoint & Google Slides
Process
Free
Gear Process Diagram PowerPoint Template for PowerPoint & Google Slides
Process
Gear Process Diagram template for PowerPoint & Google Slides
Process
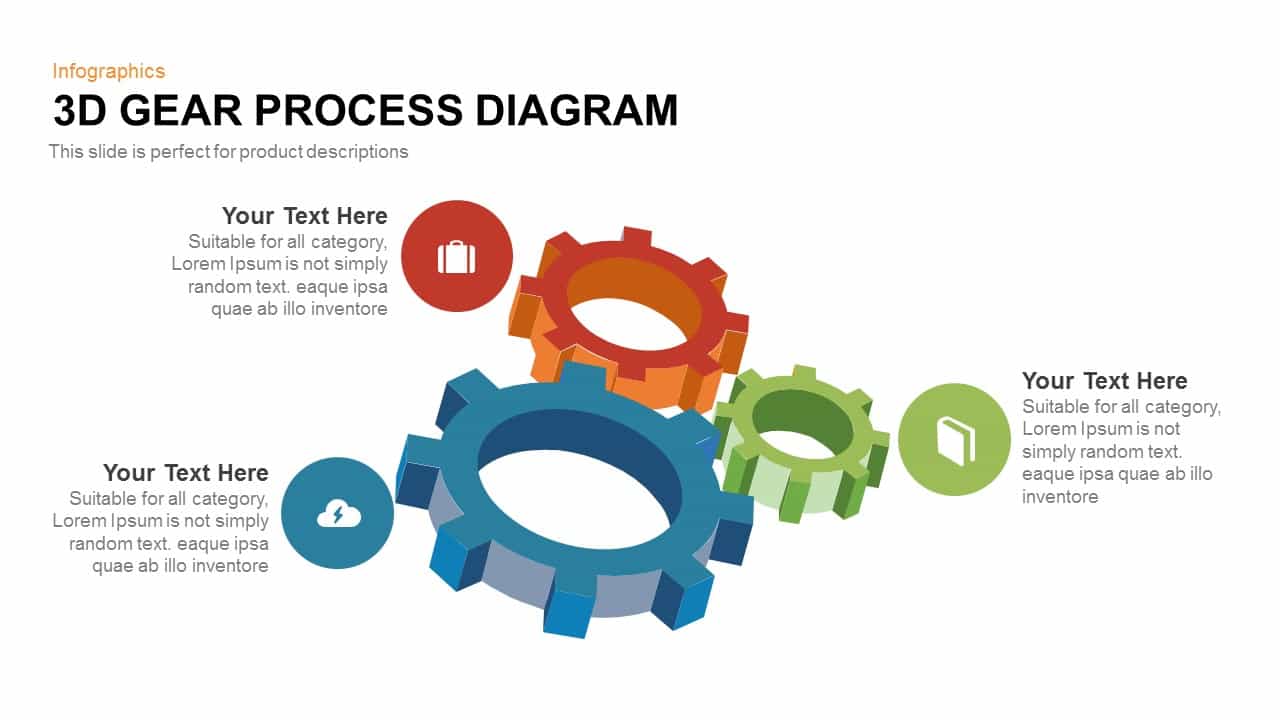
Professional 3D Gear Process Diagram Template for PowerPoint & Google Slides
Process
Gear Process Phase Diagram template for PowerPoint & Google Slides
Process

Five-Step Gear Process Diagram Template for PowerPoint & Google Slides
Process

Dynamic 4 Gear Process Diagram Template for PowerPoint & Google Slides
Process
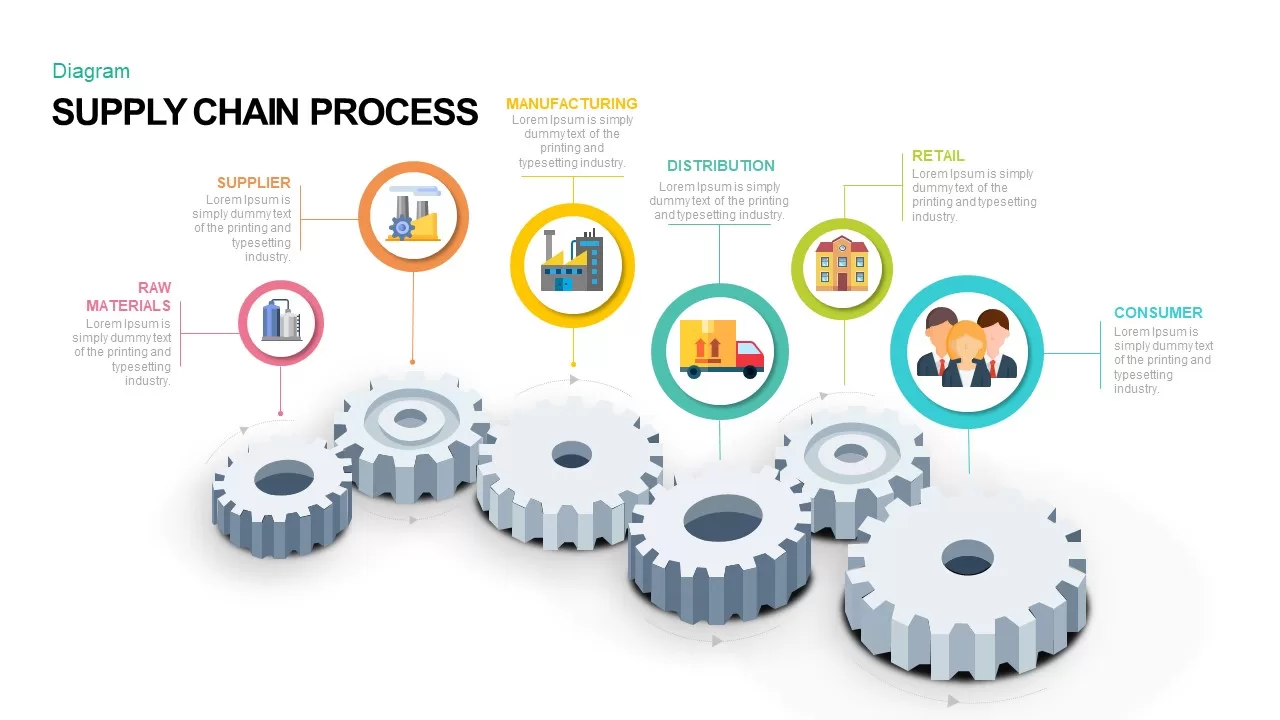
Supply Chain Process Gear Diagram Template for PowerPoint & Google Slides
Process
Four-Stage Gear Process Diagram Template for PowerPoint & Google Slides
Process
5-Stage Gear Process Flow Diagram Template for PowerPoint & Google Slides
Process
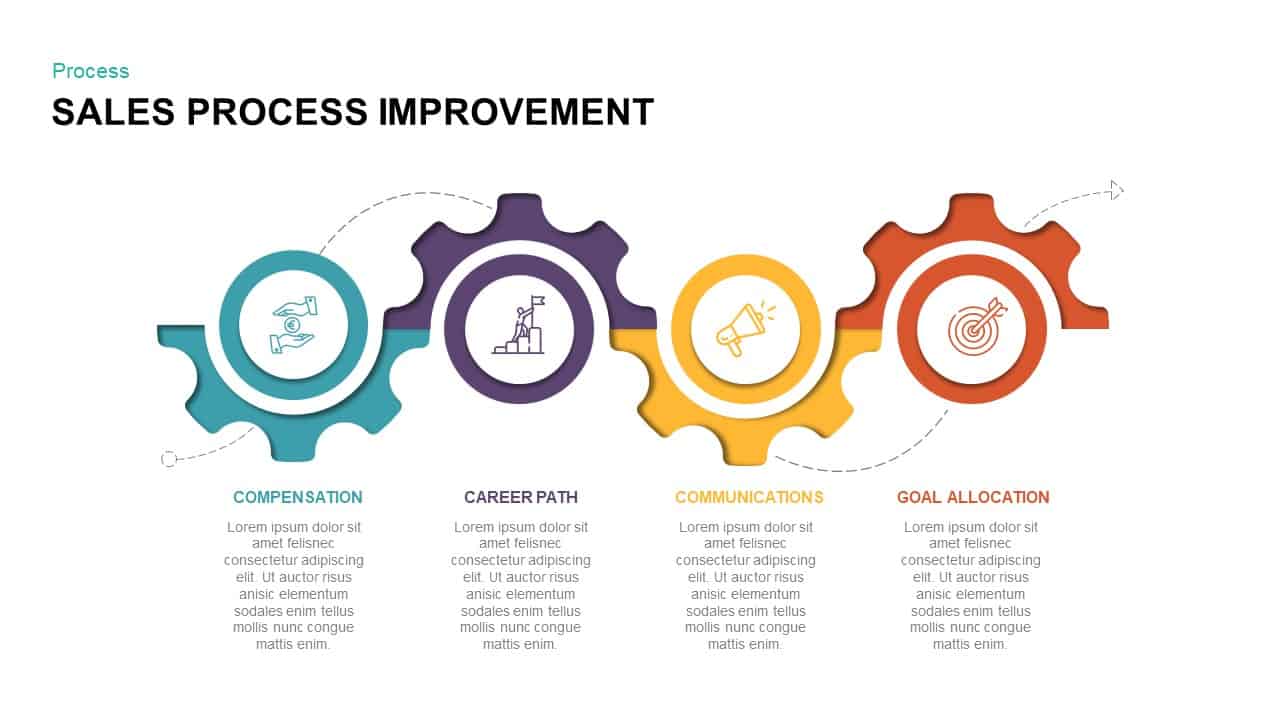
Sales Process Improvement Gear Diagram Template for PowerPoint & Google Slides
Process
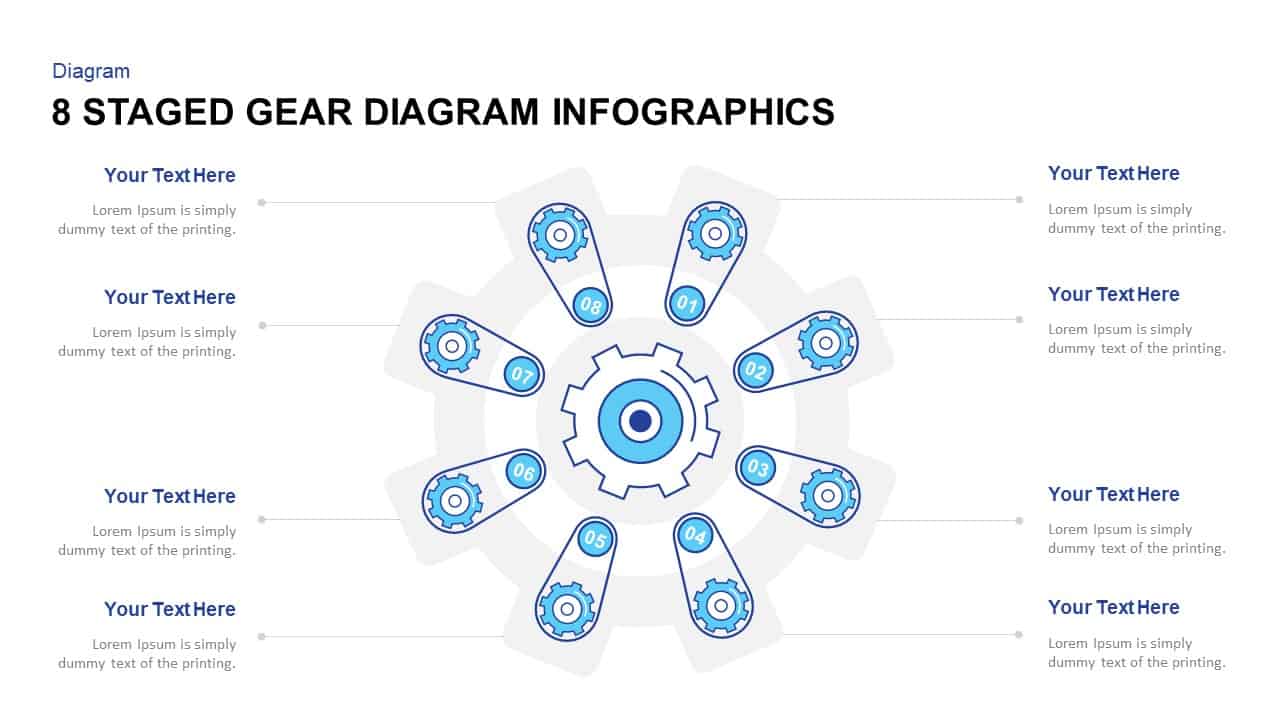
Eight-Stage Gear Diagram Process Template for PowerPoint & Google Slides
Process
Gear Process Diagram Template for PowerPoint & Google Slides
Process
Gear Process Diagram Template for PowerPoint & Google Slides
Process
Gear Process Diagram for PowerPoint & Google Slides
Process
Process Gear Shapes Template for PowerPoint & Google Slides
Infographics
Animated Gear Slide for Process Mapping Template for PowerPoint & Google Slides
Process
Dynamic Four-Step Gear Process Template for PowerPoint & Google Slides
Process
Six Arrow Radial Process Diagram template for PowerPoint & Google Slides
Infographics
Six Hexagon Stages Process Flow Diagram Template for PowerPoint & Google Slides
Process
Six Stage Zigzag Process Diagram Template for PowerPoint & Google Slides
Process
Roadmap Six-Step Process Diagram Template for PowerPoint & Google Slides
Roadmap
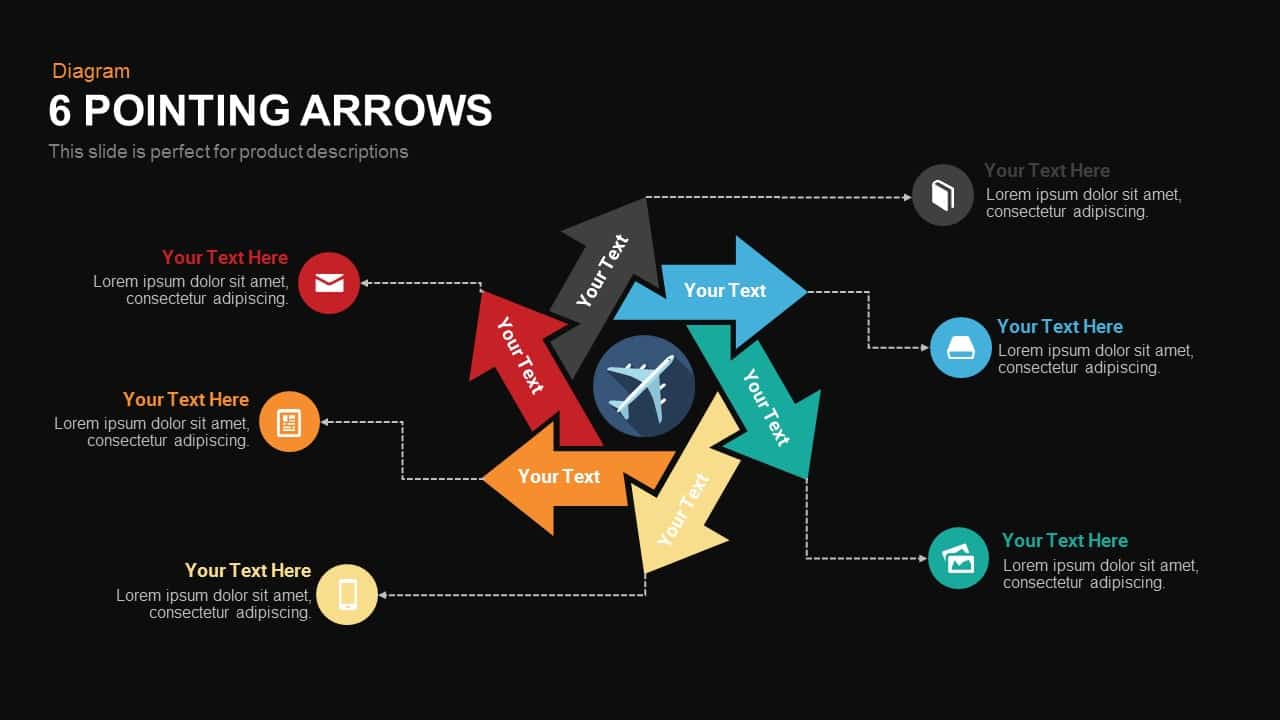
Six Pointing Arrow Process Diagram Template for PowerPoint & Google Slides
Arrow
Six-Stage Zig-Zag Process Flow Diagram Template for PowerPoint & Google Slides
Process
Six-Sided Shutter Diagram Process Flow Template for PowerPoint & Google Slides
Process

Editable Six-Step Bubble Process Diagram Template for PowerPoint & Google Slides
Process
Six-Process Circular Arrow Diagram Template for PowerPoint & Google Slides
Circular
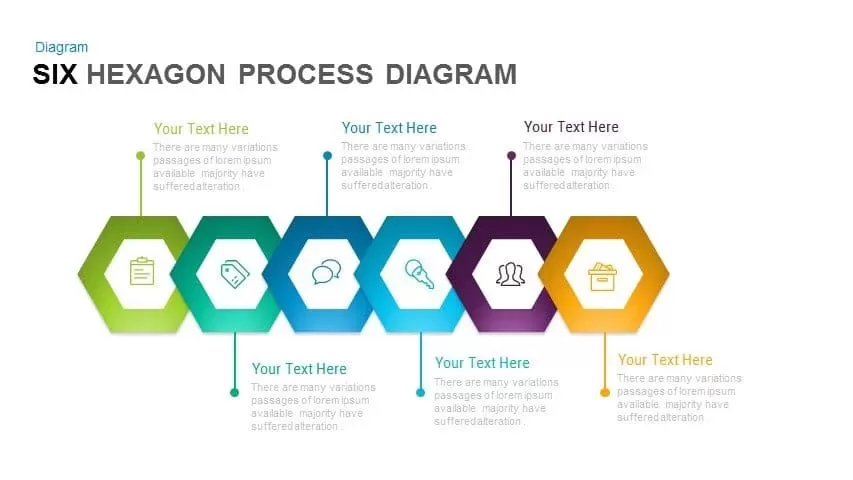
Six-Step Hexagon Process Diagram Template for PowerPoint & Google Slides
Process
Free Six Stage Bubble Process Diagram template for PowerPoint & Google Slides
Process
Free

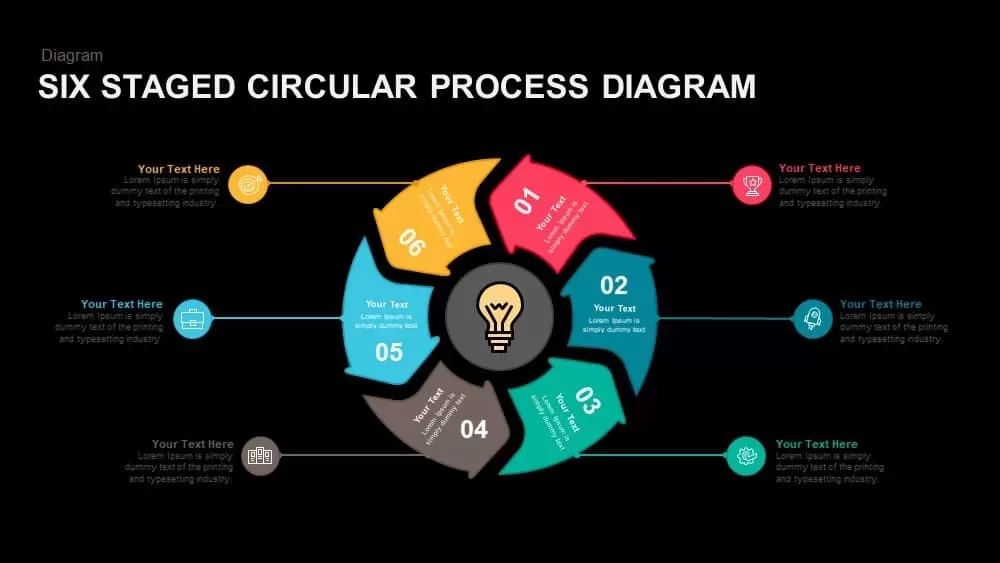
Six-Stage Circular Process Diagram Template for PowerPoint & Google Slides
Process
Six-Stage Circle Process Diagram Template for PowerPoint & Google Slides
Process
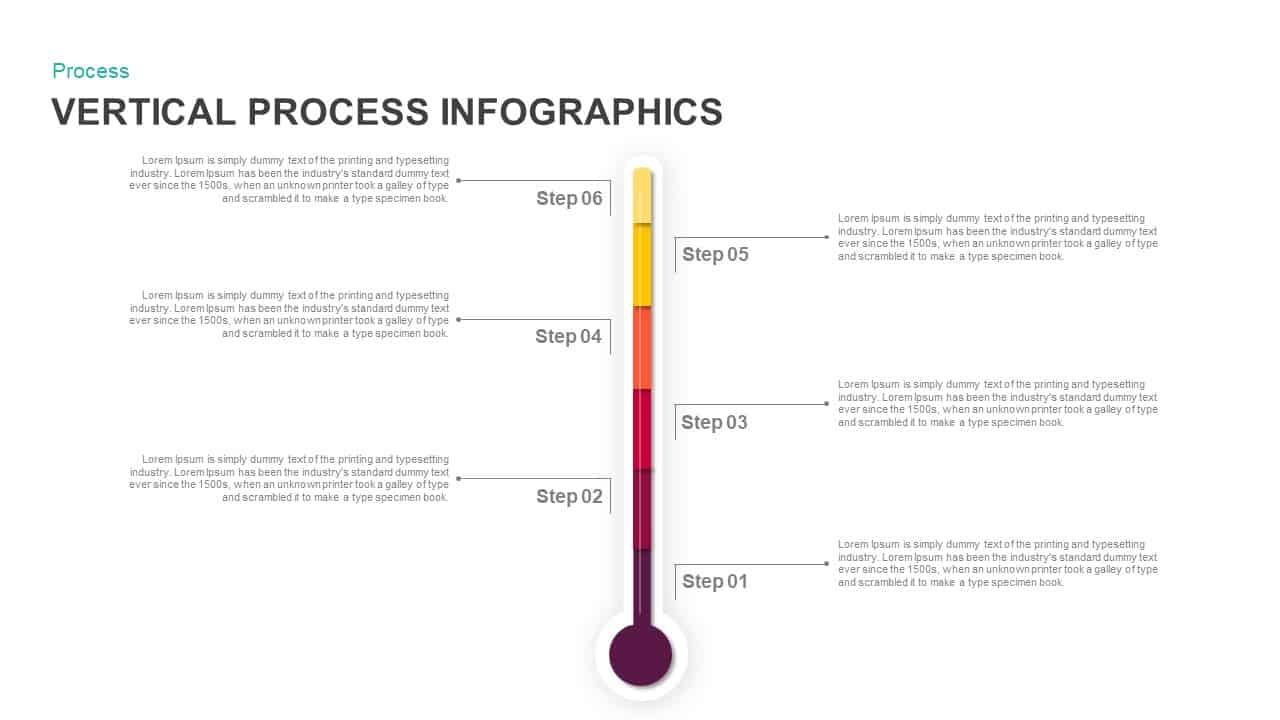
Six-Step Vertical Process Diagram Template for PowerPoint & Google Slides
Process
Free Six-Stage Arrow Process Diagram Template for PowerPoint & Google Slides
Process
Free
Six-Step Linear Arrow Process Diagram Template for PowerPoint & Google Slides
Process
Six-Stage Circular Diagram Process Template for PowerPoint & Google Slides
Circular
Six-Step Hexagon Process Flow Diagram Template for PowerPoint & Google Slides
Process
Six Stage Hexagon Process Diagram Template for PowerPoint & Google Slides
Process
Six-Stage Infinity Loop Process Diagram Template for PowerPoint & Google Slides
Process
Compass-Themed Six-Step Process Diagram Template for PowerPoint & Google Slides
Process
Six-Step Infinity Loop Process Diagram Template for PowerPoint & Google Slides
Process
Six-Circle Process Infographic Diagram Template for PowerPoint & Google Slides
Circular

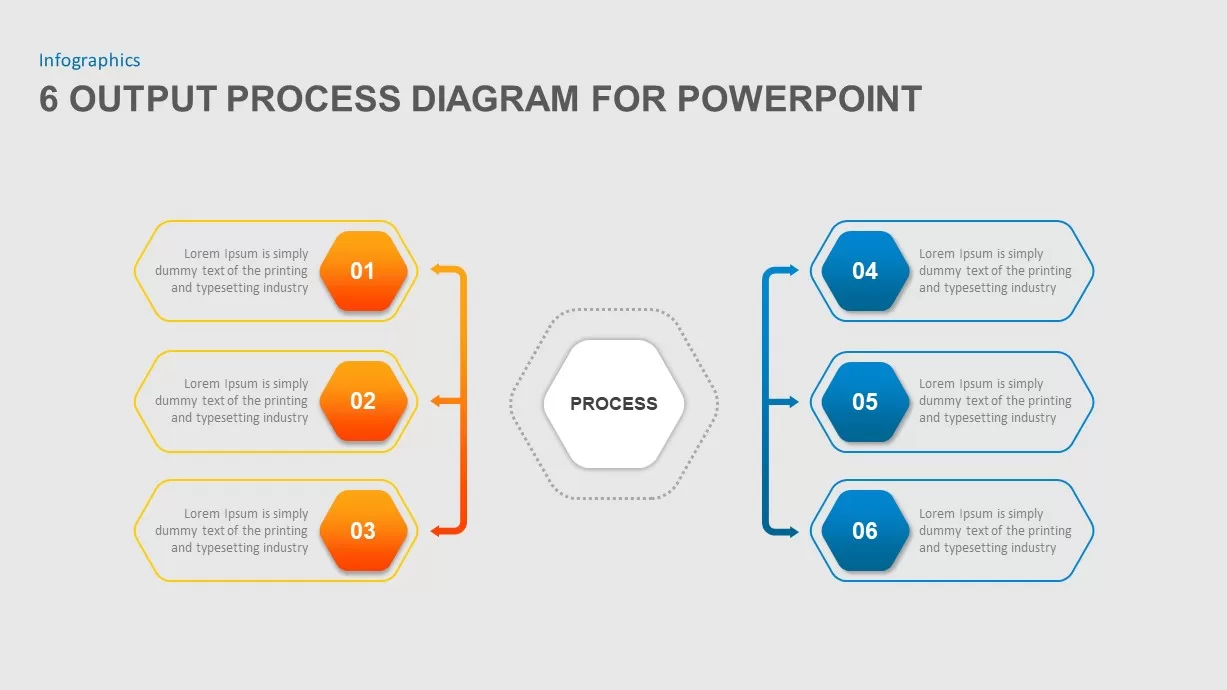
Six-Step Output Process Diagram Template for PowerPoint & Google Slides
Process
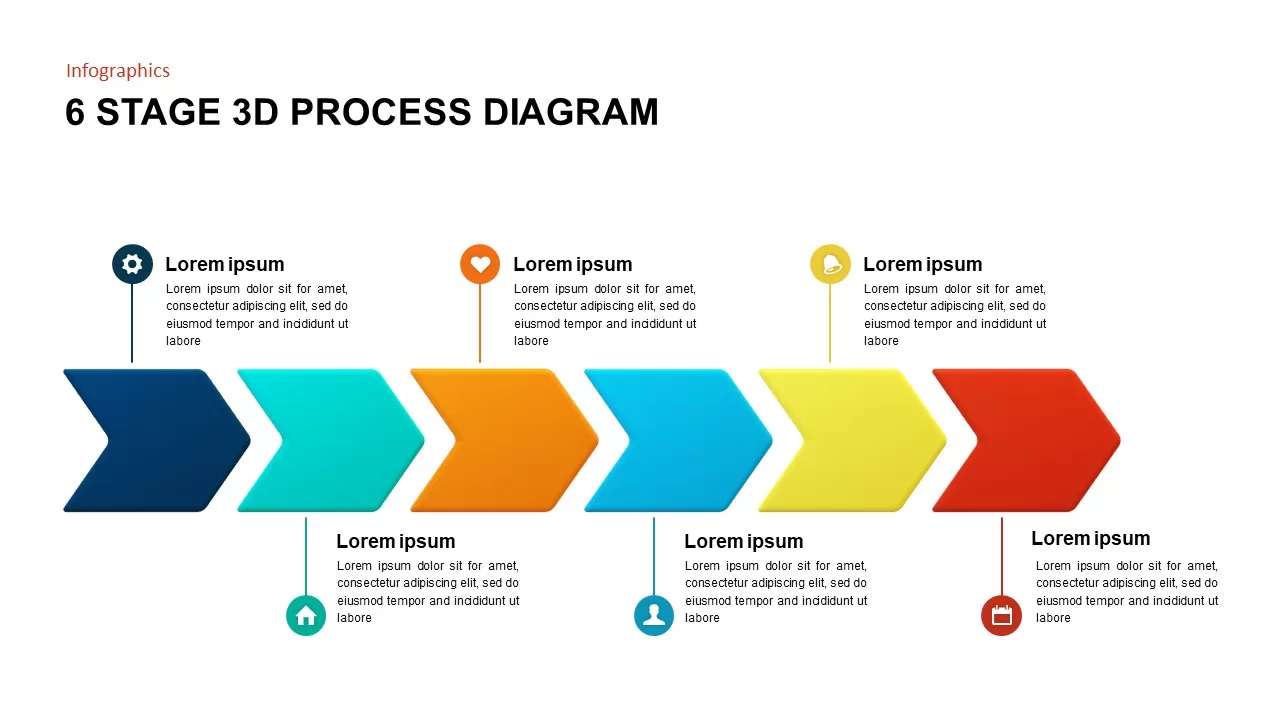
Animated Six-Stage 3D Process Diagram Template for PowerPoint & Google Slides
Arrow
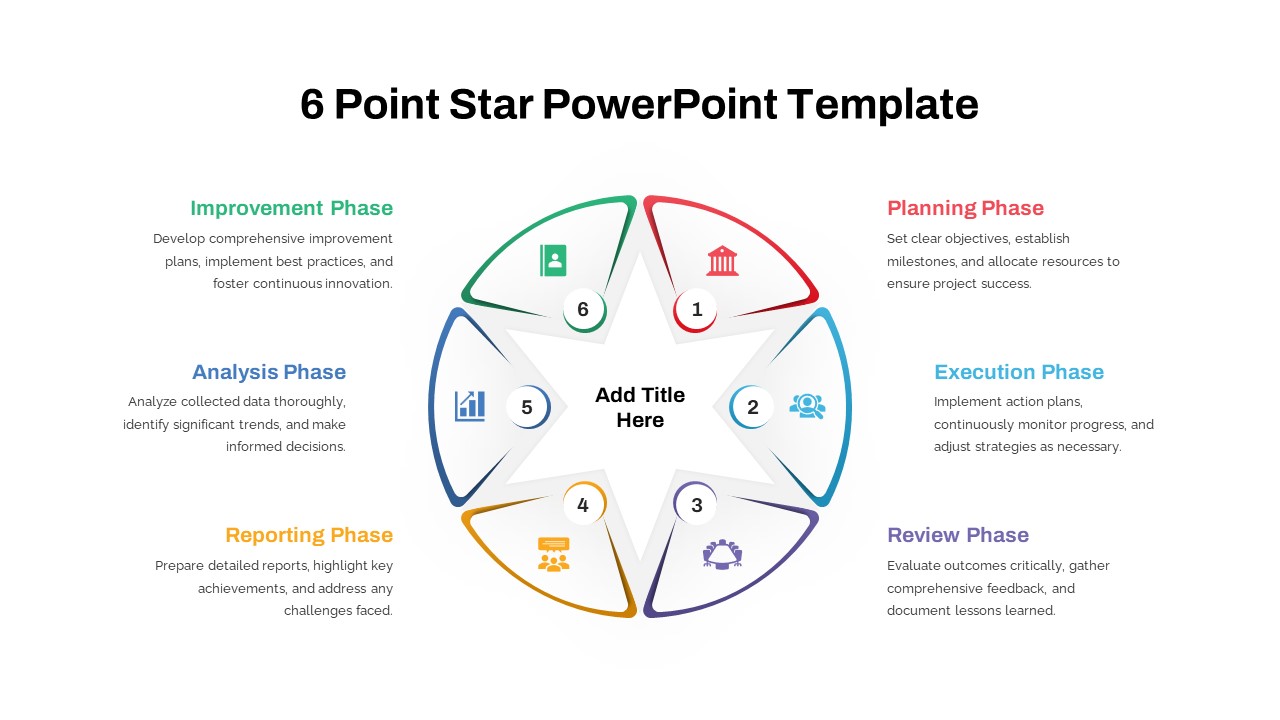
Six-Point Star Process Diagram Template for PowerPoint & Google Slides
Process
Gear Diagram template for PowerPoint & Google Slides
Process
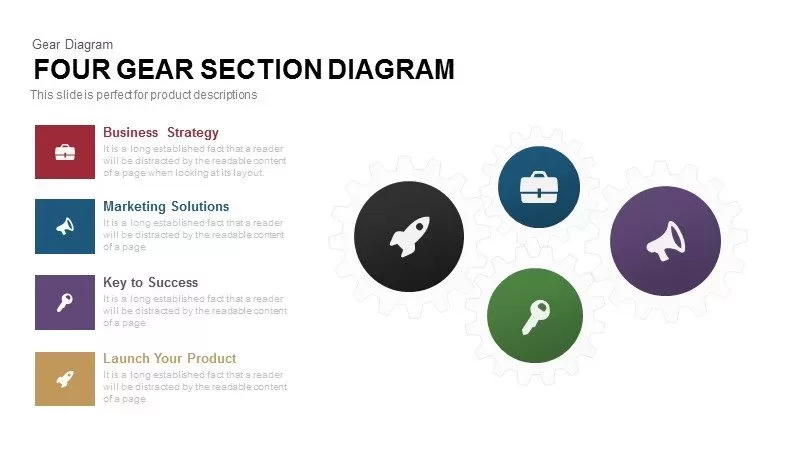
Four Gear Section Diagram Template for PowerPoint & Google Slides
Circular
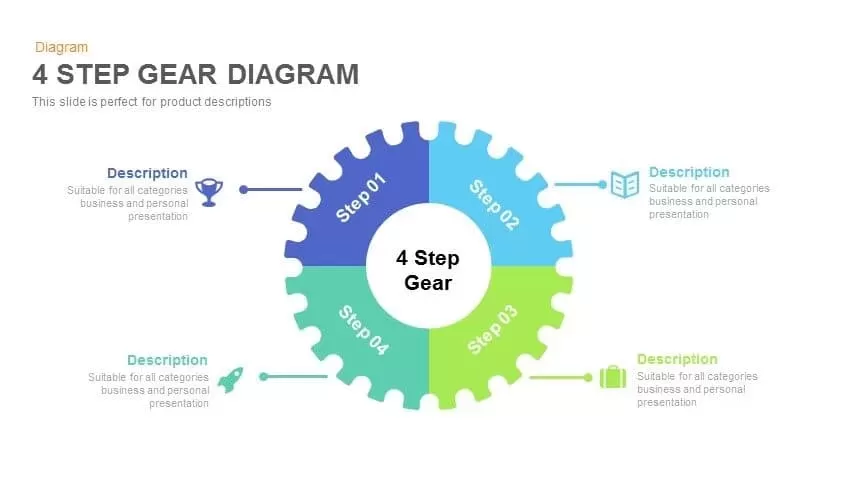
4 Step Gear Diagram Template for PowerPoint & Google Slides
Process
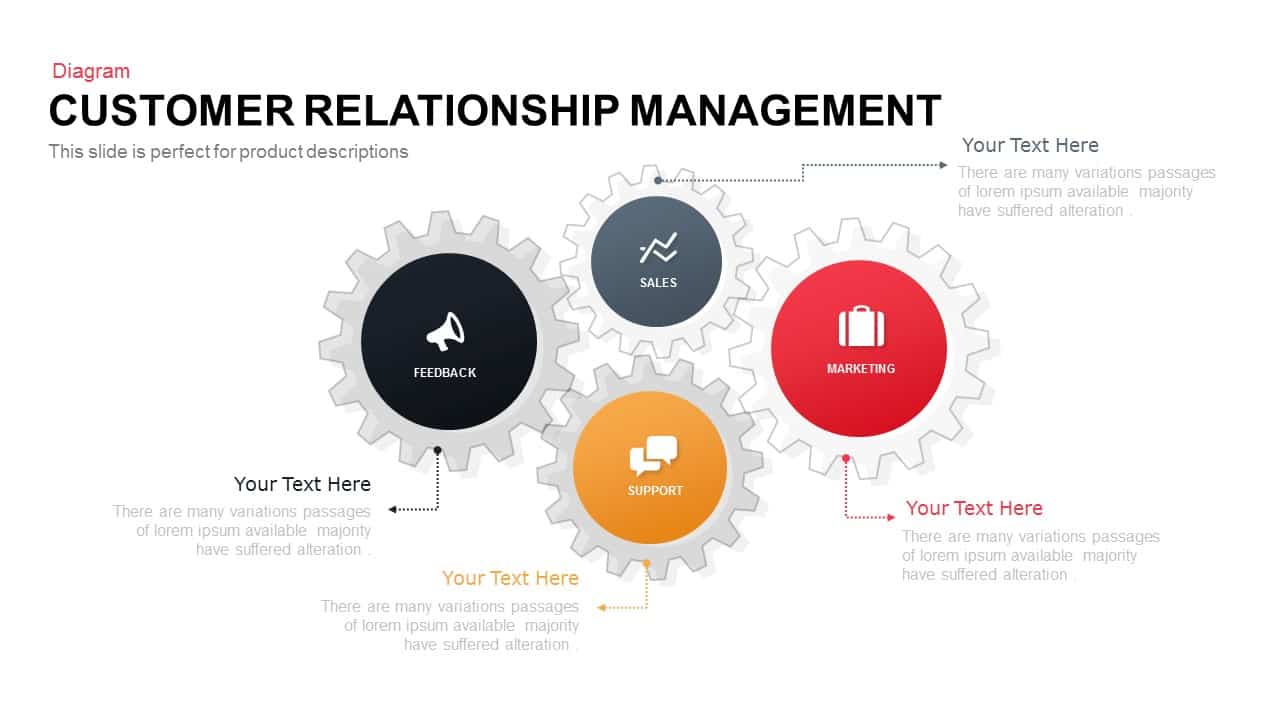
Colorful Modern CRM Gear Diagram Template for PowerPoint & Google Slides
Customer Experience
Gear Pie Diagram Data Visualization Template for PowerPoint & Google Slides
Pie/Donut
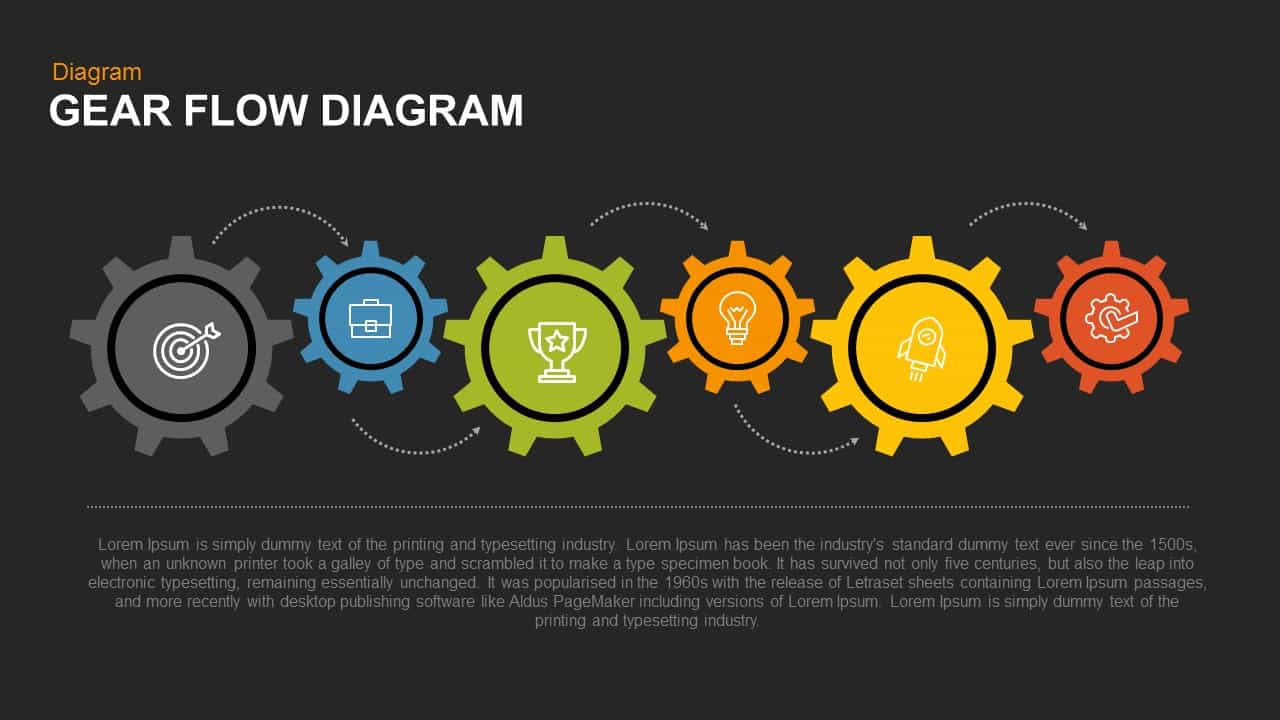
Gear Flow Diagram template for PowerPoint & Google Slides
Process
Modern Four Stage Gear Diagram Template for PowerPoint & Google Slides
Process
Artificial Intelligence Gear Diagram Template for PowerPoint & Google Slides
Process
Marketing Risk Management Gear Diagram Template for PowerPoint & Google Slides
Risk Management
SWOT Analysis Gear Diagram Slide Template for PowerPoint & Google Slides
SWOT
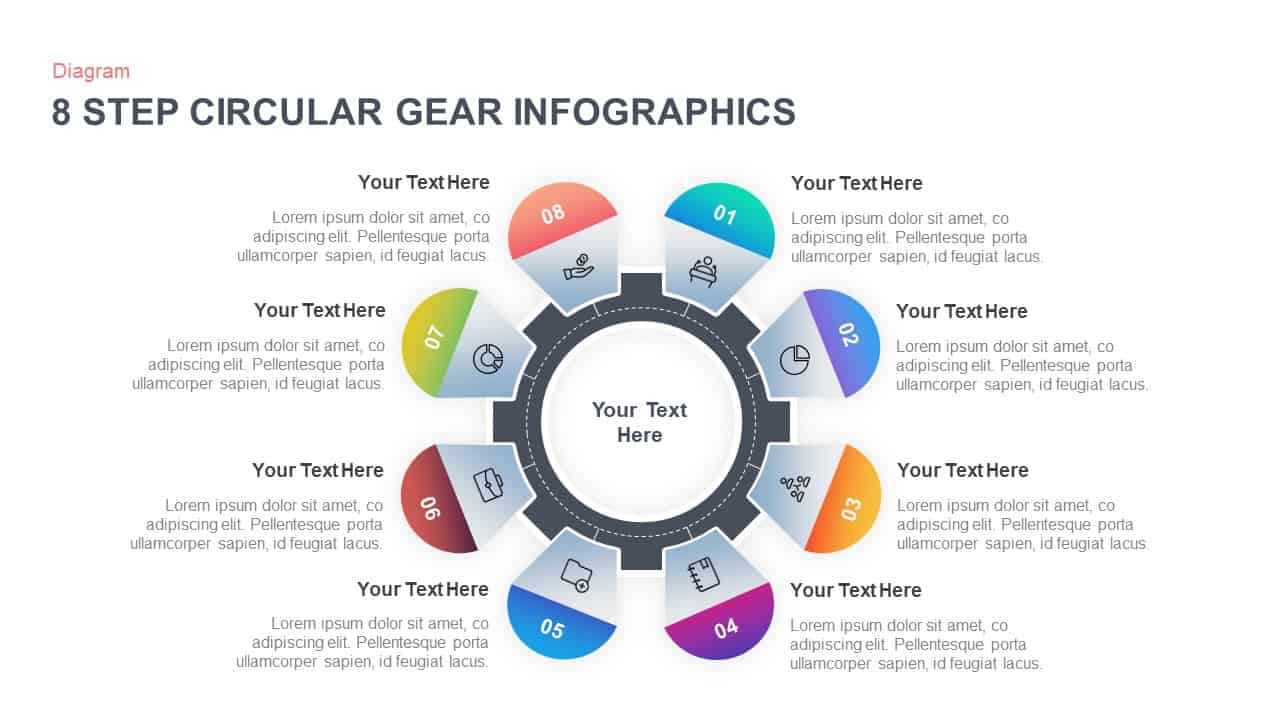
8-Step Circular Gear Infographic Diagram Template for PowerPoint & Google Slides
Circular
Modern Gear Venn Diagram Infographic Template for PowerPoint & Google Slides
Comparison
6-Part Circular Gear Infographic Diagram Template for PowerPoint & Google Slides
Process
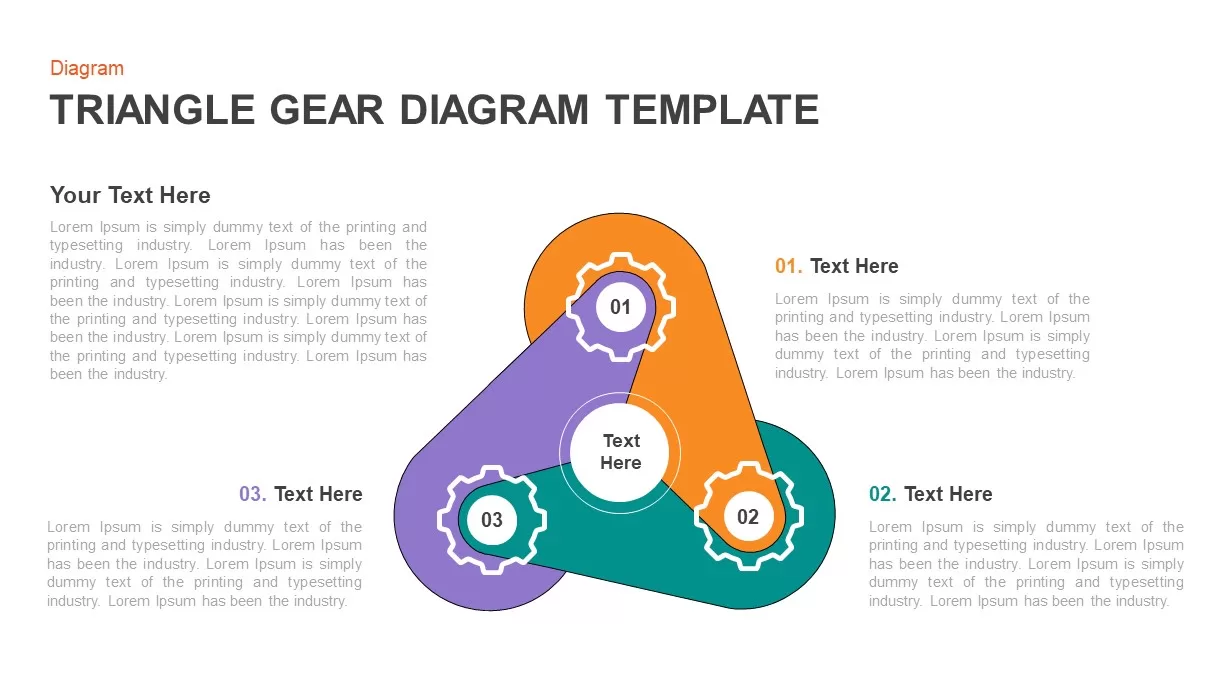
Three-Step Triangular Gear Diagram Template for PowerPoint & Google Slides
Process
Dynamic Gear Diagram Infographics Template for PowerPoint & Google Slides
Process
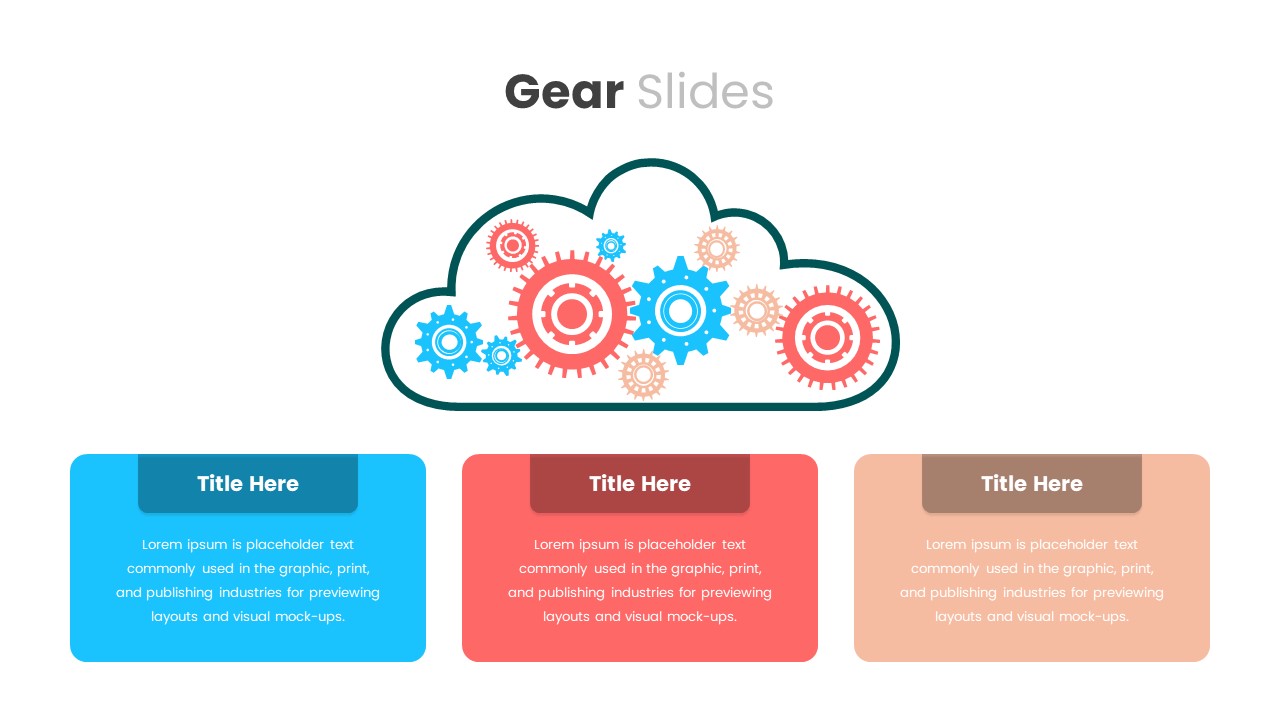
Cloud Gear Automation Diagram Template for PowerPoint & Google Slides
Cloud Computing
8-Step Circular Gear Infographics Diagram for PowerPoint & Google Slides
Process
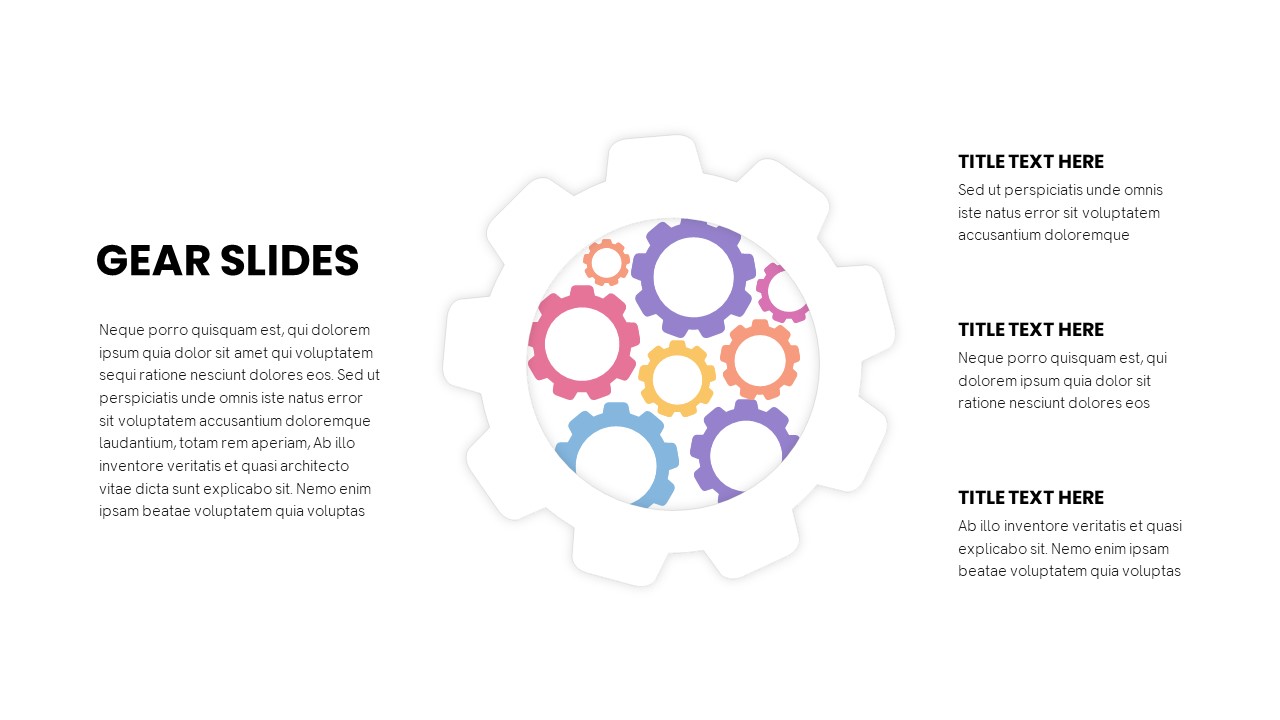
Gear Slides for PowerPoint & Google Slides
Infographics
Six-Stage Process Infographics Template for PowerPoint & Google Slides
Process
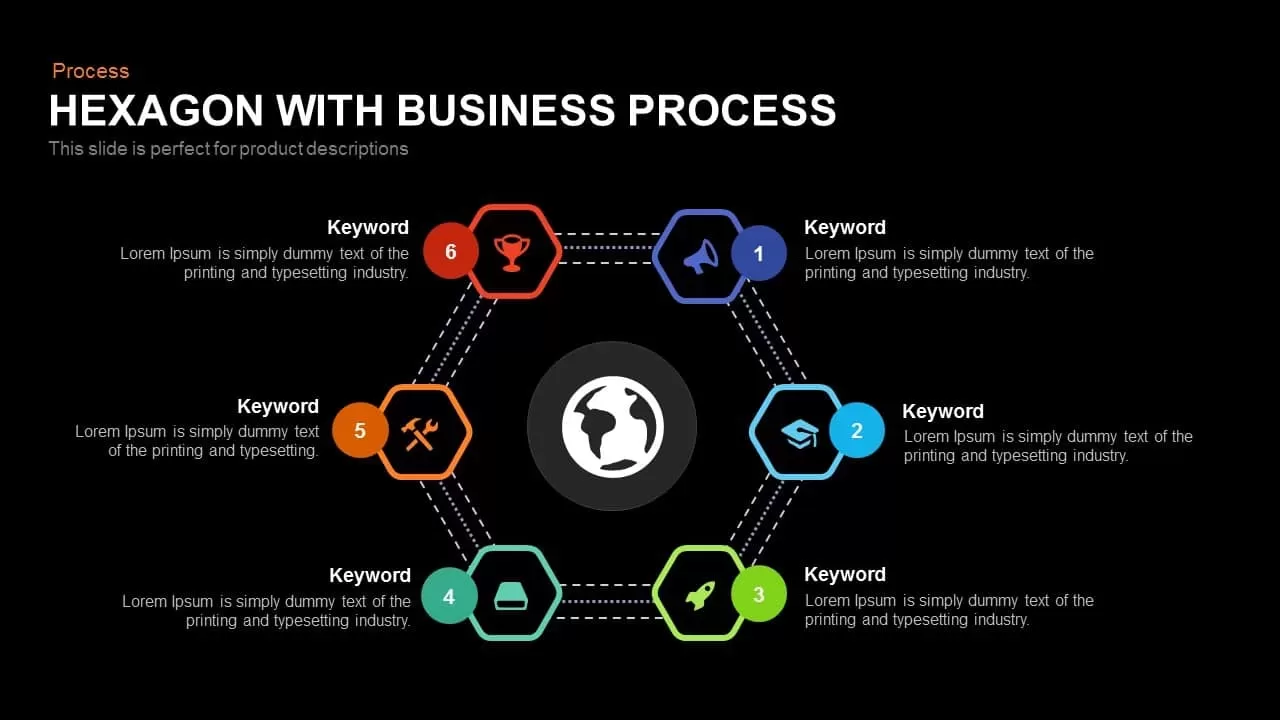
Global Hexagon Six-Step Business Process Template for PowerPoint & Google Slides
Process
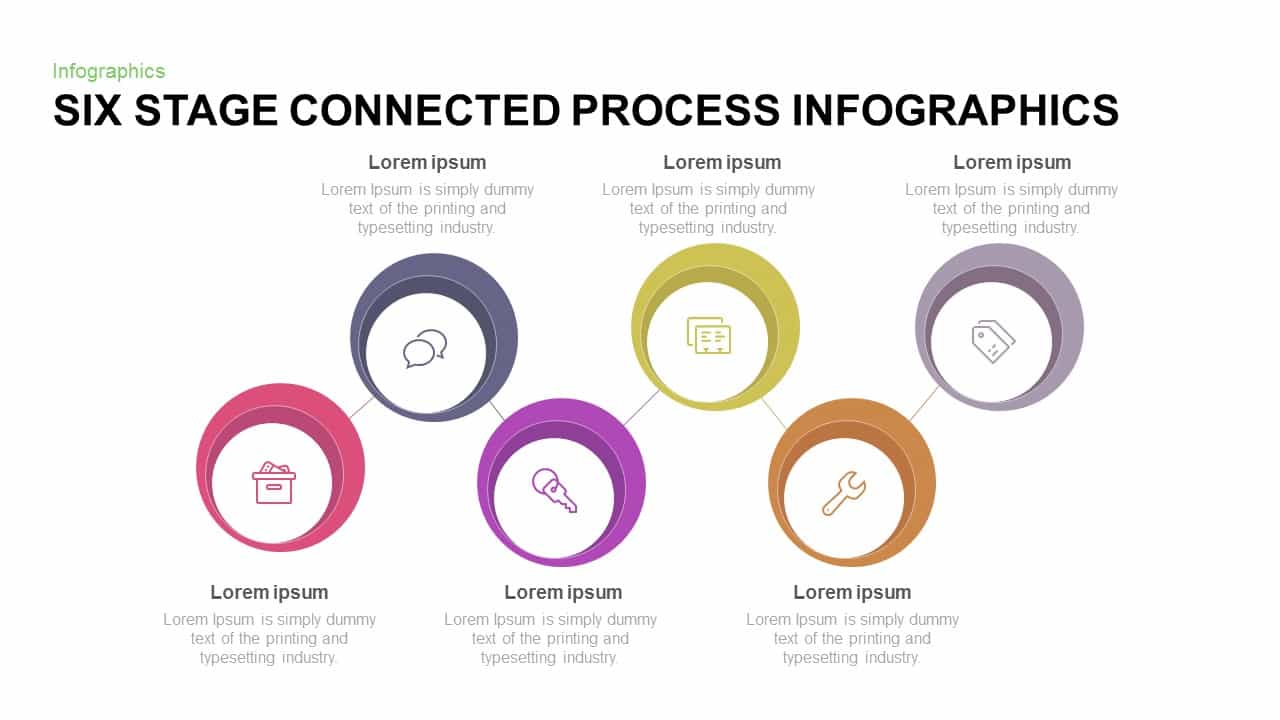
Six-Stage Connected Process Infographics Template for PowerPoint & Google Slides
Process
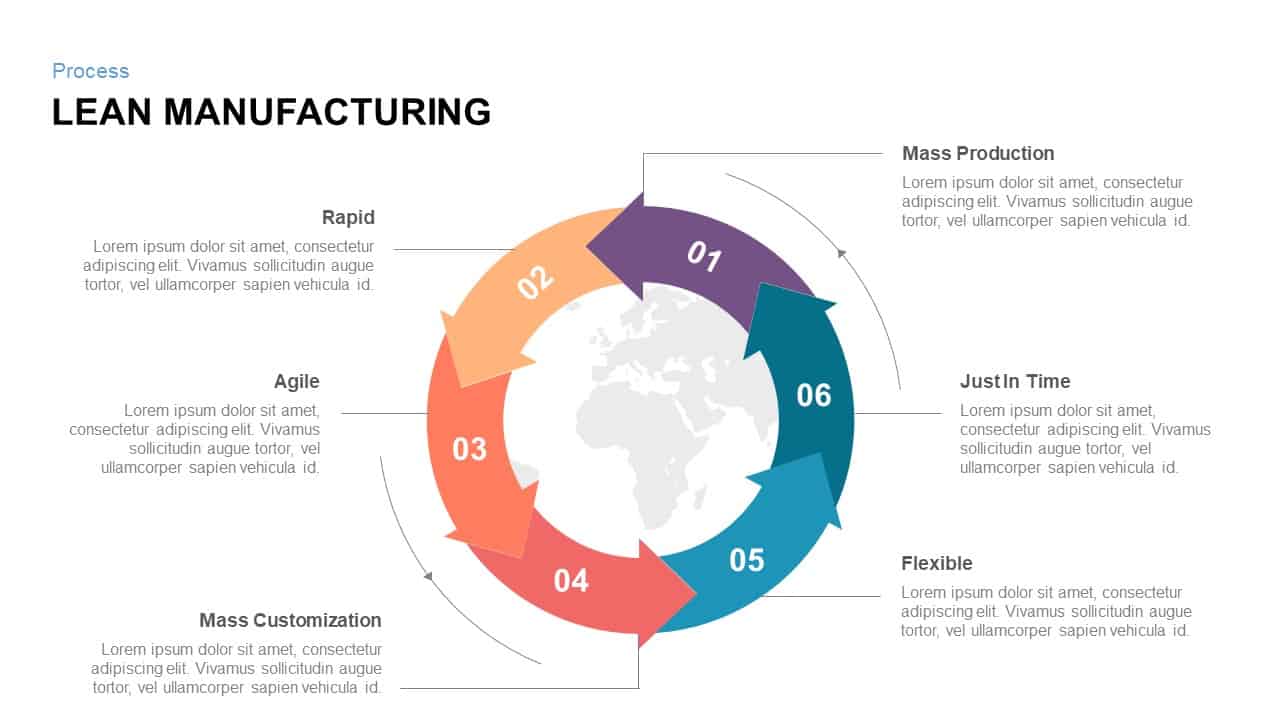
Six-Step Lean Manufacturing Process Template for PowerPoint & Google Slides
Process
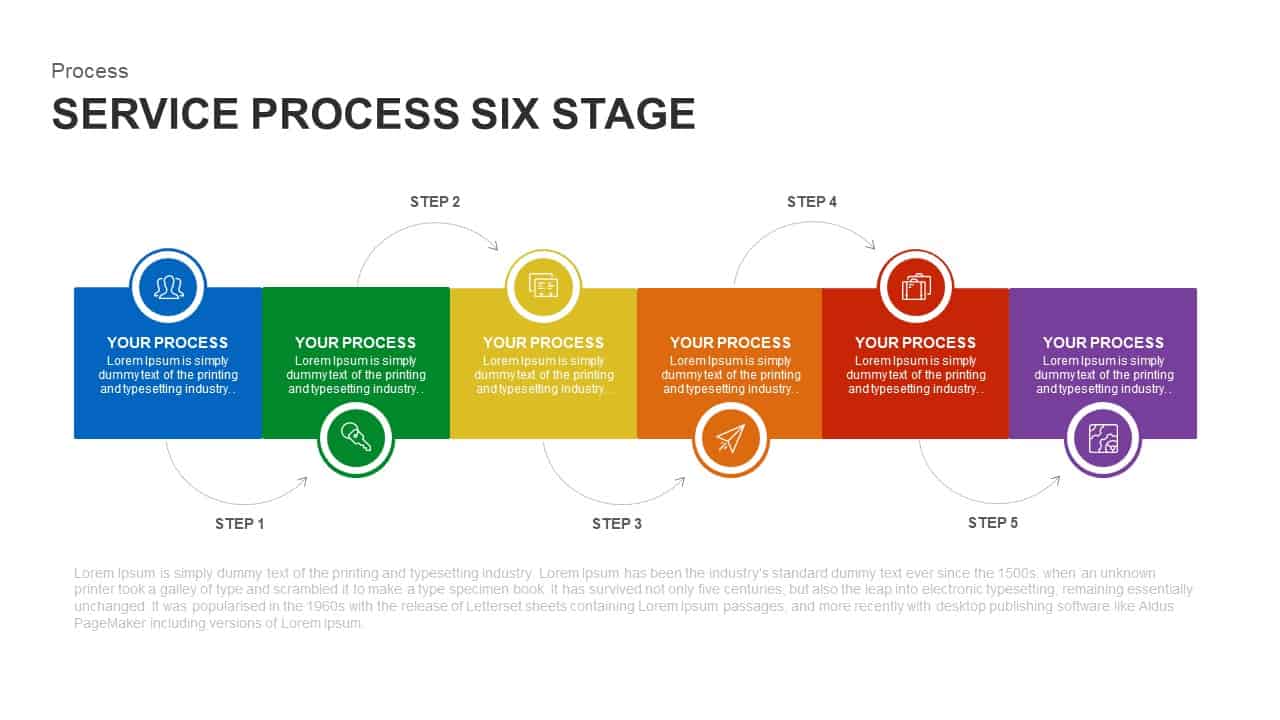
Six-Stage Service Process Workflow Template for PowerPoint & Google Slides
Process
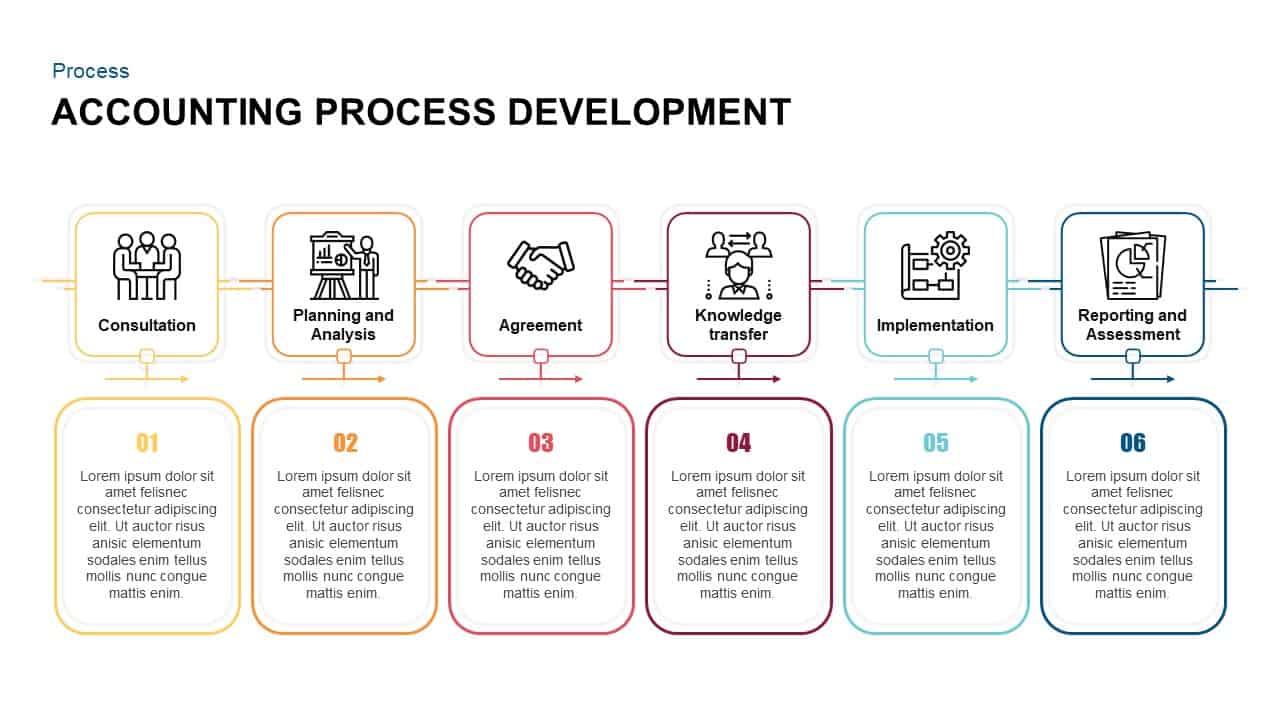
Six-Step Accounting Process Development Template for PowerPoint & Google Slides
Process
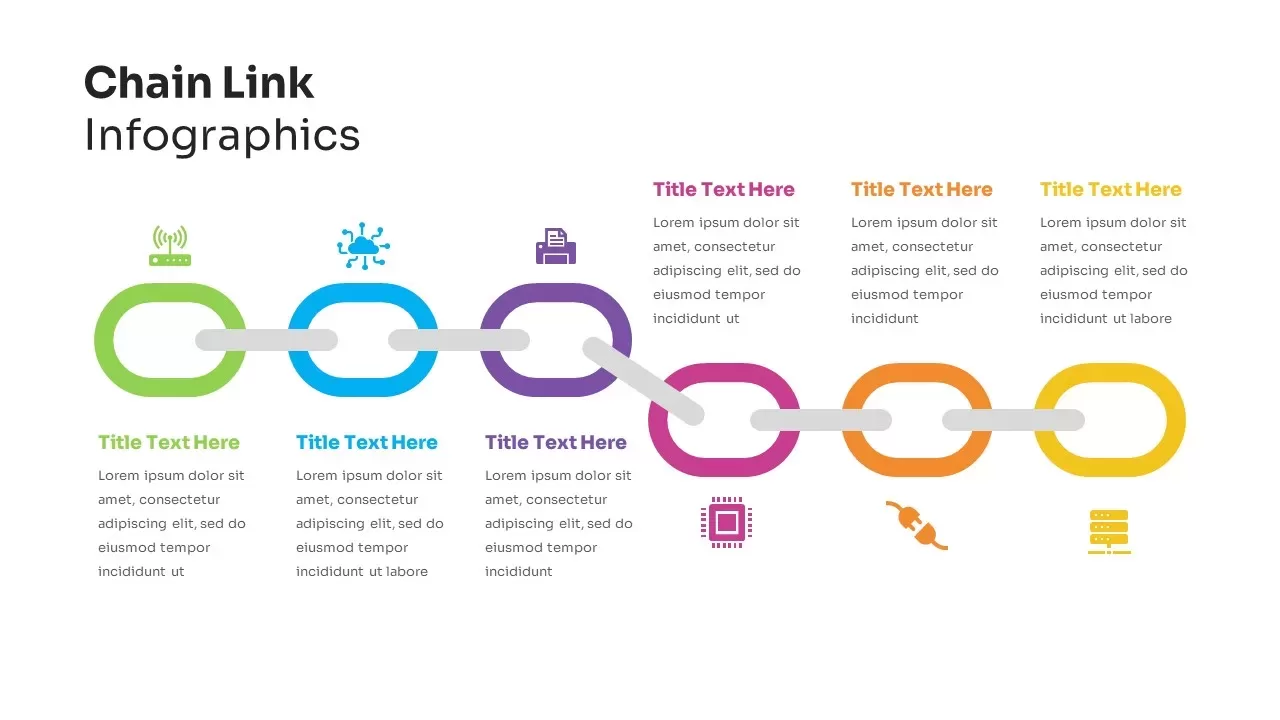
Six-Step Chain Link Technology Process Template for PowerPoint & Google Slides
Process
Six-Stage Pyramid Process Slide Template for PowerPoint & Google Slides
Pyramid
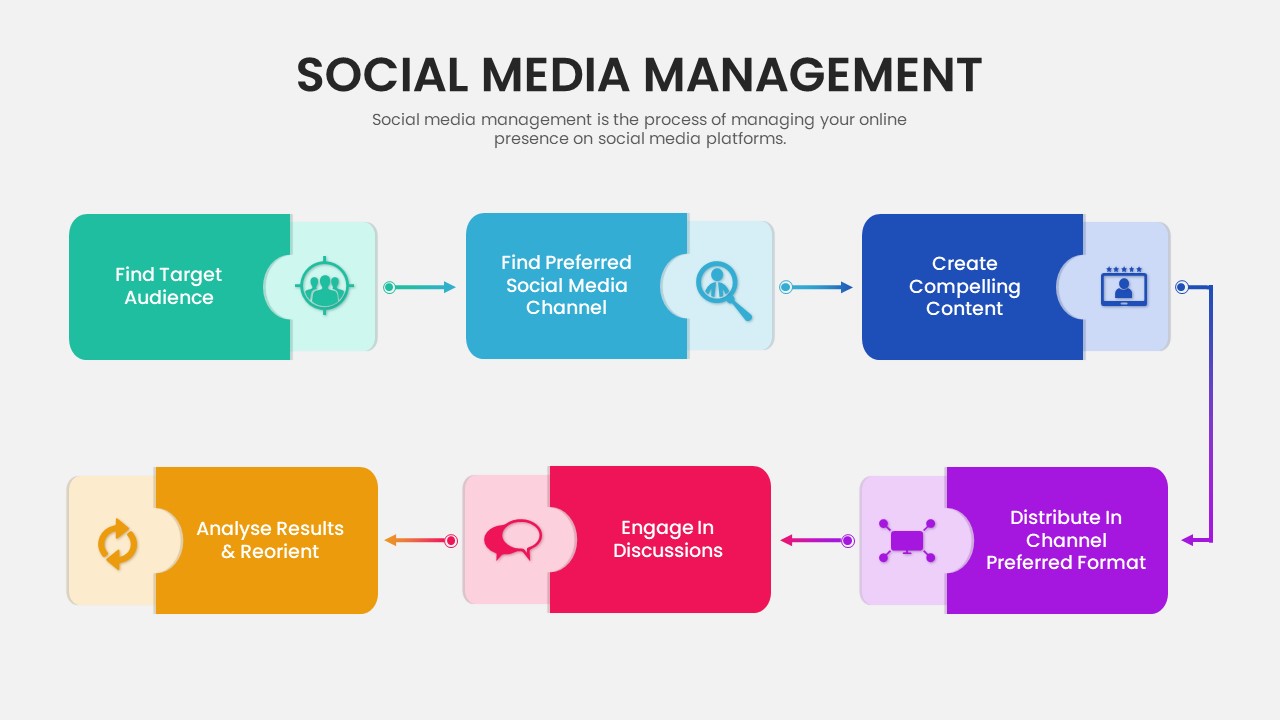
Six-Step Social Media Management Process Template for PowerPoint & Google Slides
Process
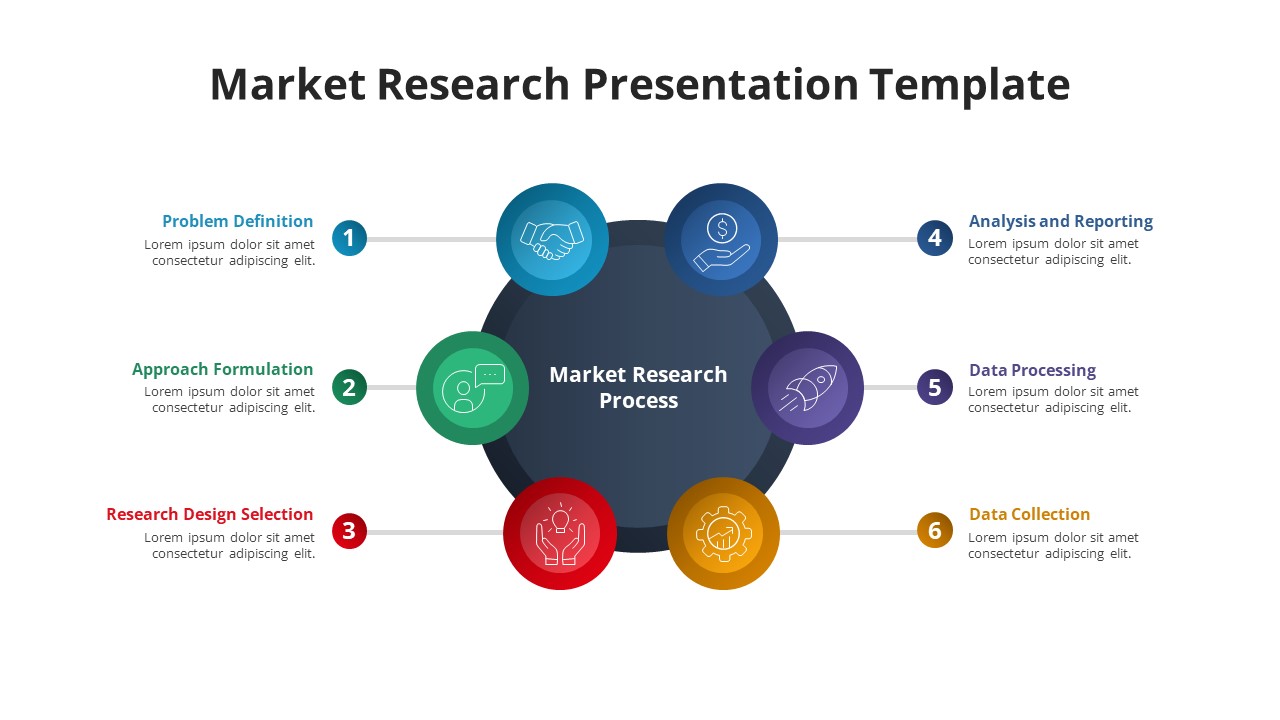
Free Six-Phase Market Research Process Template for PowerPoint & Google Slides
Process
Free
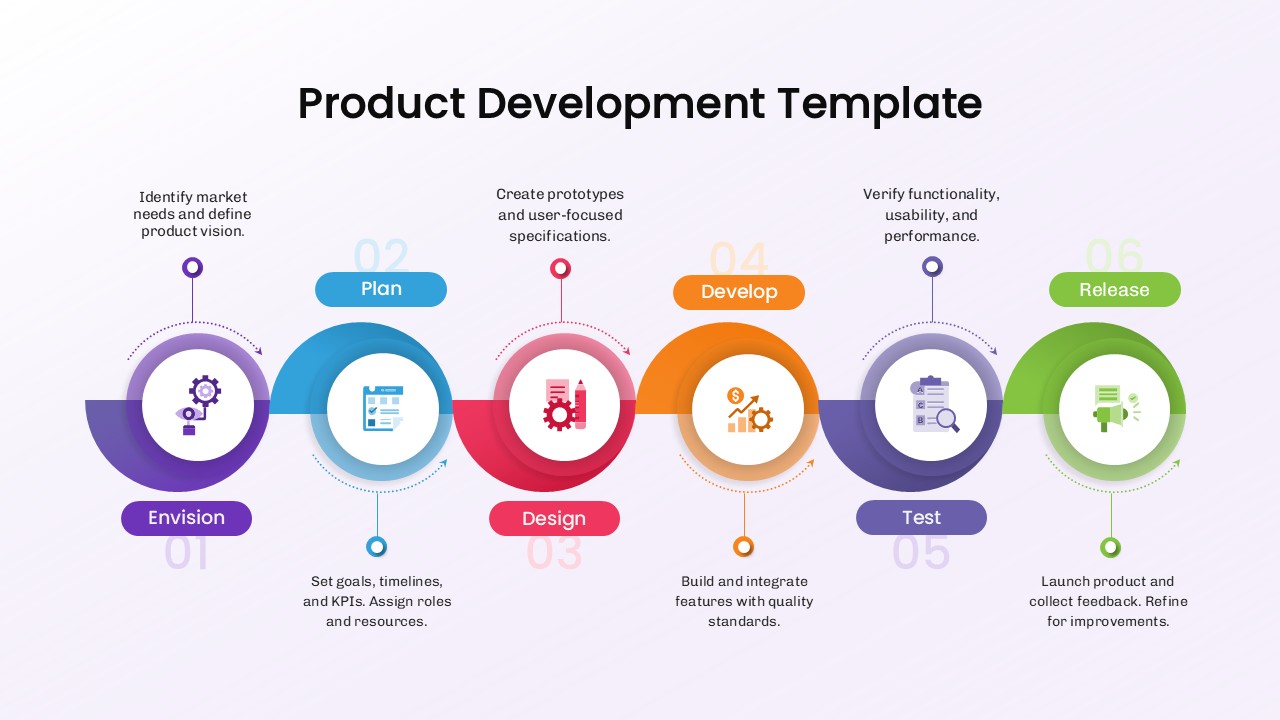
Six Stage Product Development Process Template for PowerPoint & Google Slides
Software Development
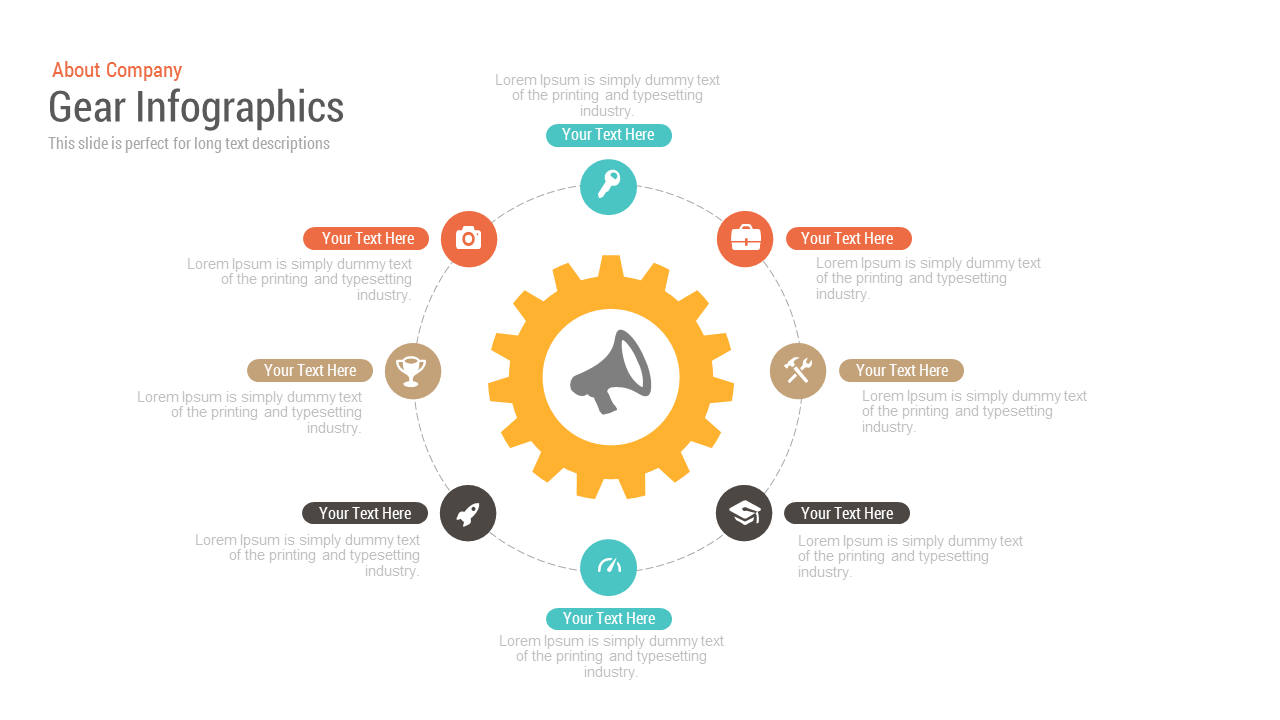
Free Gear Infographics template for PowerPoint & Google Slides
Process
Free
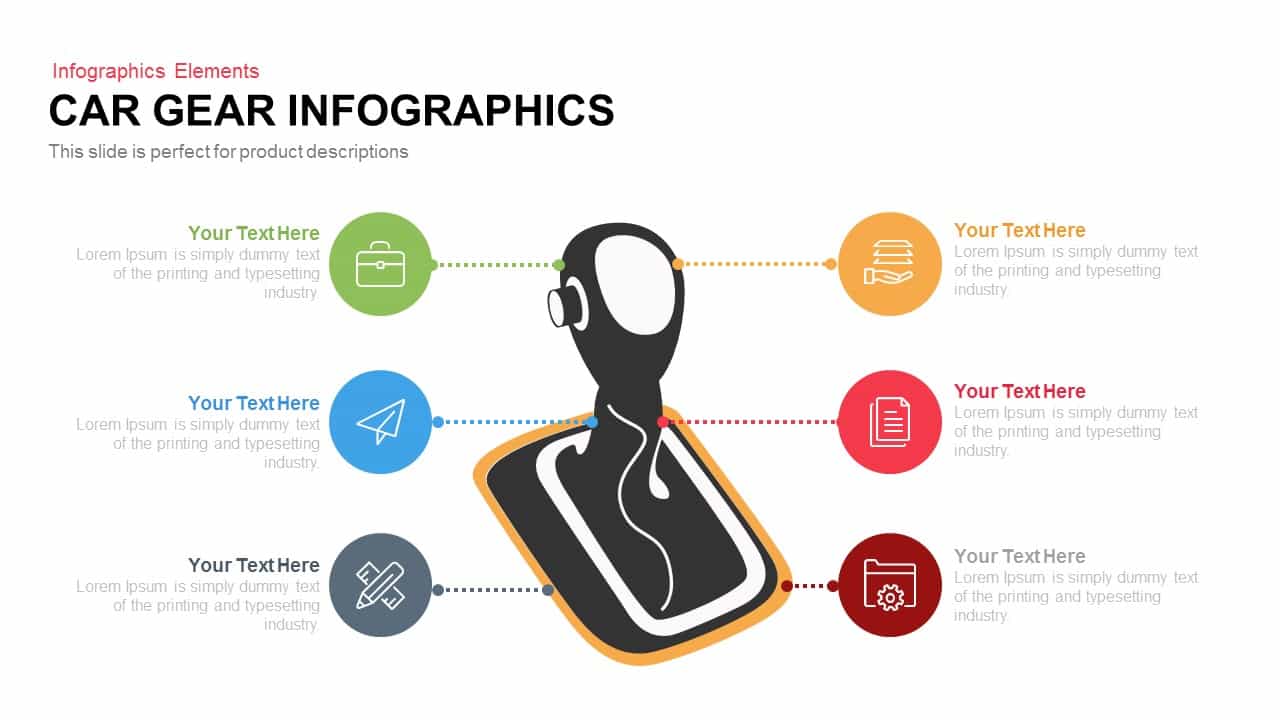
Car Gear Infographics Template for PowerPoint & Google Slides
Infographics
Brain Gear Hub-and-Spoke Infographics template for PowerPoint & Google Slides
Org Chart

Strategy Arrow and Gear Icons Template for PowerPoint & Google Slides
Infographics
Support Services Gear Infographic Template for PowerPoint & Google Slides
Business
Corporate Mission Statement Gear Slide Template for PowerPoint & Google Slides
Vision and Mission
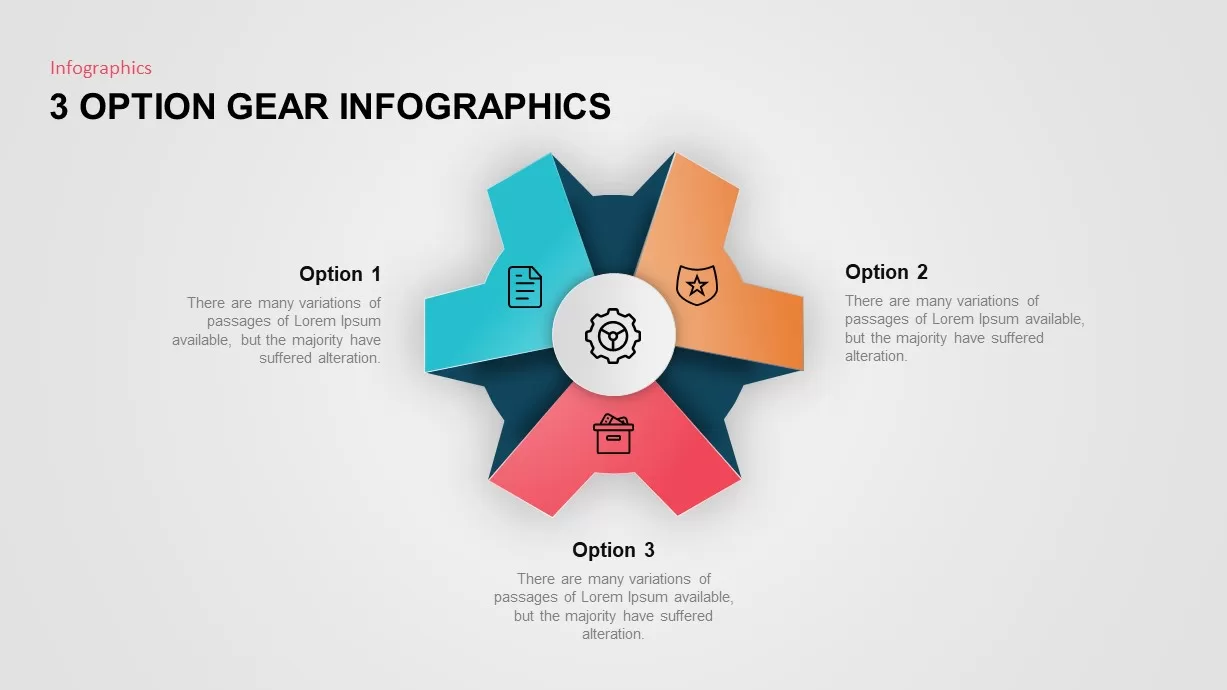
Three-Option Gear Infographic Pro Template for PowerPoint & Google Slides
Process
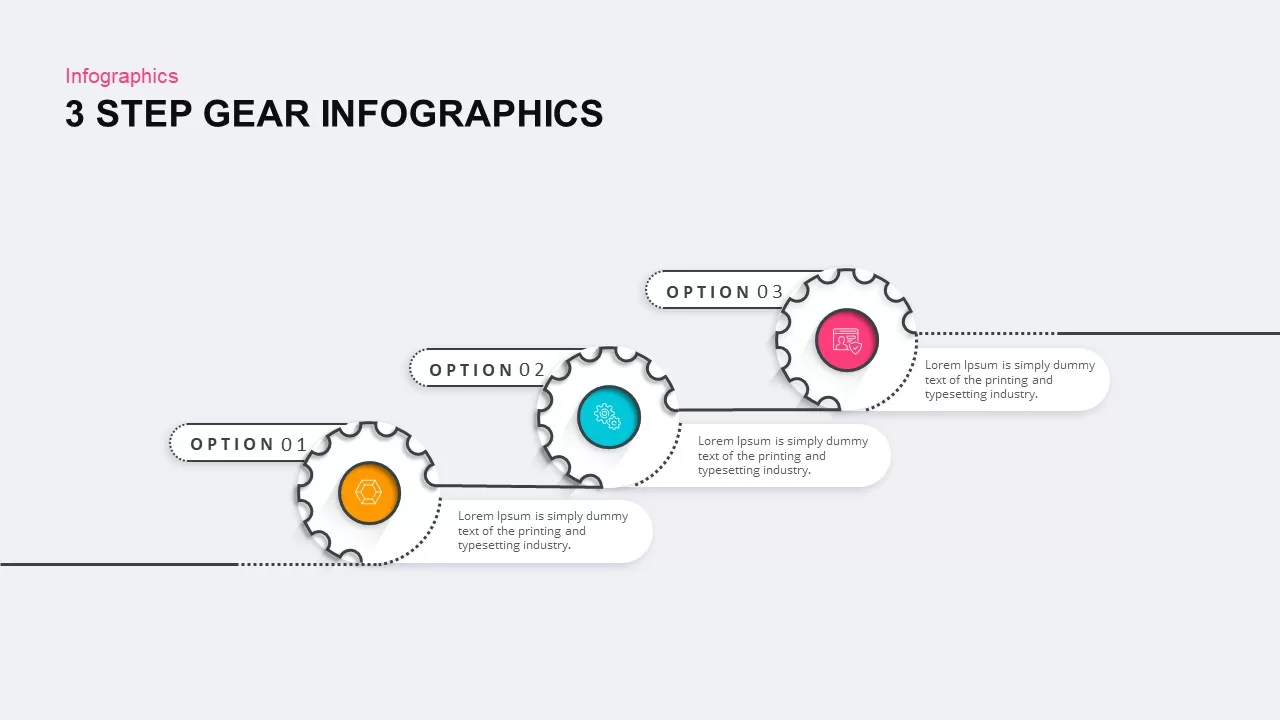
Three-Phase Planning Gear Infographic Template for PowerPoint & Google Slides
Process
3, 4, and 5 Step Gear Infographics Template for PowerPoint & Google Slides
Process
Animated Multi-Gear Cluster Infographic Template for PowerPoint & Google Slides
Process
Six Step Creative Circular Diagram Template for PowerPoint & Google Slides
Circular
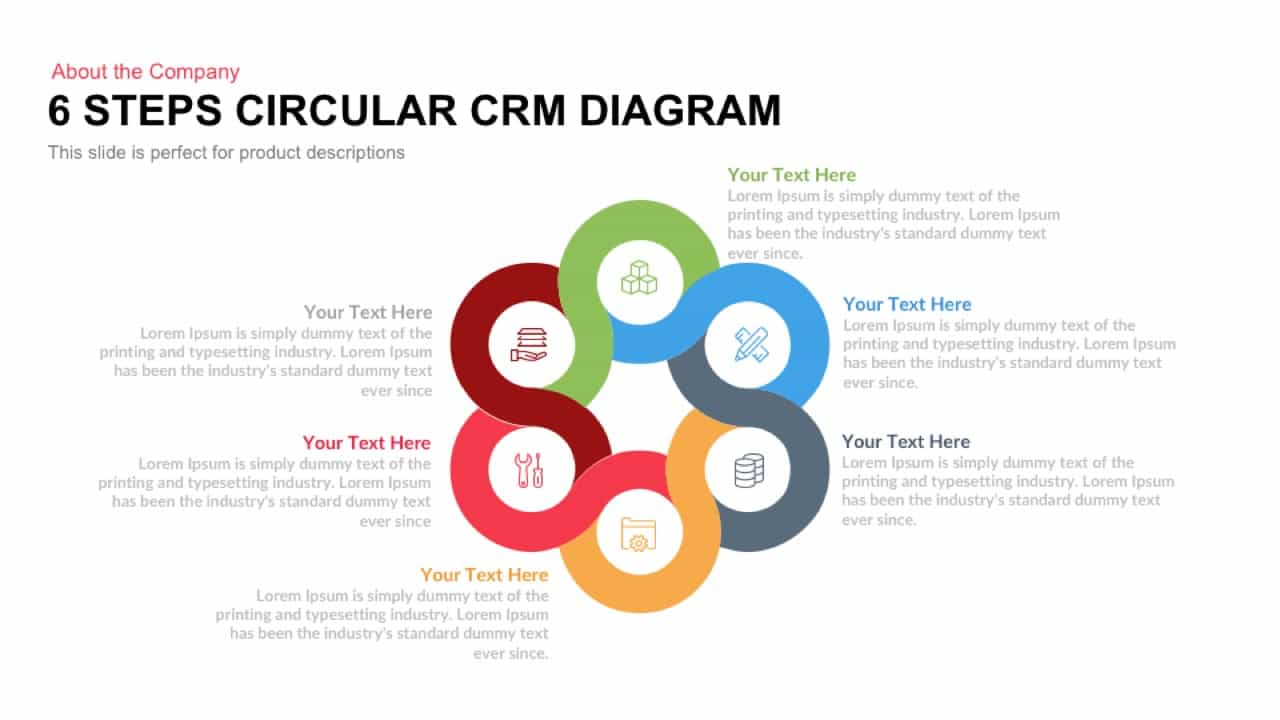
Six Steps Circular CRM Diagram Template for PowerPoint & Google Slides
Customer Journey
Six Section Circular Infographic Diagram Template for PowerPoint & Google Slides
Circular
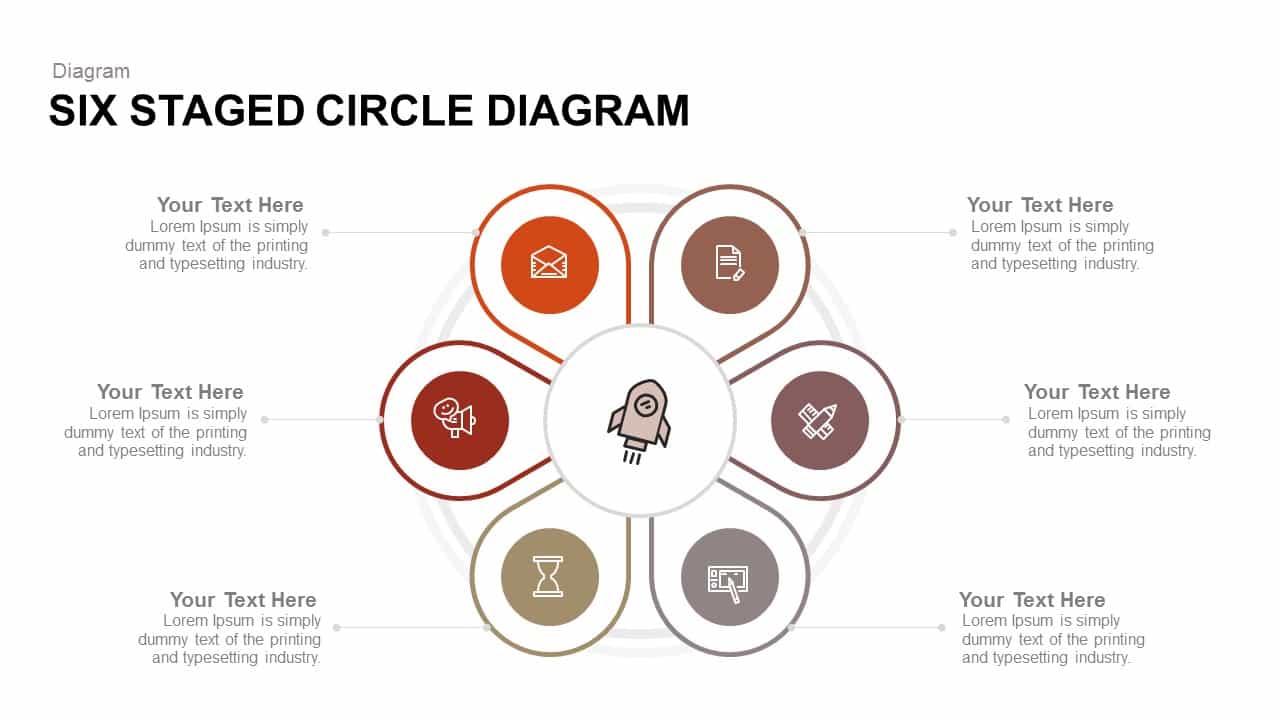
Six Staged Circle Diagram template for PowerPoint & Google Slides
Circular
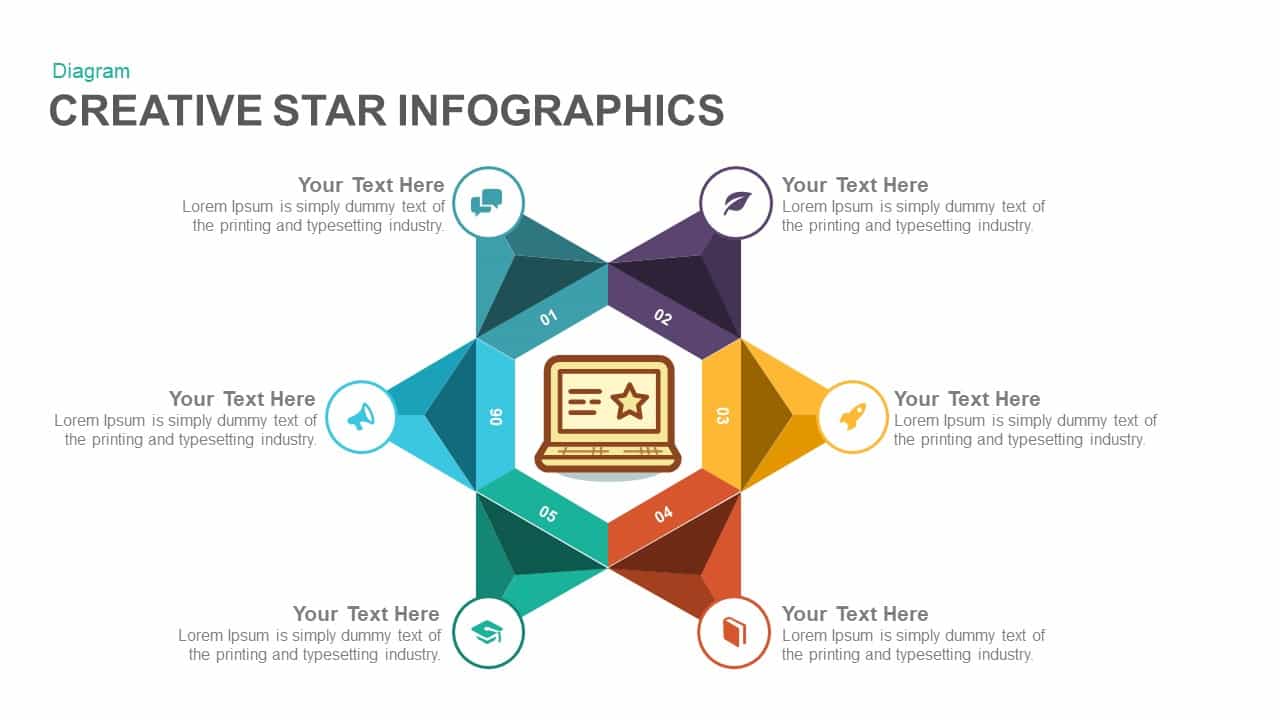
Six-Section Star Infographic Diagram Template for PowerPoint & Google Slides
Circular
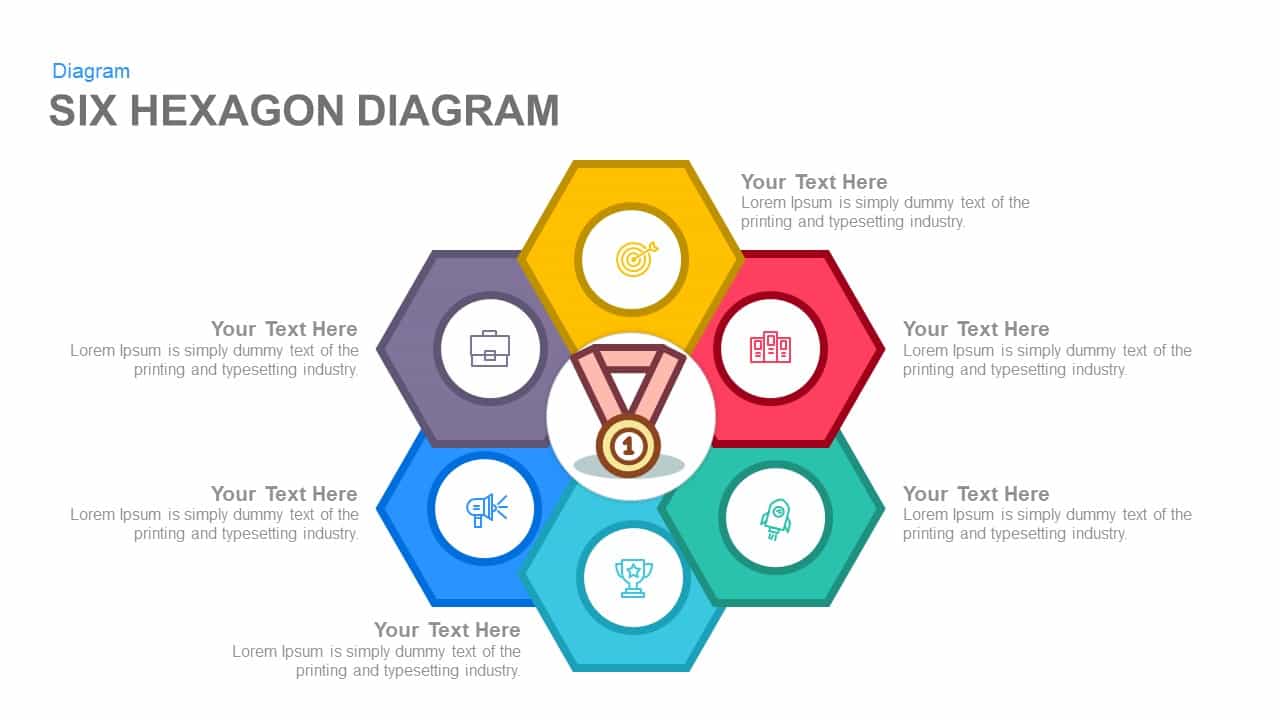
Six Hexagon Hub-and-Spoke Diagram Template for PowerPoint & Google Slides
Process
Six-Step Hexagonal Diagram Slide Template for PowerPoint & Google Slides
Circular
Greiner Growth Model Six-Phase Diagram Template for PowerPoint & Google Slides
Business Models
Six-Stage Circular Flow Diagram Template for PowerPoint & Google Slides
Circular
Circular 3D Cube Six-Segment Diagram Template for PowerPoint & Google Slides
Infographics
Stacked Cubes Pyramid Six-Option Diagram Template for PowerPoint & Google Slides
Pyramid
Six-Piece Puzzle Diagram Template for PowerPoint & Google Slides
Process