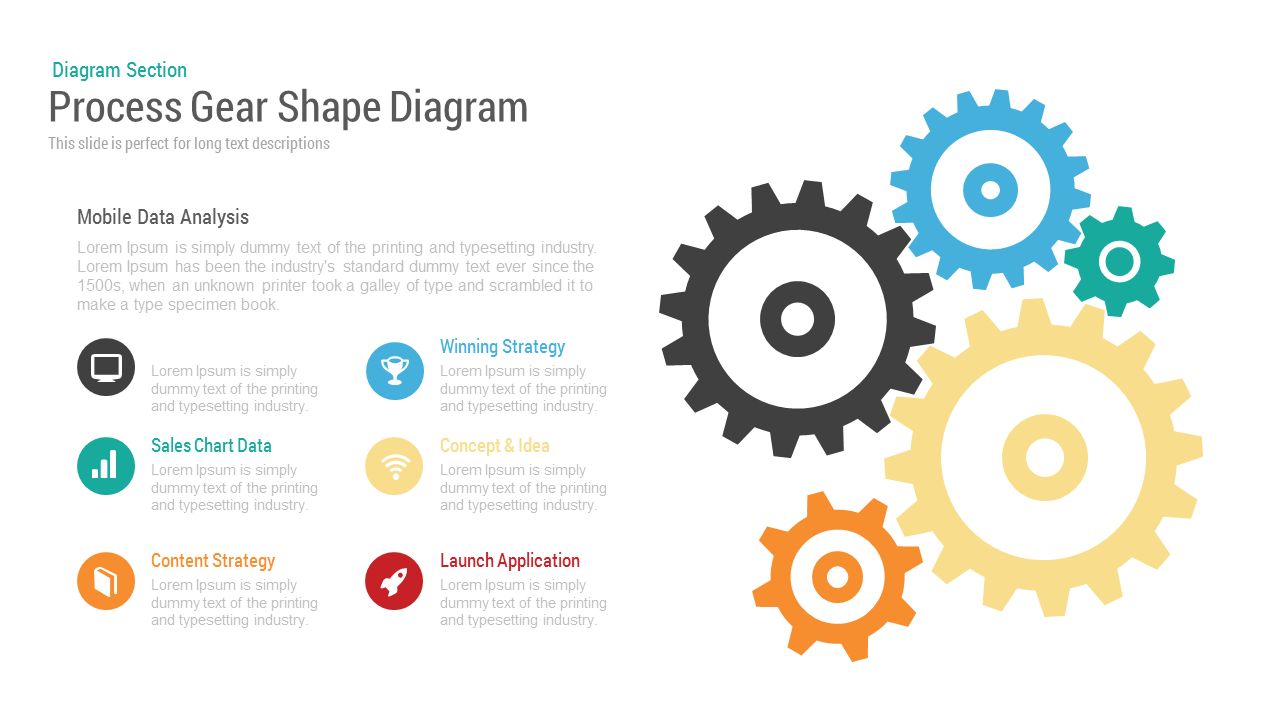
Sales Process Improvement Gear Diagram Template for PowerPoint & Google Slides
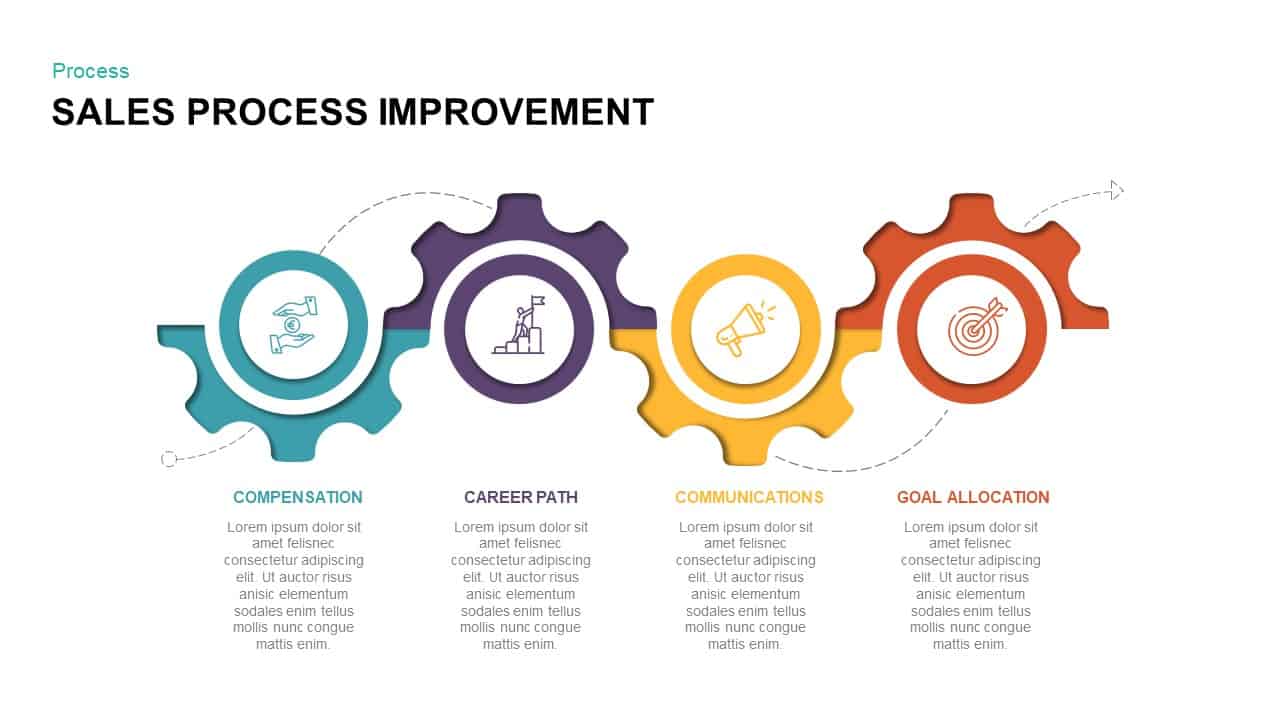
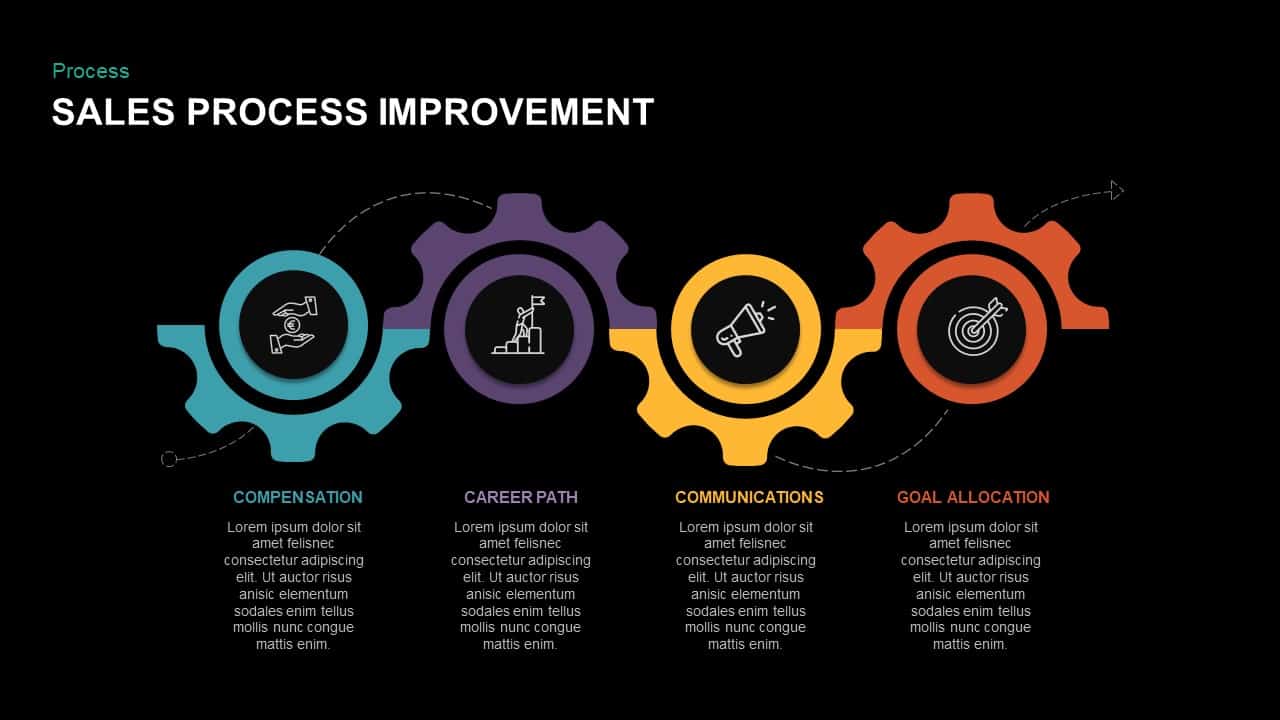


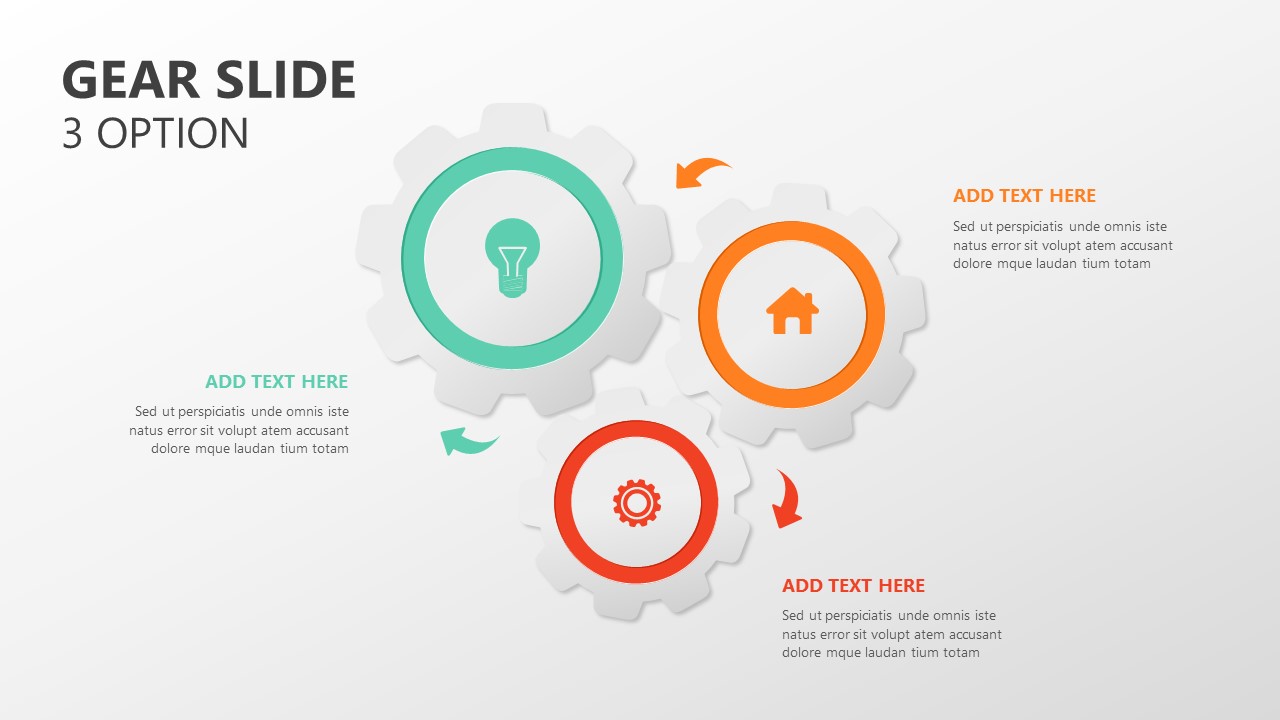
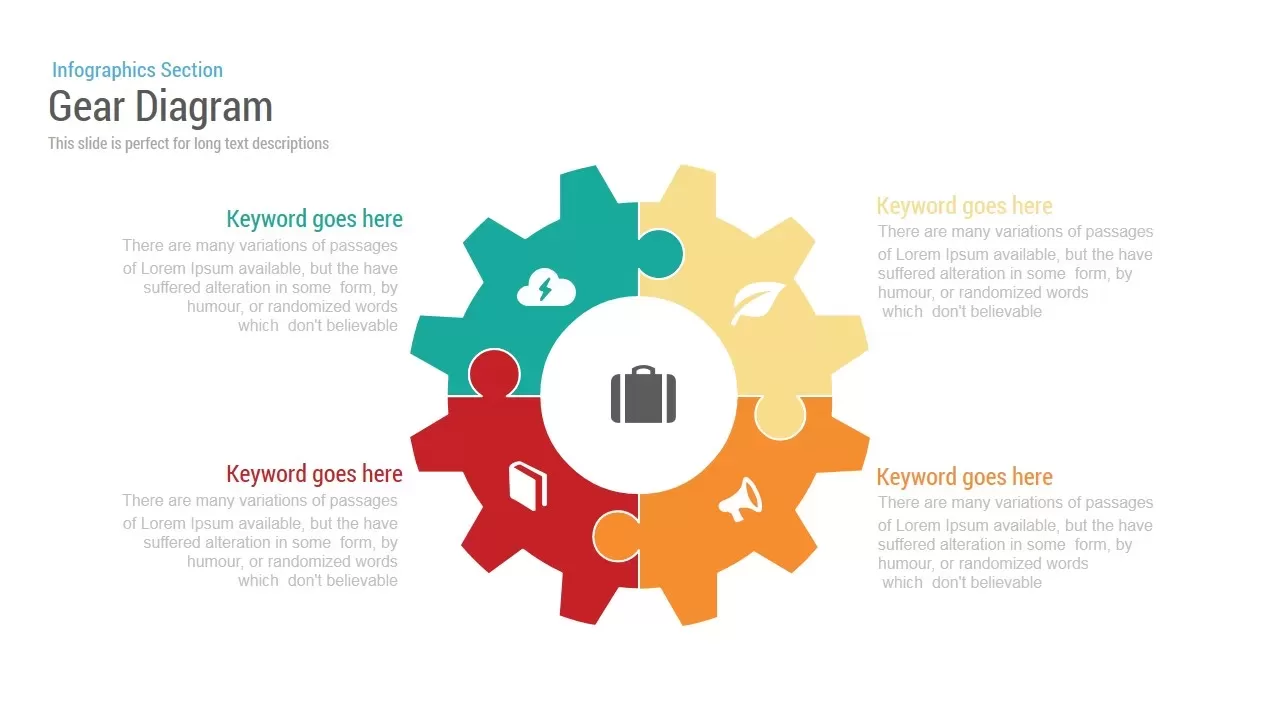
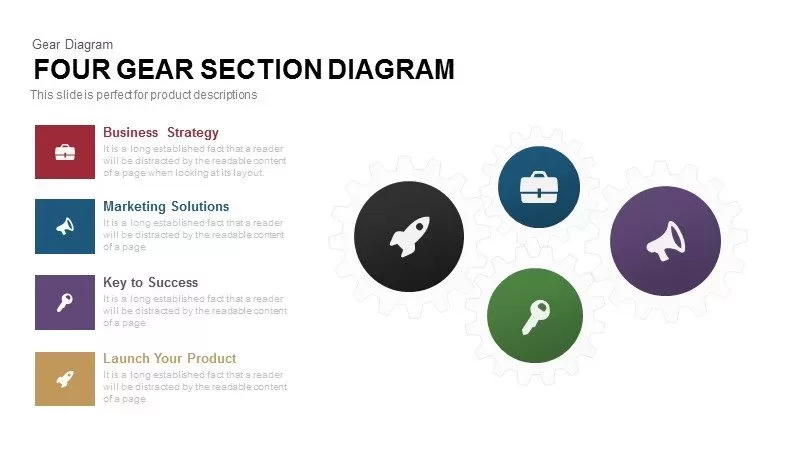
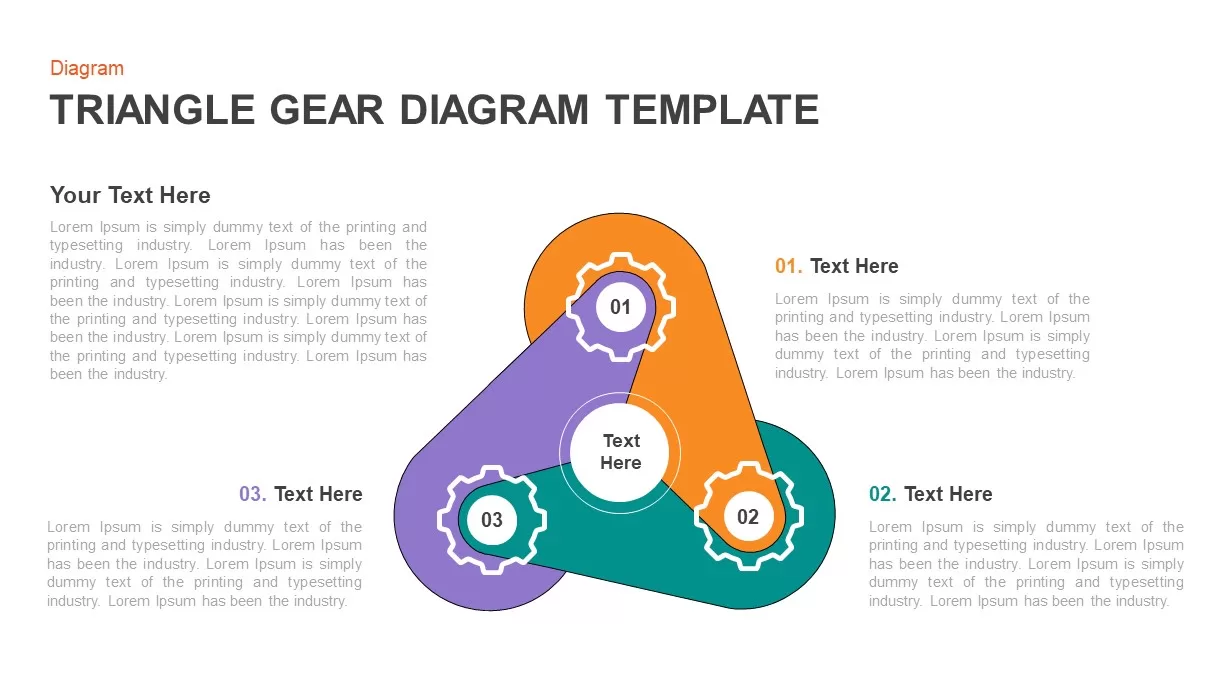
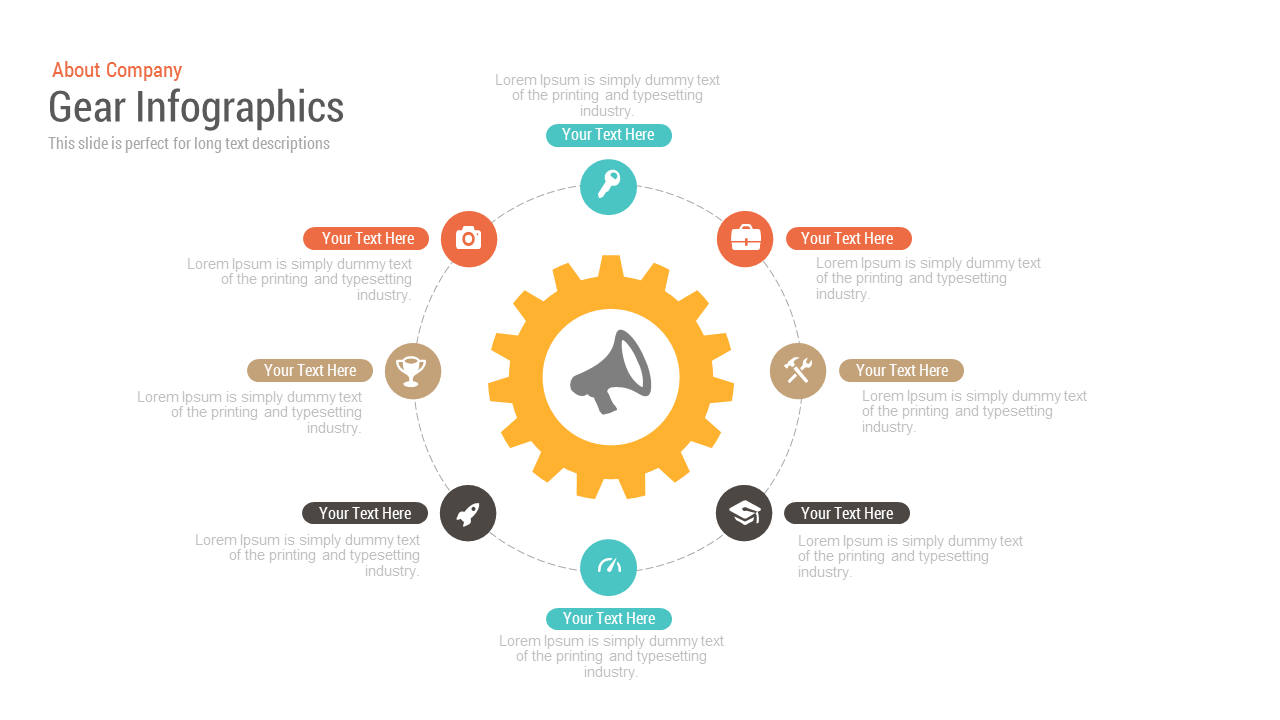
Leverage this dynamic gear diagram slide to map and enhance your sales process improvement initiatives with clarity and visual impact. Four interconnected gear-shaped icons represent Compensation, Career Path, Communications, and Goal Allocation, each featuring a customizable flat icon, bold label, and text placeholder for concise descriptions or metrics. Dotted arrows guide viewers through the sequential flow, while subtle drop shadows add depth against a clean white background. The vibrant palette—teal, purple, yellow, and orange—draws attention to each stage, ensuring key points stand out in boardrooms, webinars, or printed handouts.
Built on master slides, this template offers seamless customization and rapid editing: swap icons for industry-specific visuals, adjust color accents to align with corporate branding, and update labels or descriptions in seconds. Vector-based gear shapes maintain pixel-perfect clarity across any display, from high-resolution monitors to mobile devices. Logical layer grouping and intuitive placeholder structures allow you to reorder or duplicate steps, remove stages, or integrate additional text boxes without disrupting the overall layout. Fully compatible with both PowerPoint and Google Slides, this asset eliminates formatting headaches and preserves consistent styling across platforms.
Ideal for sales leaders, HR managers, and process improvement specialists, this slide empowers you to communicate complex workflows and stakeholder incentives in a single, engaging infographic. Use it to align compensation plans with performance goals, outline career development pathways, streamline internal communications, or allocate targets across teams. The gear motif reinforces the idea of interconnected systems and continuous optimization, making your message both memorable and actionable.
Who is it for
Sales directors, HR professionals, process improvement consultants, and training facilitators will benefit from this diagram when outlining incentive structures, career roadmaps, or communications strategies to cross-functional teams and executives.
Other Uses
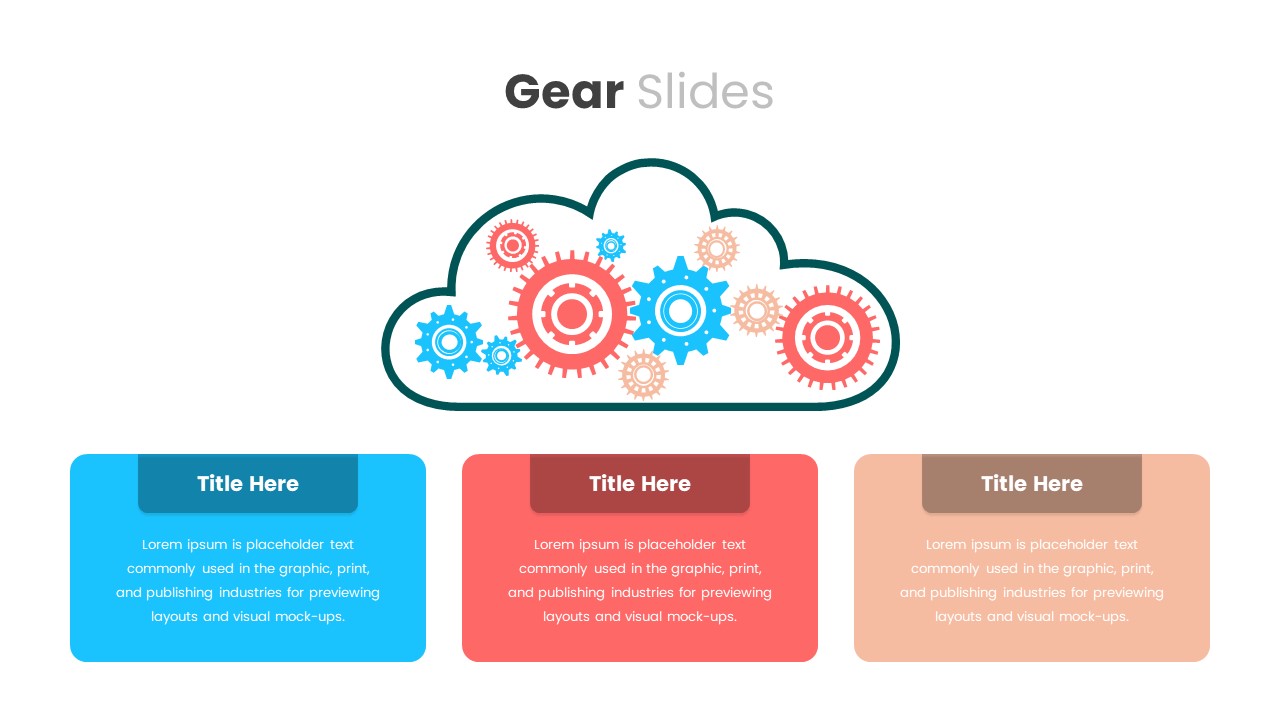
Repurpose this layout to visualize product development cycles, cross-departmental collaborations, operational workflows, or KPI alignment processes. Adjust gear count, colors, or labels to suit any multi-step narrative in marketing, operations, or project management.
Login to download this file

Item ID
SB01442
Related Templates

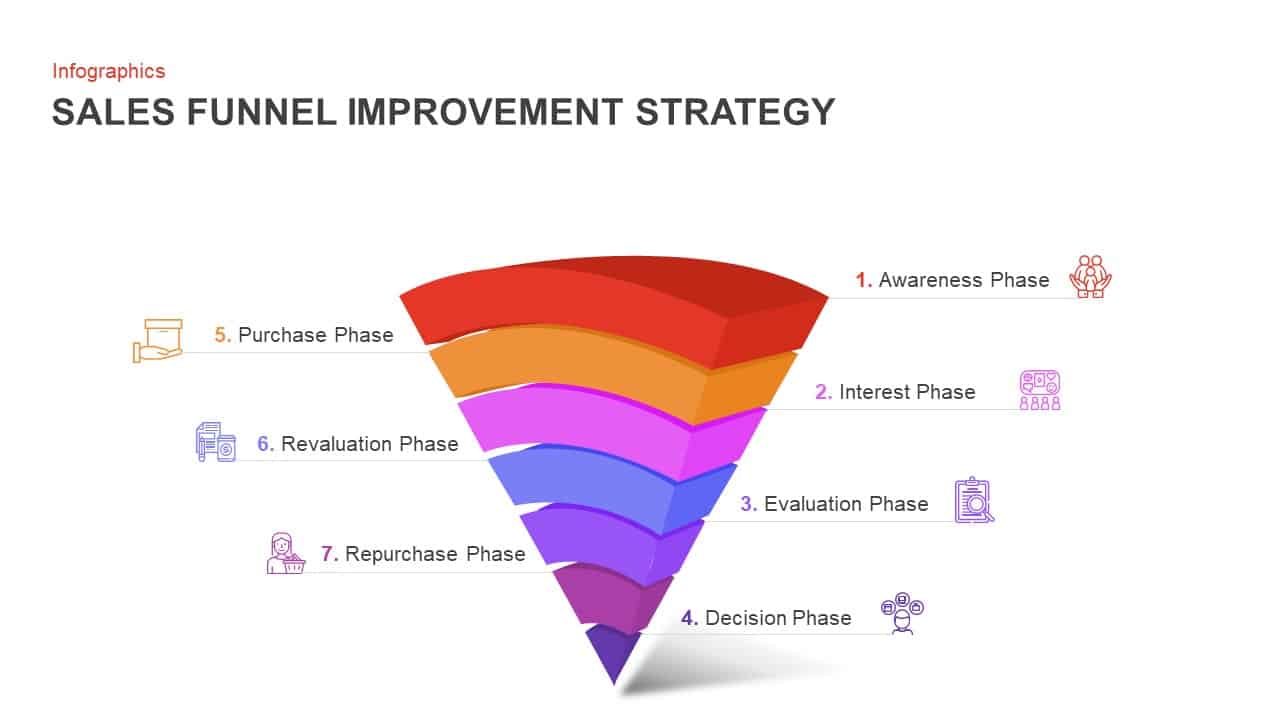
7-Step Sales Funnel Improvement Strategy Template for PowerPoint & Google Slides
Infographics

Process Improvement Metaphor Diagram Template for PowerPoint & Google Slides
Process
Circular Improvement Process Diagram Template for PowerPoint & Google Slides
Process
As Is to Be Process Improvement Diagram Template for PowerPoint & Google Slides
Business Strategy
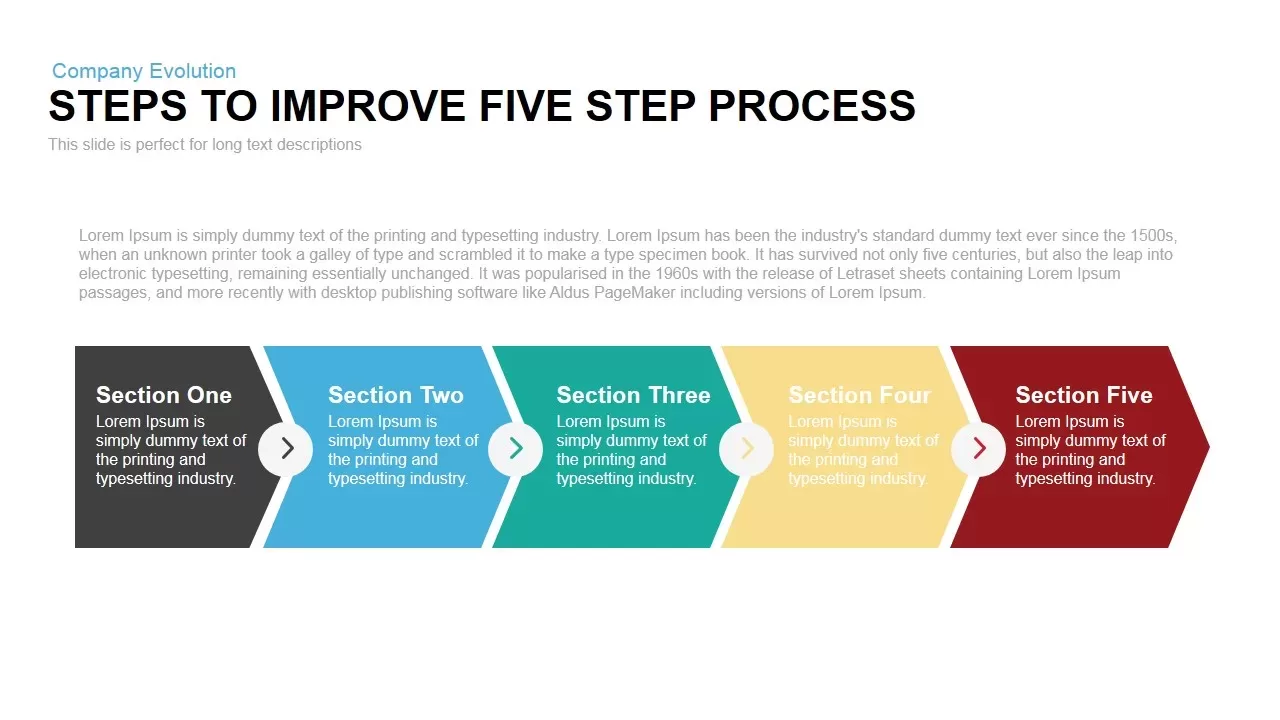
Five-Step Process Improvement Template for PowerPoint & Google Slides
Process

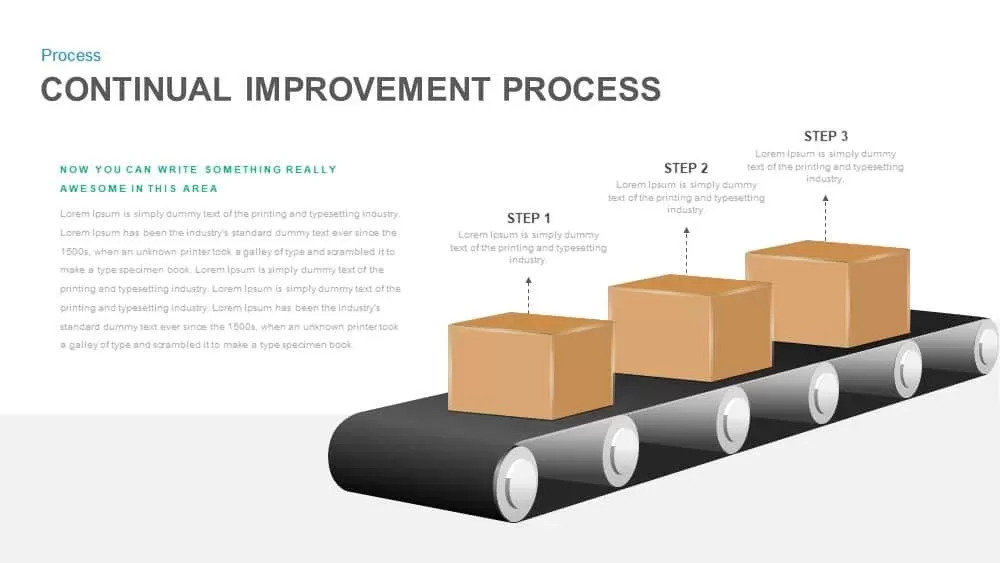
Continual Improvement Process Conveyor Template for PowerPoint & Google Slides
Process
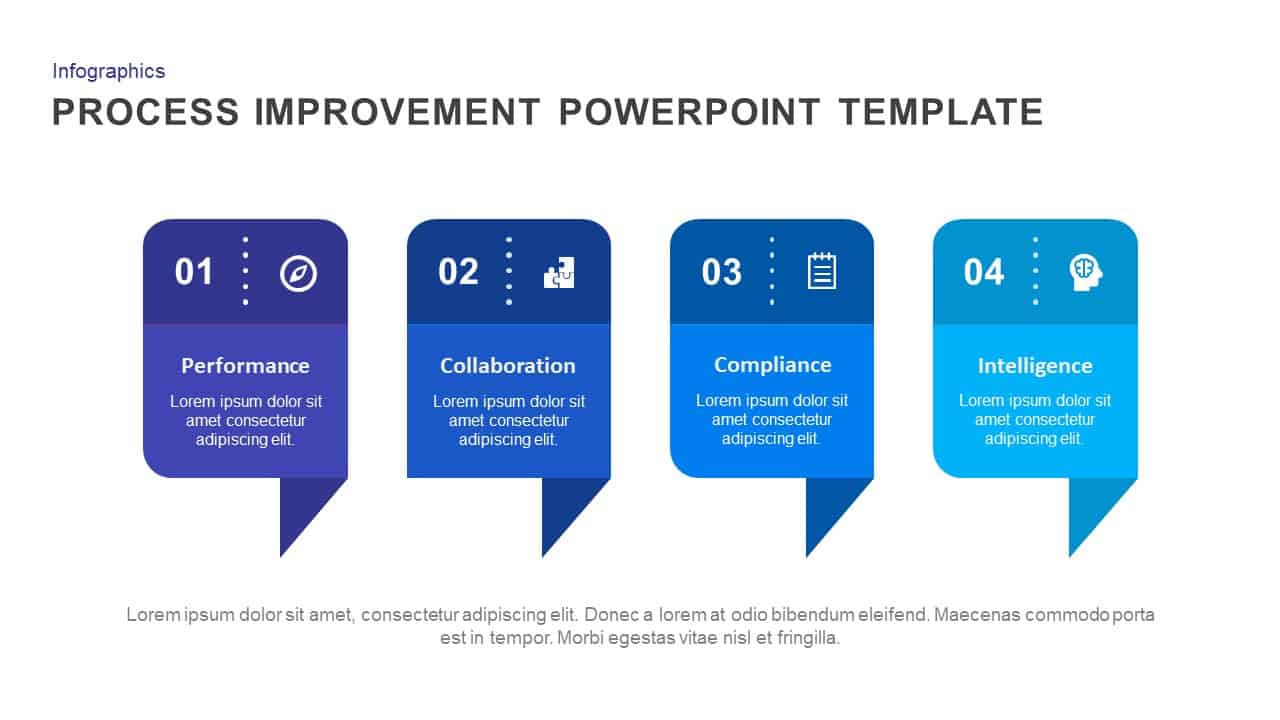
Process Improvement template for PowerPoint & Google Slides
Process
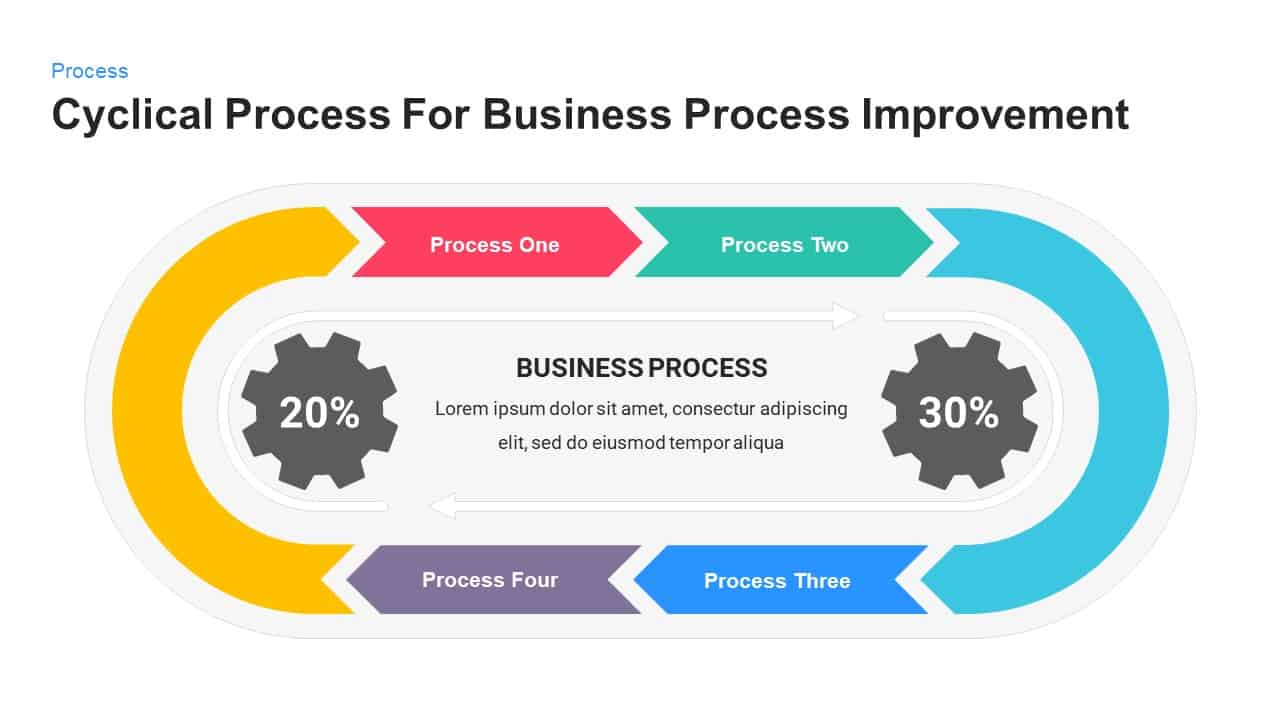
Business Process Improvement Cycle Template for PowerPoint & Google Slides
Process
Business Process Improvement Cycle Template for PowerPoint & Google Slides
Circular

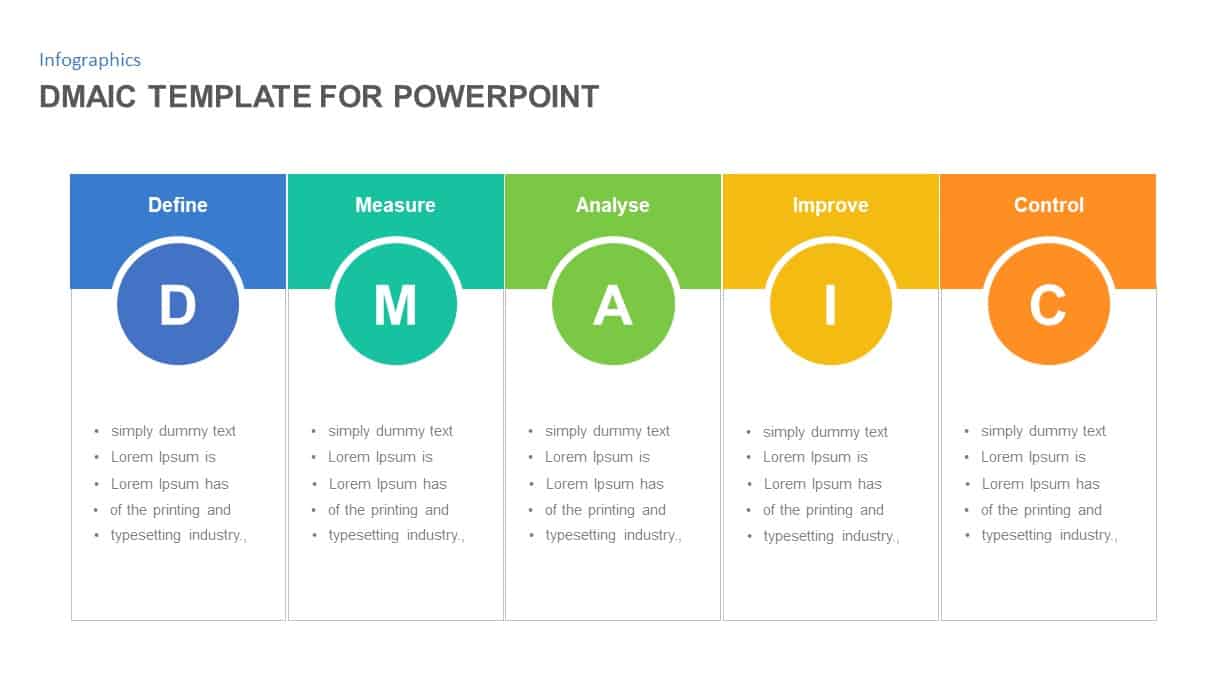
DMAIC Process Improvement Infographic Template for PowerPoint & Google Slides
Process
Process improvement roadmap template for PowerPoint & Google Slides
Process
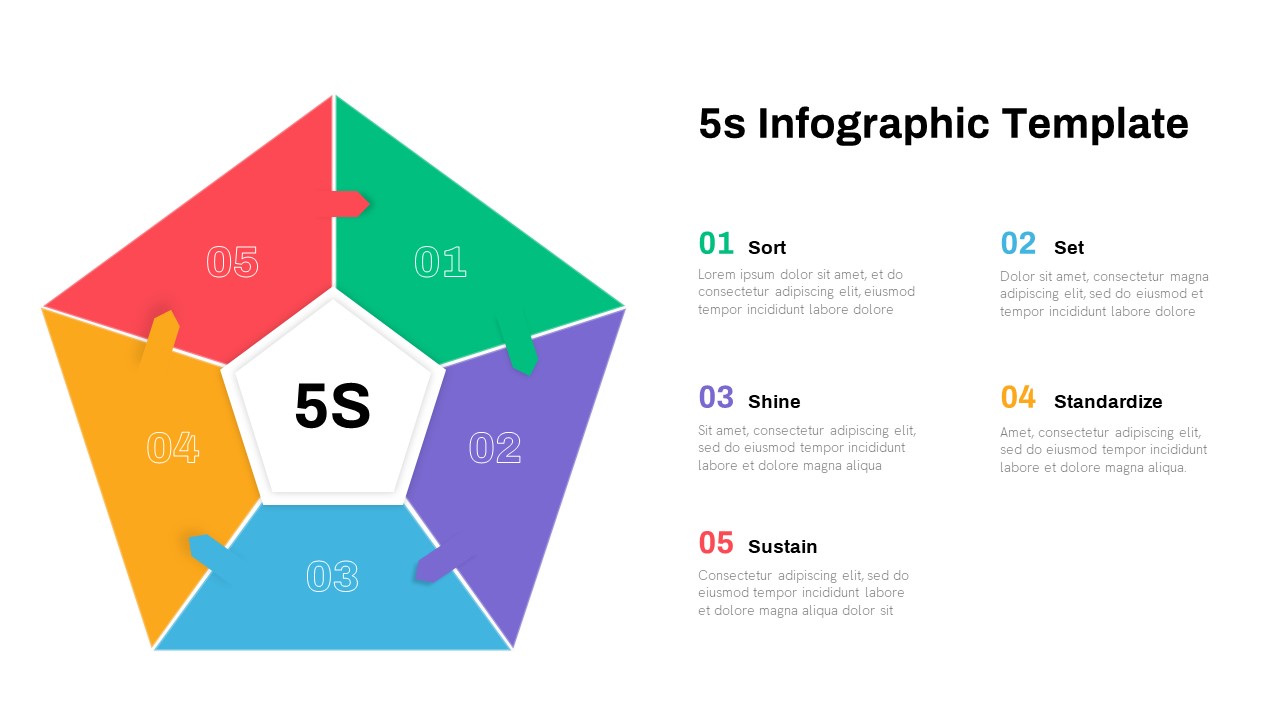
5S Lean Process Improvement Infographic Template for PowerPoint & Google Slides
Business Strategy
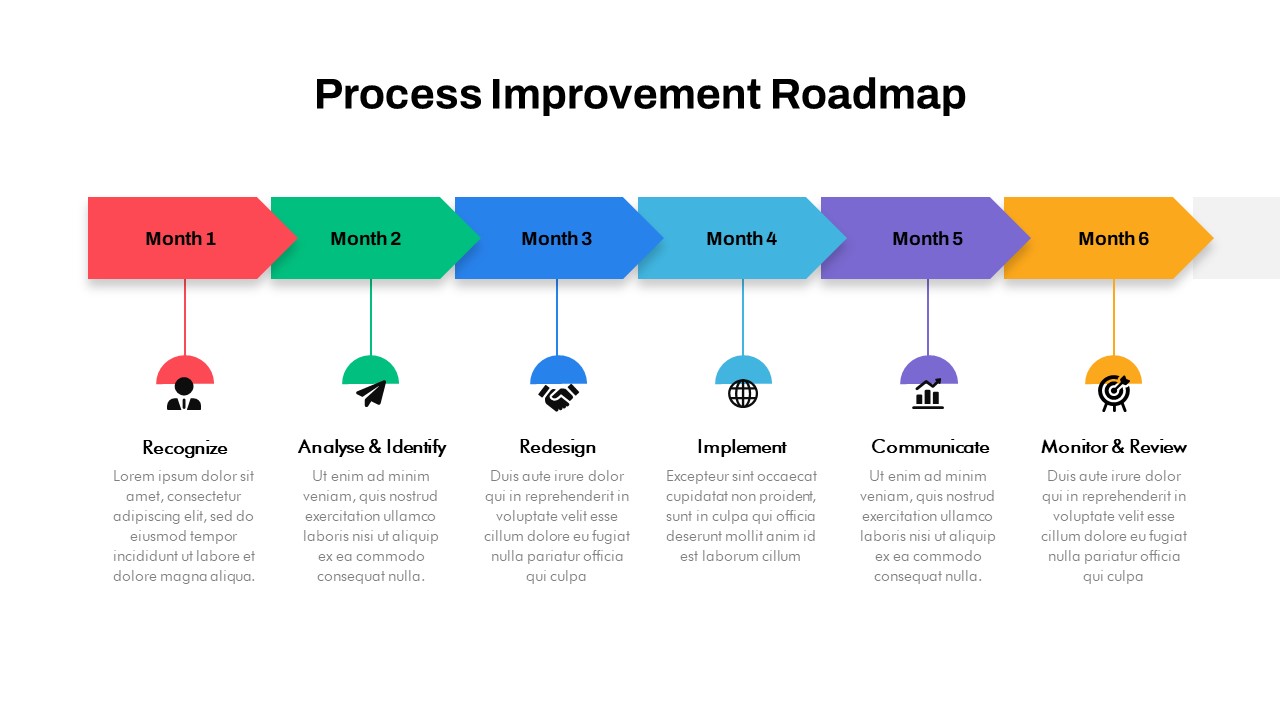
Process Improvement Roadmap Template for PowerPoint & Google Slides
Infographics
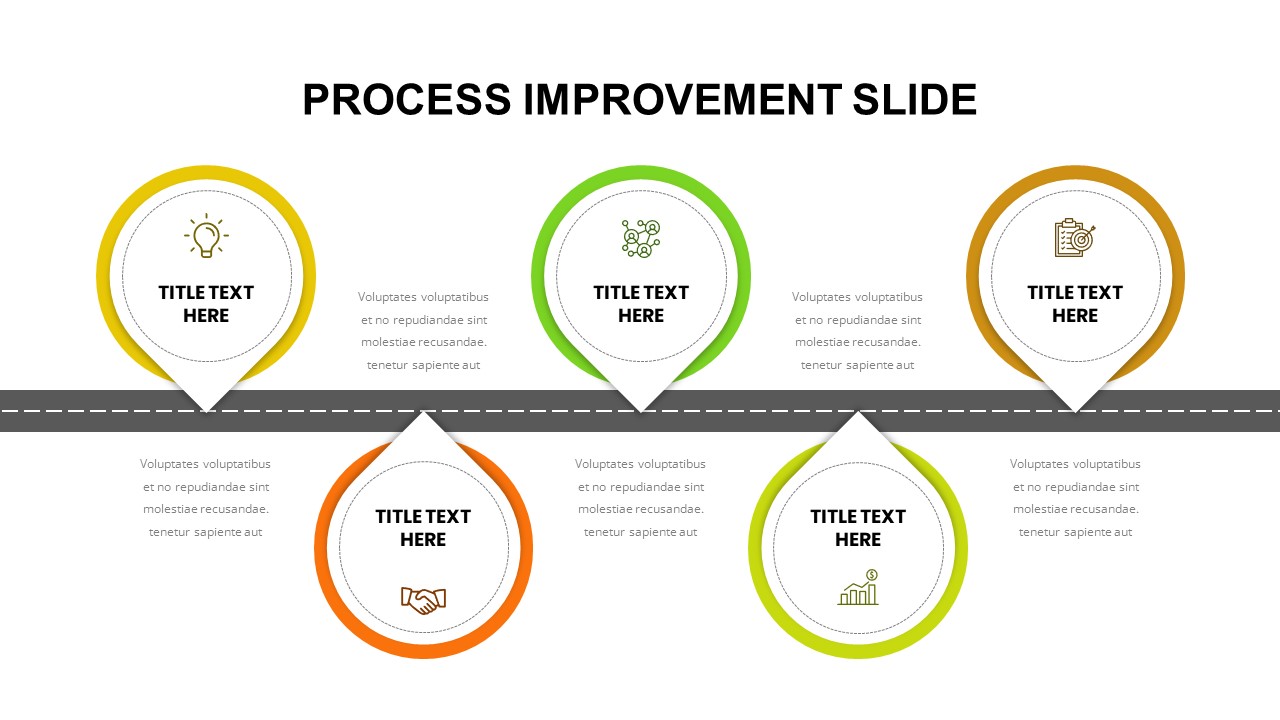
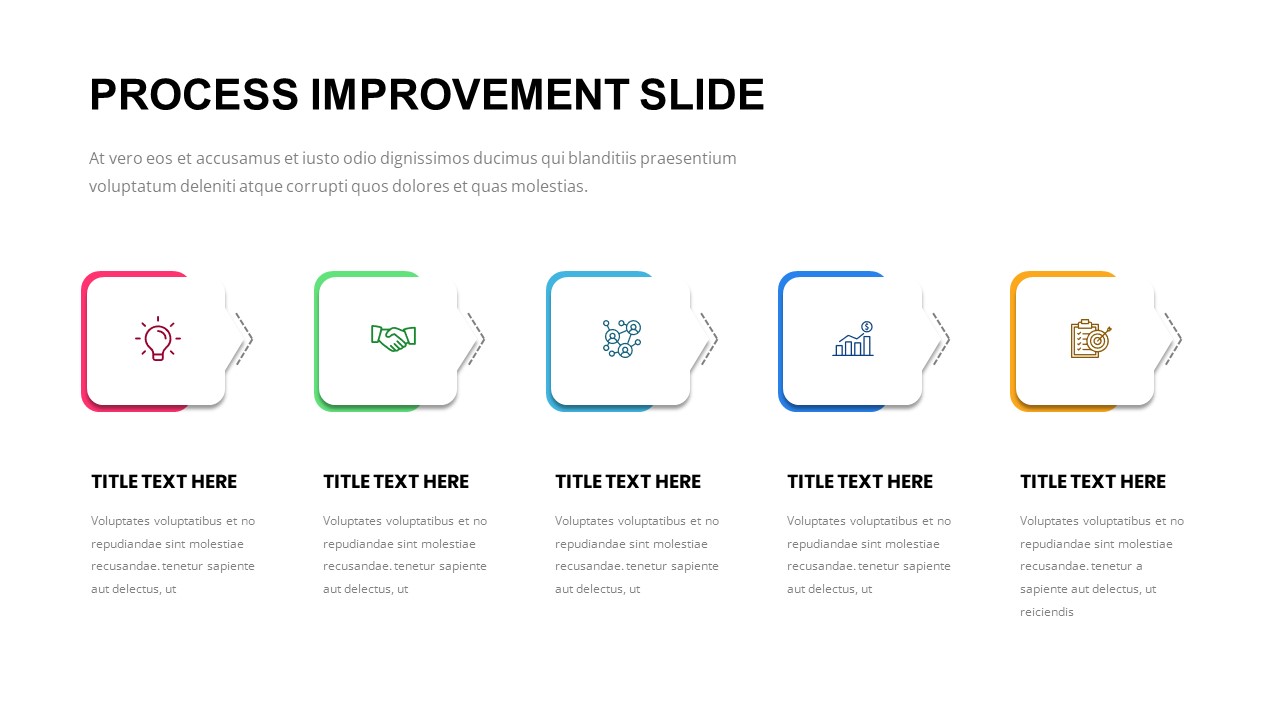
Process Improvement Slide for PowerPoint & Google Slides
Business Proposal
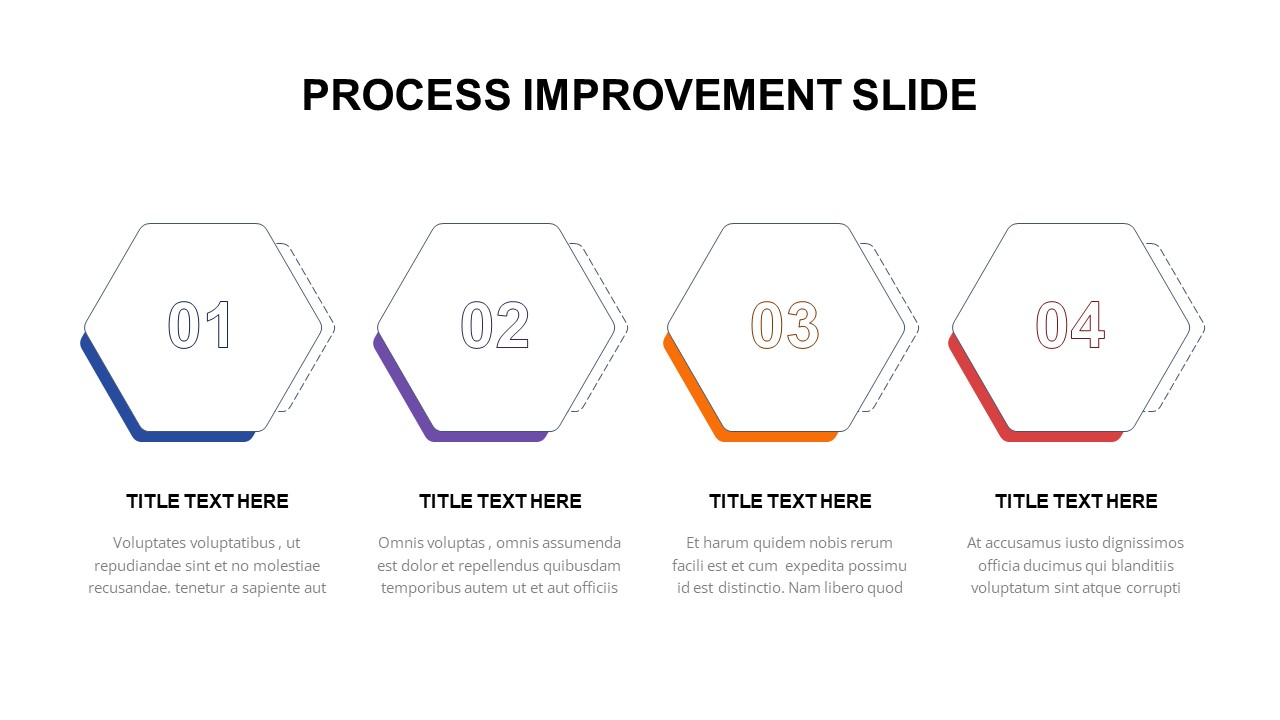
4 Step Process Improvement for PowerPoint & Google Slides
Process
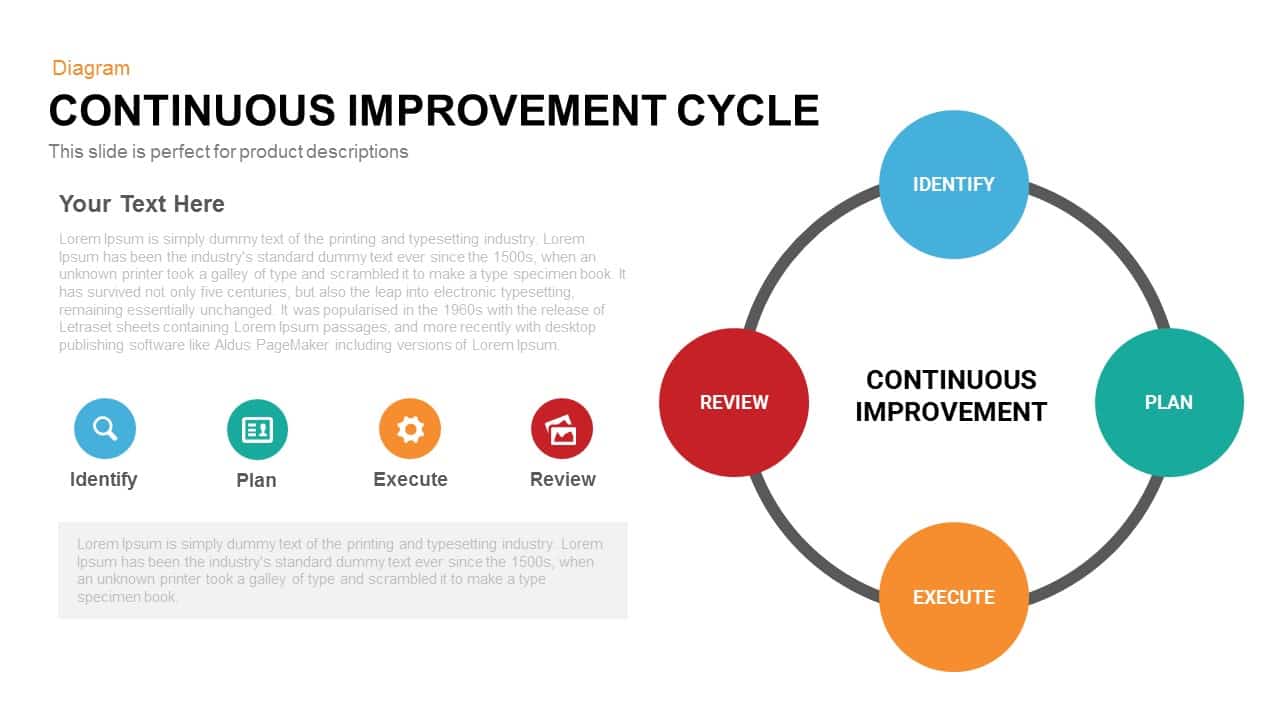
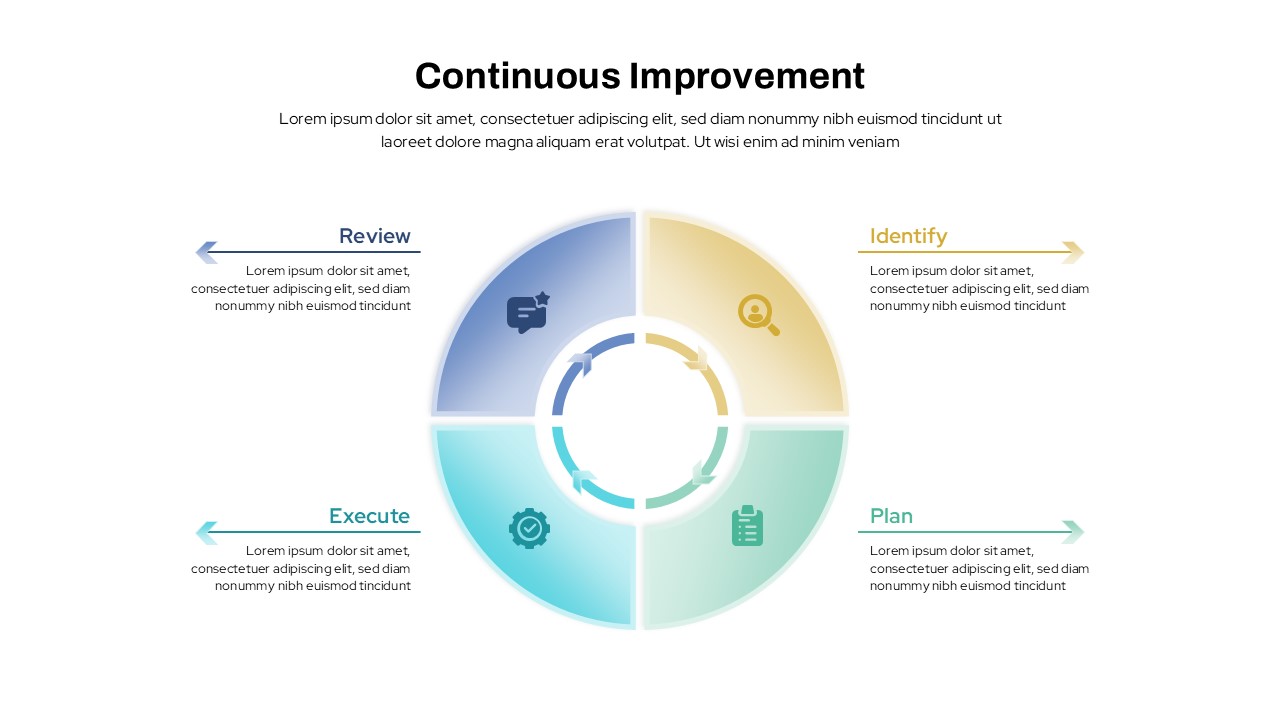
Continuous Improvement Cycle Diagram Template for PowerPoint & Google Slides
Circular
Continuous Improvement Cycle Diagram Template for PowerPoint & Google Slides
Process
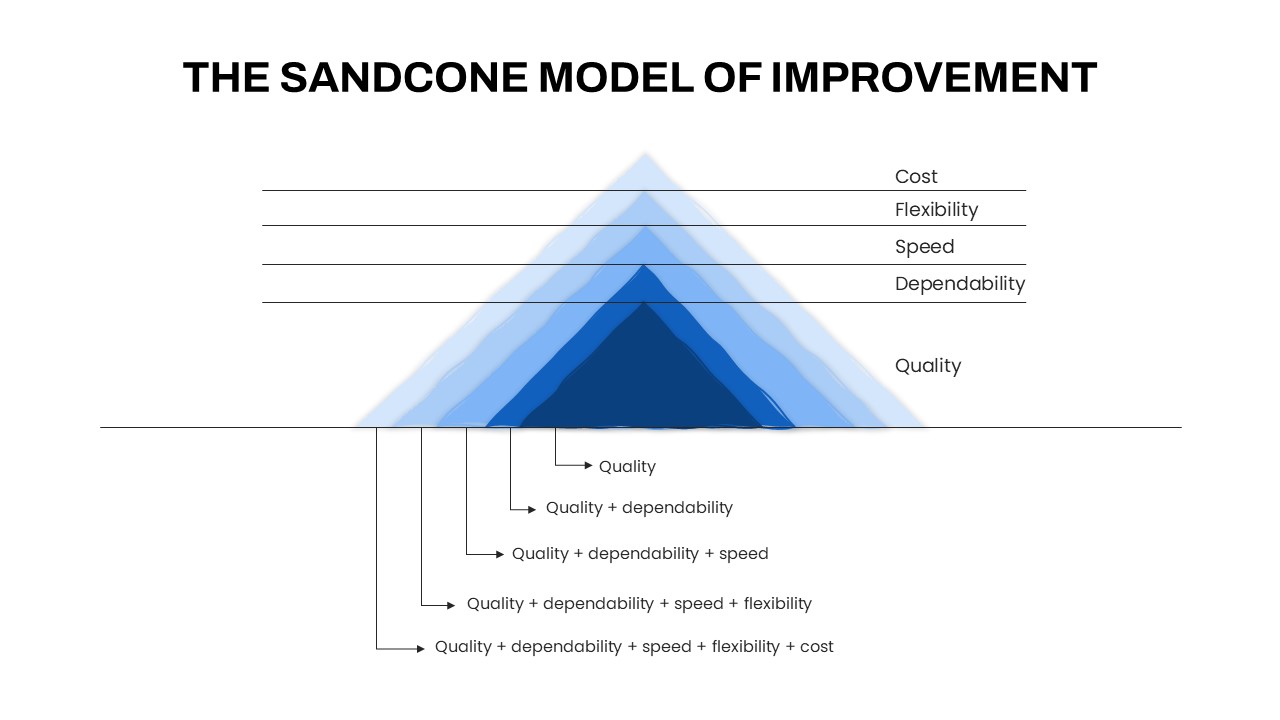
Sandcone Model of Improvement Diagram Template for PowerPoint & Google Slides
Pyramid
Continuous Improvement Cycle Diagram Template for PowerPoint & Google Slides
Process
Gear Process Diagram PowerPoint Template for PowerPoint & Google Slides
Process
Gear Process Diagram template for PowerPoint & Google Slides
Process
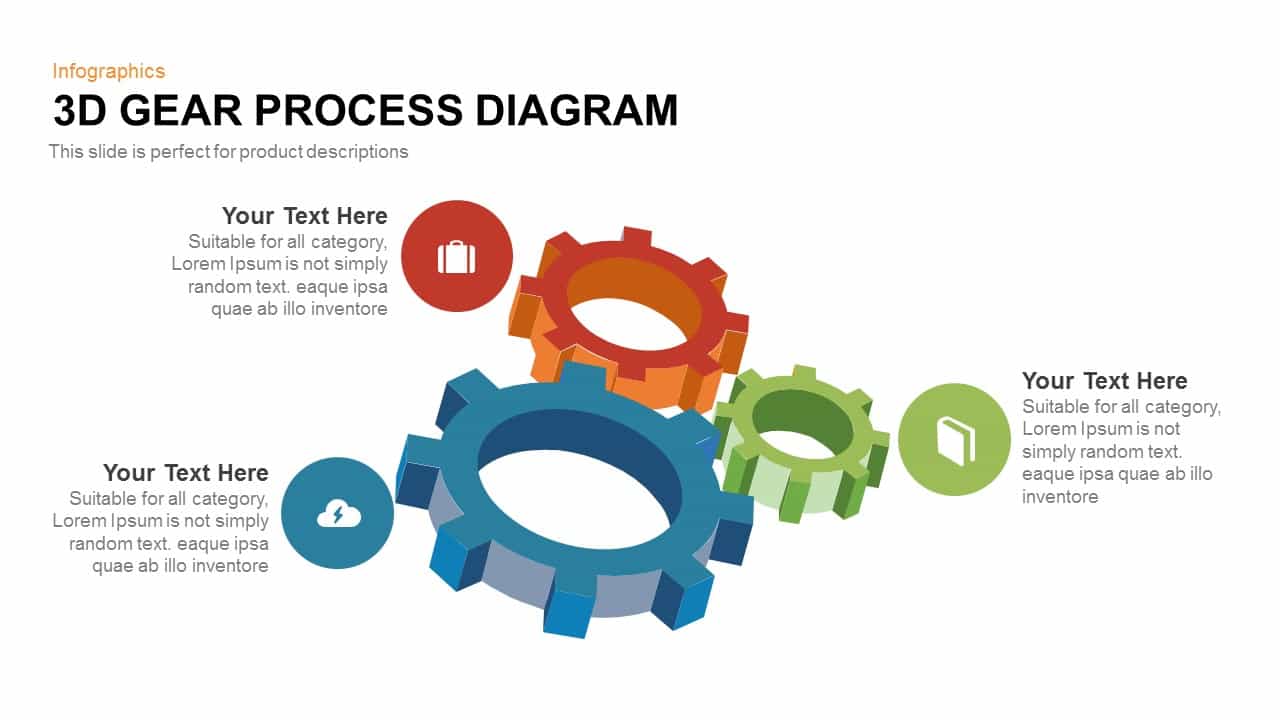
Professional 3D Gear Process Diagram Template for PowerPoint & Google Slides
Process
Gear Process Phase Diagram template for PowerPoint & Google Slides
Process

Five-Step Gear Process Diagram Template for PowerPoint & Google Slides
Process
Dynamic 4 Gear Process Diagram Template for PowerPoint & Google Slides
Process
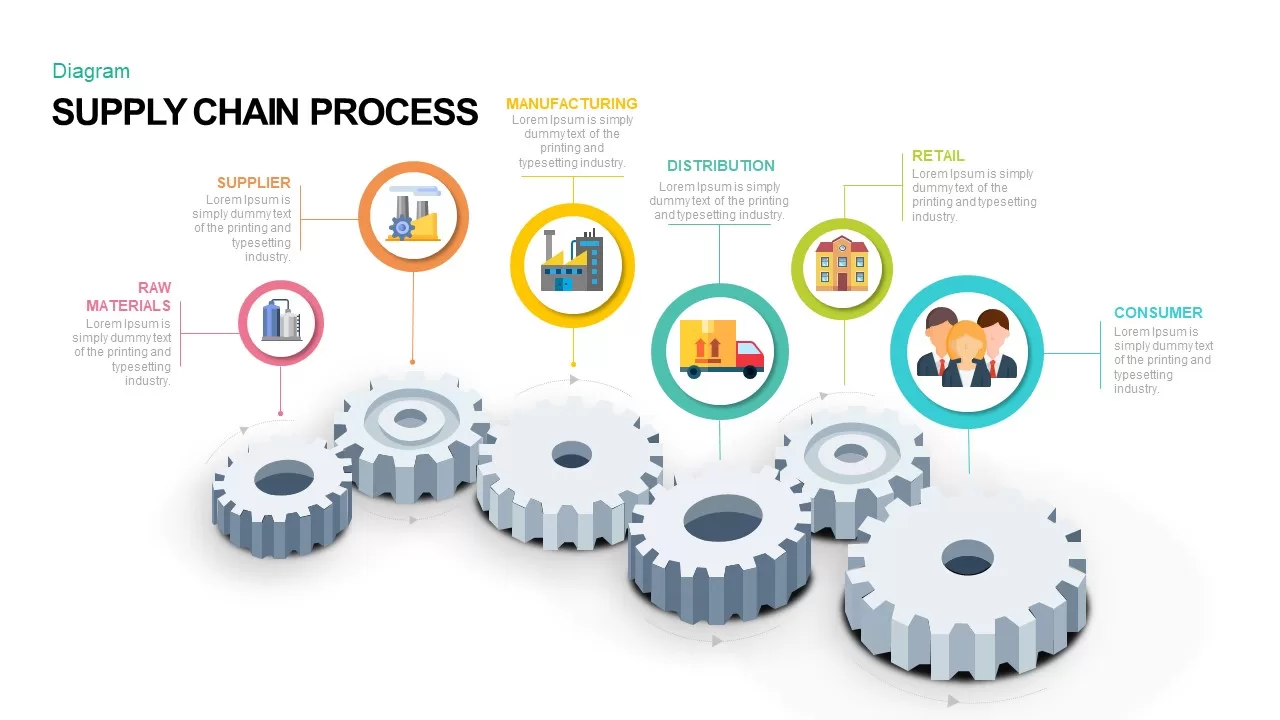
Supply Chain Process Gear Diagram Template for PowerPoint & Google Slides
Process
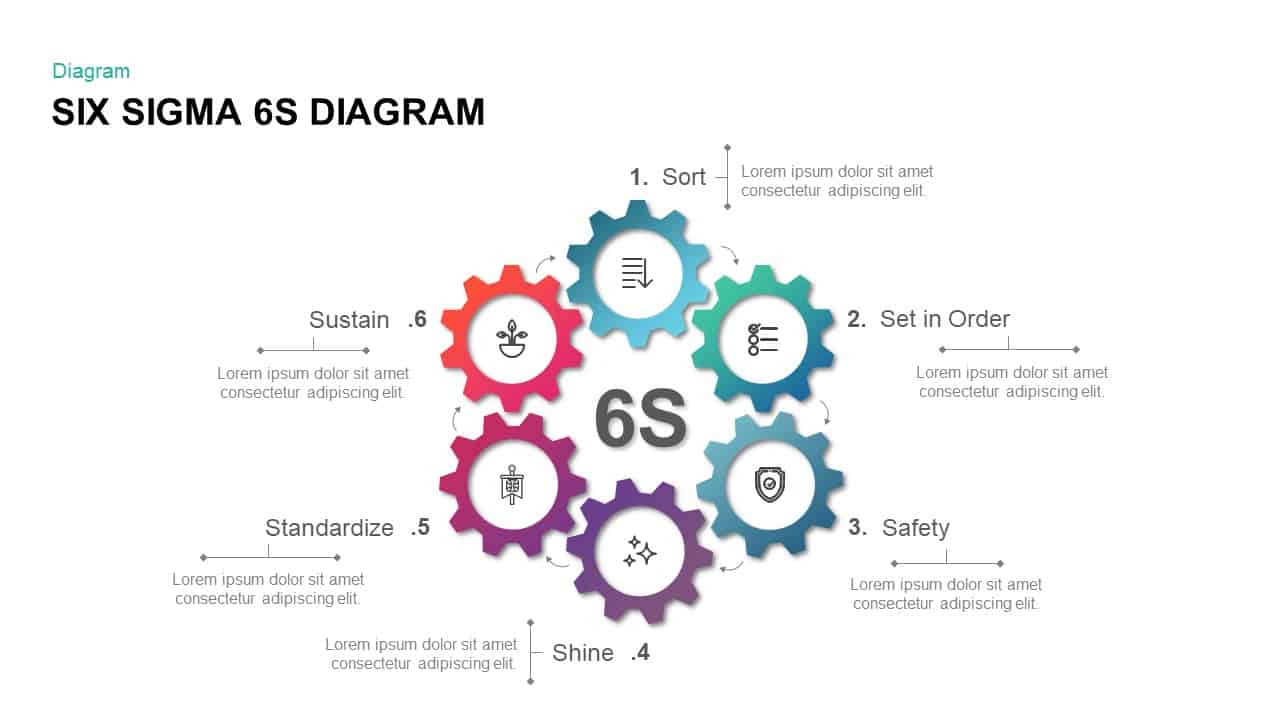
Six Sigma Gear Process Diagram Template for PowerPoint & Google Slides
Process
Four-Stage Gear Process Diagram Template for PowerPoint & Google Slides
Process
5-Stage Gear Process Flow Diagram Template for PowerPoint & Google Slides
Process
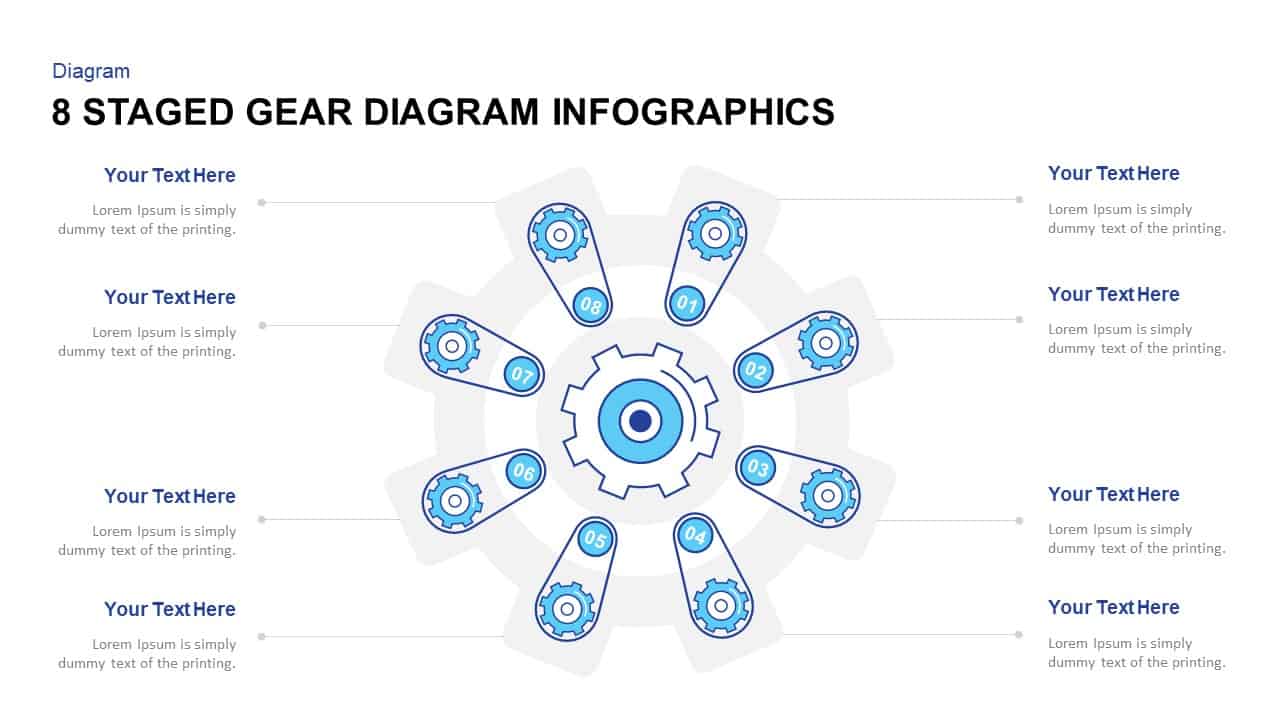
Eight-Stage Gear Diagram Process Template for PowerPoint & Google Slides
Process
Gear Process Diagram Template for PowerPoint & Google Slides
Process
Gear Process Diagram Template for PowerPoint & Google Slides
Process
Gear Process Diagram for PowerPoint & Google Slides
Process
Improvement Growth Arrow Metaphor Template for PowerPoint & Google Slides
Bar/Column
Detailed Performance Improvement Plan Template for PowerPoint & Google Slides
Employee Performance
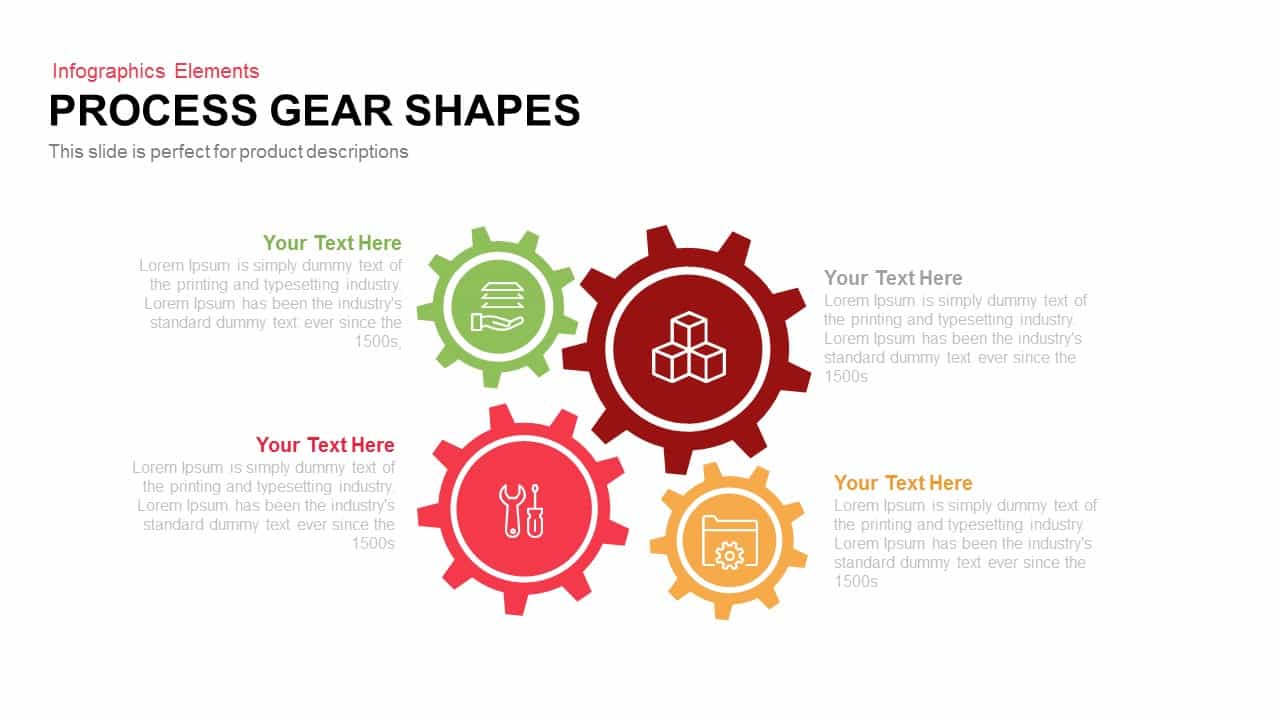
Process Gear Shapes Template for PowerPoint & Google Slides
Infographics
Animated Gear Slide for Process Mapping Template for PowerPoint & Google Slides
Process
Dynamic Four-Step Gear Process Template for PowerPoint & Google Slides
Process
Gear Diagram template for PowerPoint & Google Slides
Process
Four Gear Section Diagram Template for PowerPoint & Google Slides
Circular

4 Step Gear Diagram Template for PowerPoint & Google Slides
Process
Colorful Modern CRM Gear Diagram Template for PowerPoint & Google Slides
Customer Experience
Gear Pie Diagram Data Visualization Template for PowerPoint & Google Slides
Pie/Donut
Six-Staged Gear Diagram Framework Template for PowerPoint & Google Slides
Process
Gear Flow Diagram template for PowerPoint & Google Slides
Process
Modern Four Stage Gear Diagram Template for PowerPoint & Google Slides
Process
Artificial Intelligence Gear Diagram Template for PowerPoint & Google Slides
Process
Marketing Risk Management Gear Diagram Template for PowerPoint & Google Slides
Risk Management
SWOT Analysis Gear Diagram Slide Template for PowerPoint & Google Slides
SWOT
Six-Stage Gear Wheel Diagram Template for PowerPoint & Google Slides
Circular
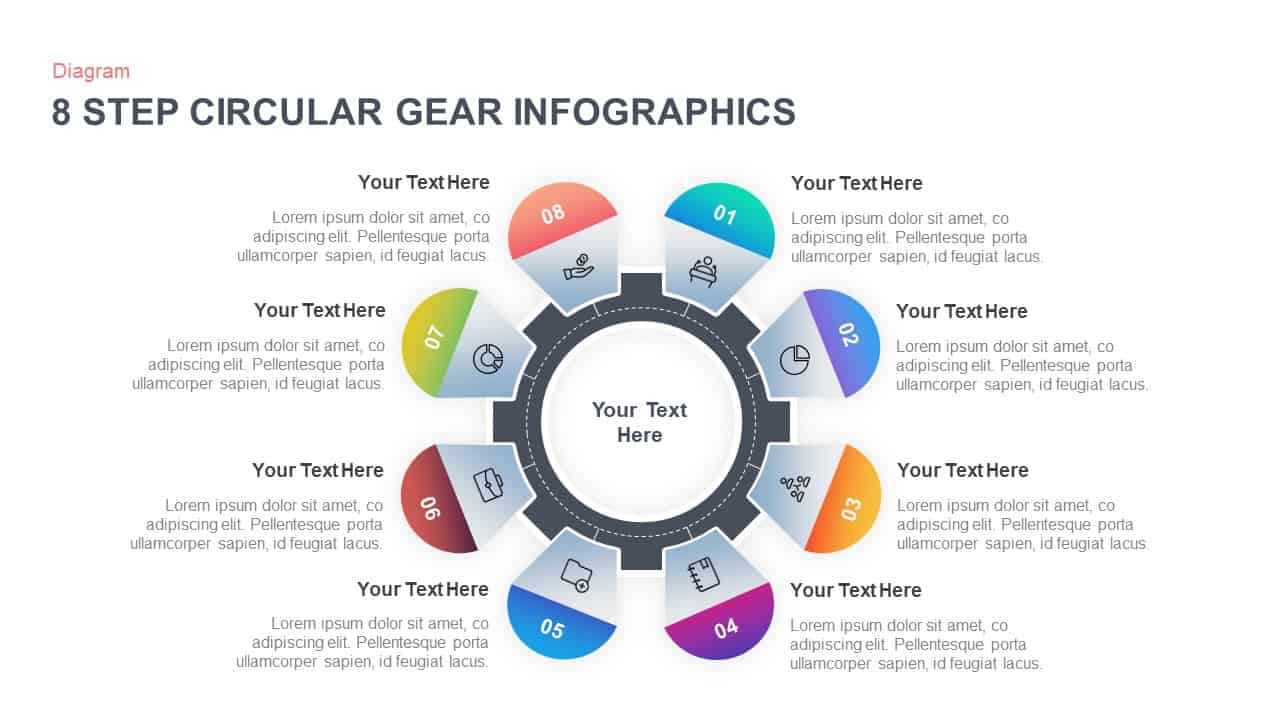
8-Step Circular Gear Infographic Diagram Template for PowerPoint & Google Slides
Circular
Modern Gear Venn Diagram Infographic Template for PowerPoint & Google Slides
Comparison
6-Part Circular Gear Infographic Diagram Template for PowerPoint & Google Slides
Process
Three-Step Triangular Gear Diagram Template for PowerPoint & Google Slides
Process
Dynamic Gear Diagram Infographics Template for PowerPoint & Google Slides
Process
Six-Option Gear Diagram Slide Template for PowerPoint & Google Slides
Circular
Cloud Gear Automation Diagram Template for PowerPoint & Google Slides
Cloud Computing
8-Step Circular Gear Infographics Diagram for PowerPoint & Google Slides
Process
Sales Process Workflow Funnel Diagram PowerPoint Template for PowerPoint & Google Slides
Funnel
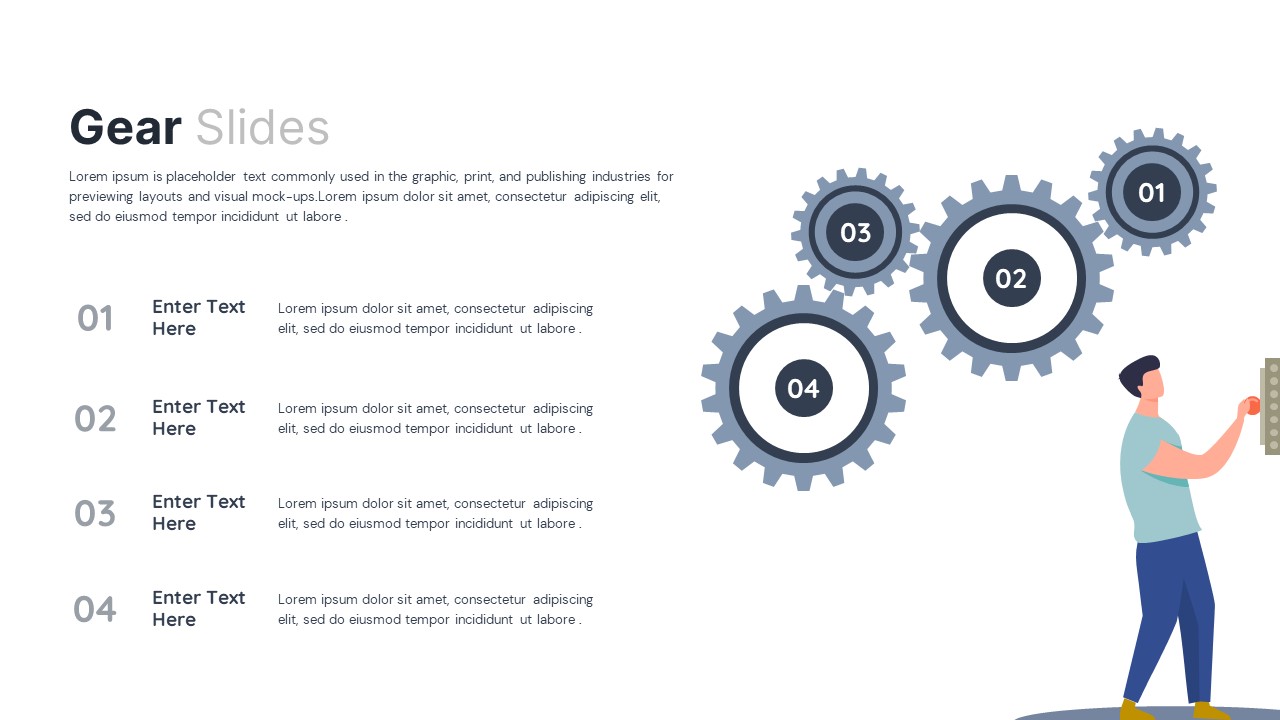
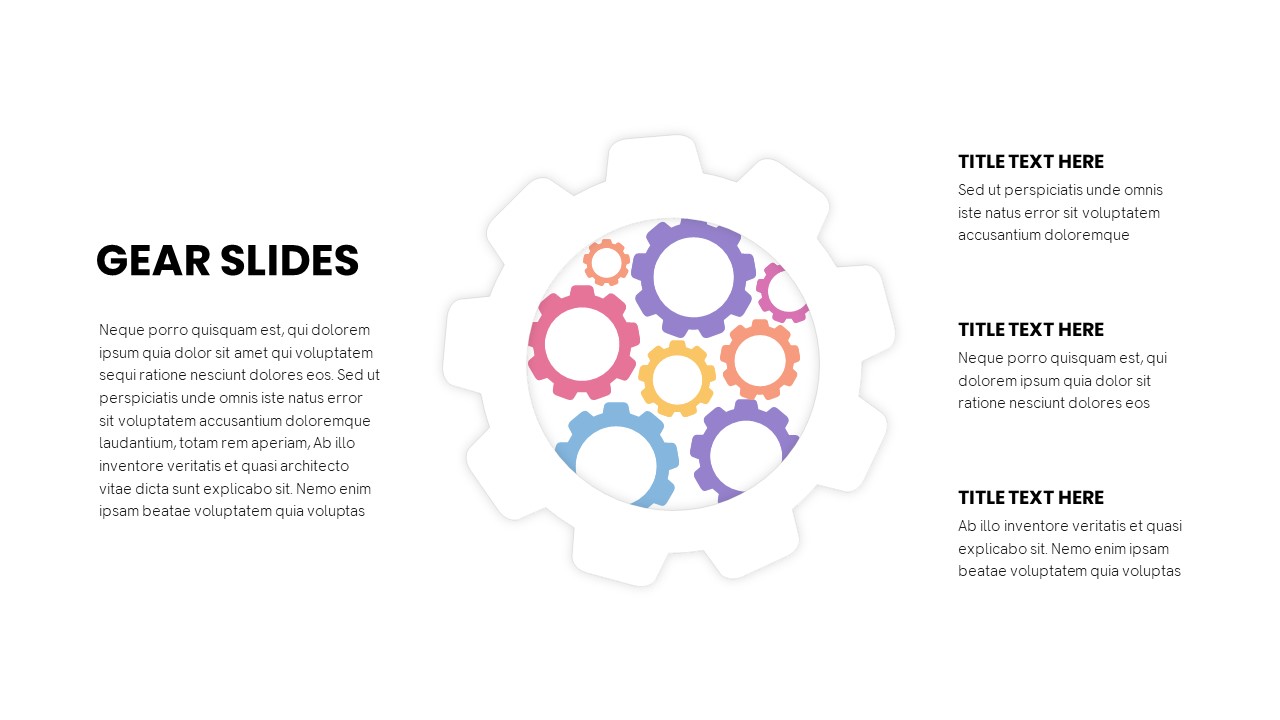
Gear Slides for PowerPoint & Google Slides
Infographics

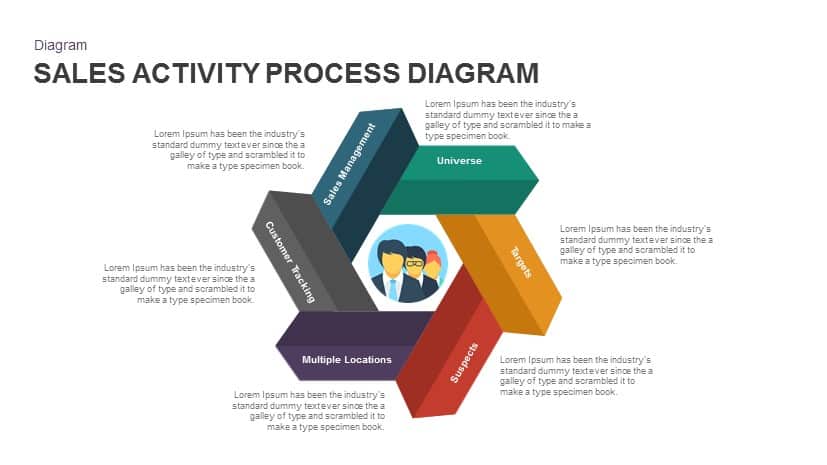
Sales Activity Hexagon Process Diagram Template for PowerPoint & Google Slides
Process
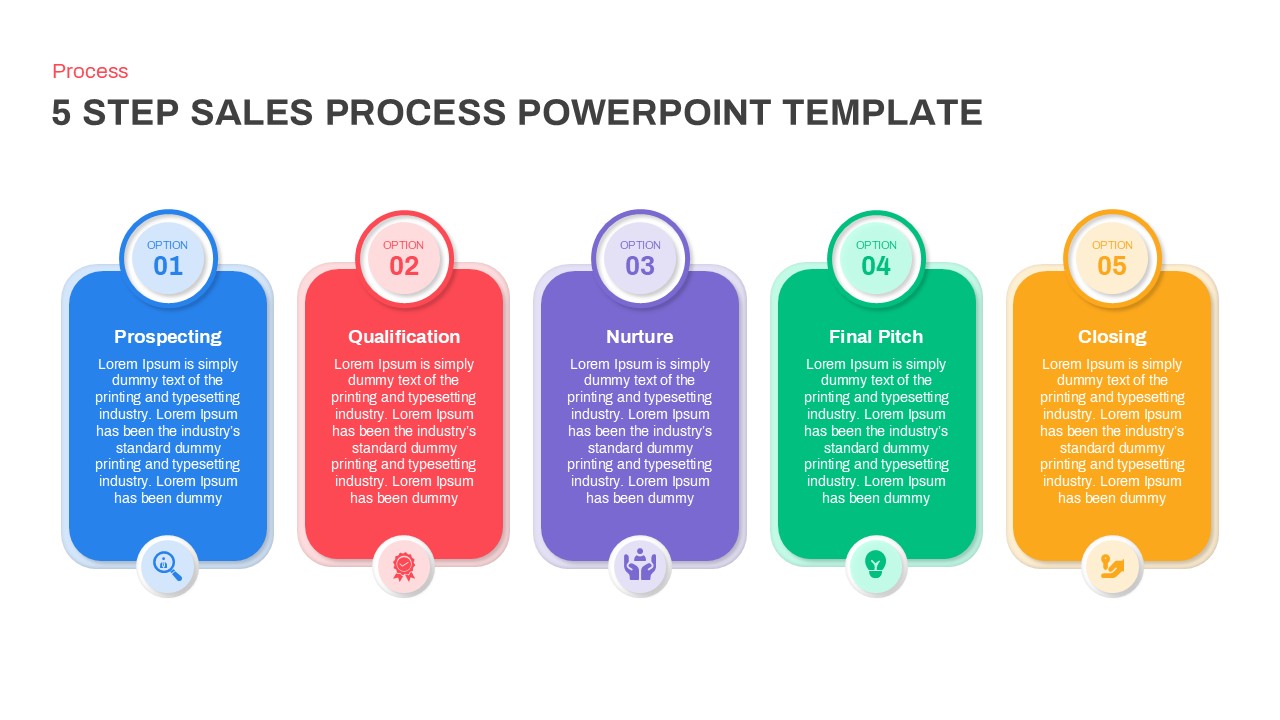
Modern 5-Step Sales Process Diagram Template for PowerPoint & Google Slides
Process
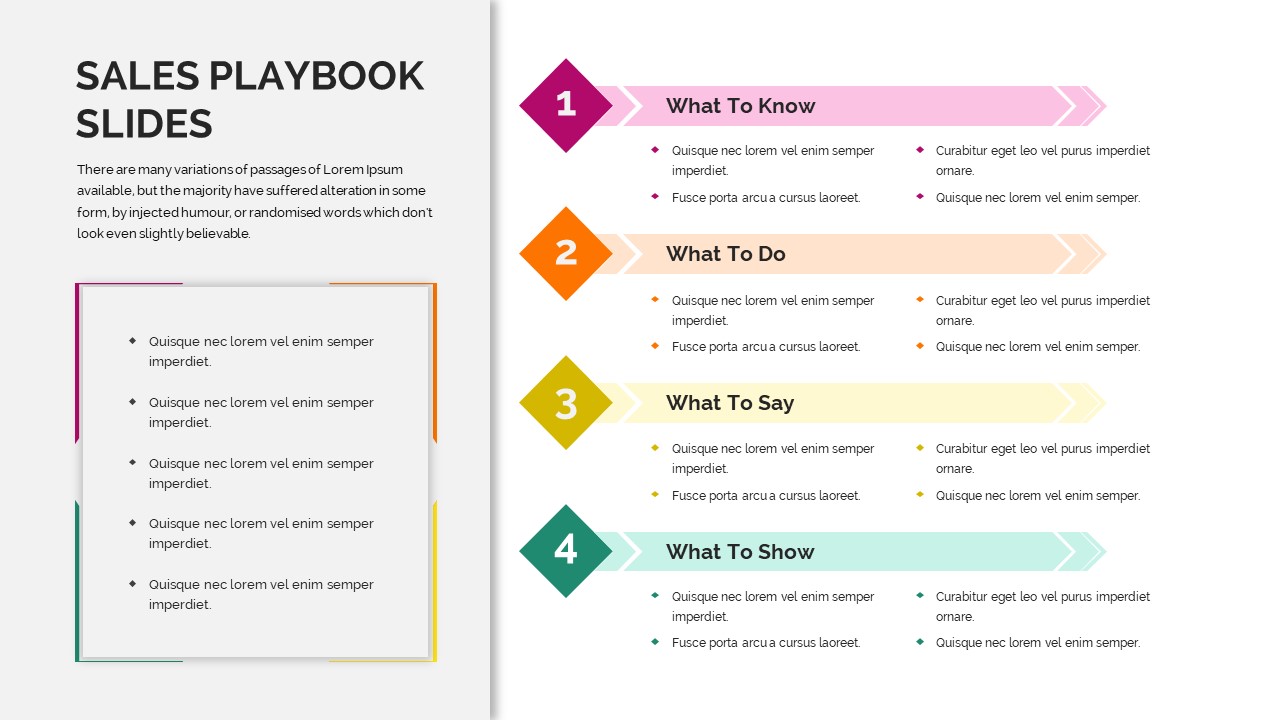
Sales Playbook Process Steps Diagram Template for PowerPoint & Google Slides
Marketing
Free Gear Infographics template for PowerPoint & Google Slides
Process
Free
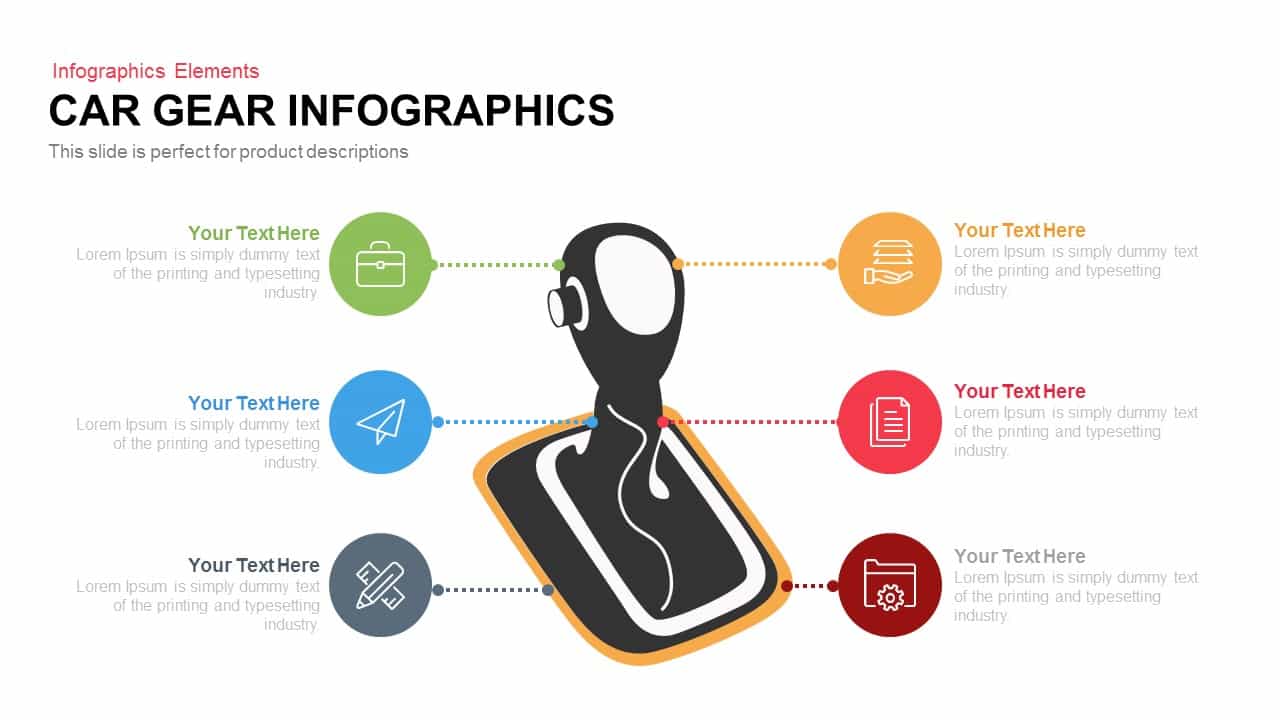
Car Gear Infographics Template for PowerPoint & Google Slides
Infographics
Brain Gear Hub-and-Spoke Infographics template for PowerPoint & Google Slides
Org Chart

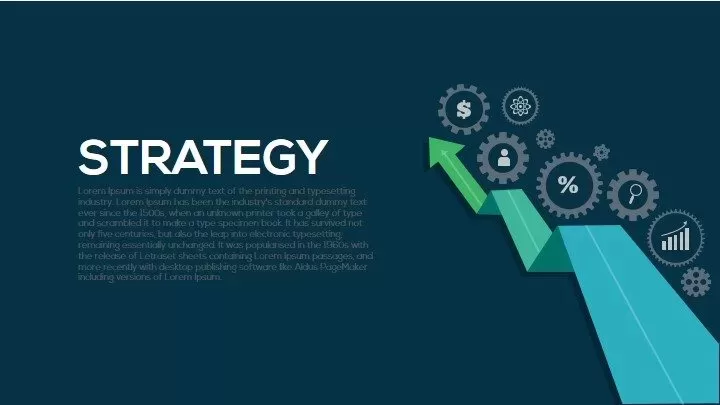
Strategy Arrow and Gear Icons Template for PowerPoint & Google Slides
Infographics
Support Services Gear Infographic Template for PowerPoint & Google Slides
Business
Corporate Mission Statement Gear Slide Template for PowerPoint & Google Slides
Vision and Mission
Three-Option Gear Infographic Pro Template for PowerPoint & Google Slides
Process
Three-Phase Planning Gear Infographic Template for PowerPoint & Google Slides
Process
3, 4, and 5 Step Gear Infographics Template for PowerPoint & Google Slides
Process
Animated Multi-Gear Cluster Infographic Template for PowerPoint & Google Slides
Process
Six Colorful Gear Shapes Infographic Template for PowerPoint & Google Slides
Process
Free

Sales Process Infographic Slides Pack Template for PowerPoint & Google Slides
Process
Seven-Step Vertical Sales Process Template for PowerPoint & Google Slides
Process
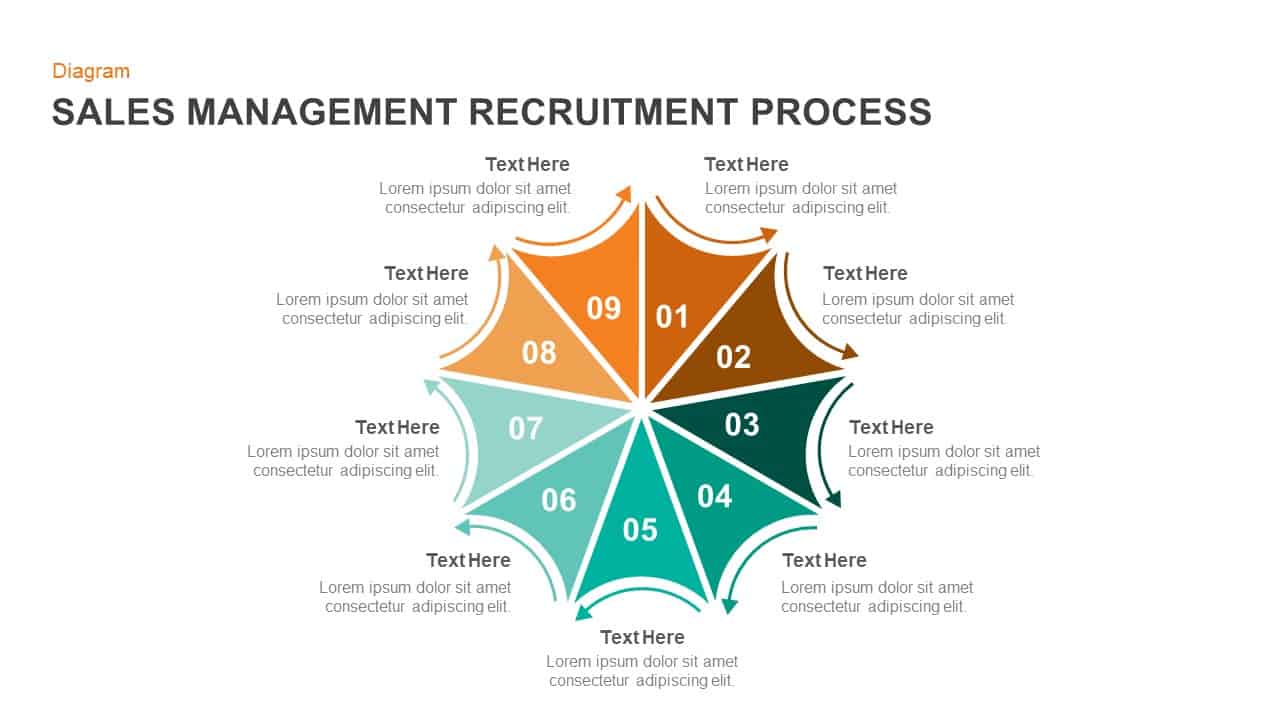
Sales Management Recruitment Process template for PowerPoint & Google Slides
Process
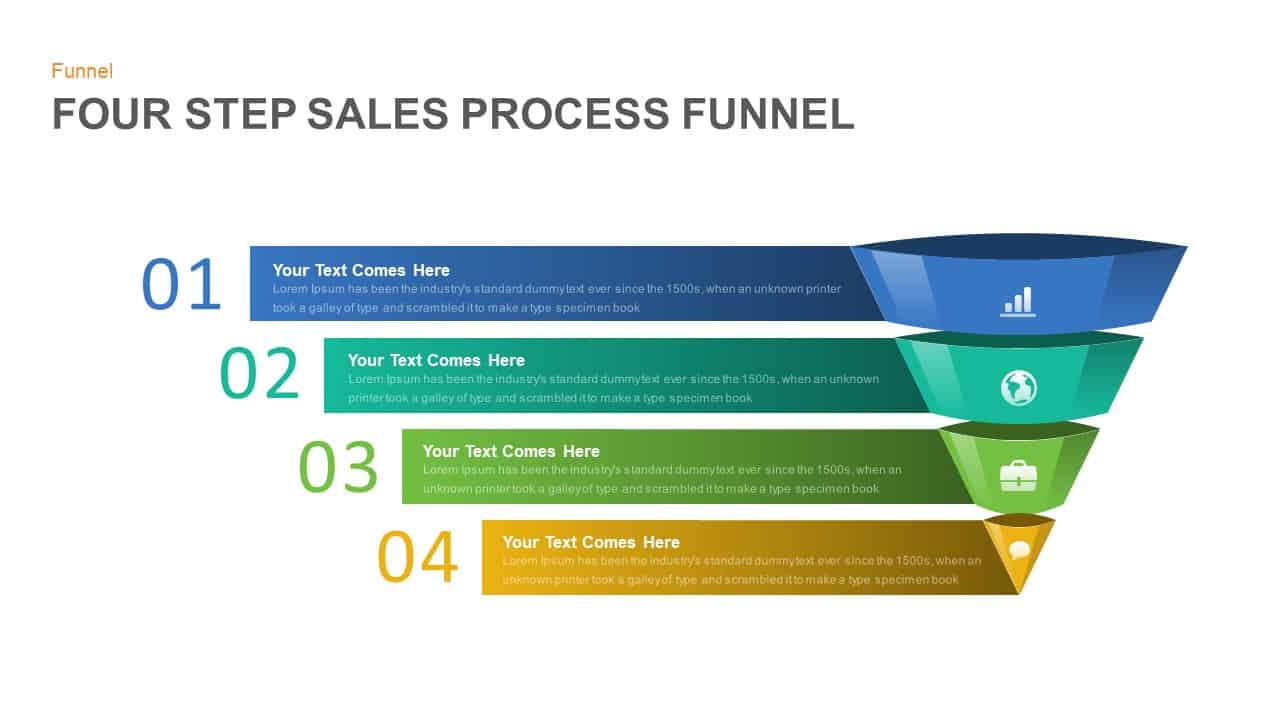
Four Step Sales Process Funnel Template for PowerPoint & Google Slides
Funnel
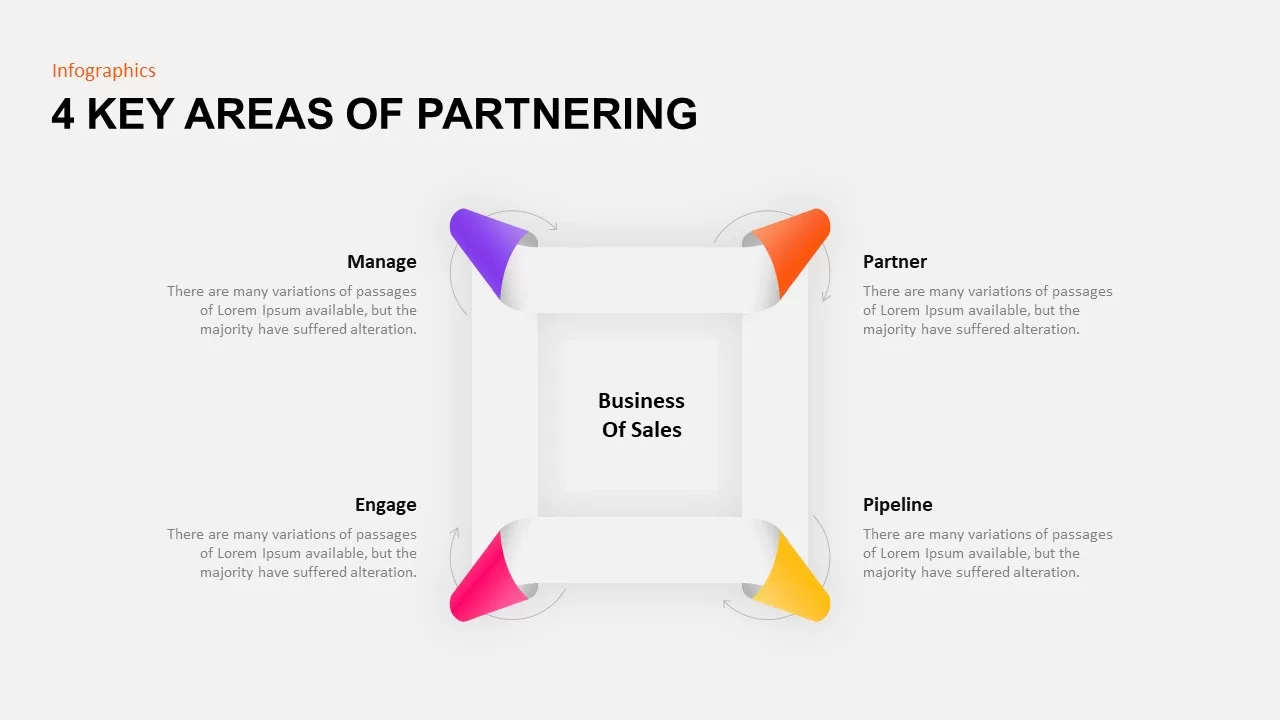
Four-Area Sales Partnering Process Template for PowerPoint & Google Slides
Process
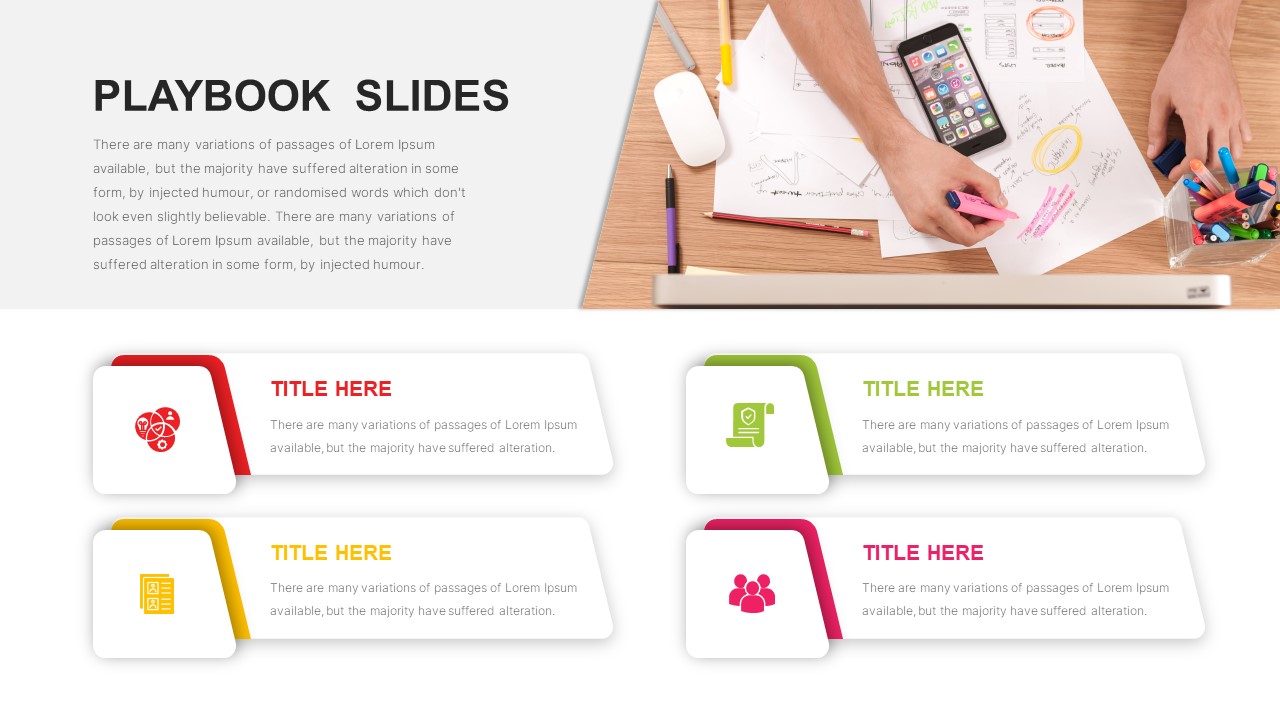
Sales Playbook Step-by-Step Process Template for PowerPoint & Google Slides
Process
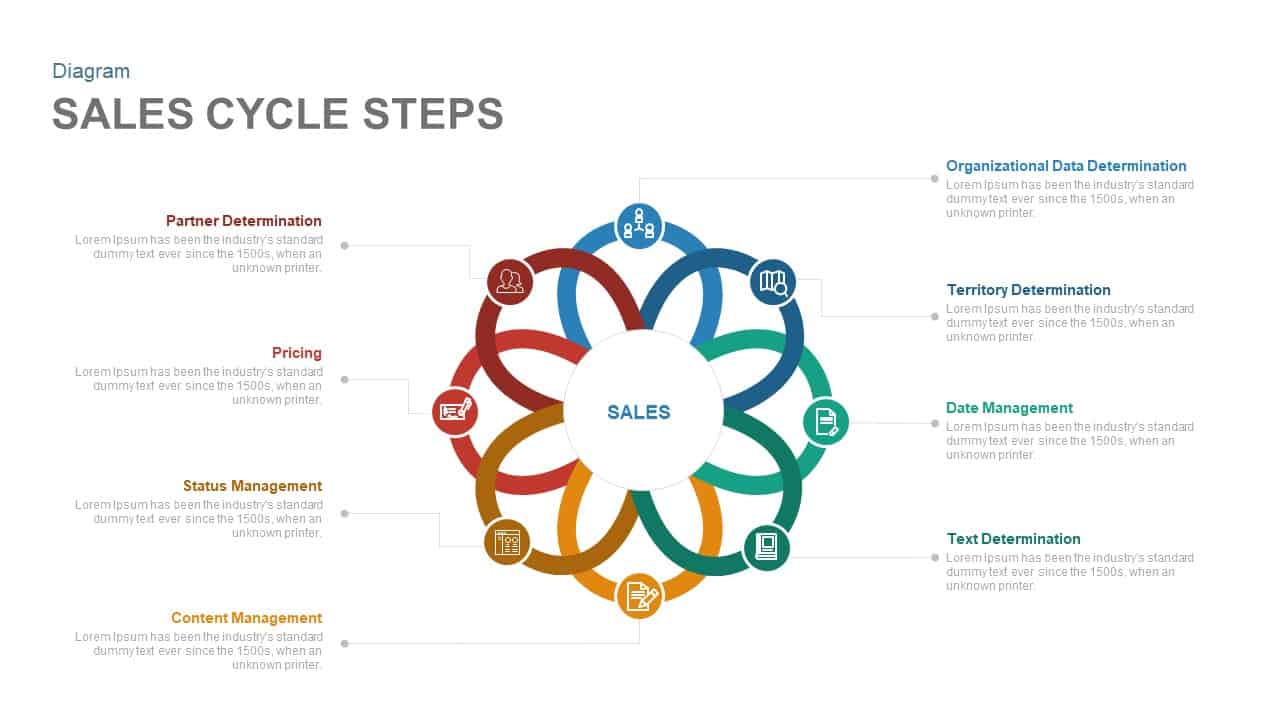
Eight-Step Sales Cycle Diagram Template for PowerPoint & Google Slides
Process
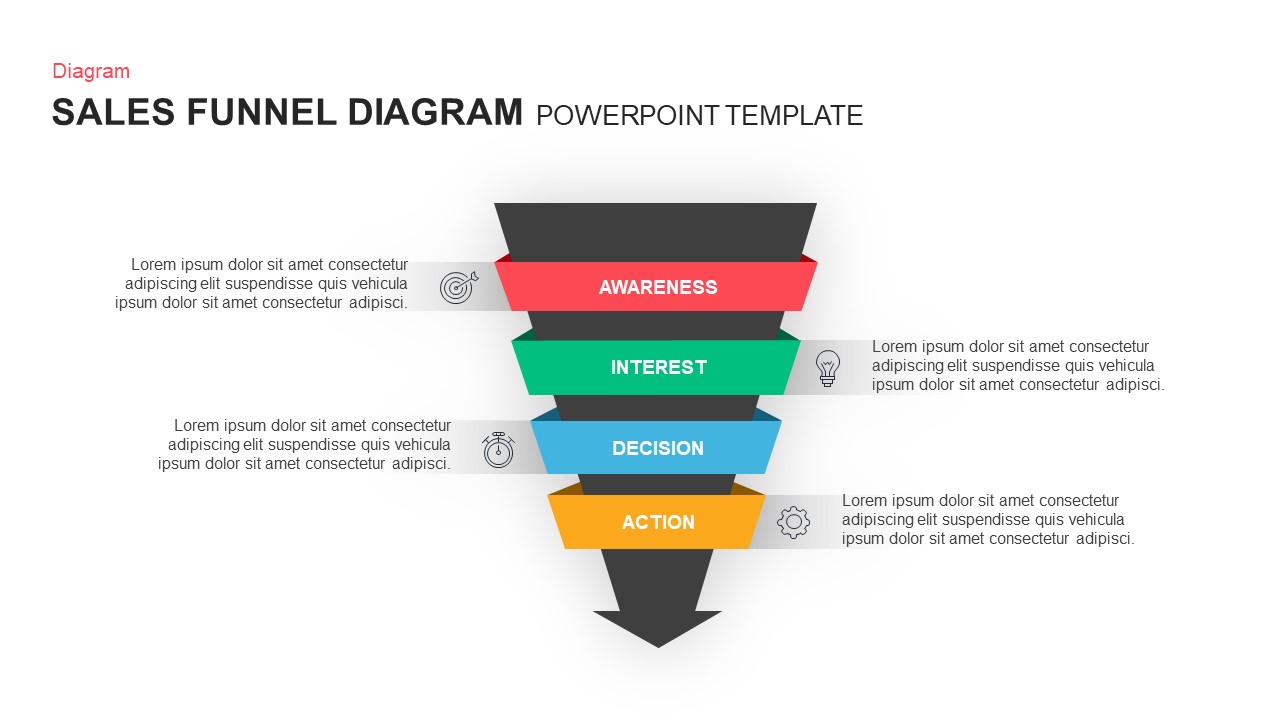
Professional Sales Funnel Diagram Template for PowerPoint & Google Slides
Funnel
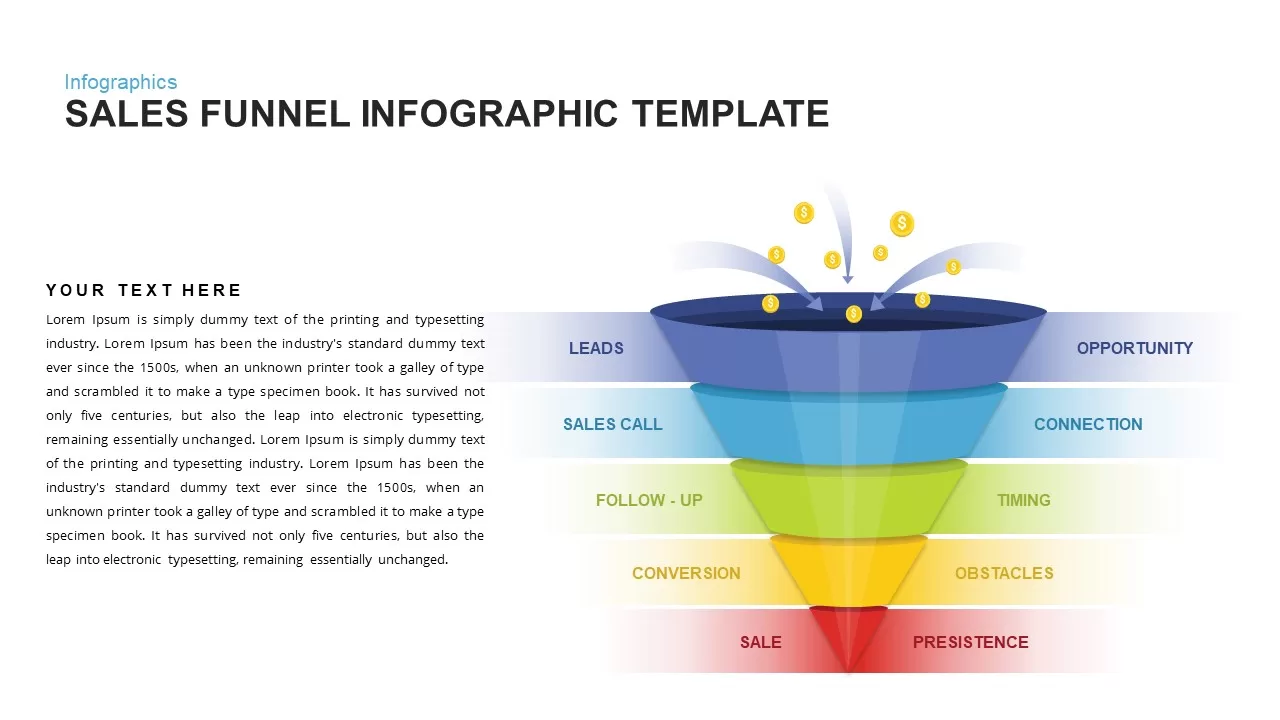
Sales Funnel Infographic Diagram Template for PowerPoint & Google Slides
Funnel
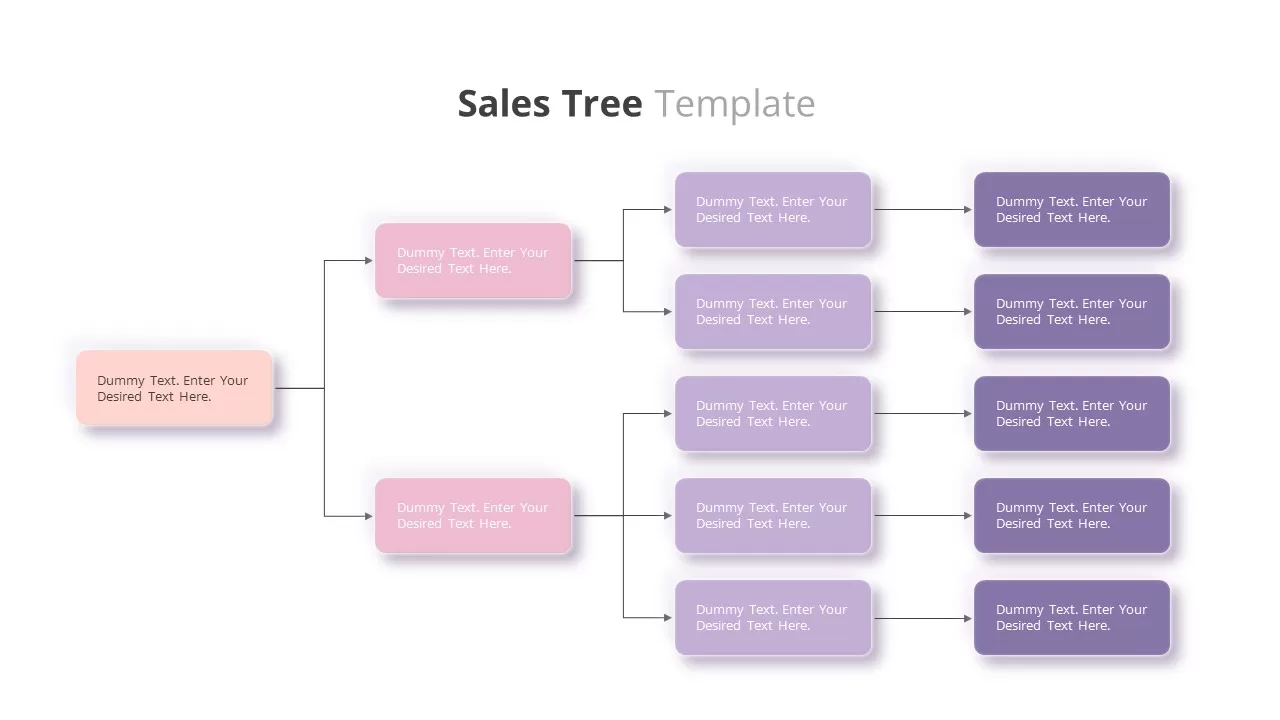
Customizable Sales Tree Diagram Template for PowerPoint & Google Slides
Org Chart
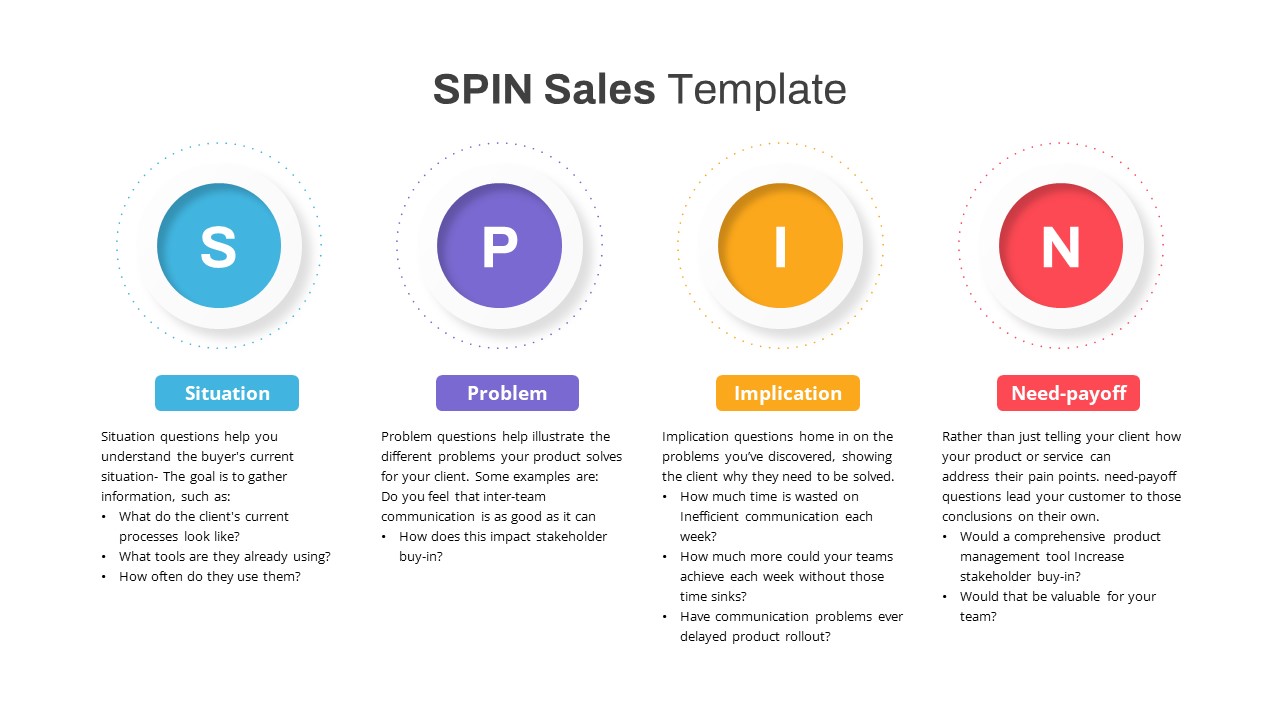
SPIN Sales Methodology Diagram Template for PowerPoint & Google Slides
Process
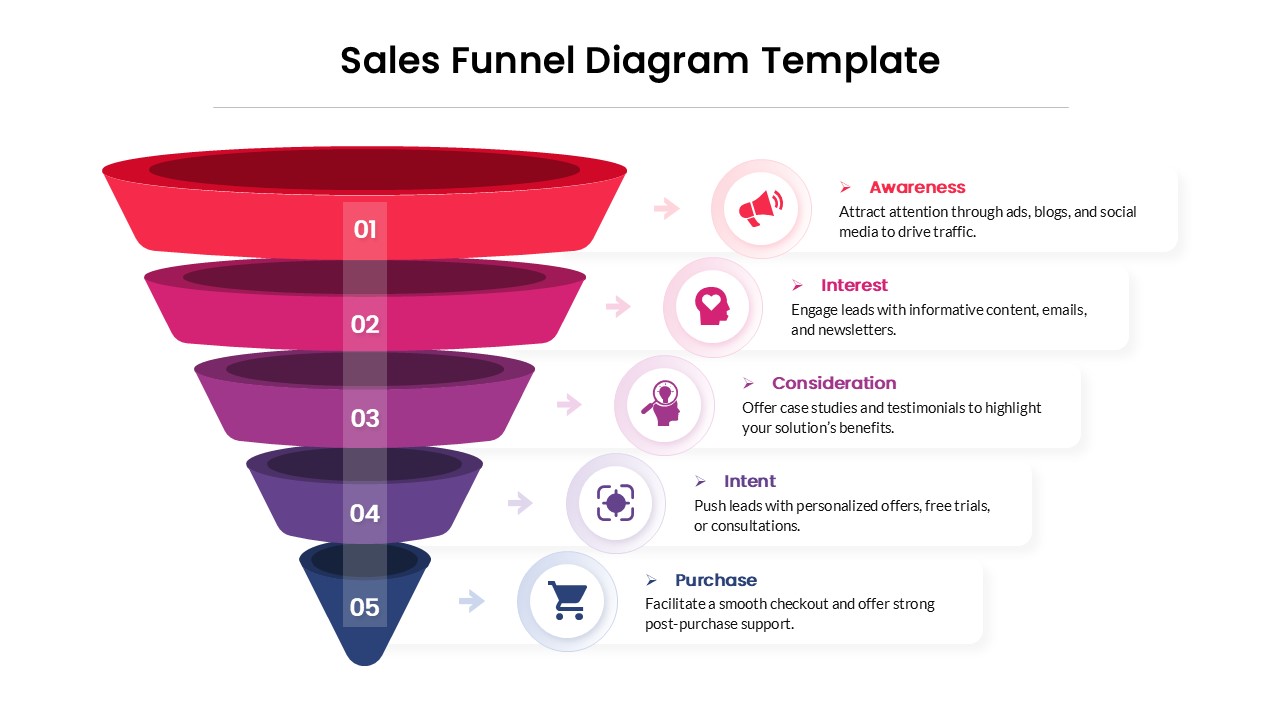
5 Stage Sales Funnel Diagram Template for PowerPoint & Google Slides
Funnel
Data-Driven Sales Strategy Diagram Template for PowerPoint & Google Slides
Marketing
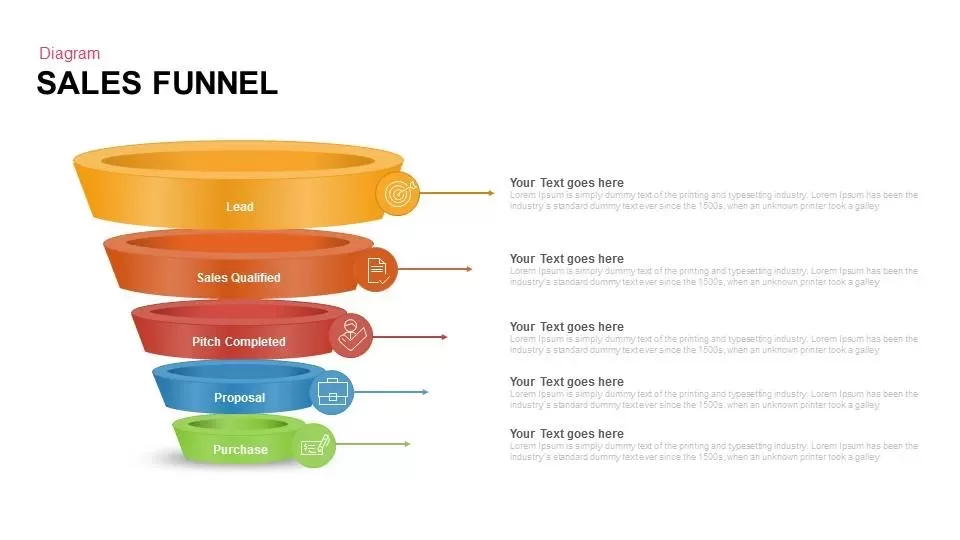
Sales Funnel Diagram for PowerPoint & Google Slides
Marketing Funnel
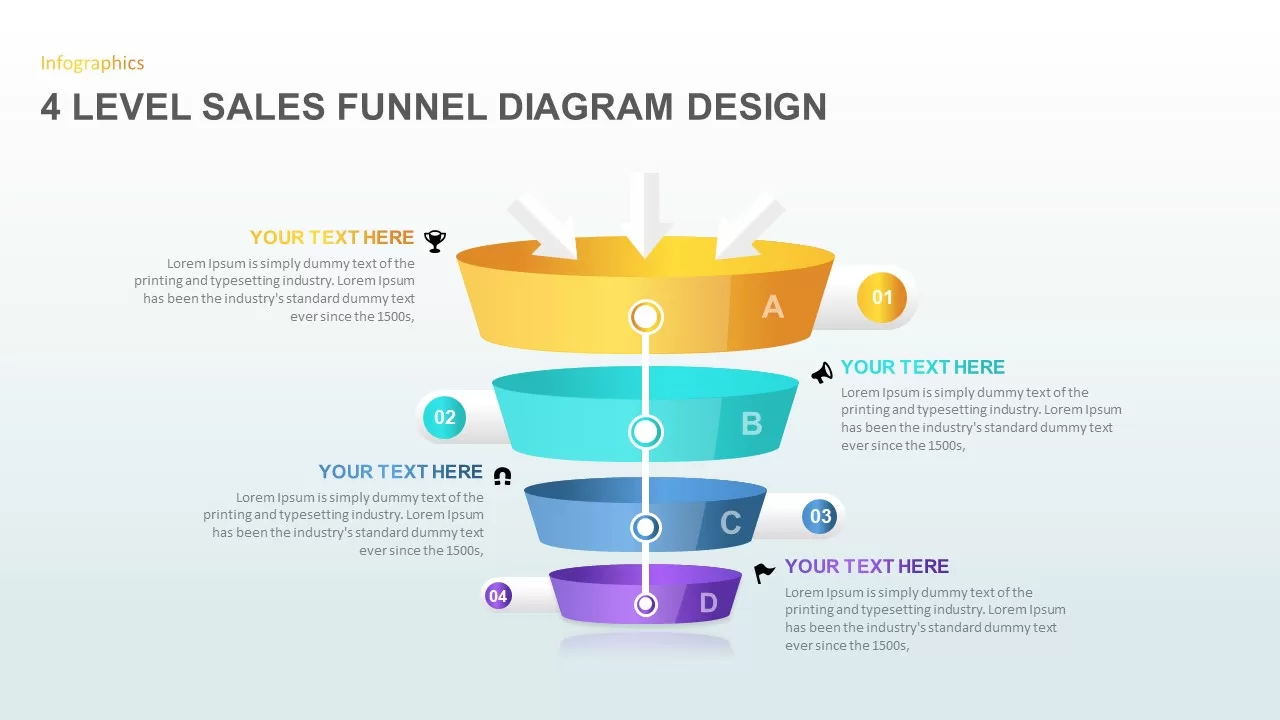
4 Level Sales Funnel Diagram Design for PowerPoint & Google Slides
Marketing Funnel
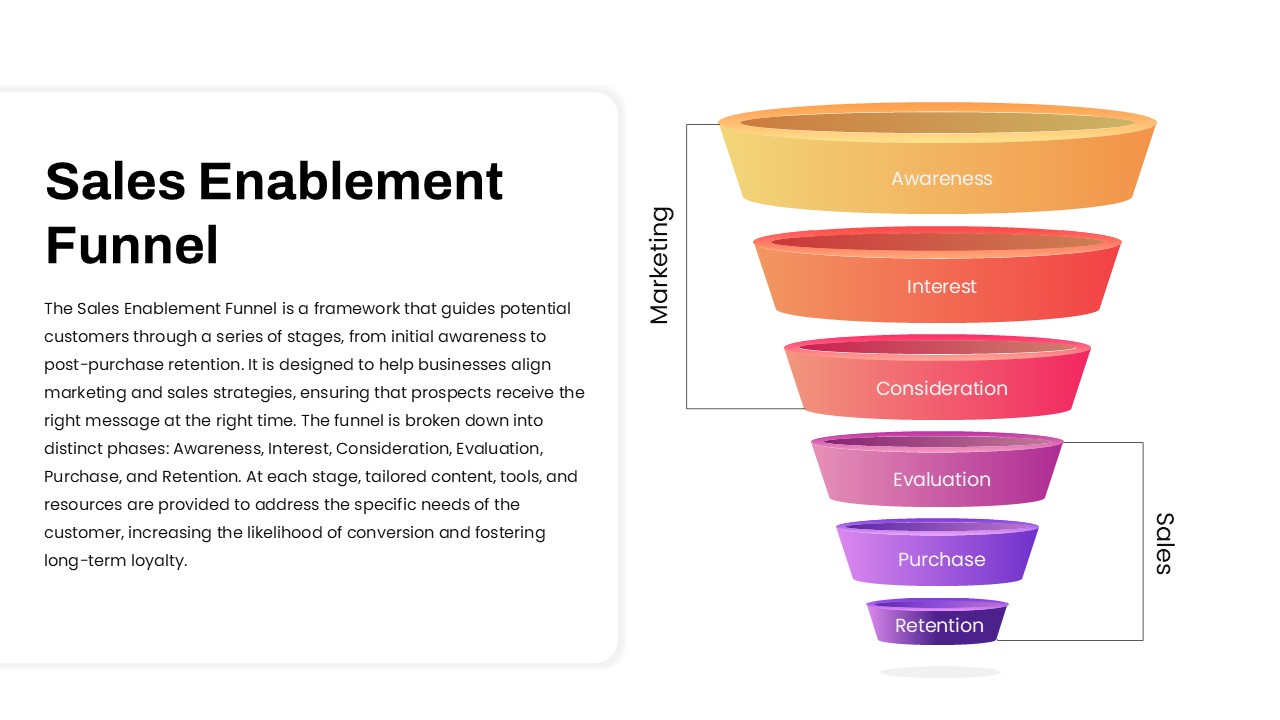
Sales Enablement Funnel diagram for PowerPoint & Google Slides
Funnel
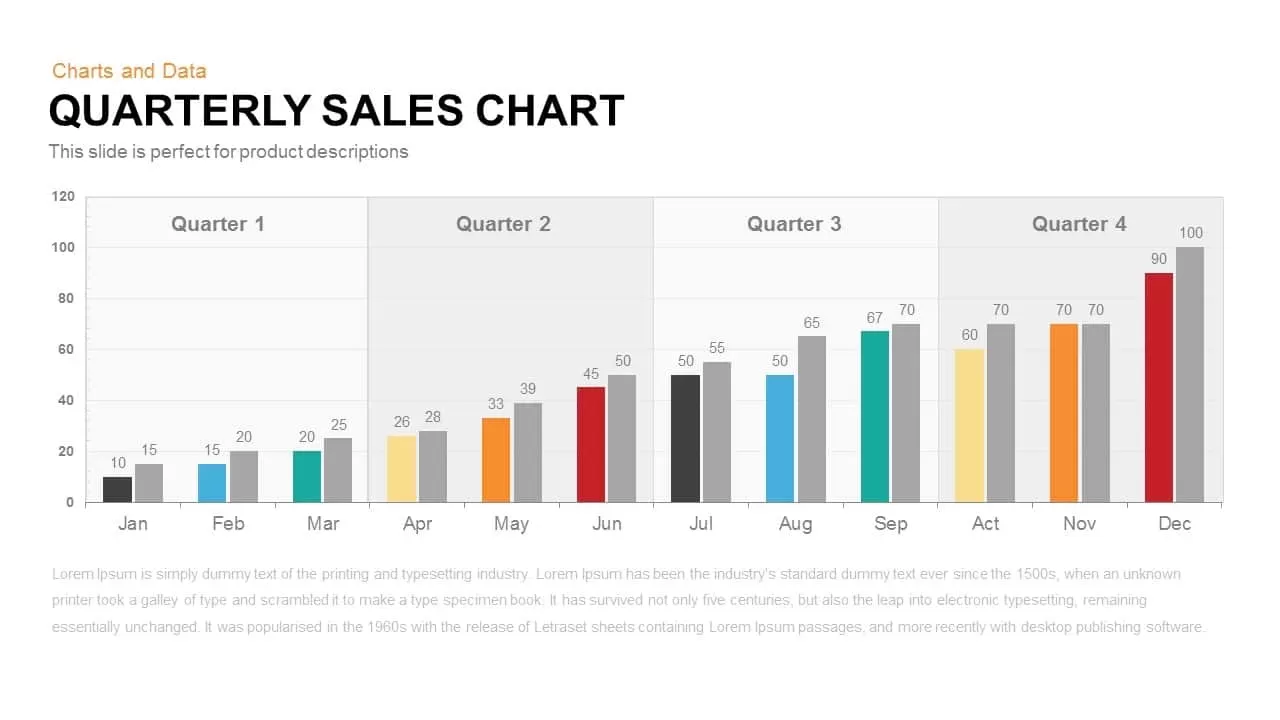
Quarterly Sales template for PowerPoint & Google Slides
Bar/Column
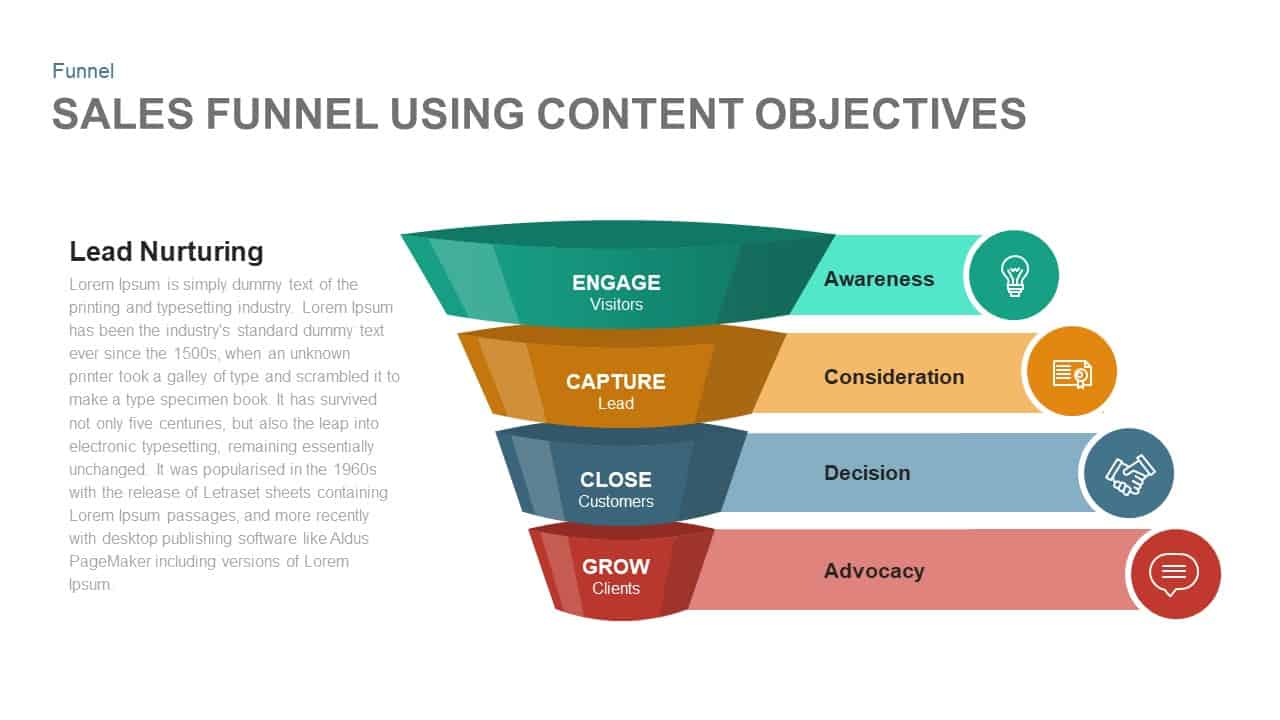
Sales Funnel Using Content Objectives Template for PowerPoint & Google Slides
Funnel
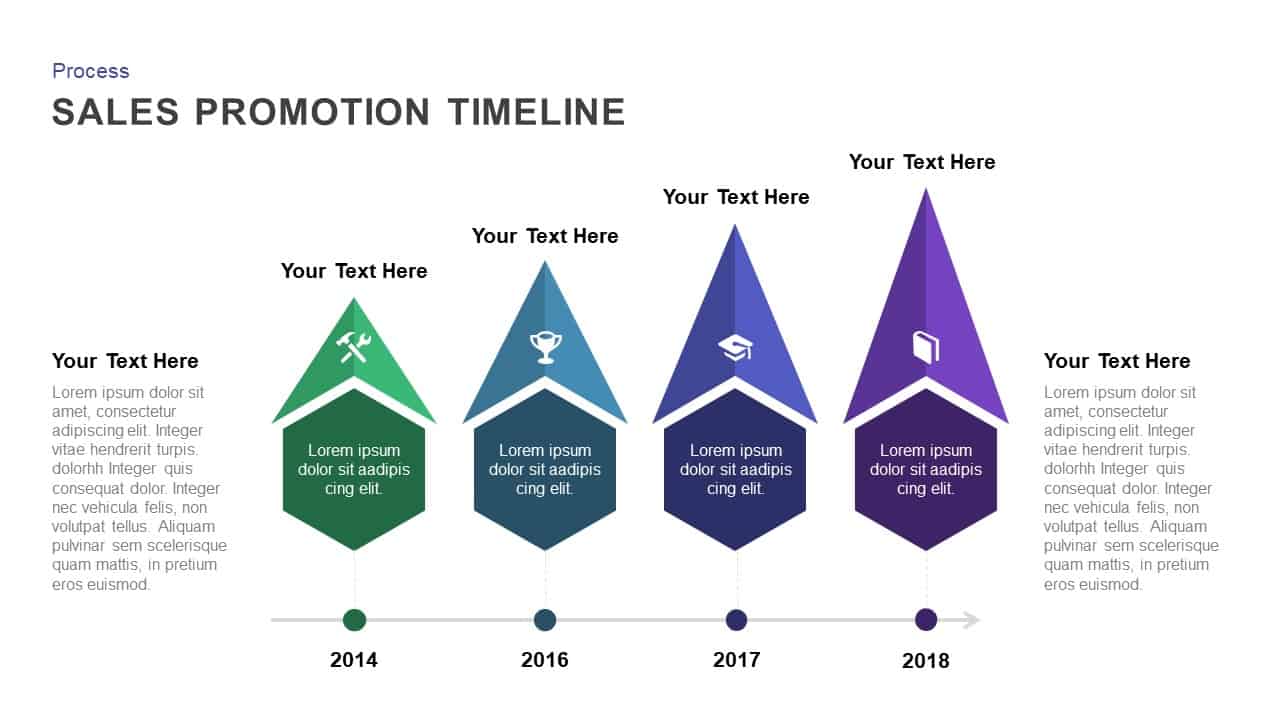
Sales Promotion Timeline template for PowerPoint & Google Slides
Timeline
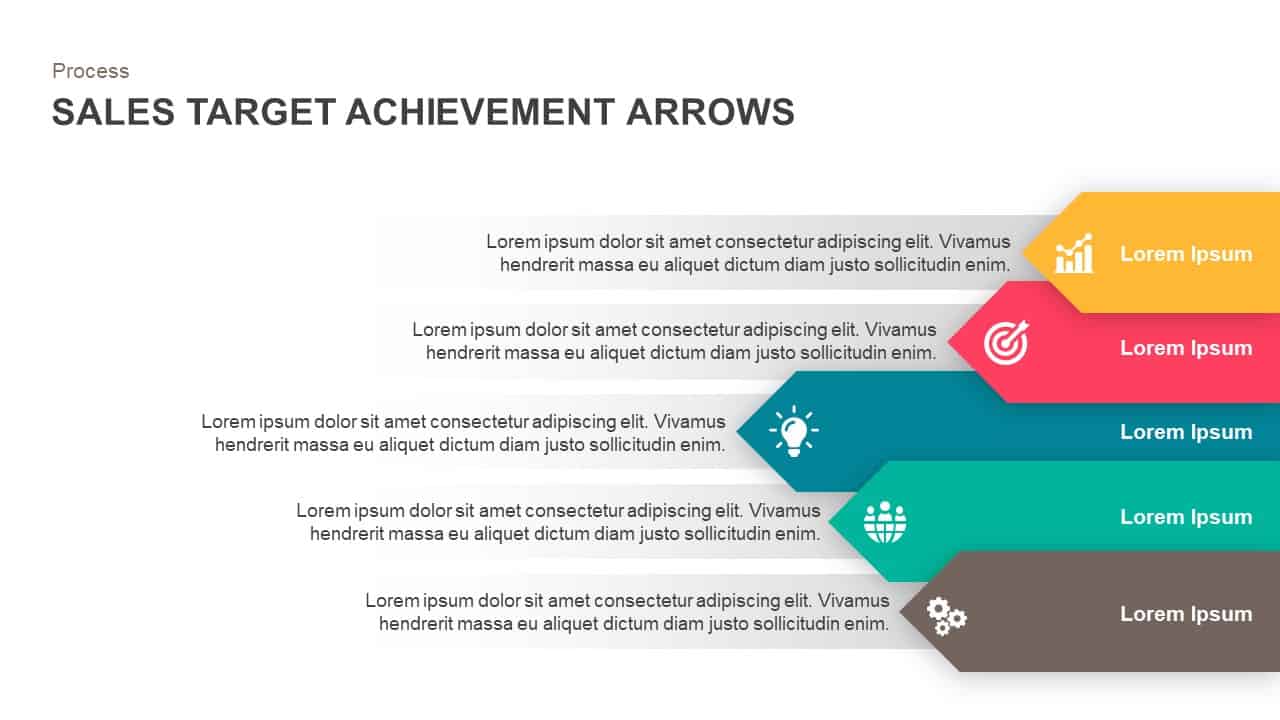
Sales Target Achievement Arrows Template for PowerPoint & Google Slides
Arrow
Sales Plan Presentation Template for PowerPoint & Google Slides
Business Plan
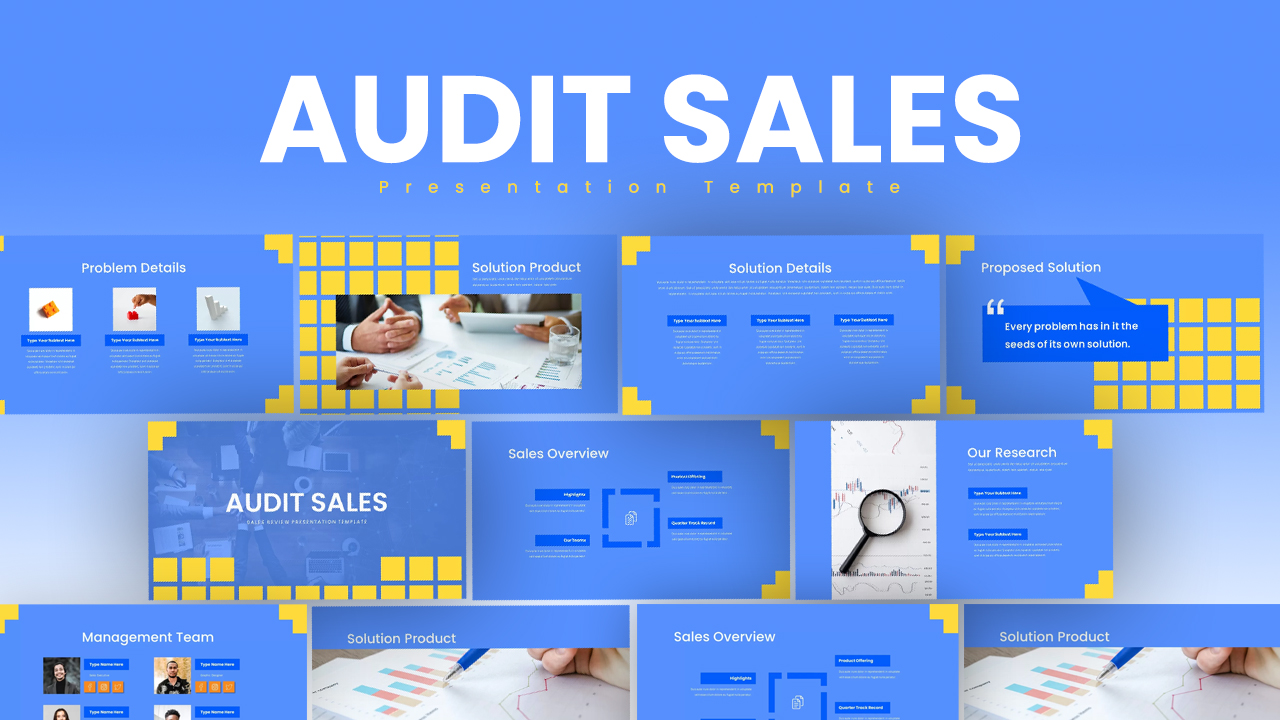
Audit Sales Review Presentation Template for PowerPoint & Google Slides
Decks

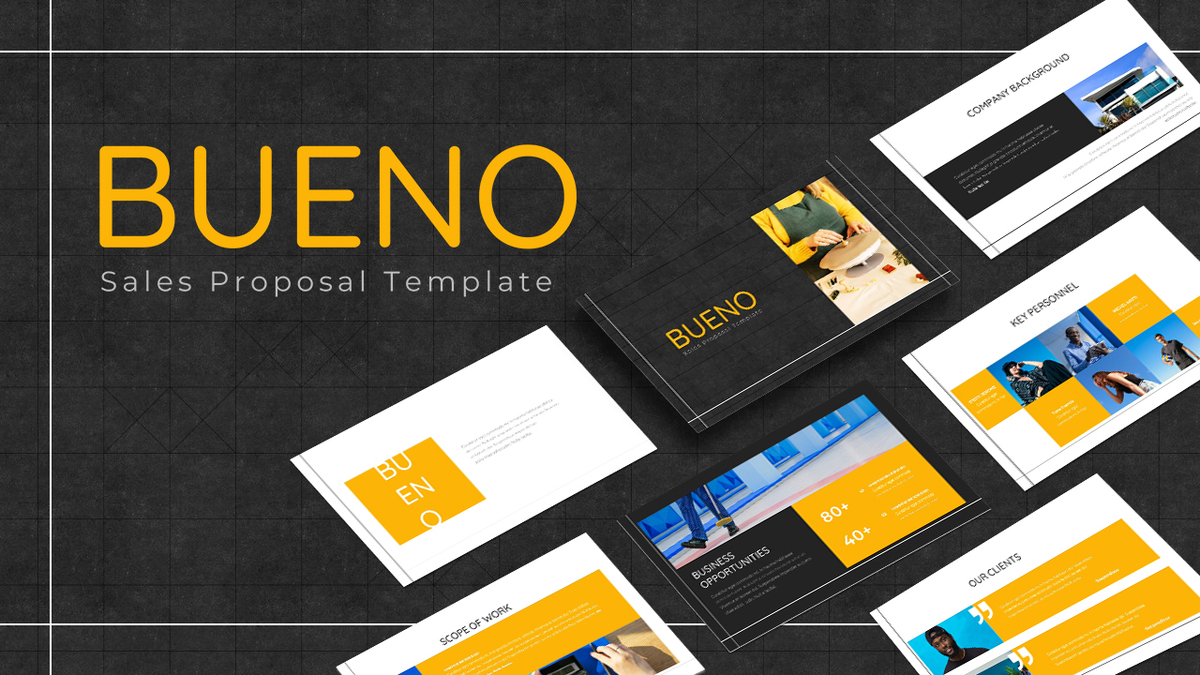
Bueno Sales Proposal Template for PowerPoint & Google Slides
Pitch Deck
Quarterly Sales Review Bar Chart Template for PowerPoint & Google Slides
Bar/Column
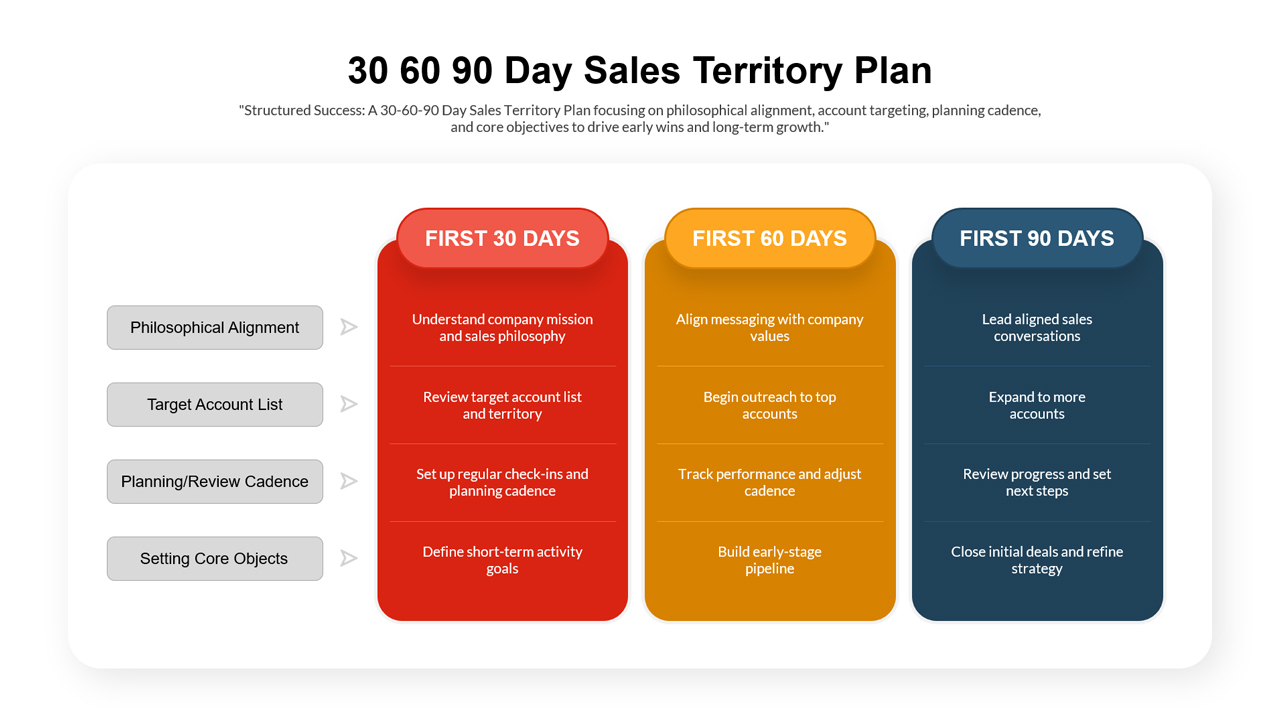
30 60 90 Day Sales Territory Plan Template for PowerPoint & Google Slides
Marketing
Sales Proposal Value Template for PowerPoint & Google Slides
Business Proposal