Professional Sales Performance Report Template for PowerPoint & Google Slides

Description
This professional sales performance report template provides a comprehensive slide deck for presenting sales metrics, KPIs, and business highlights in a clear, engaging format. Begin with a bold cover slide featuring large title text and a curved image mask to showcase sales visuals. A Vision & Mission slide uses fluid shapes and side-by-side photography to reinforce strategic messaging. The Table of Contents layout offers six numbered bullet points with concise text placeholders for easy navigation. A five-step Key Business Highlights diagram employsarched arcs and numbered nodes to illustrate sequential achievements or quarterly milestones, with each segment using a numbered circle and text area to describe metrics, strategies, or wins. Editable vector shapes and master layouts ensure consistent typography, color accents, and spacing across all slides. Color-coded accent elements in vibrant orange and soft yellow maintain brand continuity and visual hierarchy, while crisp white backgrounds preserve readability.
Built and optimized for PowerPoint and Google Slides, this template leverages slide masters for rapid customization. Users can swap images via drag-and-drop placeholders, adjust accent colors globally through theme palettes, and apply prebuilt slide transitions to enhance flow. Built-in grid and snap alignment features enable pixel-perfect layout adjustments, ensuring professional results without design expertise. All icons are vector-based for scalable clarity on any screen or projector, and text styles automatically adapt to language settings. The template also supports export to high-resolution PDF for printed distribution.
Whether presenting quarterly sales results, annual revenue reports, or commission analyses, this deck provides the tools to communicate complex data with maximum impact. Simply replace placeholder content with company-specific figures, charts, and narratives to deliver persuasive, on-brand presentations that inform stakeholders and drive strategic decisions.
Who is it for
Sales managers, business analysts, finance teams, and executives who need to present performance metrics, quarterly results, or revenue reports in a polished, data-driven format.
Other Uses
Repurpose this deck for investor updates, marketing campaign results, product launch overviews, award submissions, executive summaries, or any scenario requiring a clear, multi-slide performance report.
Login to download this file

Item ID
SB01494
Related Templates

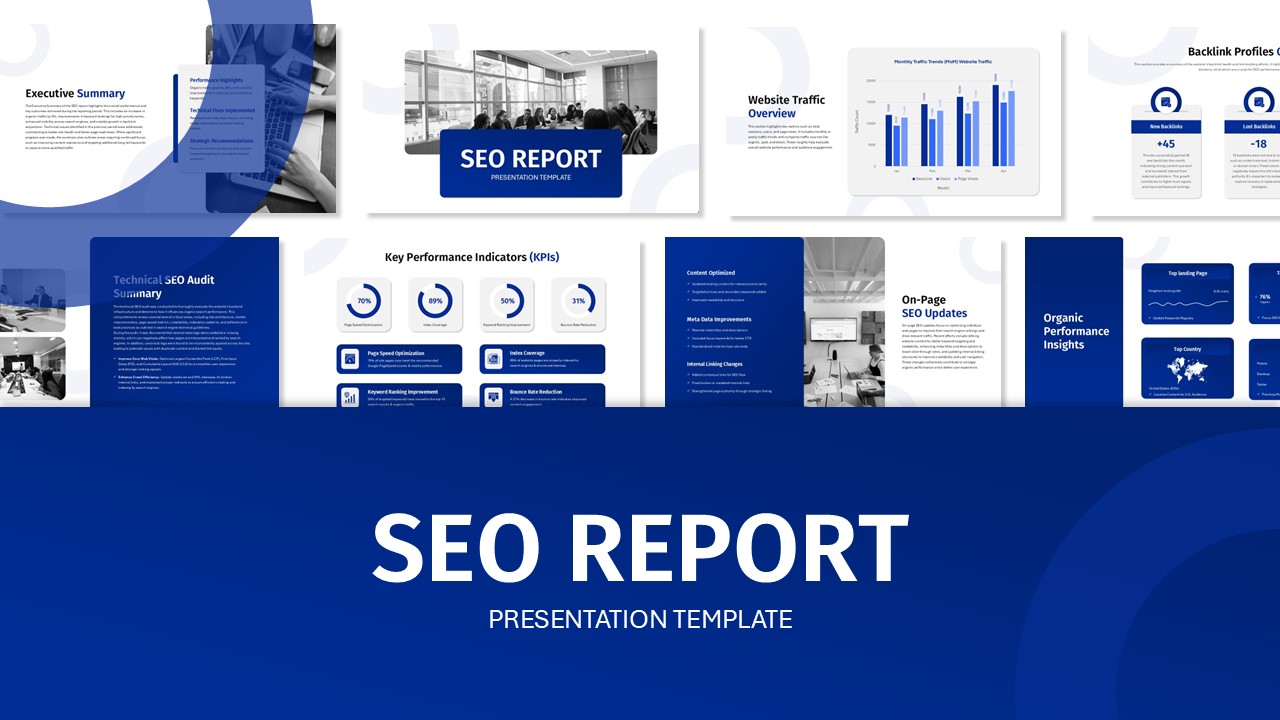
SEO Performance Report Overview template for PowerPoint & Google Slides
Digital Marketing
Sales vs Budget Performance Chart Template for PowerPoint & Google Slides
Bar/Column

Sales Performance Dashboard template for PowerPoint & Google Slides
Business Report
Monthly Sales Performance Dashboard Template for PowerPoint & Google Slides
Charts
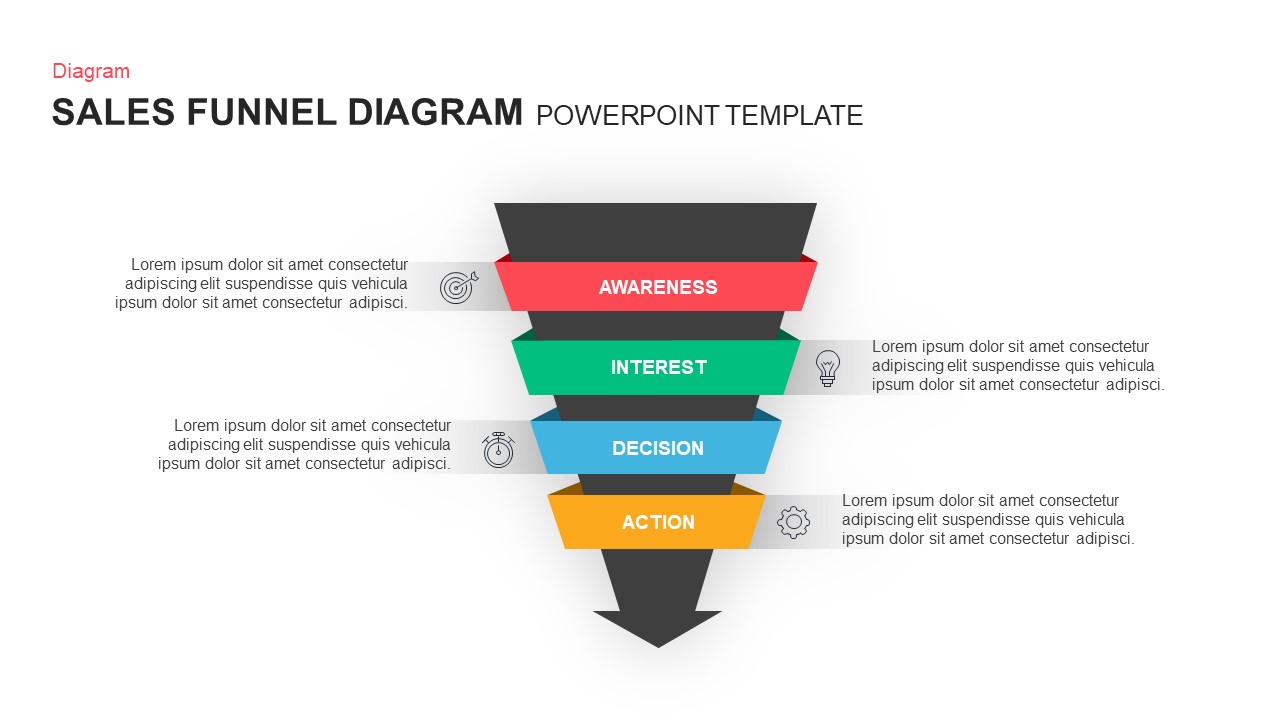
Professional Sales Funnel Diagram Template for PowerPoint & Google Slides
Funnel
Professional Sales Meeting Presentation Template for PowerPoint & Google Slides
Pitch Deck
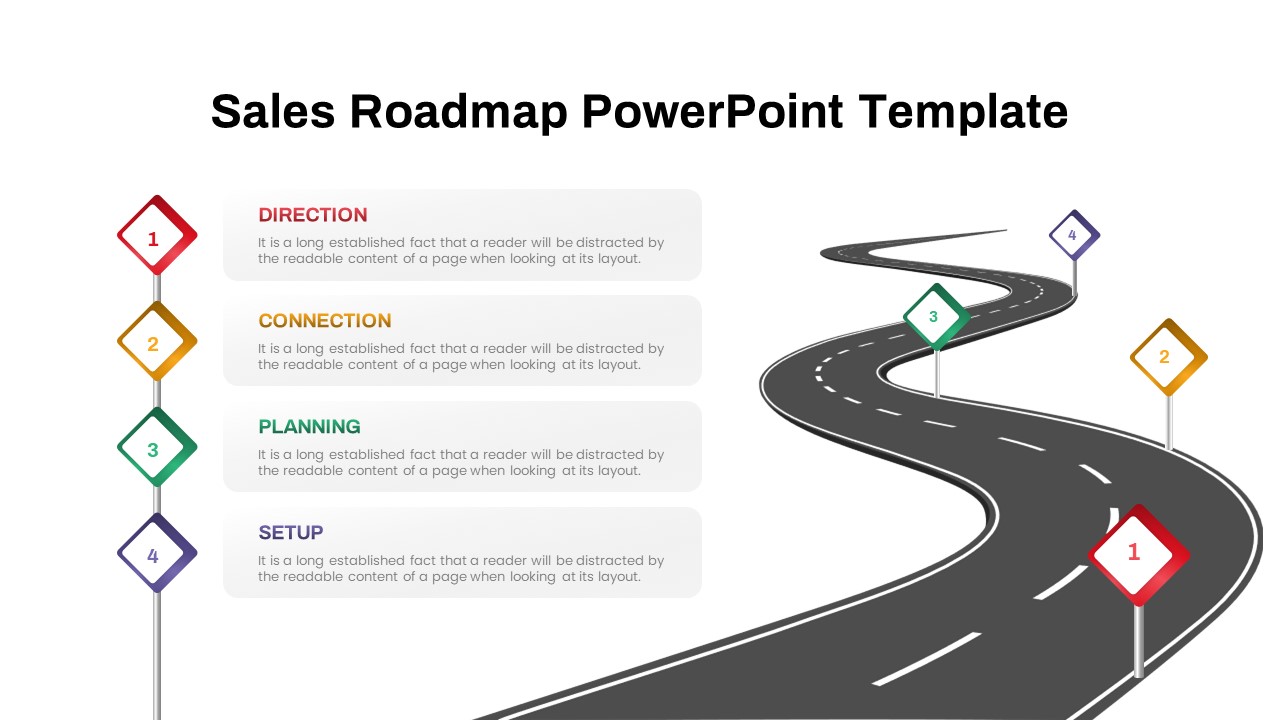
Professional Winding Road Sales Roadmap Template for PowerPoint & Google Slides
Roadmap
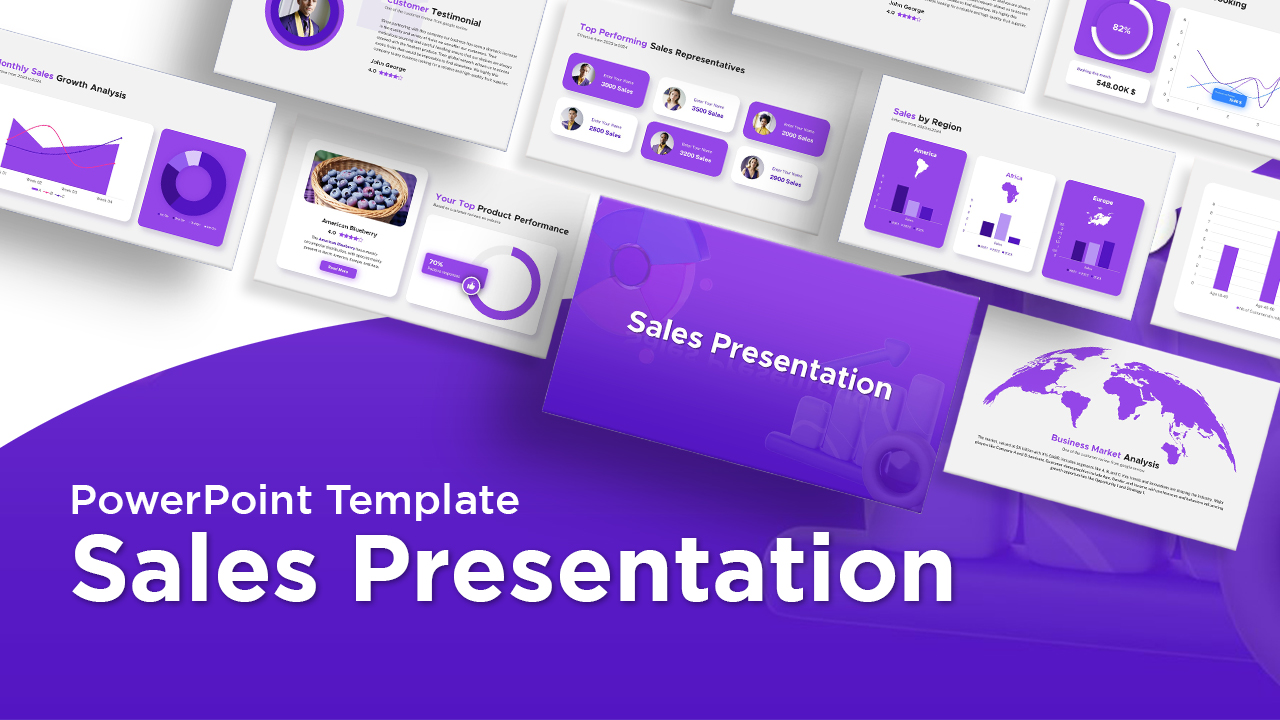
Professional Animated Sales Presentation Template for PowerPoint & Google Slides
Pitch Deck
Google Ads Optimization & Performance Infographic Template for PowerPoint & Google Slides
Digital Marketing
Free Professional Gantt Chart Pack – 4 Slides Template for PowerPoint & Google Slides
Gantt Chart
Free
Profit Performance Trend Chart Template for PowerPoint & Google Slides
Finance
Website Performance Dashboard template for PowerPoint & Google Slides
Charts
Performance Review Process Management Cycle template for PowerPoint & Google Slides
Employee Performance
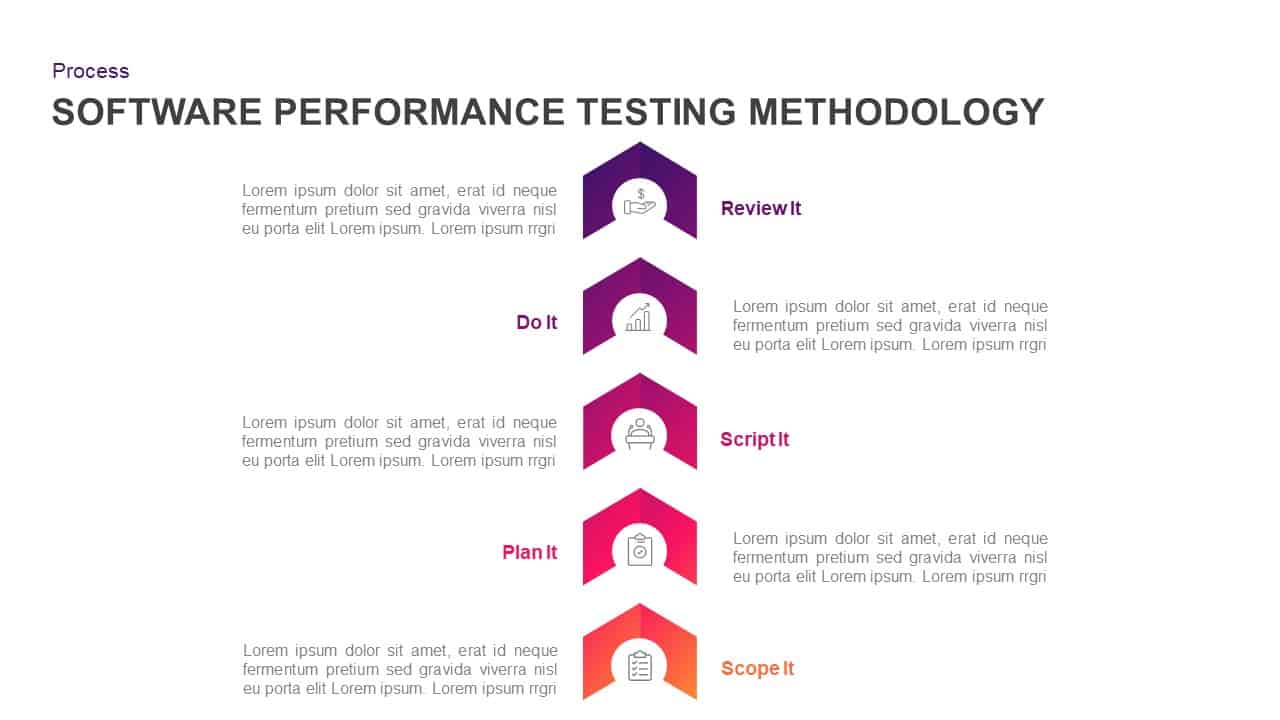
Software Performance Testing Methodology Template for PowerPoint & Google Slides
Process
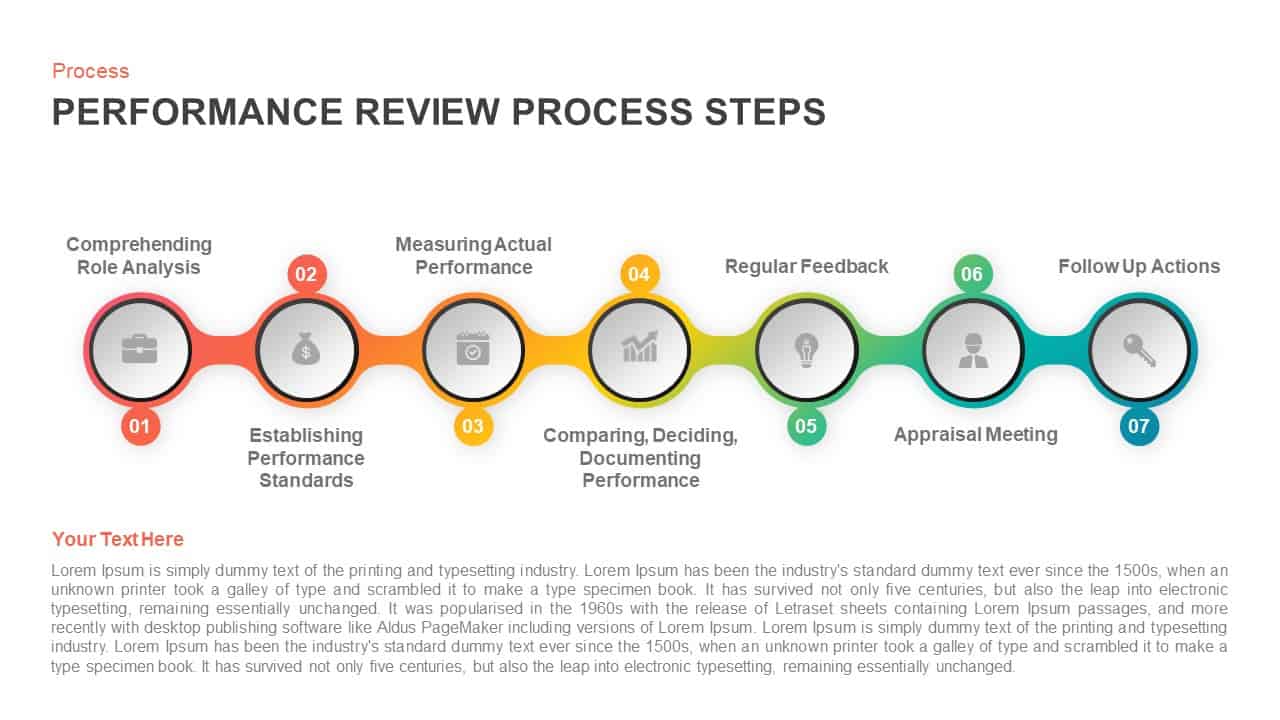
Performance Review Process Steps Template for PowerPoint & Google Slides
Employee Performance
Social Media Performance Dashboard Template for PowerPoint & Google Slides
Bar/Column
Performance Review Progress Management Template for PowerPoint & Google Slides
Process
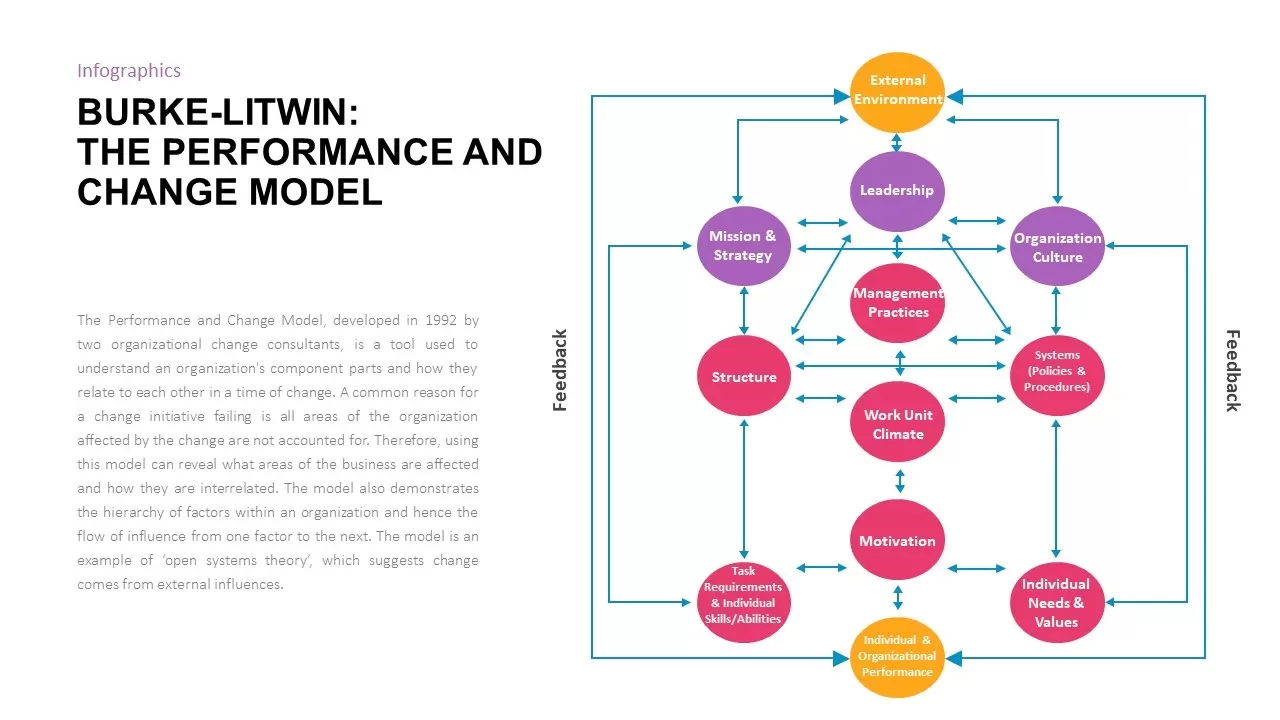
Burke-Litwin Performance and Change Model template for PowerPoint & Google Slides
Infographics
Corporate Performance Management Template for PowerPoint & Google Slides
Pitch Deck
Performance KPI Dashboard Slide Template for PowerPoint & Google Slides
Business Report
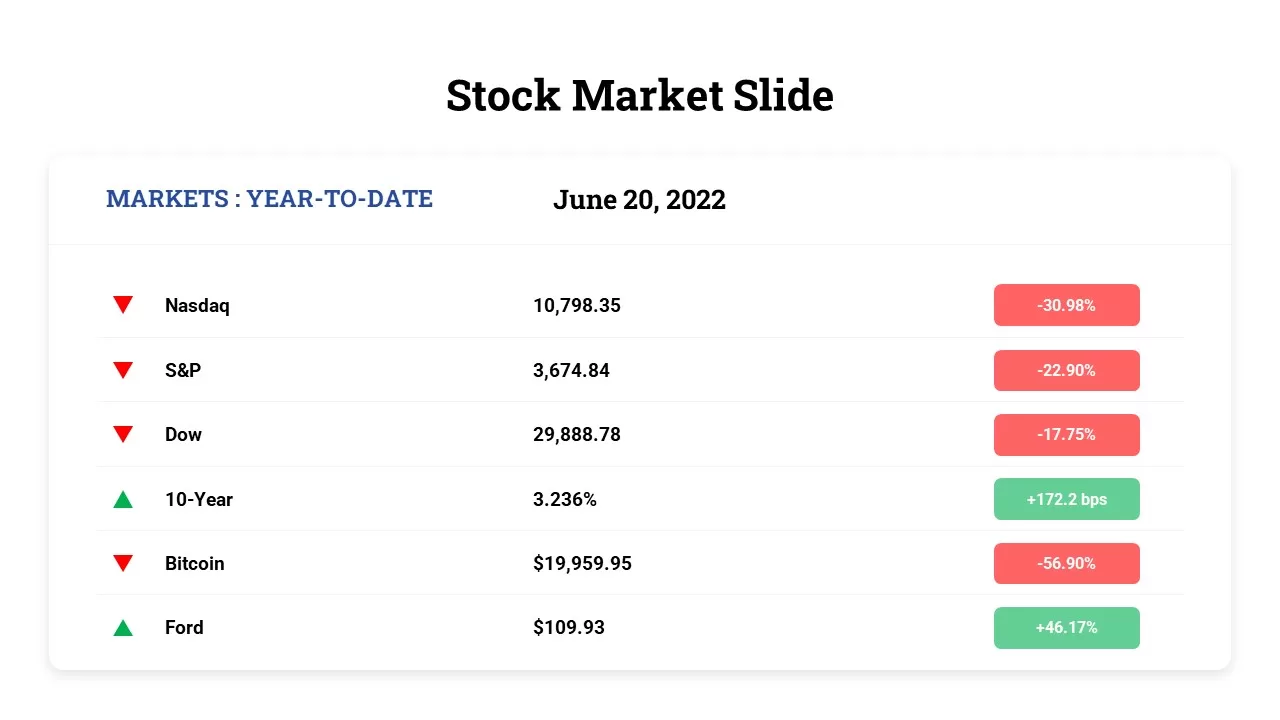
Free Stock Market Performance Overview template for PowerPoint & Google Slides
Finance
Free
9-Box Matrix for Performance & Potential Template for PowerPoint & Google Slides
Employee Performance
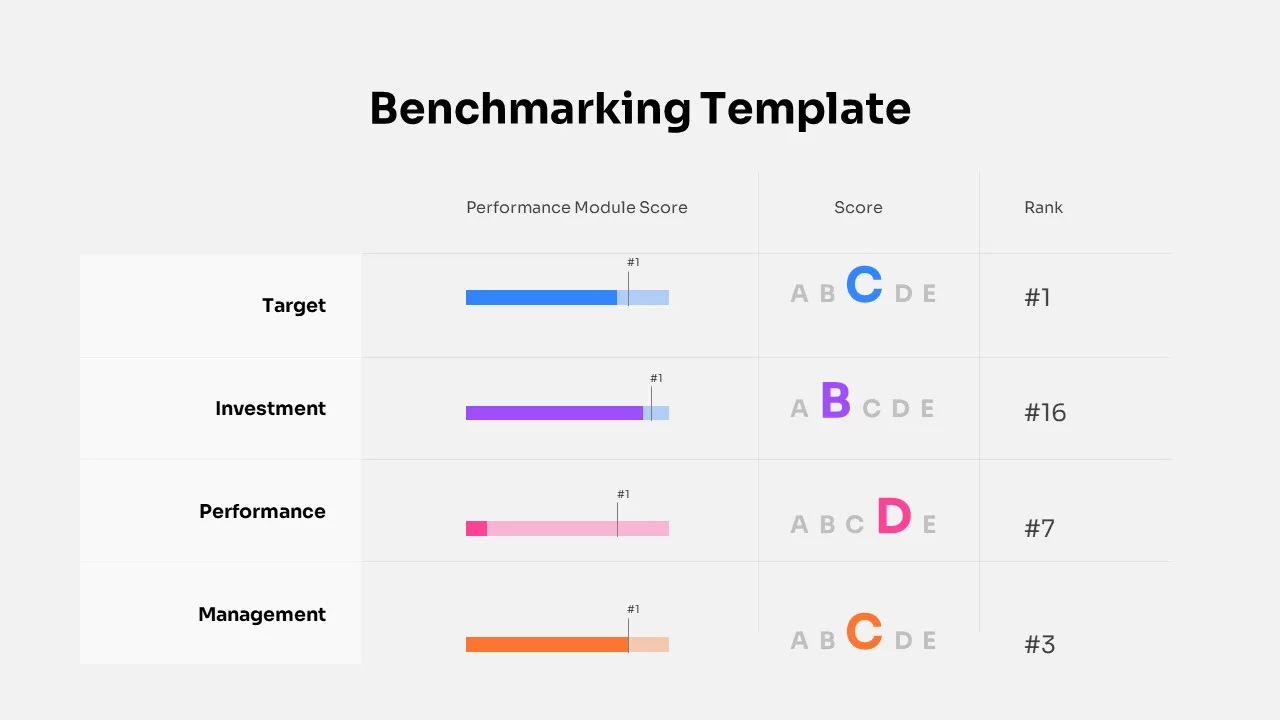
Benchmarking Performance Score Template for PowerPoint & Google Slides
Comparison Chart
Website Performance Monitoring Dashboard Template for PowerPoint & Google Slides
Business Report
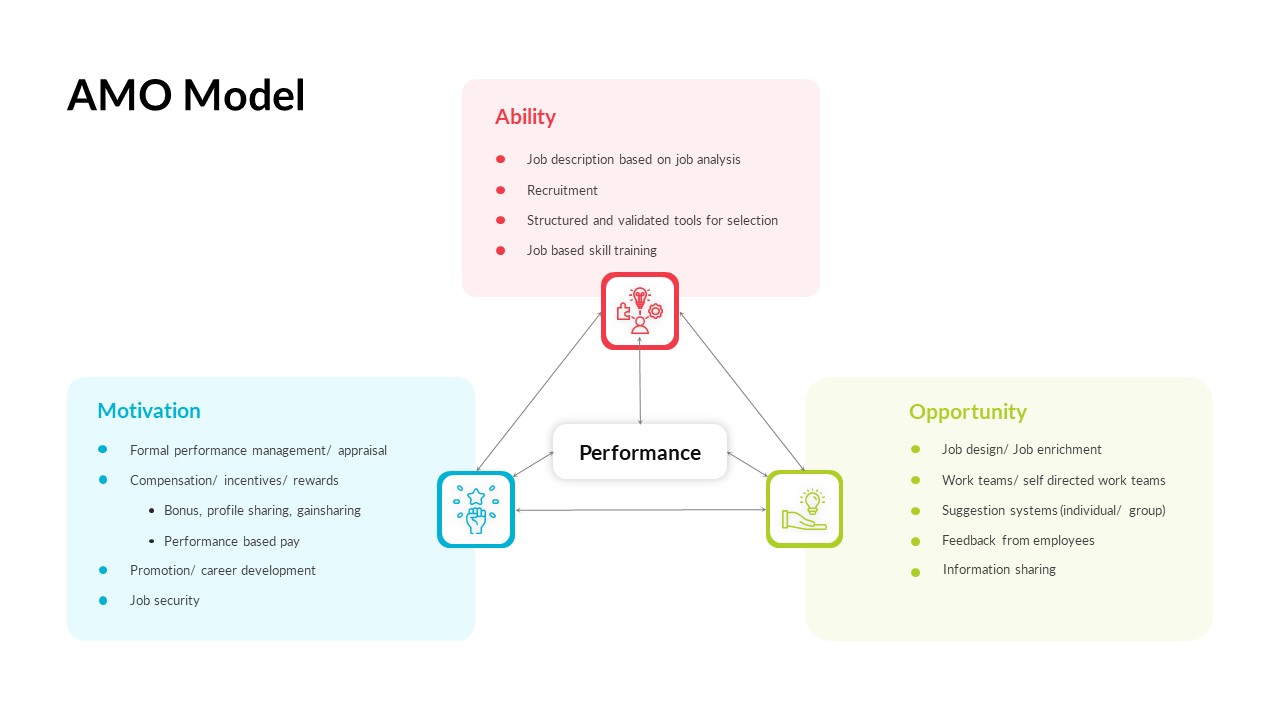
AMO Performance Model Feedback Diagram Template for PowerPoint & Google Slides
Employee Performance
Hits and Misses Performance Comparison Template for PowerPoint & Google Slides
Comparison
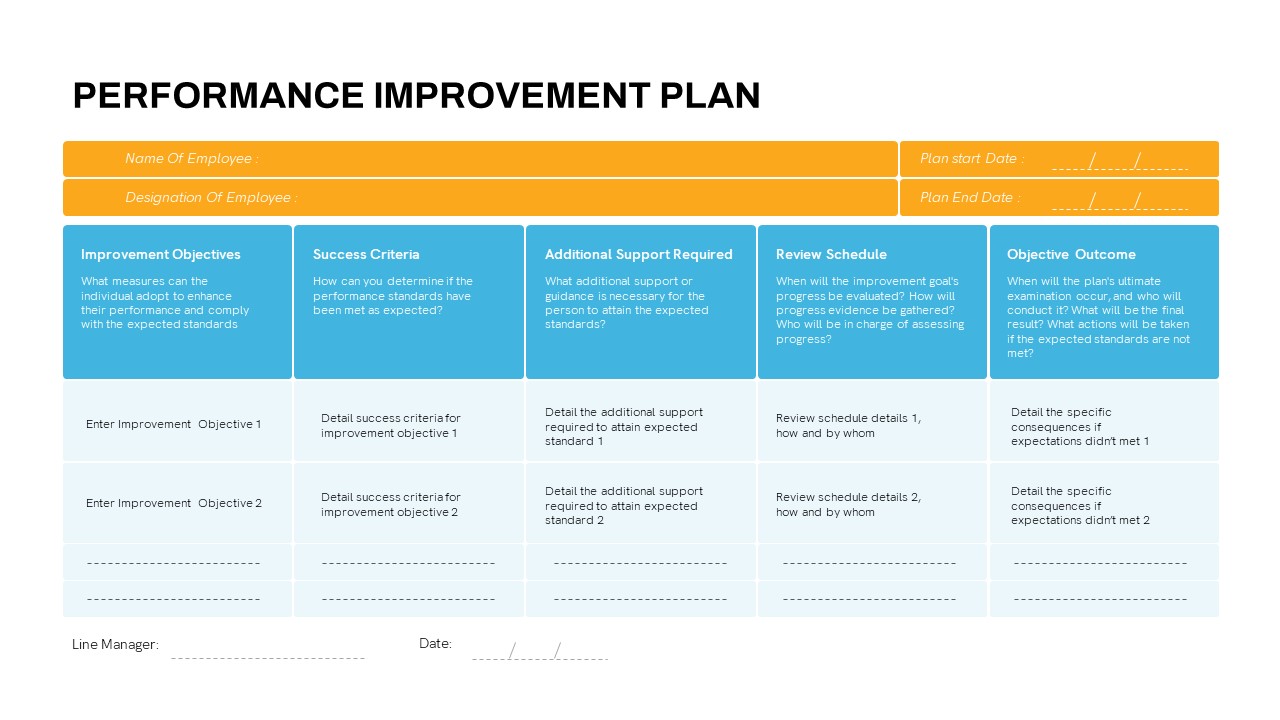
Detailed Performance Improvement Plan Template for PowerPoint & Google Slides
Employee Performance
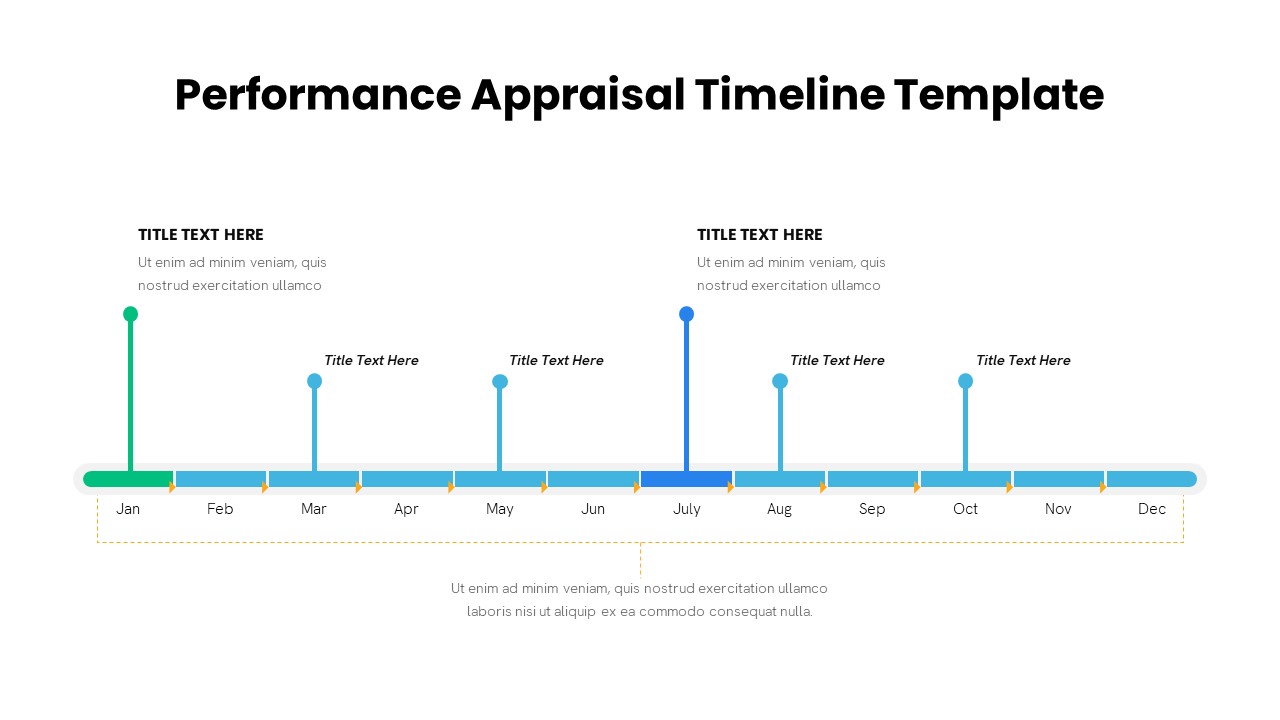
Performance Appraisal Timeline Diagram Template for PowerPoint & Google Slides
Timeline
DevOps KPI Dashboard Performance Metrics Template for PowerPoint & Google Slides
Software Development
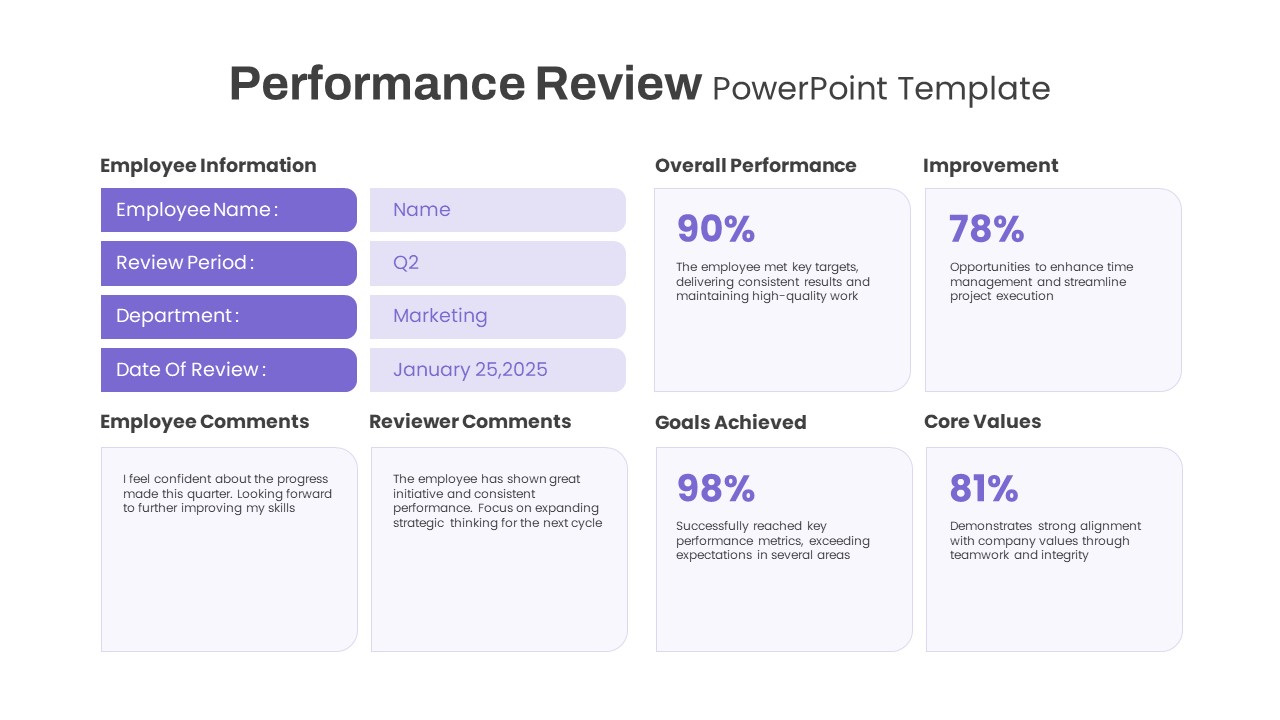
Performance Review template for PowerPoint & Google Slides
Employee Performance
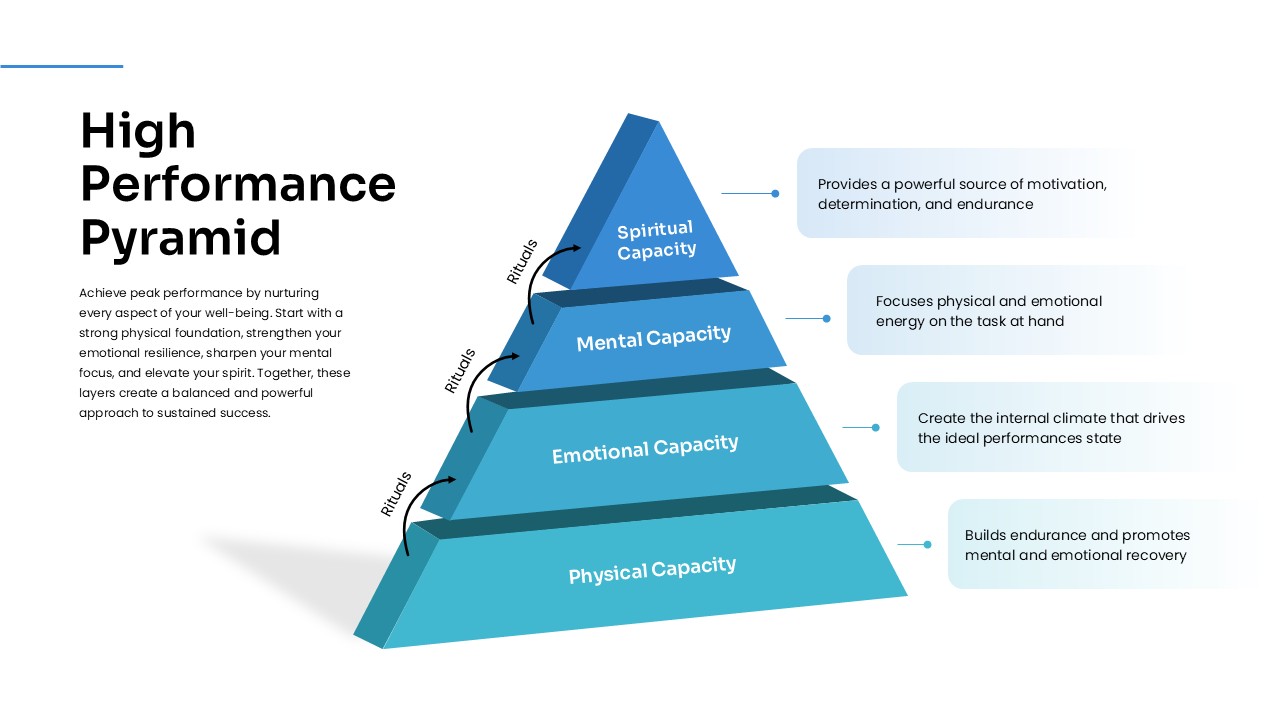
High Performance Pyramid Diagram Template for PowerPoint & Google Slides
Pyramid
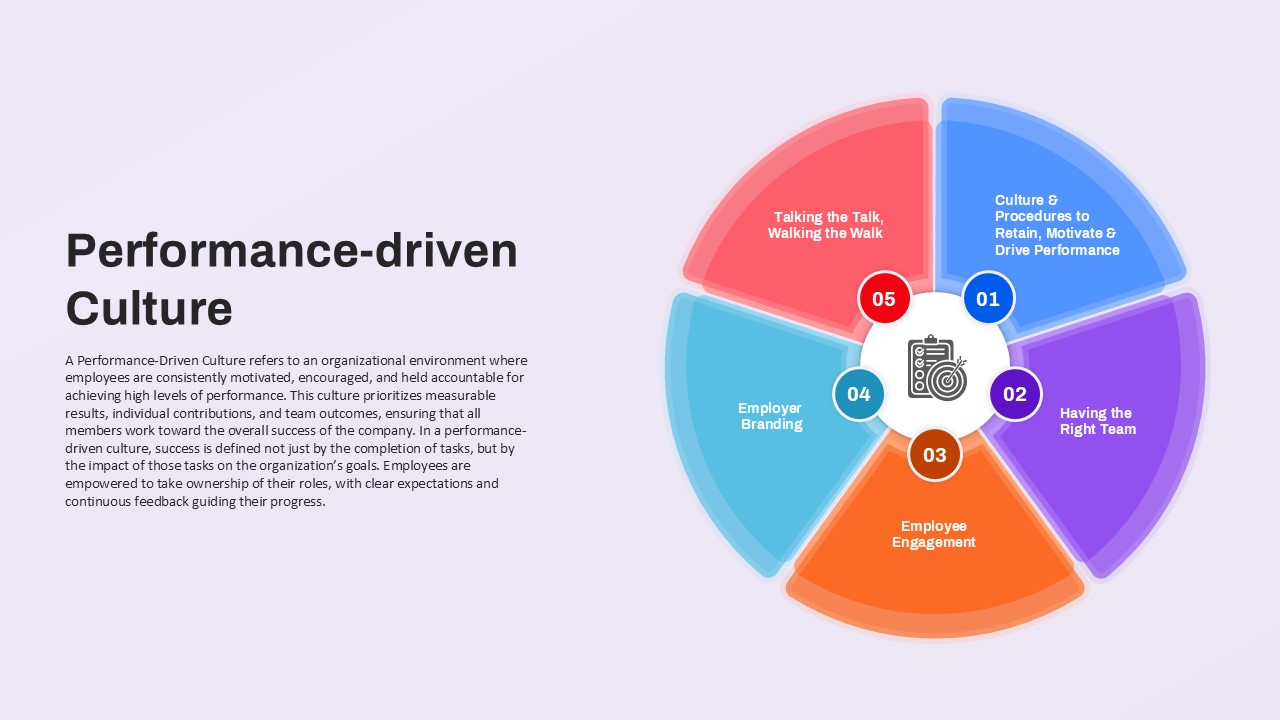
Performance-driven Culture framework template for PowerPoint & Google Slides
Leadership
Employee Performance Metrics Dashboard Template for PowerPoint & Google Slides
Employee Performance
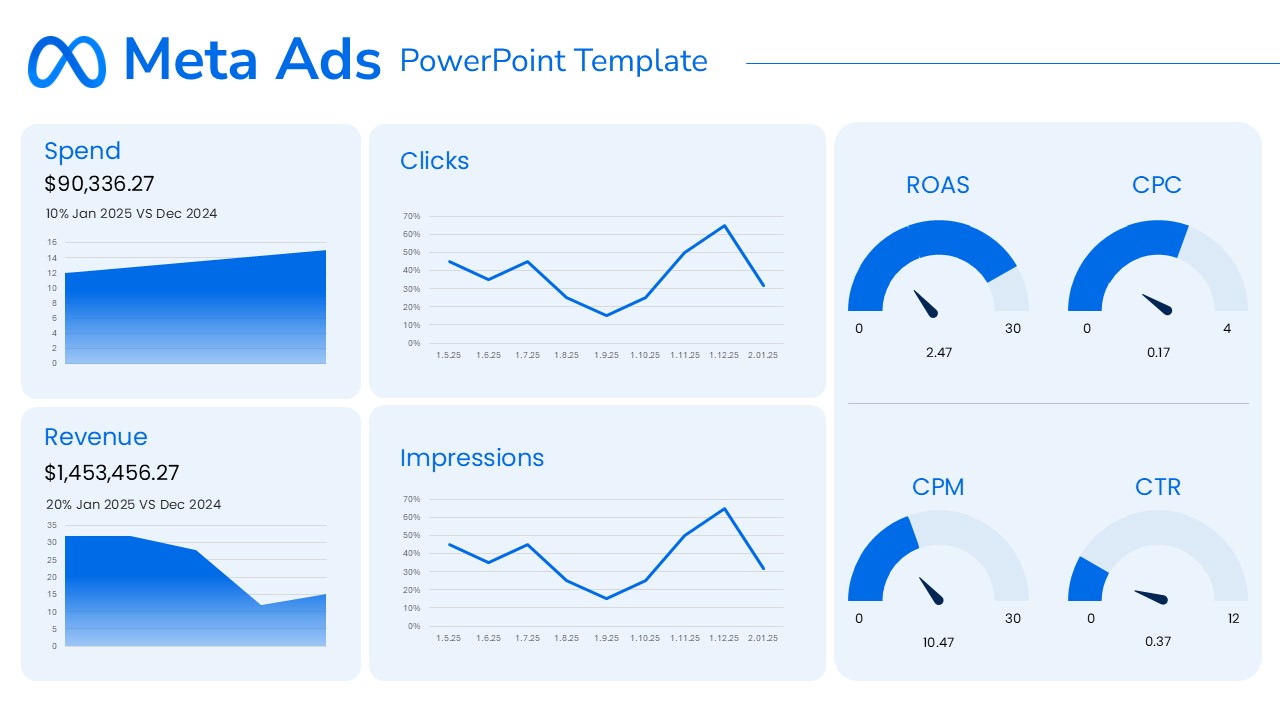
Meta Ads Performance Overview template for PowerPoint & Google Slides
Advertising
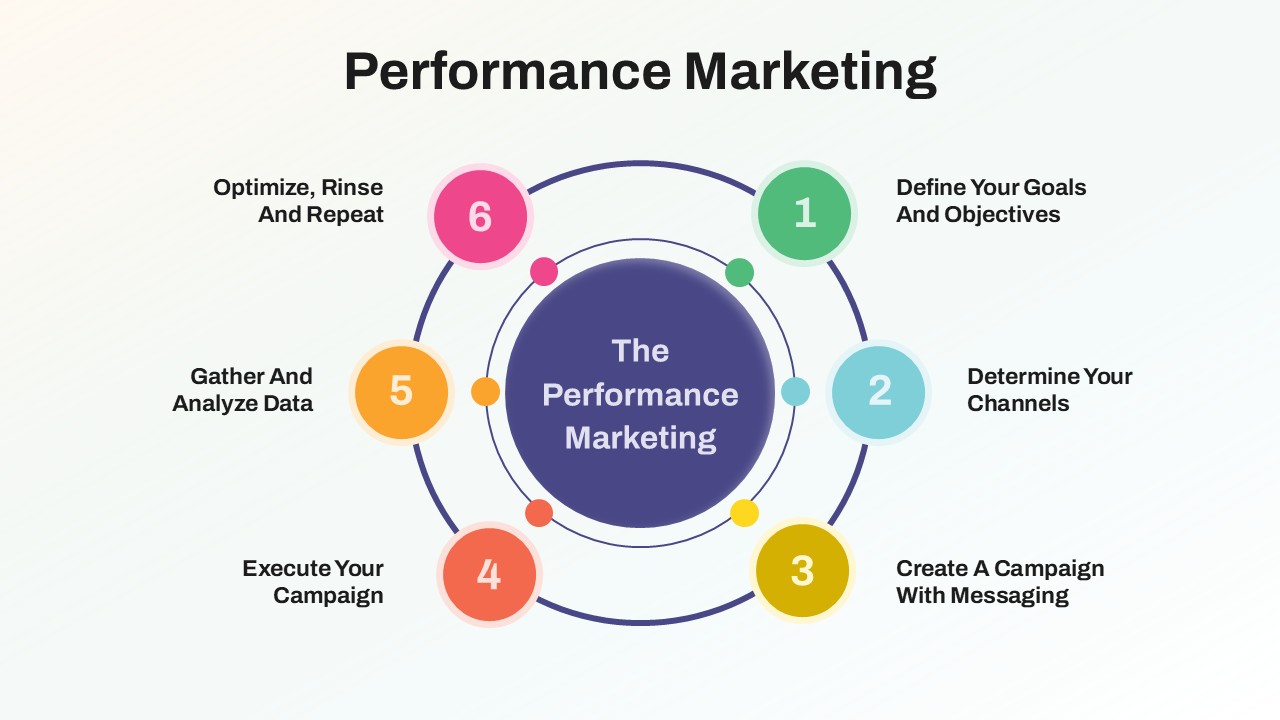
Performance Marketing Strategy template for PowerPoint & Google Slides
Digital Marketing
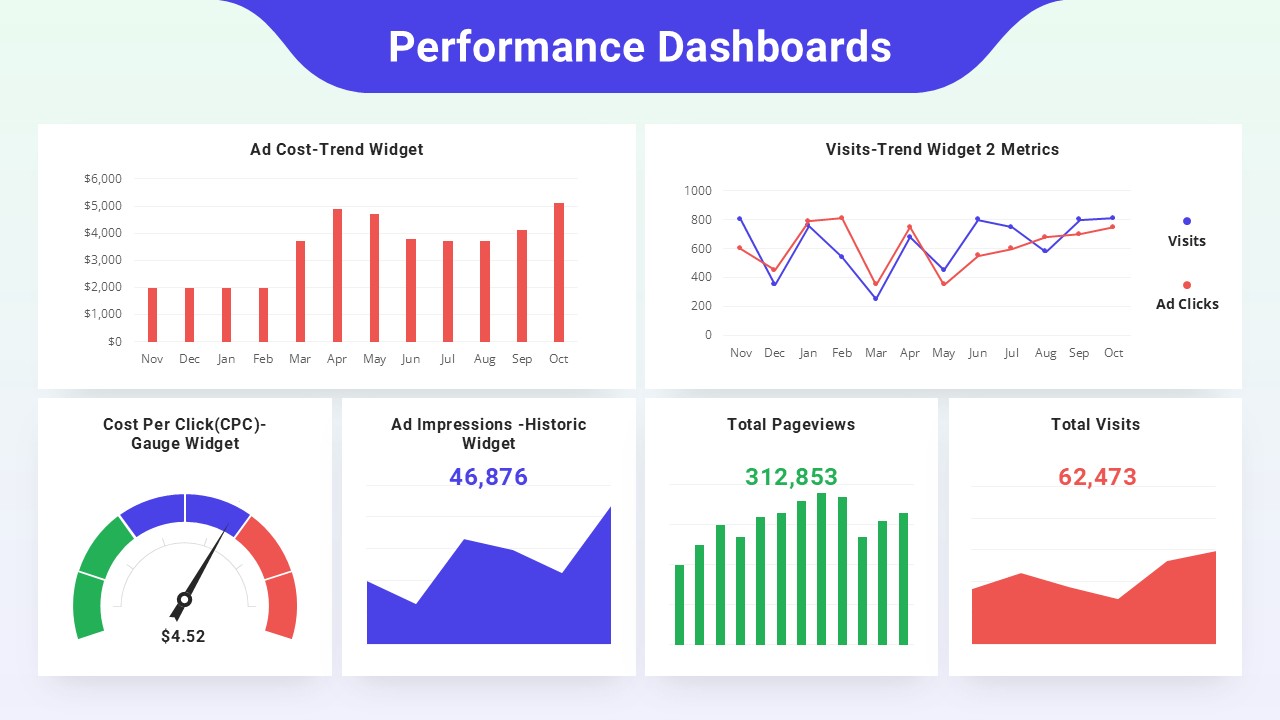
Performance Dashboards Overview Template for PowerPoint & Google Slides
Business Report
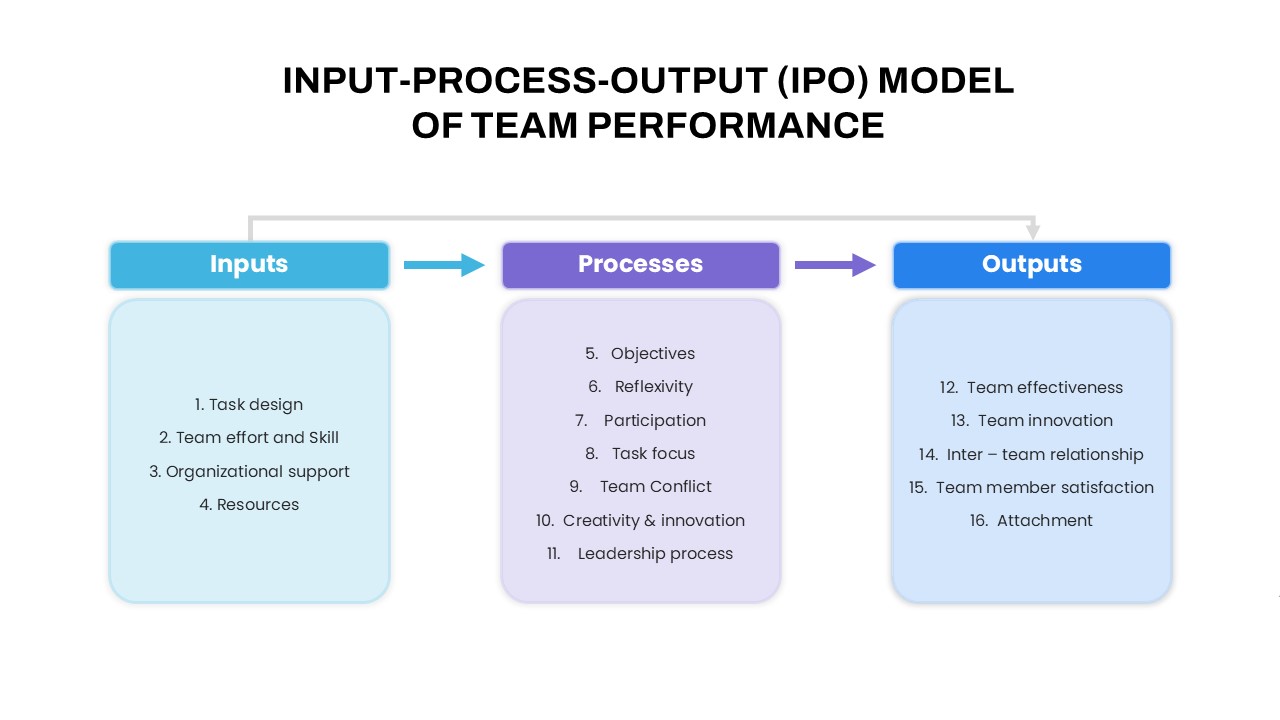
IPO Model of Team Performance for PowerPoint & Google Slides
Process
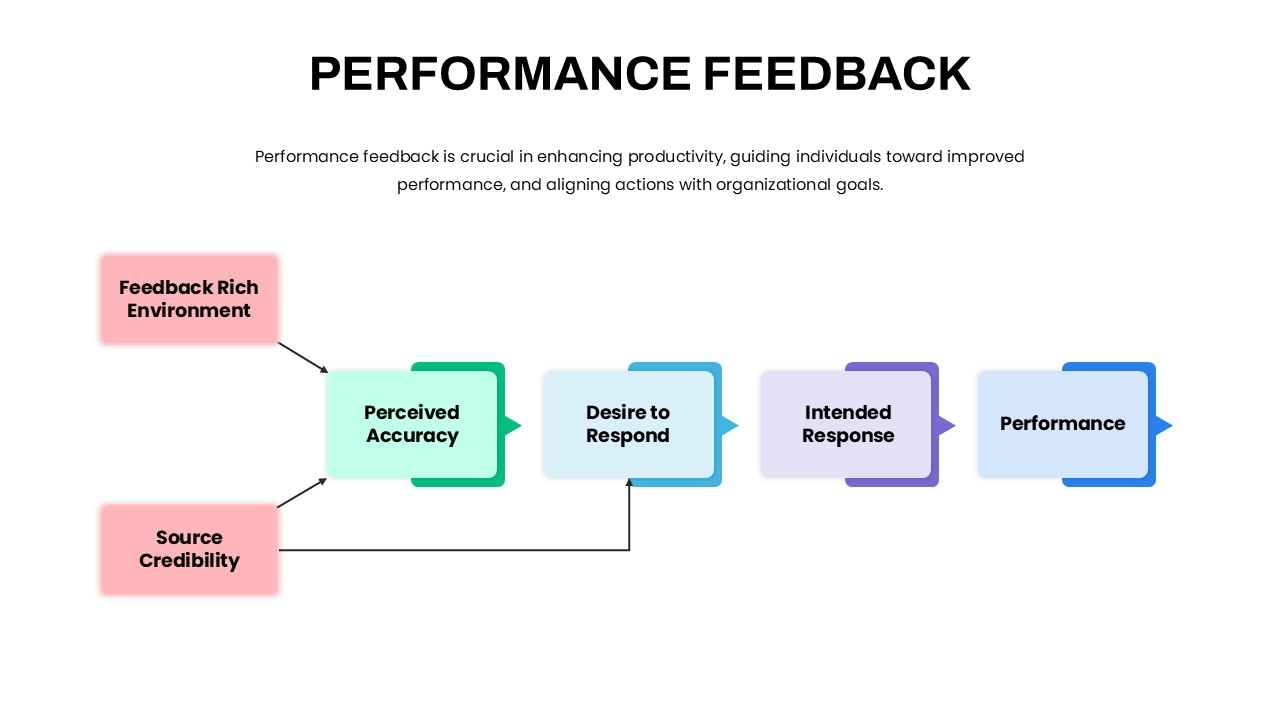
Performance Feedback Model for PowerPoint & Google Slides
Employee Performance
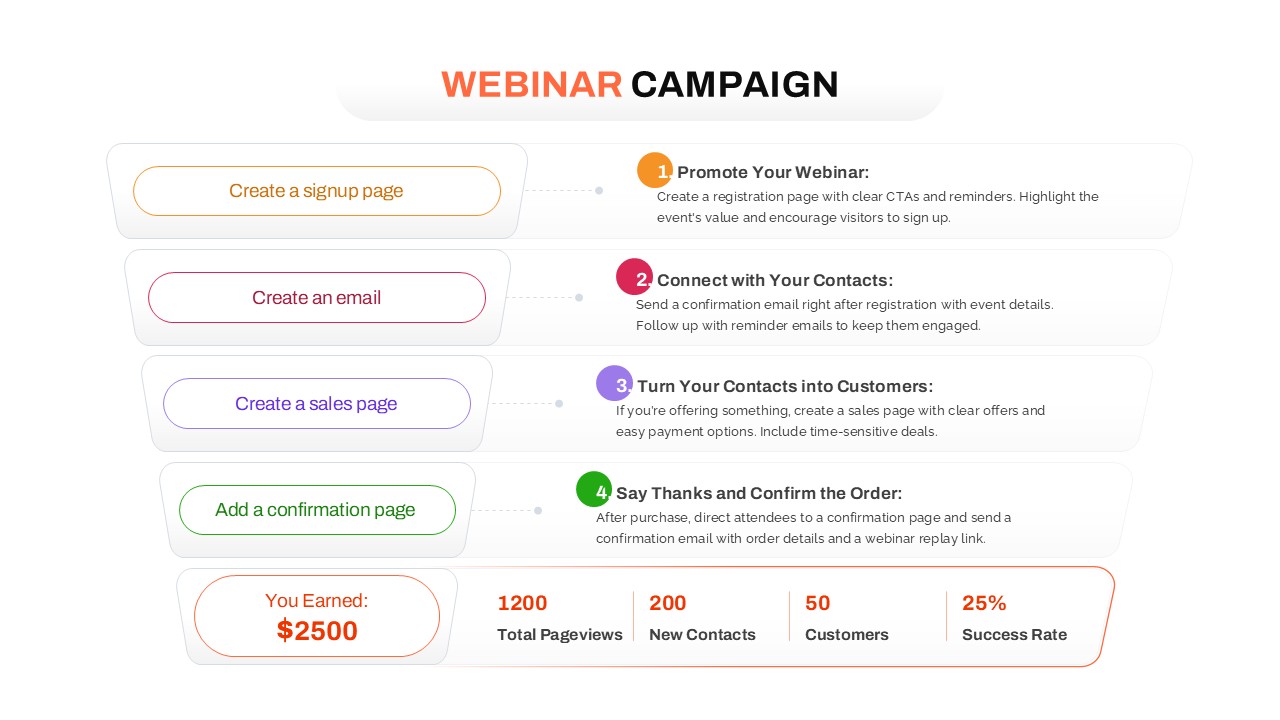
Webinar Campaign Steps and Performance for PowerPoint & Google Slides
Advertising
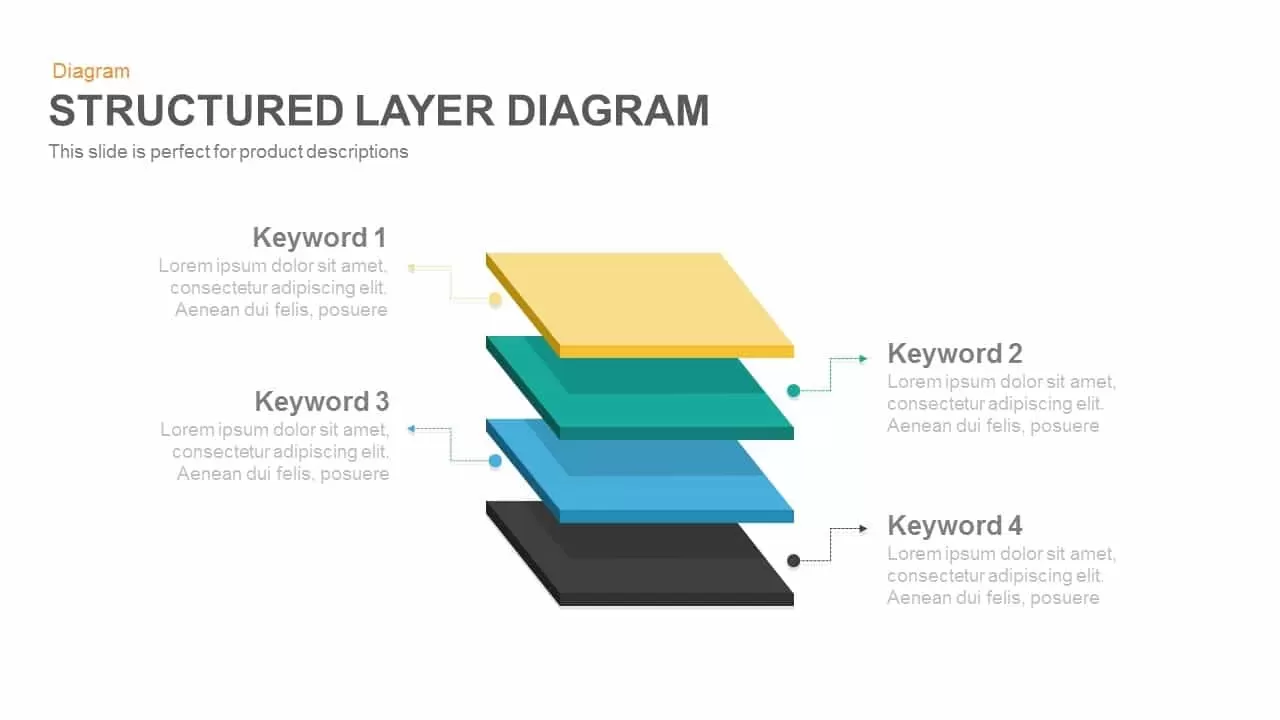
Professional Structured 3D Layer Diagram Template for PowerPoint & Google Slides
Process
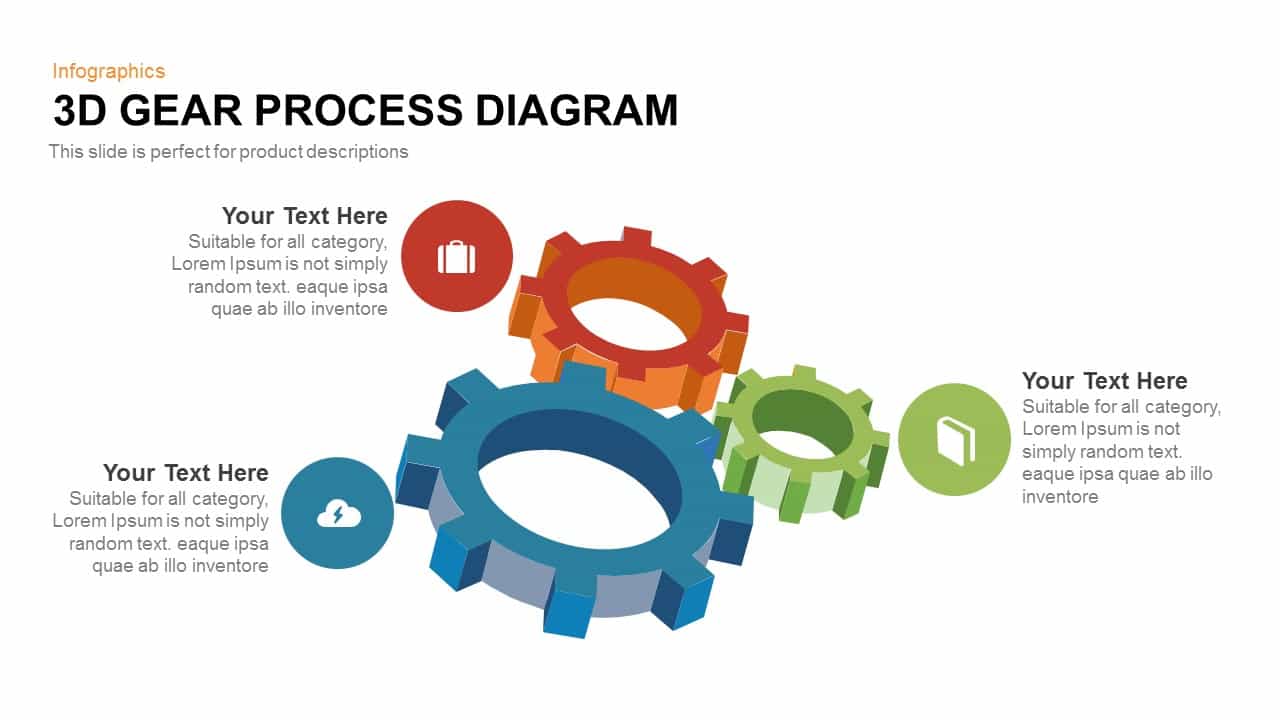
Professional 3D Gear Process Diagram Template for PowerPoint & Google Slides
Process
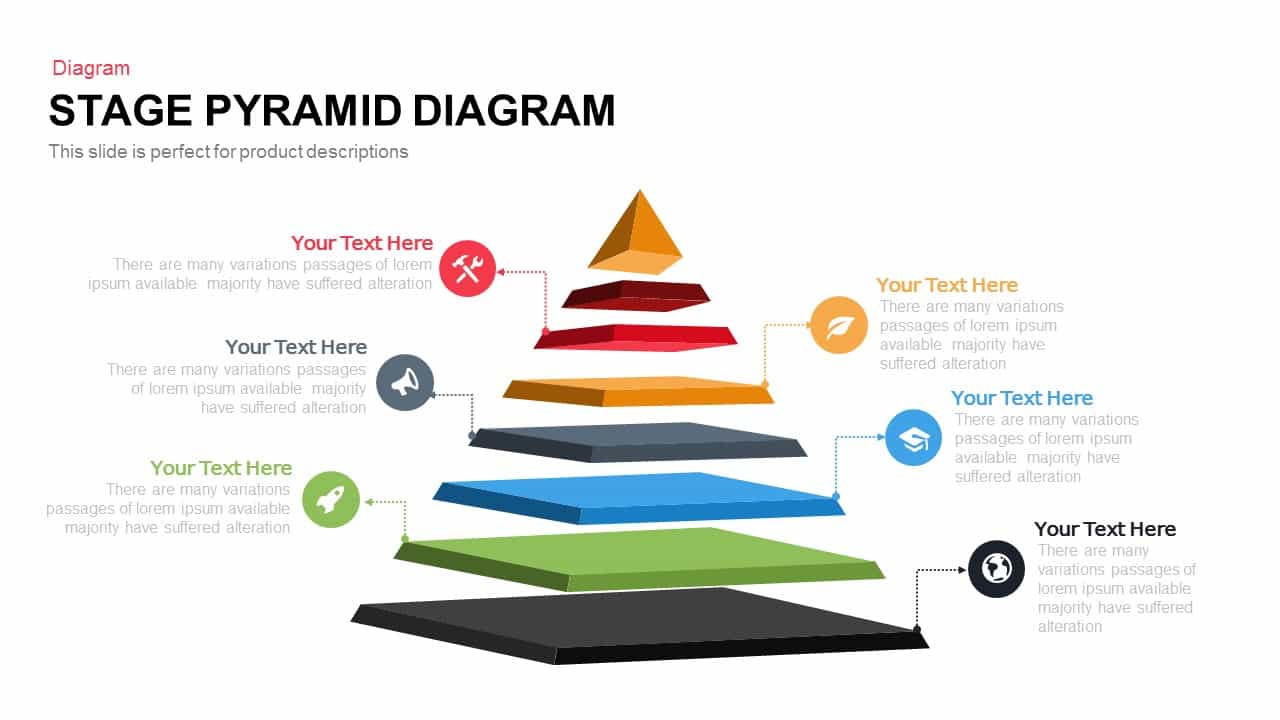
Professional 5-Stage Pyramid Diagram Template for PowerPoint & Google Slides
Pyramid
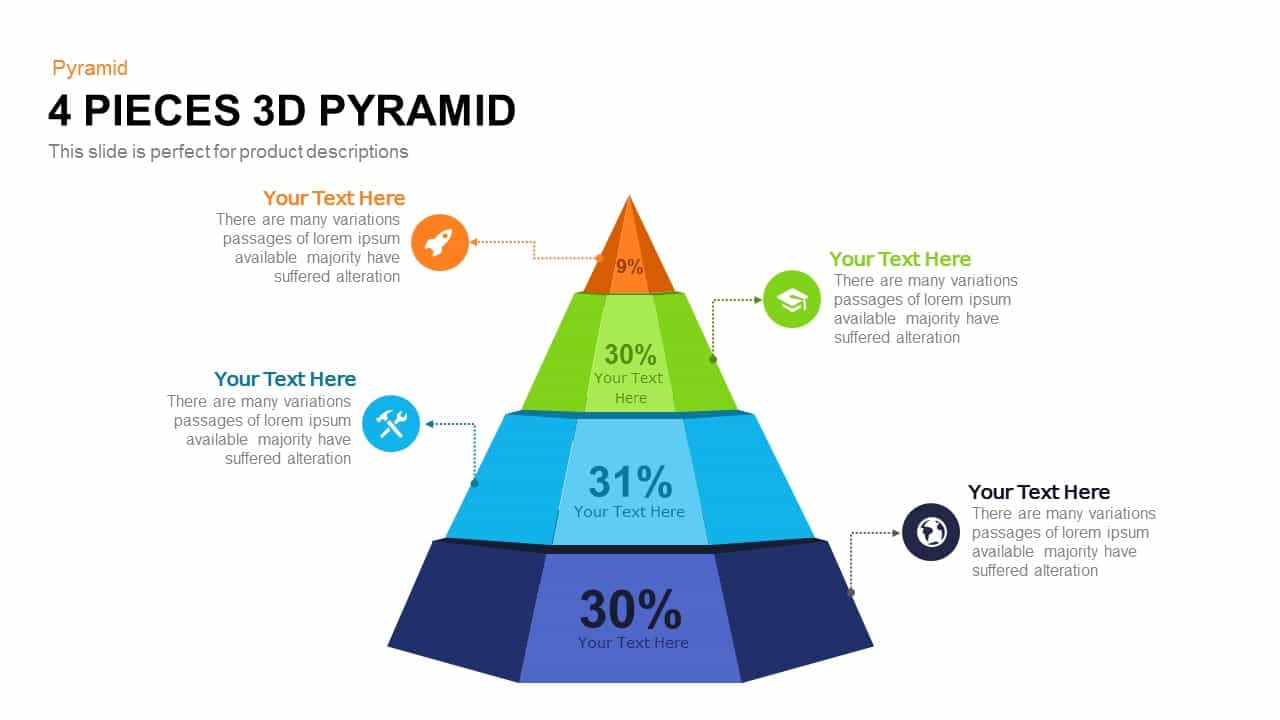
Professional 4-Piece 3D Pyramid Diagram Template for PowerPoint & Google Slides
Pyramid
Professional Team Efficiency Dashboard Template for PowerPoint & Google Slides
Business Report
Professional Four-Stage Funnel Diagram Template for PowerPoint & Google Slides
Funnel
Professional Security Metaphor Diagram Template for PowerPoint & Google Slides
Information Technology
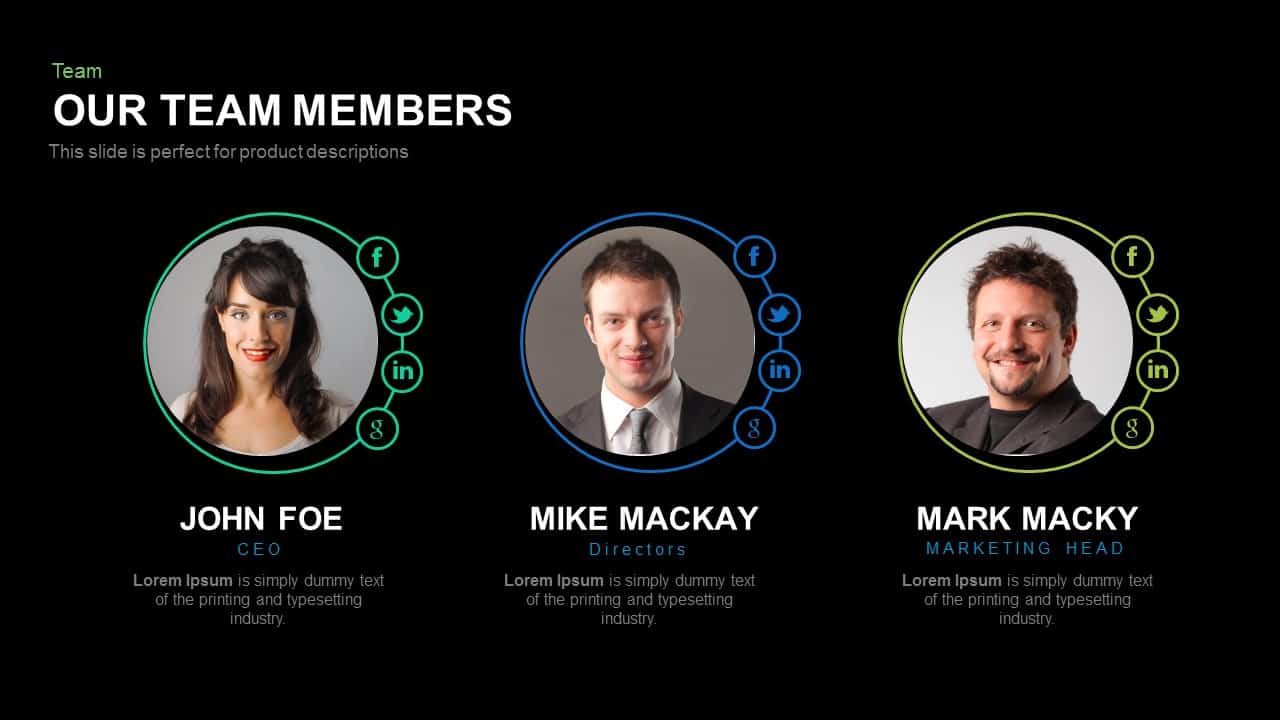
Professional Team Members Slide Template for PowerPoint & Google Slides
Our Team
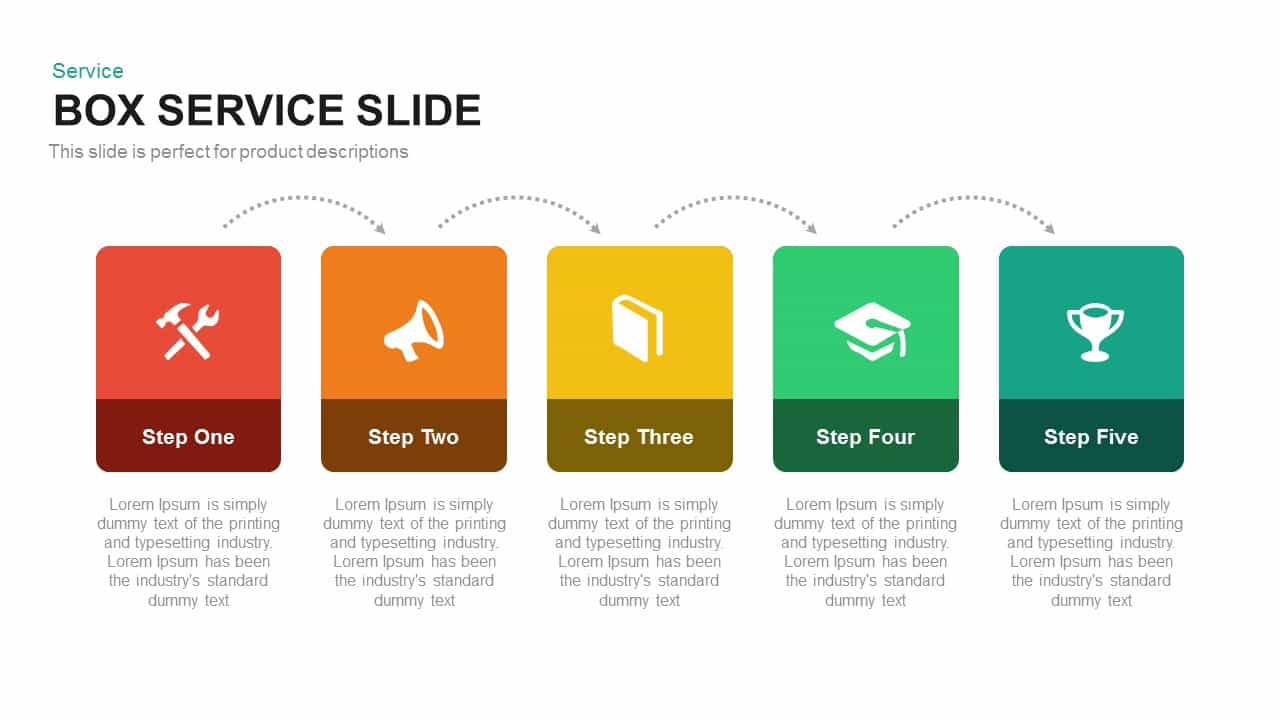
Professional Box Service Diagram Template for PowerPoint & Google Slides
Comparison
Professional Linear Timeline Infographic Template for PowerPoint & Google Slides
Timeline

Professional PESTEL Analysis Diagram Template for PowerPoint & Google Slides
PEST

Professional Four-Section Layer Diagram Template for PowerPoint & Google Slides
Process
Free Professional Cloud Infographics Template for PowerPoint & Google Slides
Process
Free
Six-Section Professional Agenda Template for PowerPoint & Google Slides
Agenda
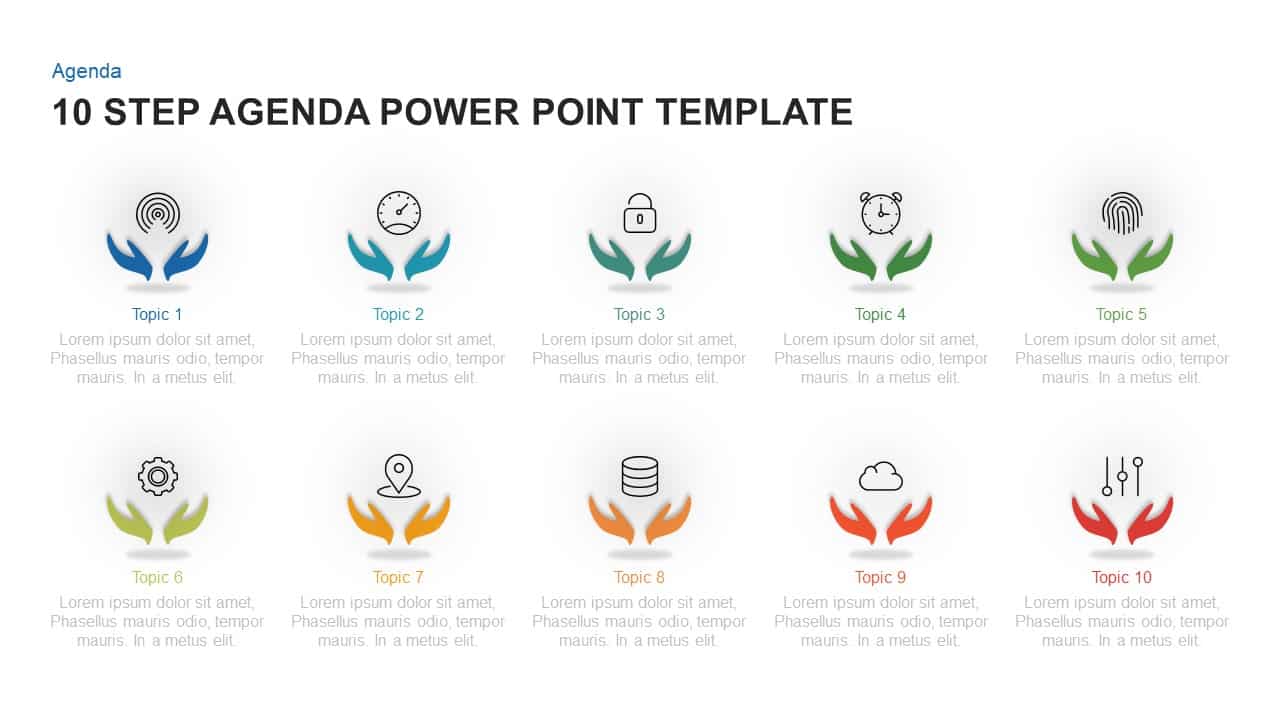
Professional Ten-Step Agenda Slide Template for PowerPoint & Google Slides
Agenda
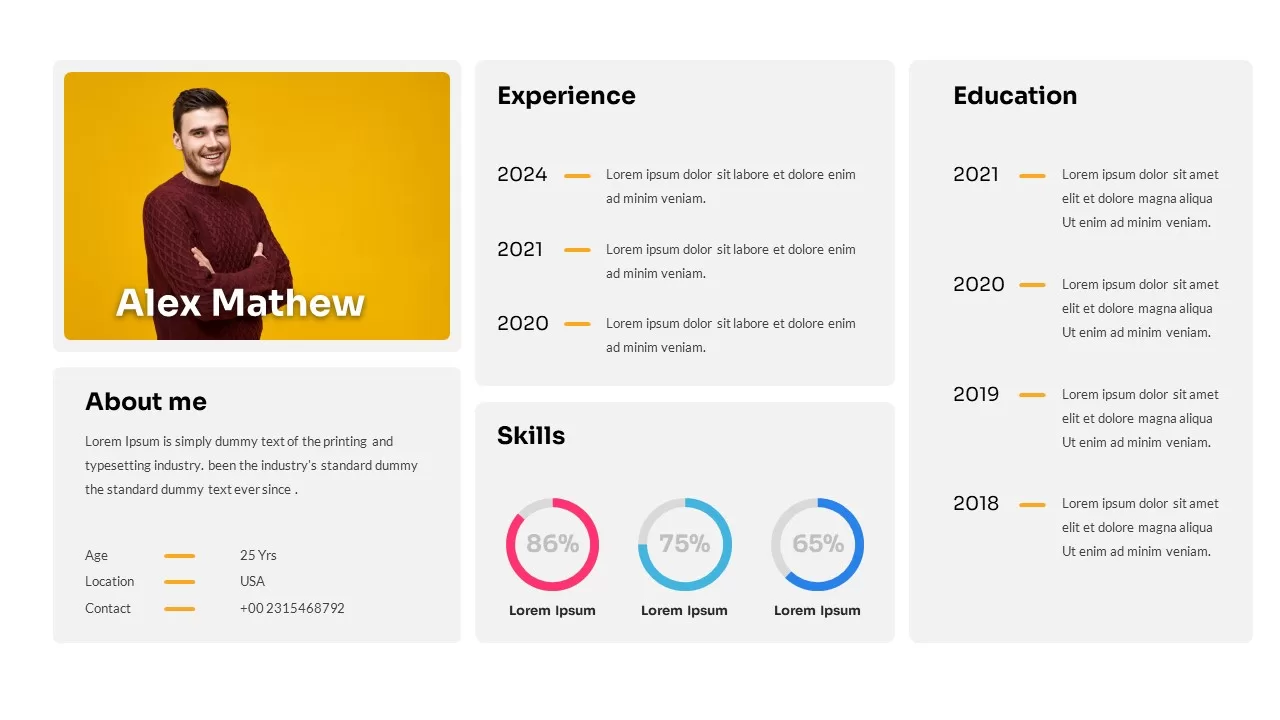
Professional Personal CV Presentation Template for PowerPoint & Google Slides
Company Profile
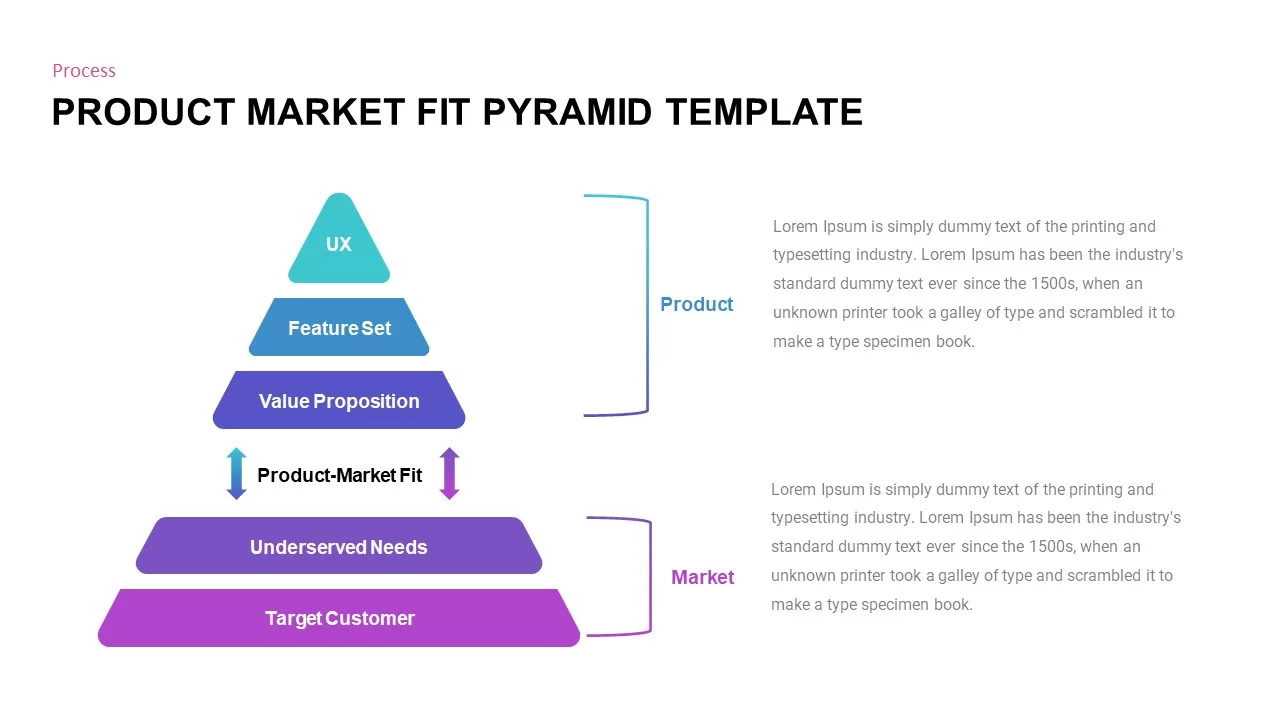
Professional Product Market Fit Pyramid Template for PowerPoint & Google Slides
Pyramid
Professional Book Review Infographic Template for PowerPoint & Google Slides
Business
Professional Organizational Chart Diagram Template for PowerPoint & Google Slides
Org Chart

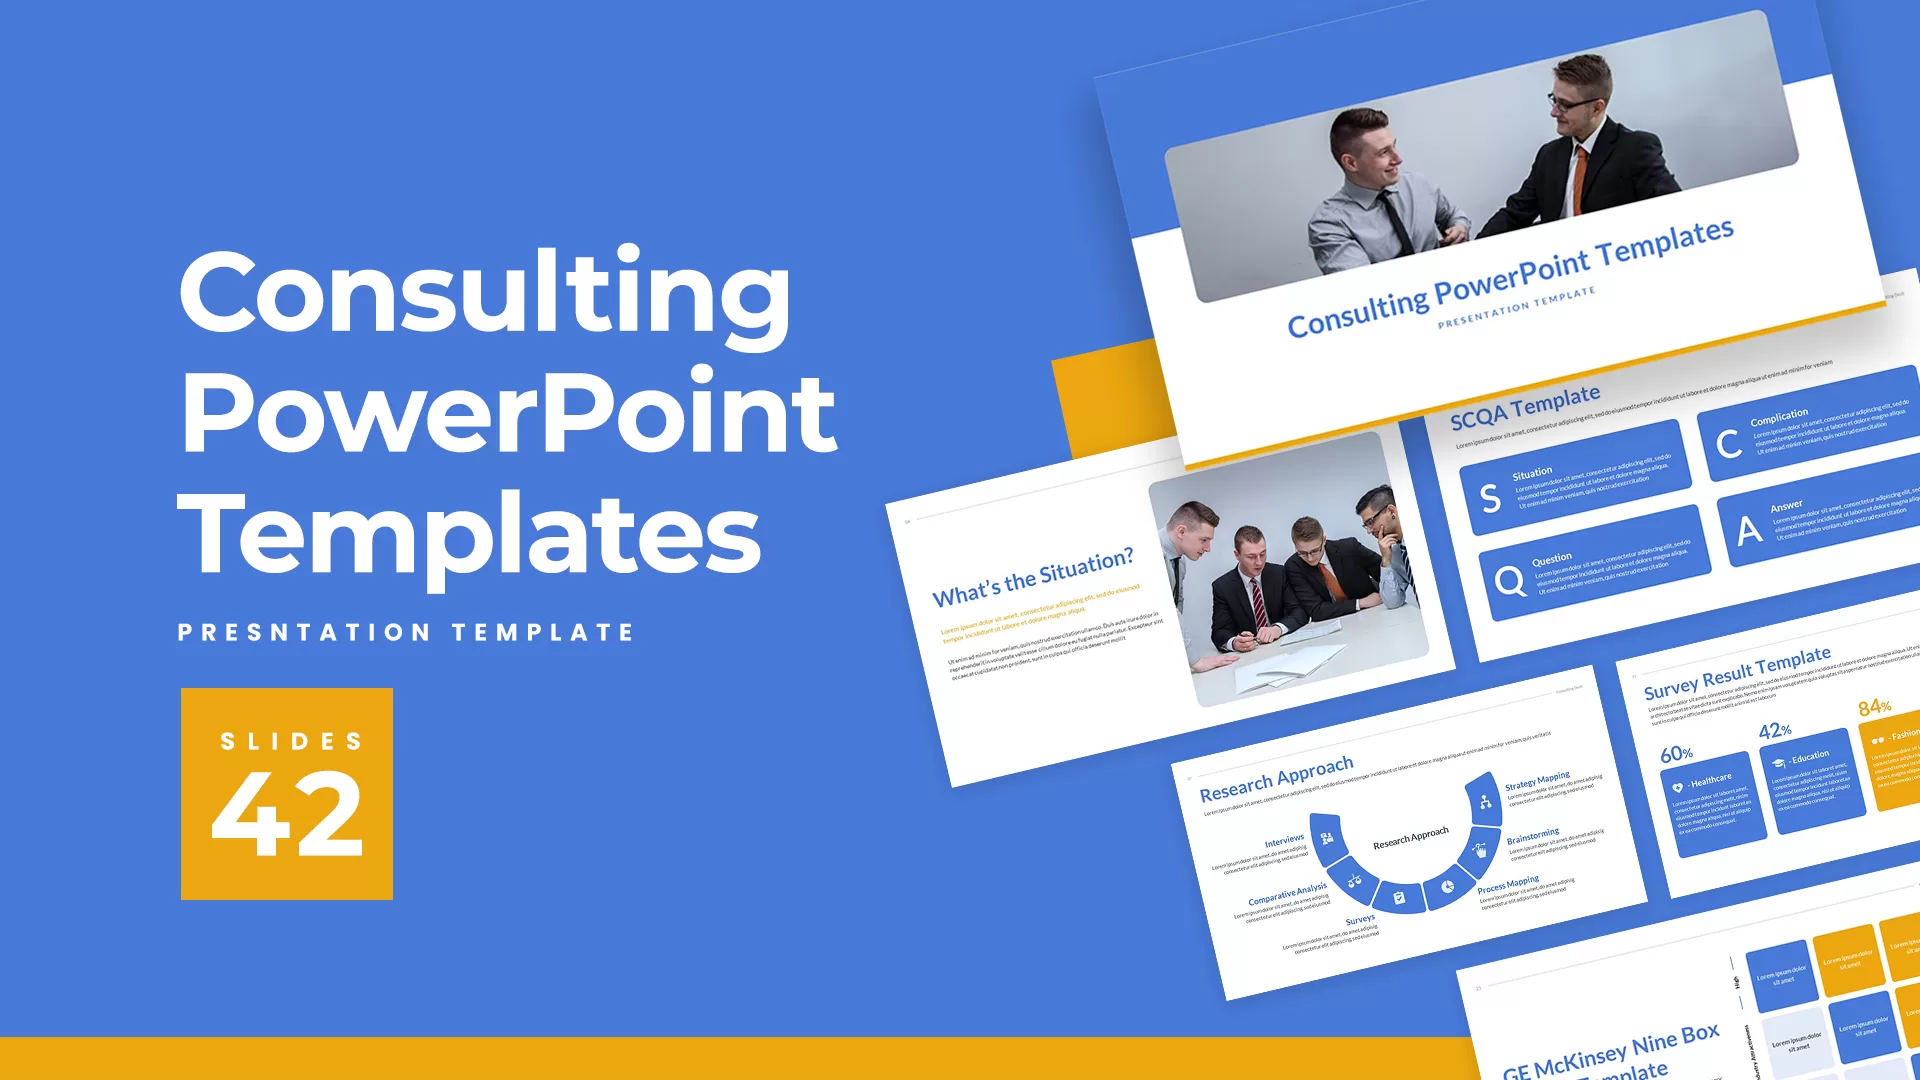
Professional Consulting Deck Presentation Template for PowerPoint & Google Slides
Pitch Deck
Professional Resume Profile Slide Template for PowerPoint & Google Slides
Recruitment
Professional Nurse Infographic Dashboard Template for PowerPoint & Google Slides
Nursing
Professional Risk Heat Map Visualization Template for PowerPoint & Google Slides
Risk Management
Professional Interactive Heat Map Matrix Template for PowerPoint & Google Slides
Comparison Chart
Professional Nurse-Led Healthcare Template for PowerPoint & Google Slides
Nursing
Professional Company About Us Slide Template for PowerPoint & Google Slides
Company Profile
Professional Team Collage & KPI Slide Template for PowerPoint & Google Slides
Business
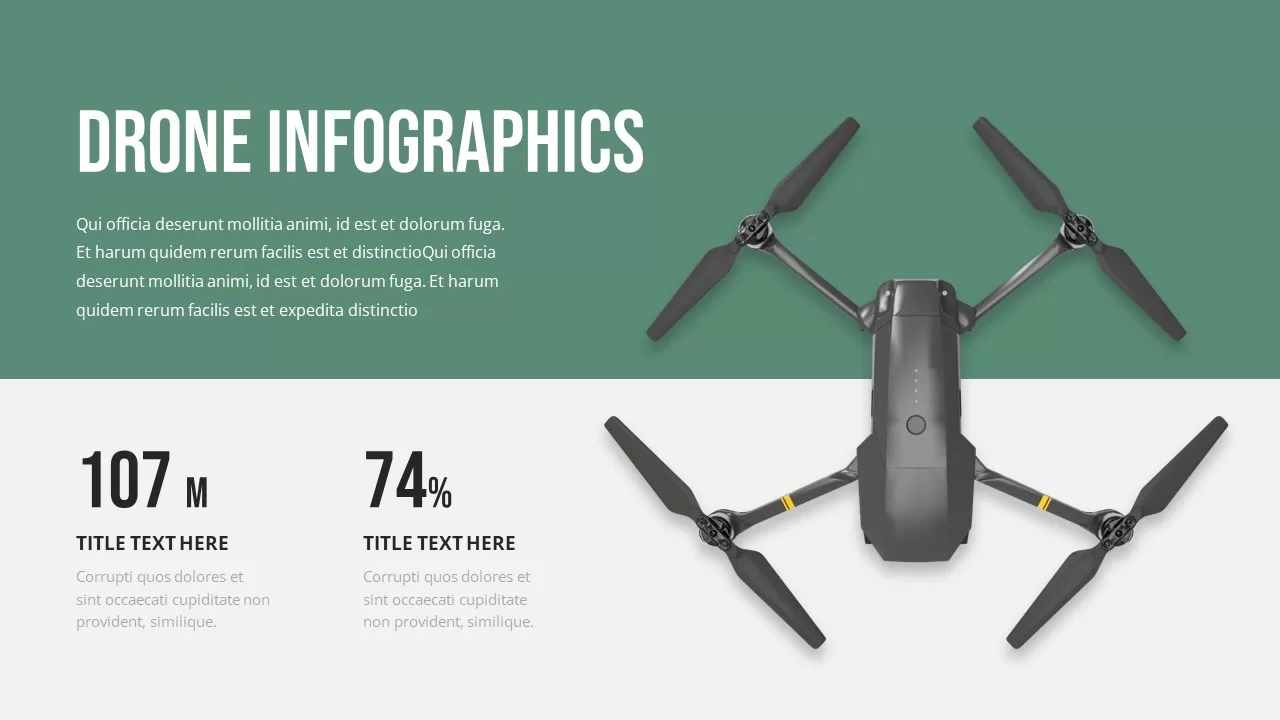
Professional Drone Infographic Slide Template for PowerPoint & Google Slides
Infographics
Professional Corporate Cover Slide Template for PowerPoint & Google Slides
Company Profile
Professional Angular Cover Slide Template for PowerPoint & Google Slides
Company Profile
Professional Portfolio Presentation Deck Template for PowerPoint & Google Slides
Decks
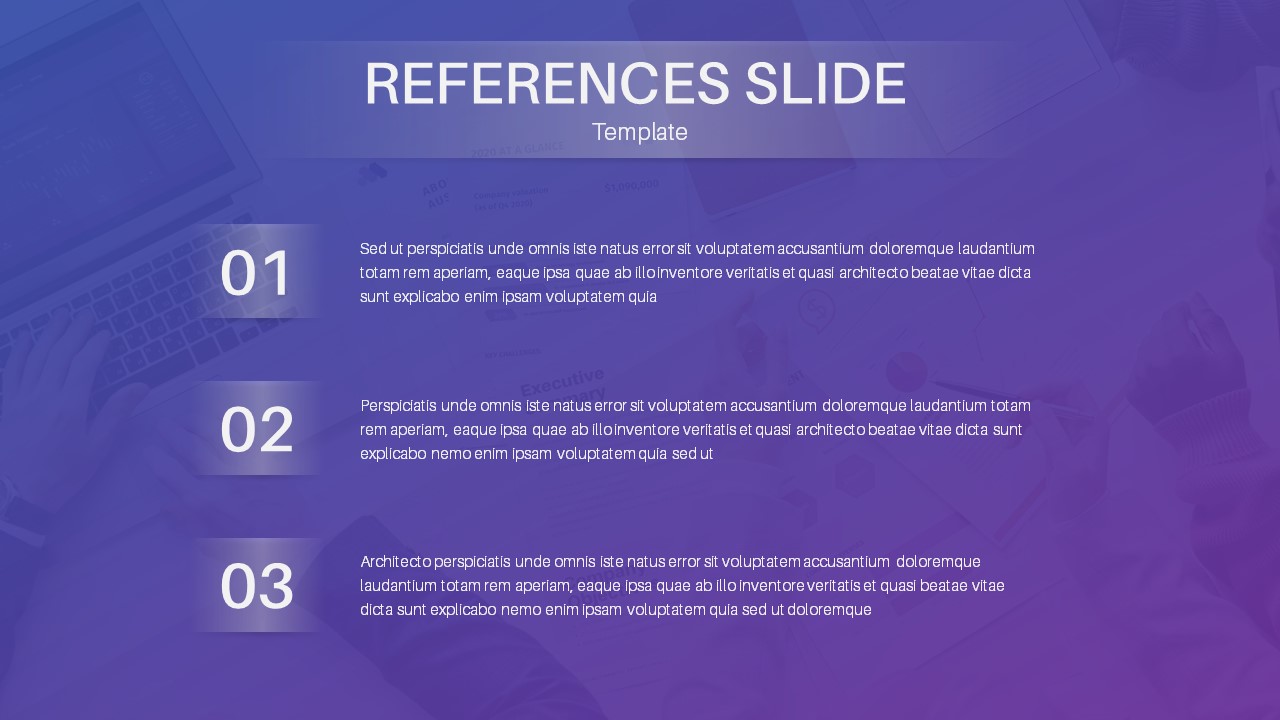
Professional References Slide Layout Template for PowerPoint & Google Slides
Infographics
Modern Professional References Slide Template for PowerPoint & Google Slides
Business Report
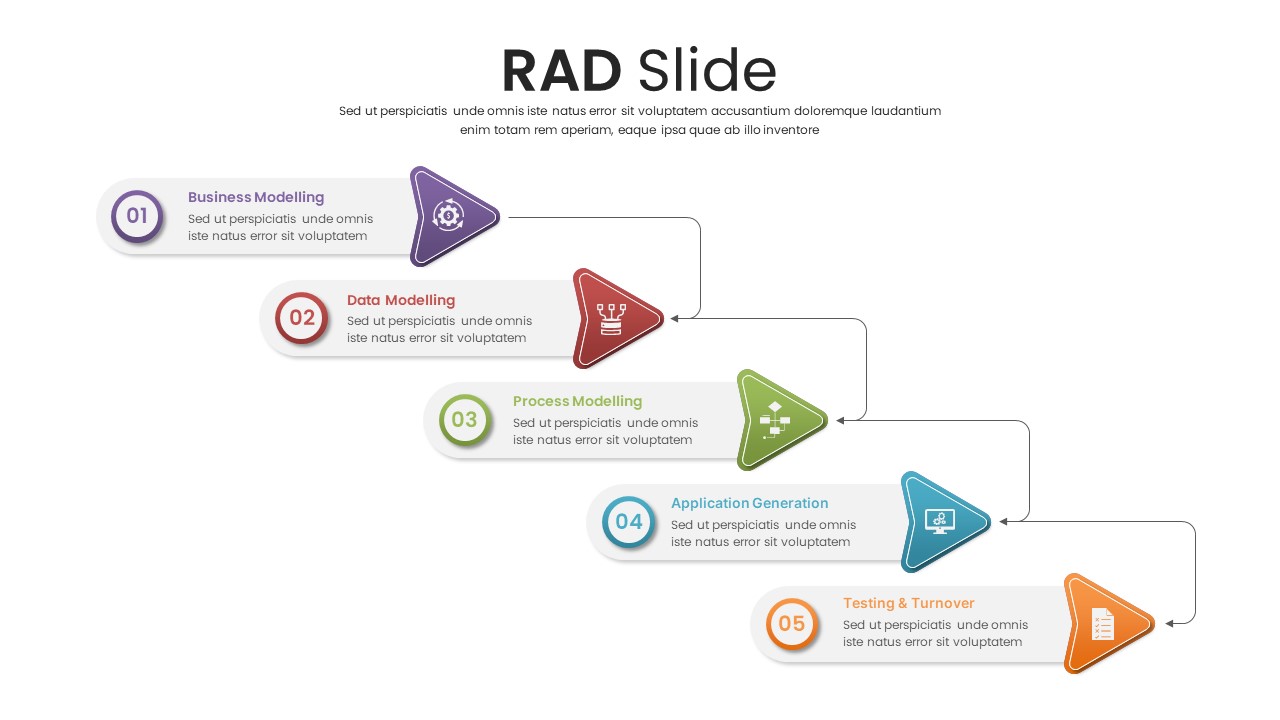
Professional Five-Step RAD Process Slide Template for PowerPoint & Google Slides
Process
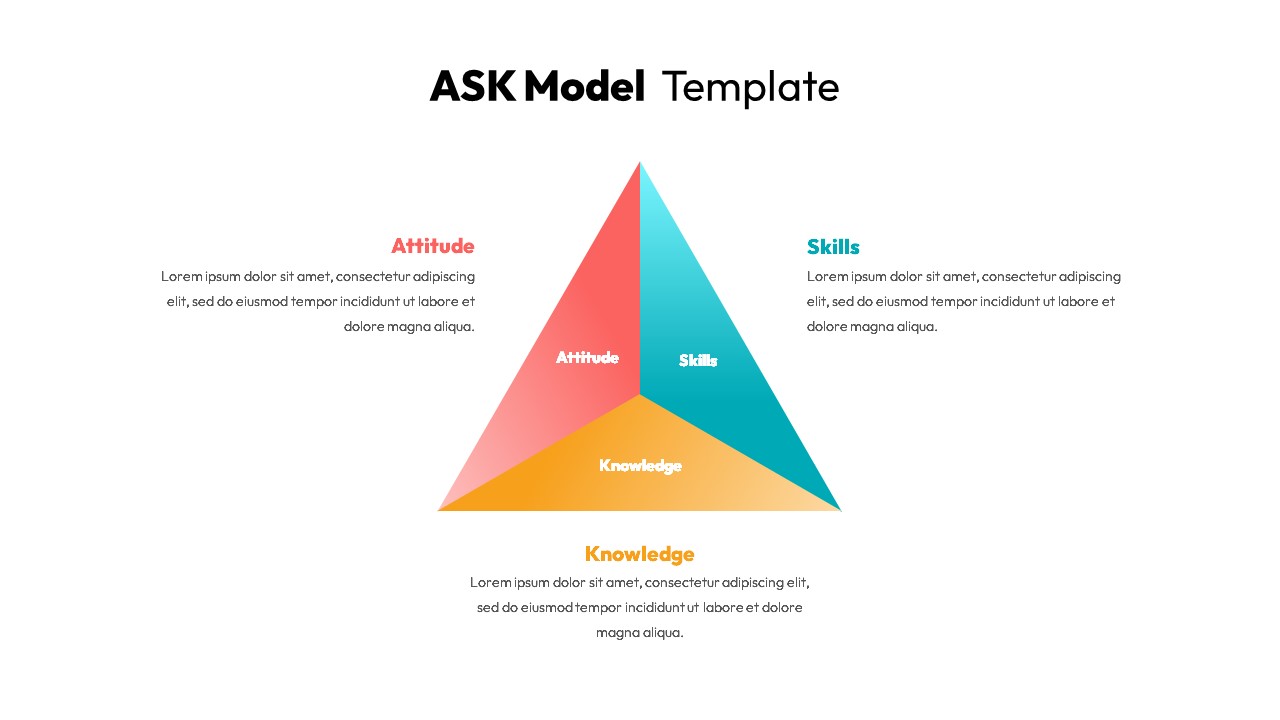
Professional ASK Model Template for PowerPoint & Google Slides
Employee Performance
Professional 6 Circle Venn Diagram Template for PowerPoint & Google Slides
Circular
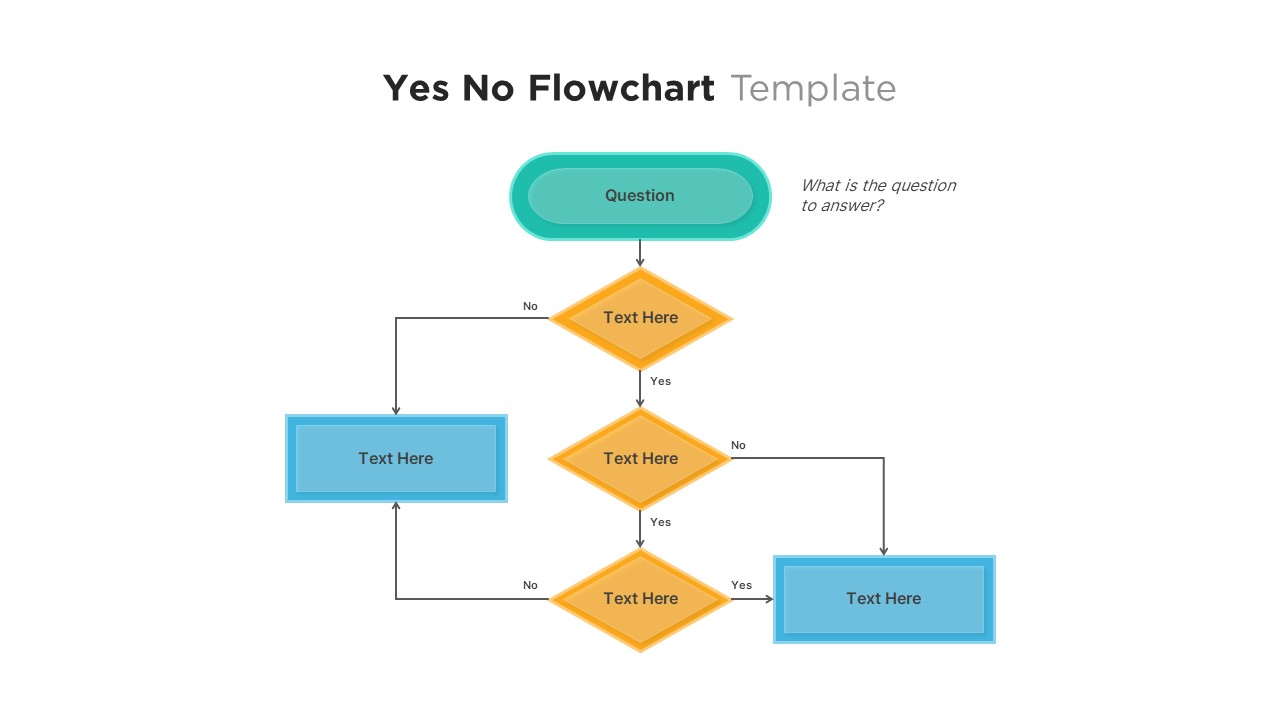
Professional Yes No Decision Flowchart Template for PowerPoint & Google Slides
Flow Charts
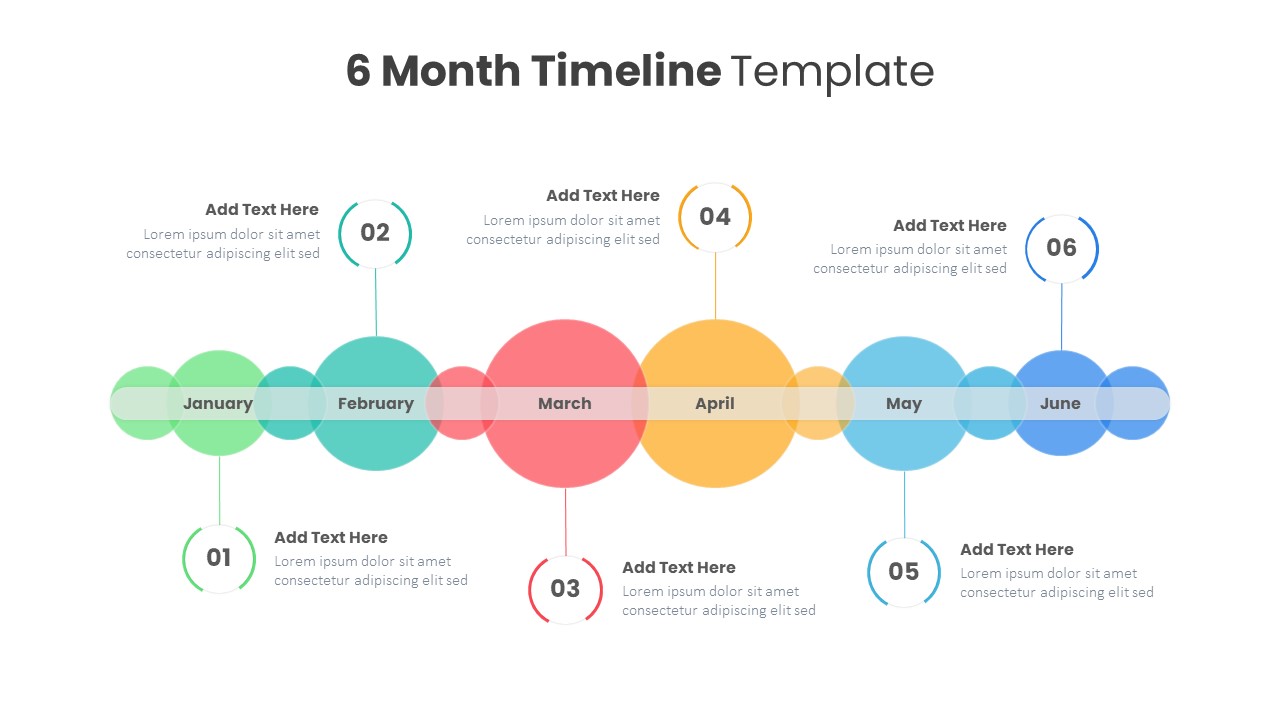
Professional Editable 6 Month Timeline Template for PowerPoint & Google Slides
Timeline
Professional Golf Presentation Deck Template for PowerPoint & Google Slides
Graphics
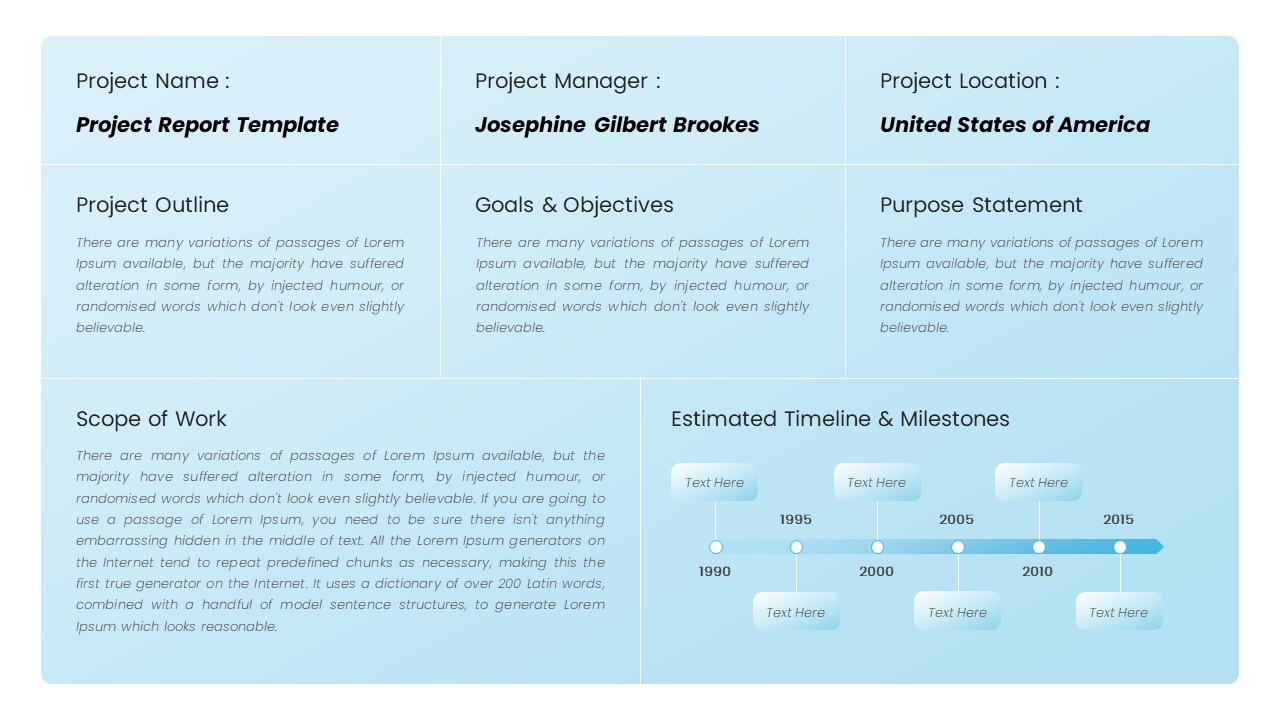
Professional Statement of Work Template for PowerPoint & Google Slides
Project
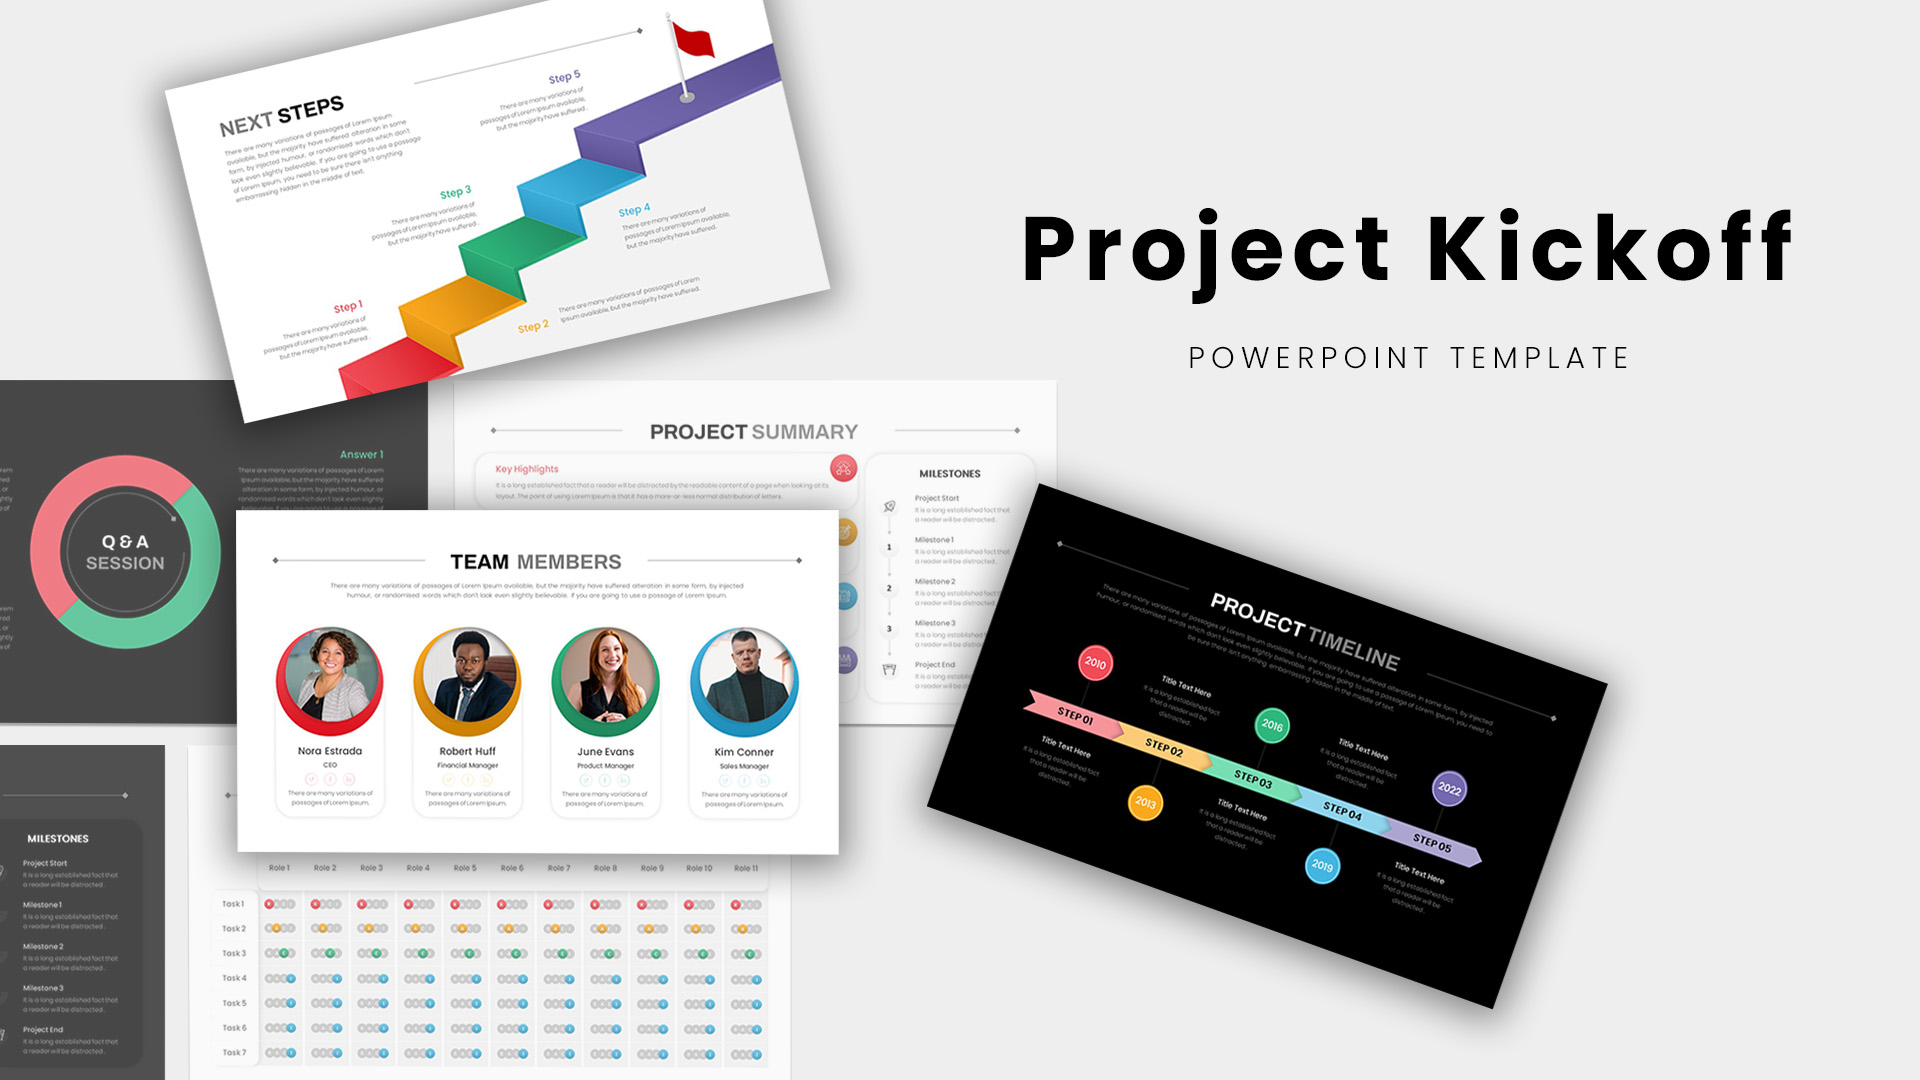
Professional Project Kickoff Deck Template for PowerPoint & Google Slides
Project
Professional 100% Stacked Column Chart Template for PowerPoint & Google Slides
Bar/Column
Professional Quad Chart Layout Template for PowerPoint & Google Slides
Pie/Donut

Professional Dental Clinic Profile Template for PowerPoint & Google Slides
Company Profile
Professional Law & Justice Presentation Template for PowerPoint & Google Slides
Company Profile
Professional HR Organization Chart Template for PowerPoint & Google Slides
Org Chart
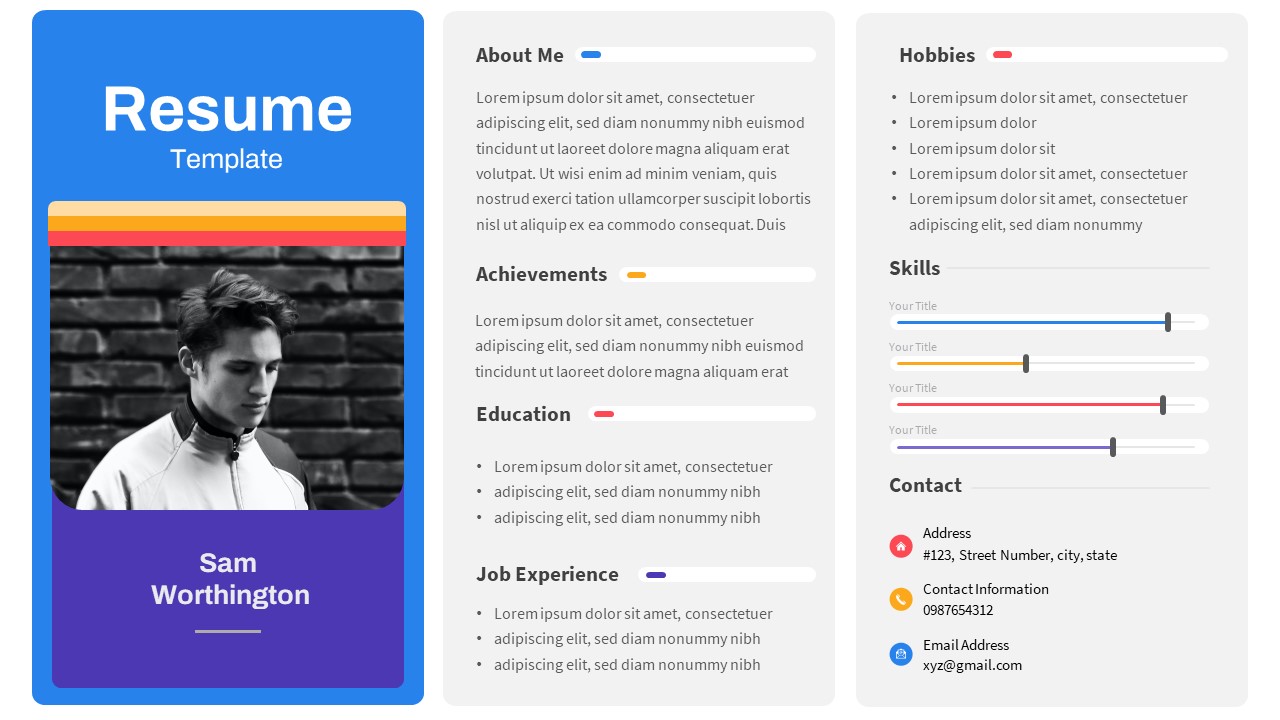
Professional Photo-Focused Resume Template for PowerPoint & Google Slides
Recruitment
Free
Free Professional Event Planner Slide Deck Template for PowerPoint & Google Slides
Business
Free
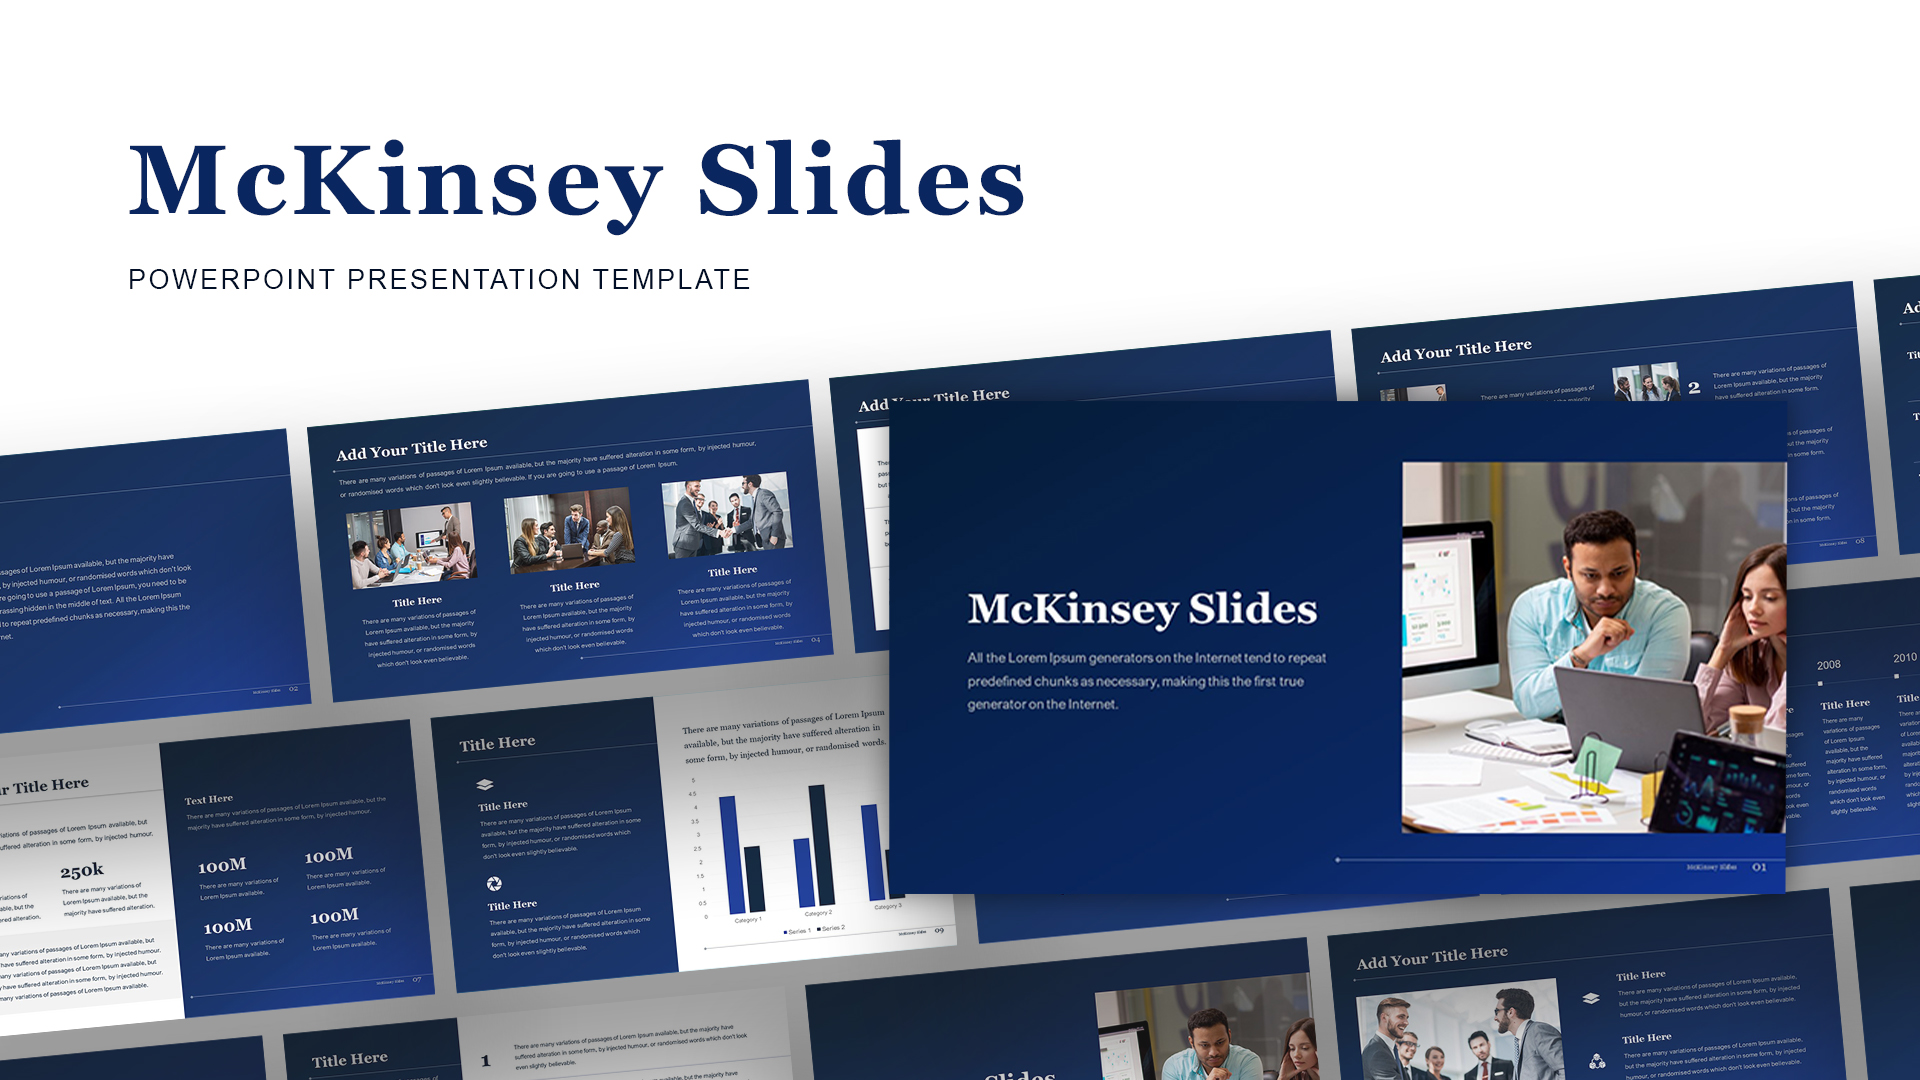
McKinsey-Style Professional Business Deck Template for PowerPoint & Google Slides
Business Report
Free Professional Carnival Pitch Deck Template for PowerPoint & Google Slides
Pitch Deck
Free
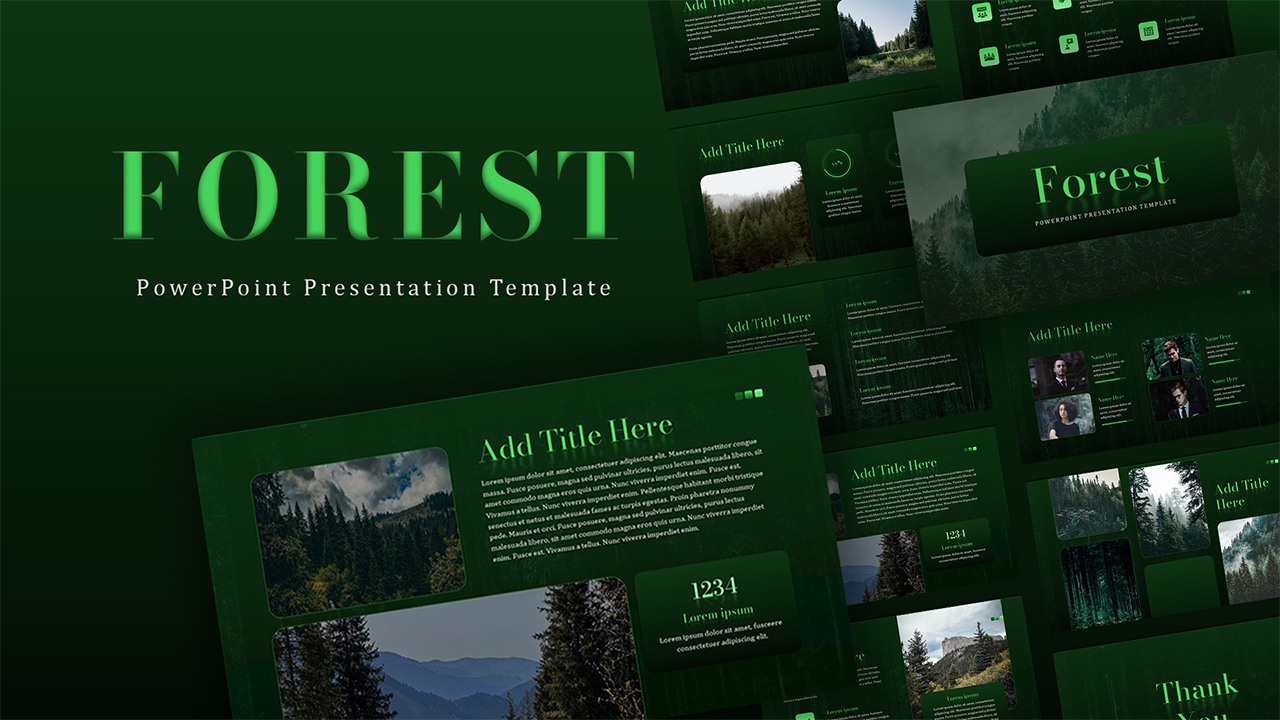
Free Forest-Themed Professional Presentation Template for PowerPoint & Google Slides
Company Profile
Free
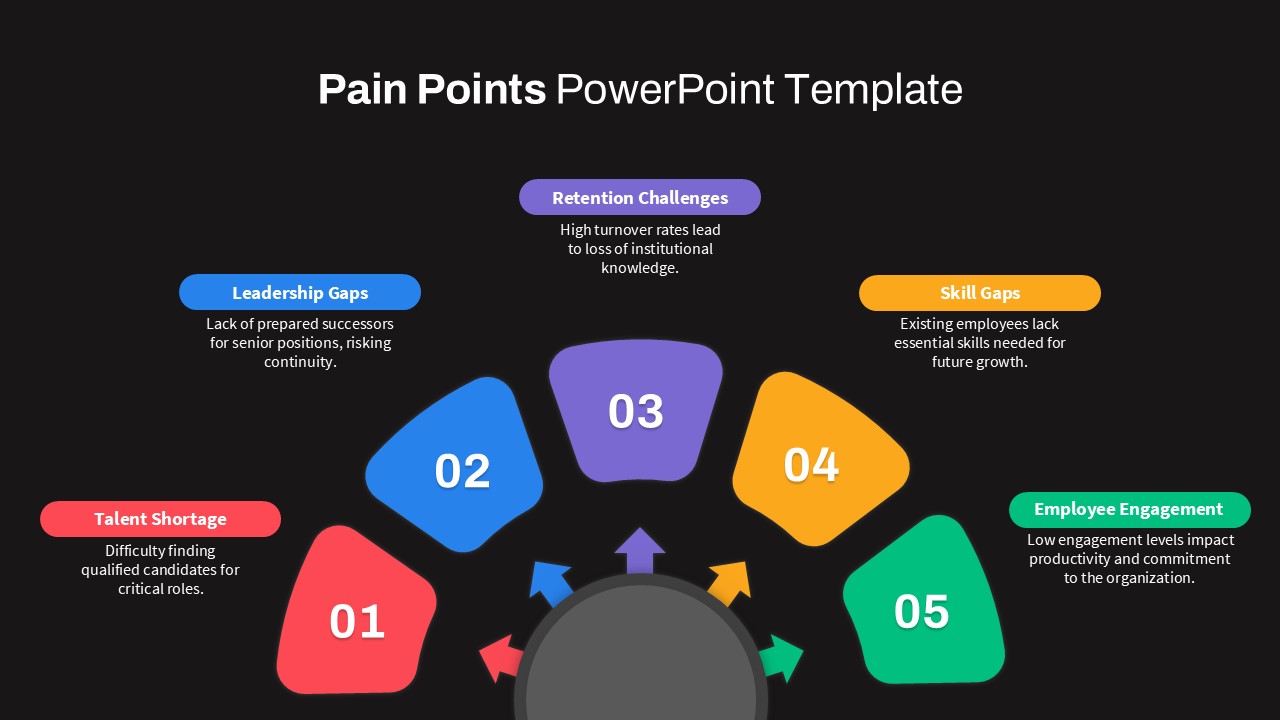
Professional Circular Pain Points Template for PowerPoint & Google Slides
Circular
Professional Green Geometric Background Template for PowerPoint & Google Slides
Background
Ansoff Growth Matrix Professional Template for PowerPoint & Google Slides
Comparison
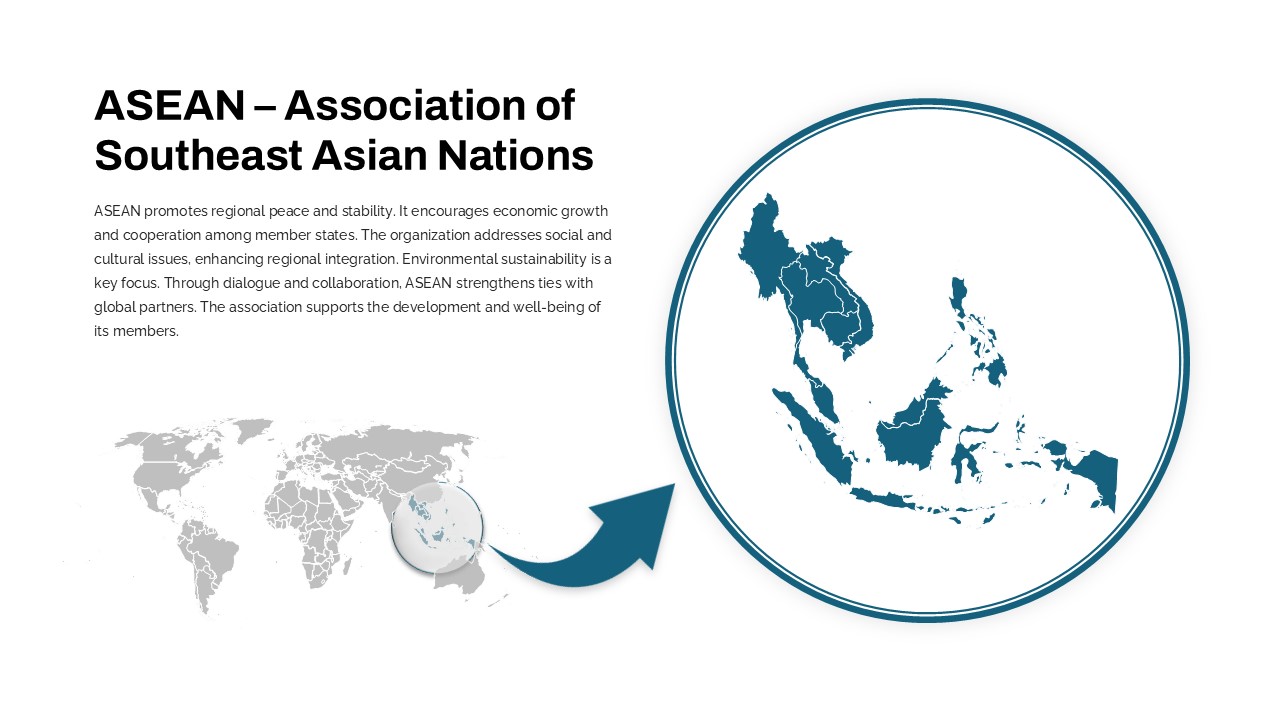
Professional ASEAN Region Zoom Map Slide Template for PowerPoint & Google Slides
World Maps
Professional Town Hall Cover Slide Template for PowerPoint & Google Slides
Graphics
Professional Executive Board Meeting Template for PowerPoint & Google Slides
Business Report

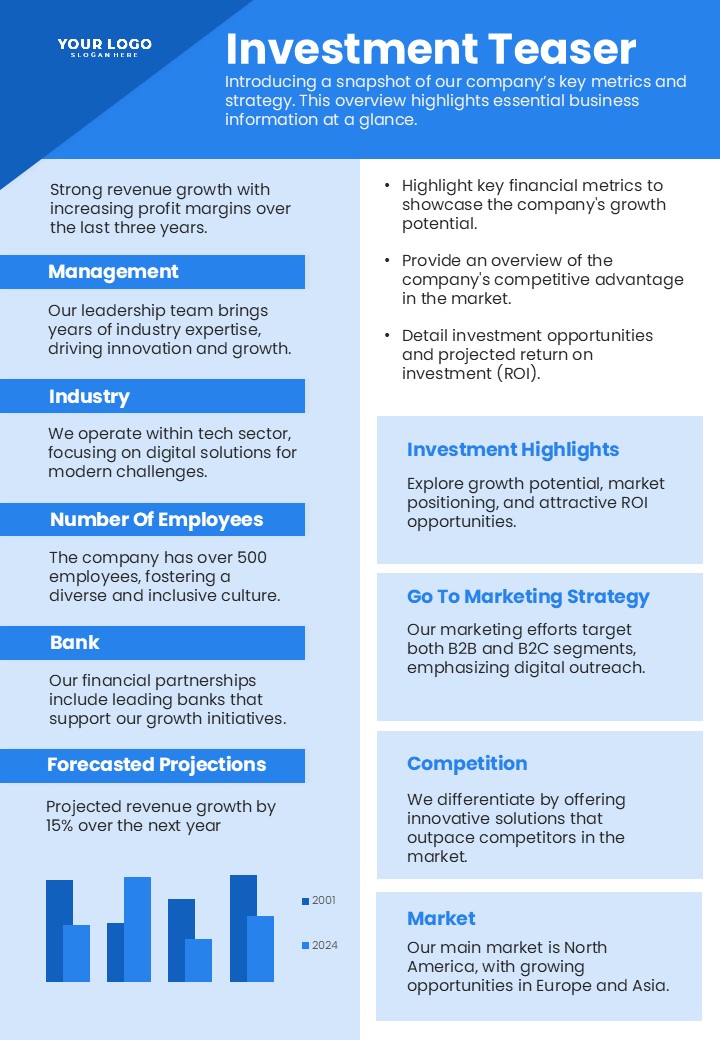
Professional Investment Teaser Slide Template for PowerPoint & Google Slides
Pitch Deck
Professional Table of Organization Chart Template for PowerPoint & Google Slides
Org Chart
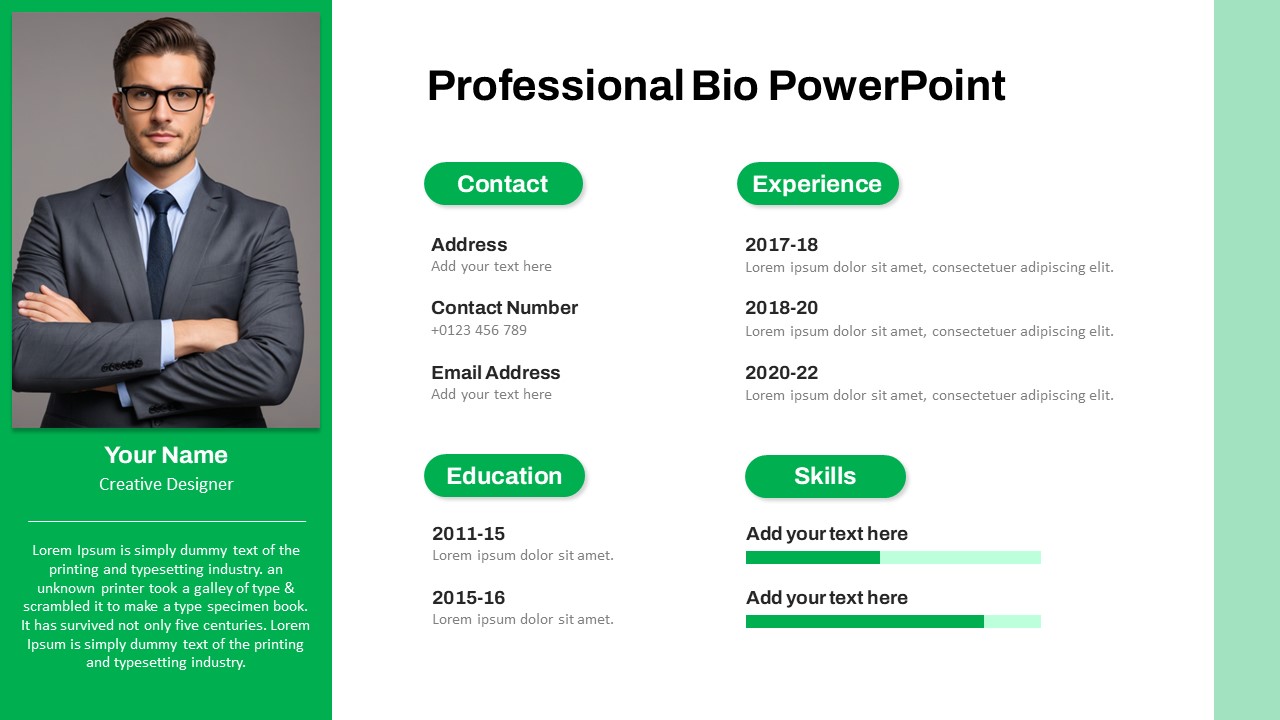
Modern Professional Bio Resume Slide Template for PowerPoint & Google Slides
Recruitment
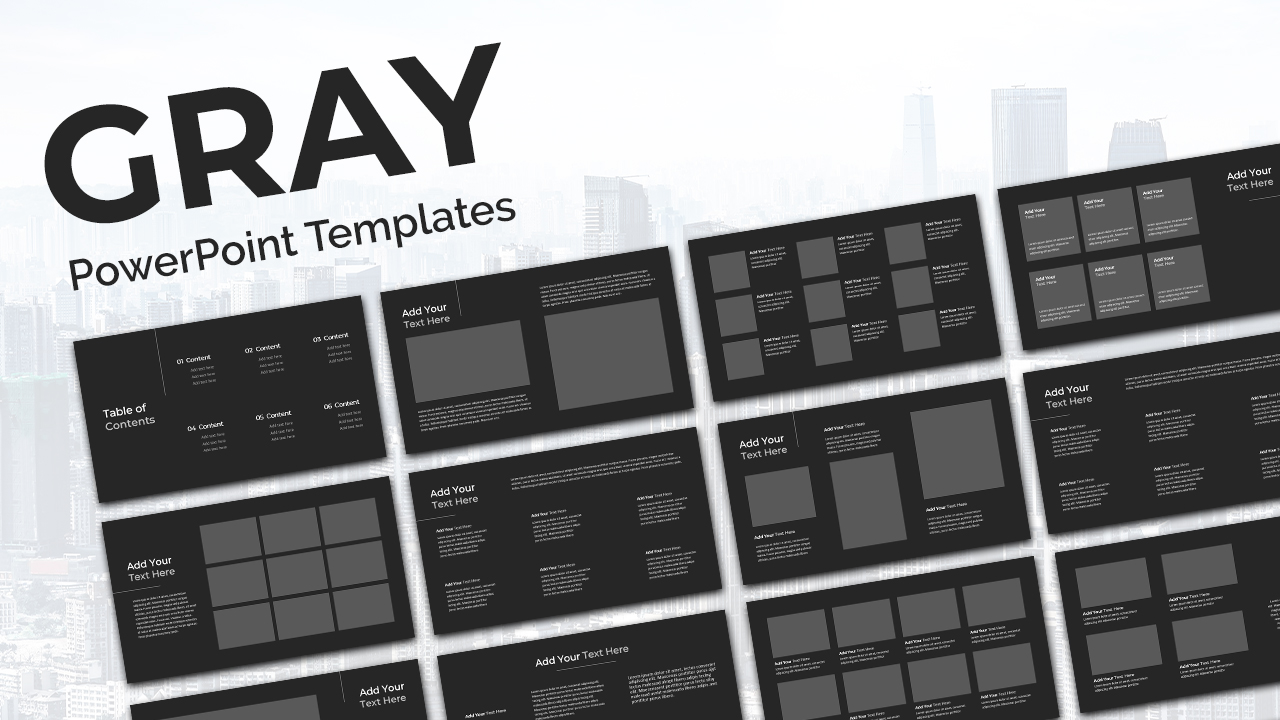
Gray Professional Deck template for PowerPoint & Google Slides
Pitch Deck