Multi-Year S-Shaped Roadmap Timeline Template for PowerPoint & Google Slides
Description
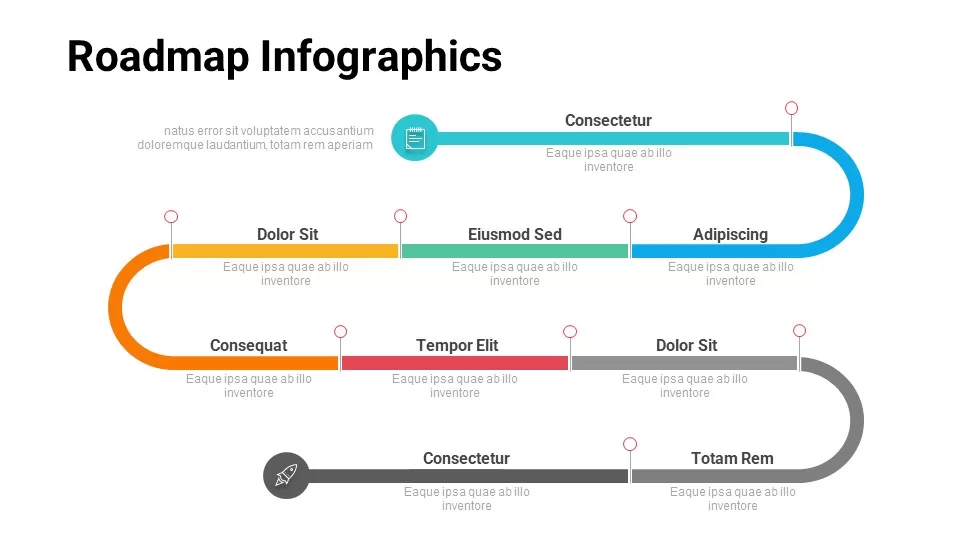
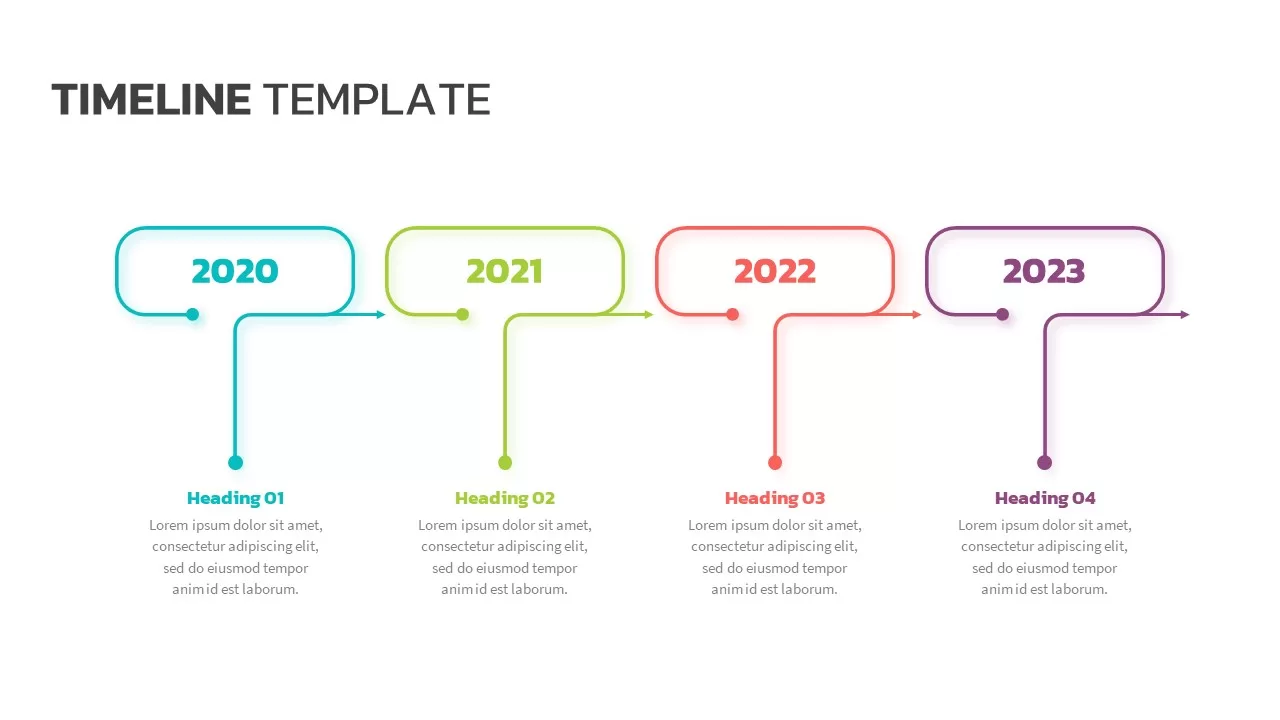
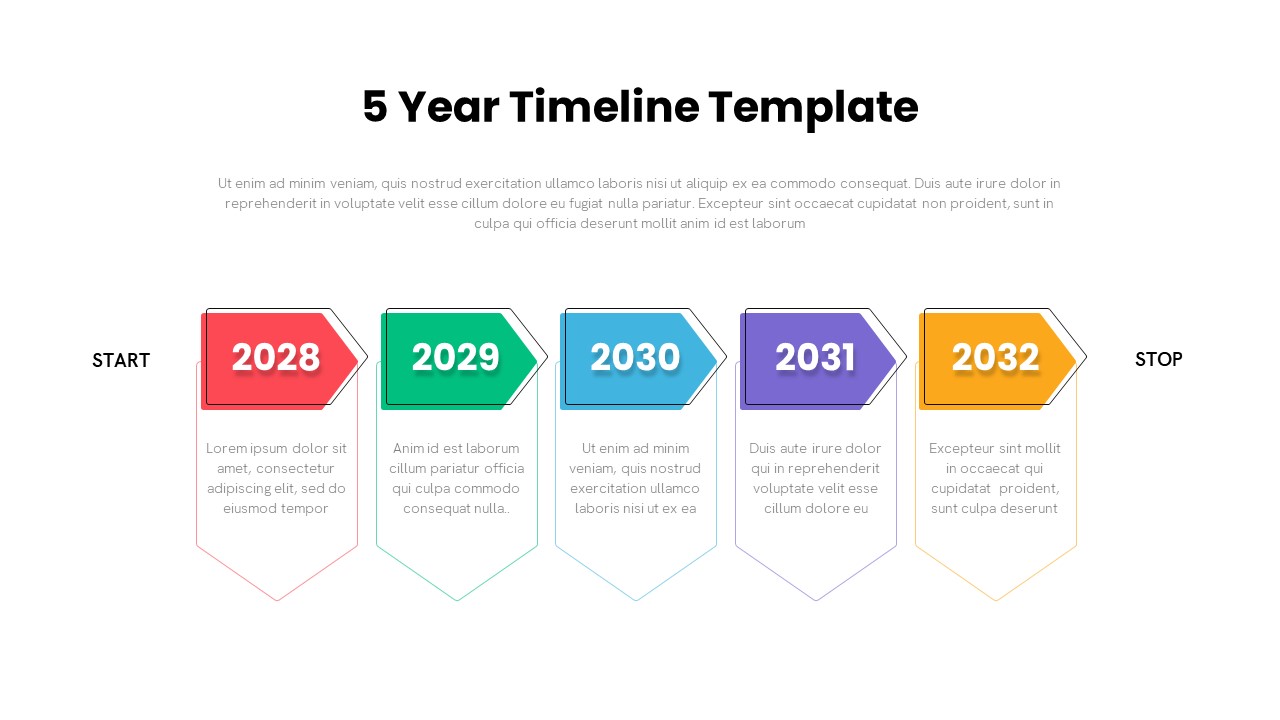
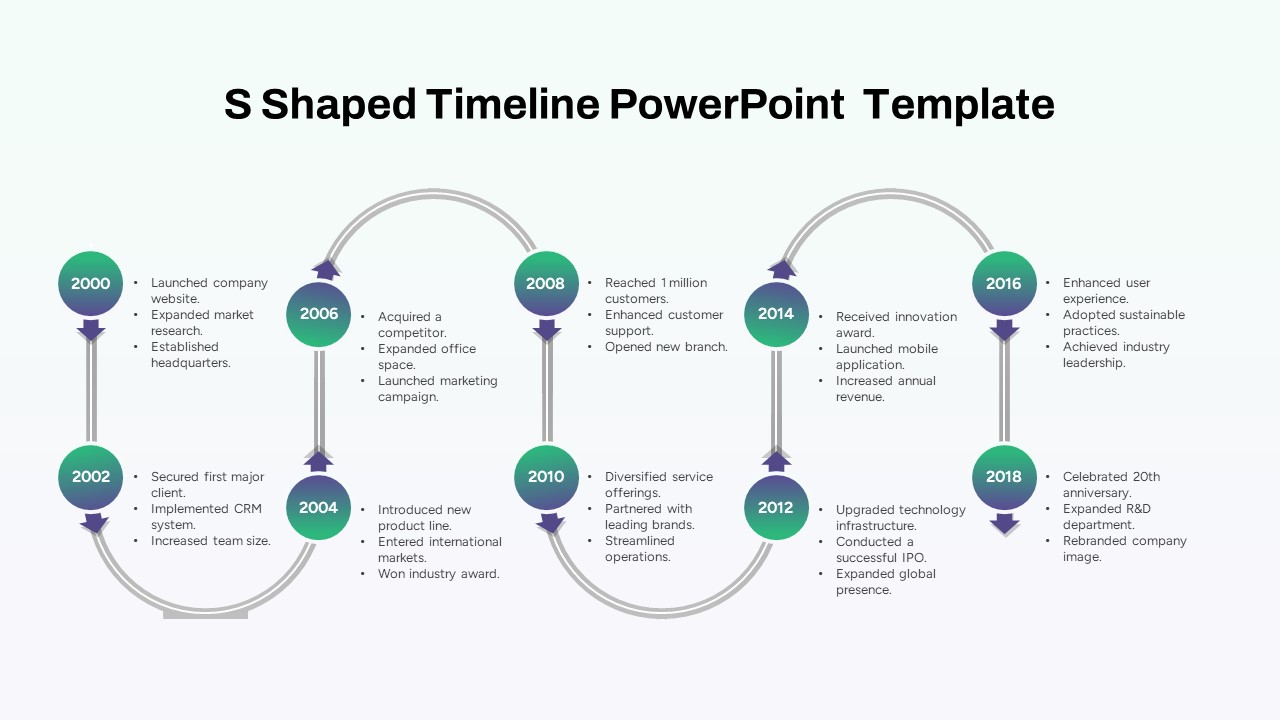
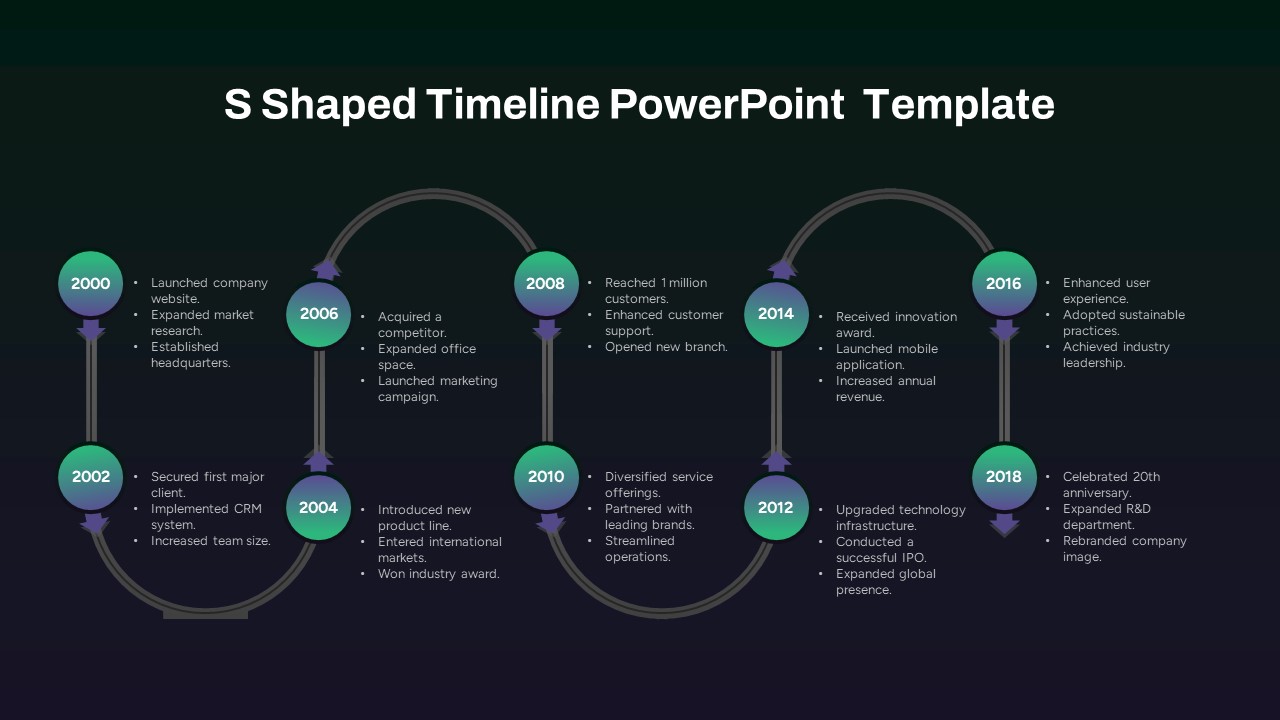
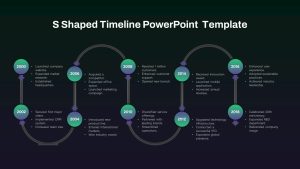
This S-shaped timeline infographic guides viewers through a decade of milestones with a distinctive serpentine flow that alternates direction at each curve. Ten circular markers—spanning from 2000 to 2018—sit atop a muted gray path, each highlighted by a subtle green-to-teal gradient ring and anchored by purple directional arrows. Adjacent bullet-point panels succinctly capture key achievements such as launching your website, securing clients, entering new markets, scaling operations, and celebrating anniversaries. The alternating left-right alignment maximizes white space and readability, while consistent typography and soft drop shadows reinforce a clean, professional look. Built on master slides, all vector shapes, gradient fills, icons, and text placeholders are fully editable—allowing you to swap colors, update date ranges, replace icons, or resize elements in seconds to fit your branding guidelines. Whether you need to map corporate history, product evolution, funding rounds, or technology rollouts, this template adapts effortlessly to any multi-phase narrative. The design preserves high-resolution clarity across PowerPoint and Google Slides, ensuring formatting fidelity when sharing or printing. Use this S-shaped roadmap slide to illustrate strategic plans, showcase growth trajectories, align stakeholder expectations, or compare parallel initiatives over time. Its modular structure also supports adding progress indicators, milestone callouts, or custom annotations without disrupting the overall flow. Engage your audience with a visually compelling timeline that balances creative flair and data-driven storytelling, all within a flexible, easy-to-customize framework.
Who is it for
Project managers, strategy consultants, and executive teams can leverage this S-shaped roadmap to communicate multi-year plans and corporate milestones. Product leaders, marketing directors, and investor relations professionals will find it ideal for showcasing growth narratives, release schedules, and funding rounds.
Other Uses
Beyond corporate roadmaps, repurpose this slide for product lifecycles, marketing campaign timelines, technology adoption curves, or training program schedules. The alternating curve layout also works well for visualizing historical overviews, research phases, and cross-functional project timelines.
Login to download this file

Item ID
SB04393
Related Templates

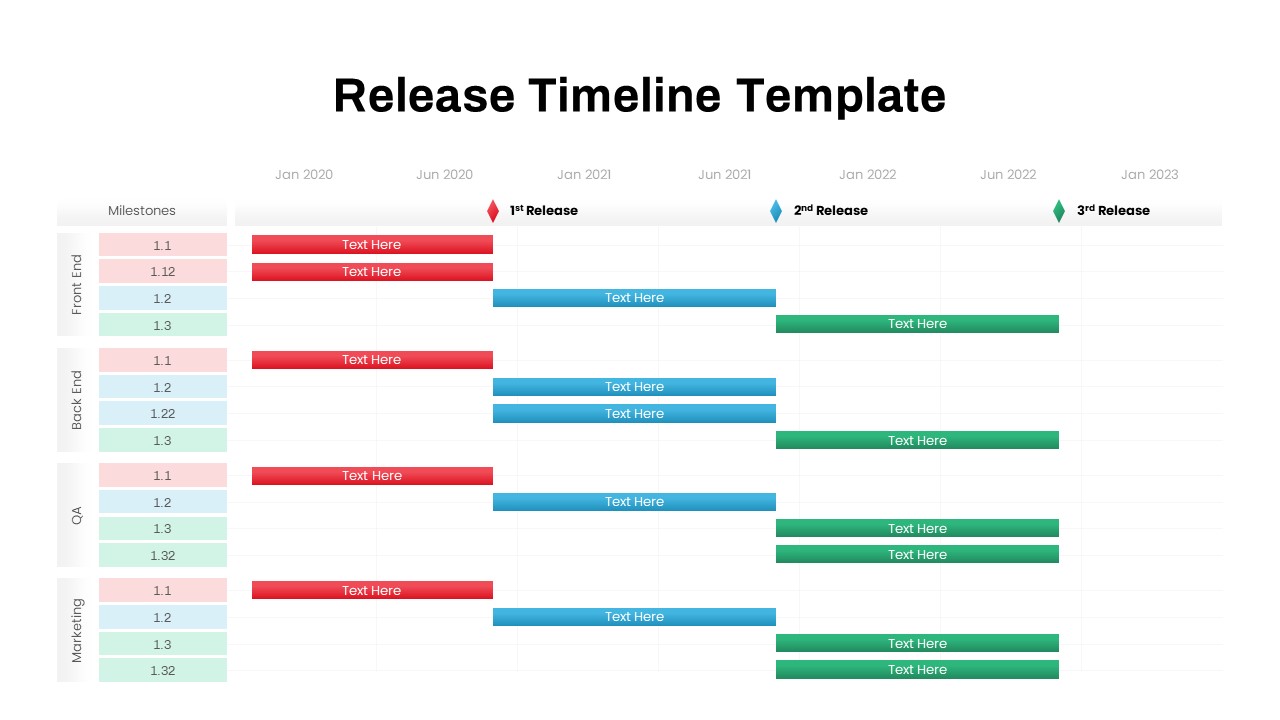
Multi-Team Multi-Phase Release Timeline Template for PowerPoint & Google Slides
Timeline
Multi-Year Timeline Infographic Template for PowerPoint & Google Slides
Timeline

Free Multi-Year Arrow Timeline Infographic Template for PowerPoint & Google Slides
Timeline
Free
Multi-color Curved Timeline Roadmap Template for PowerPoint & Google Slides
Timeline
Minimal Multi-Year Column Chart Template for PowerPoint & Google Slides
Bar/Column
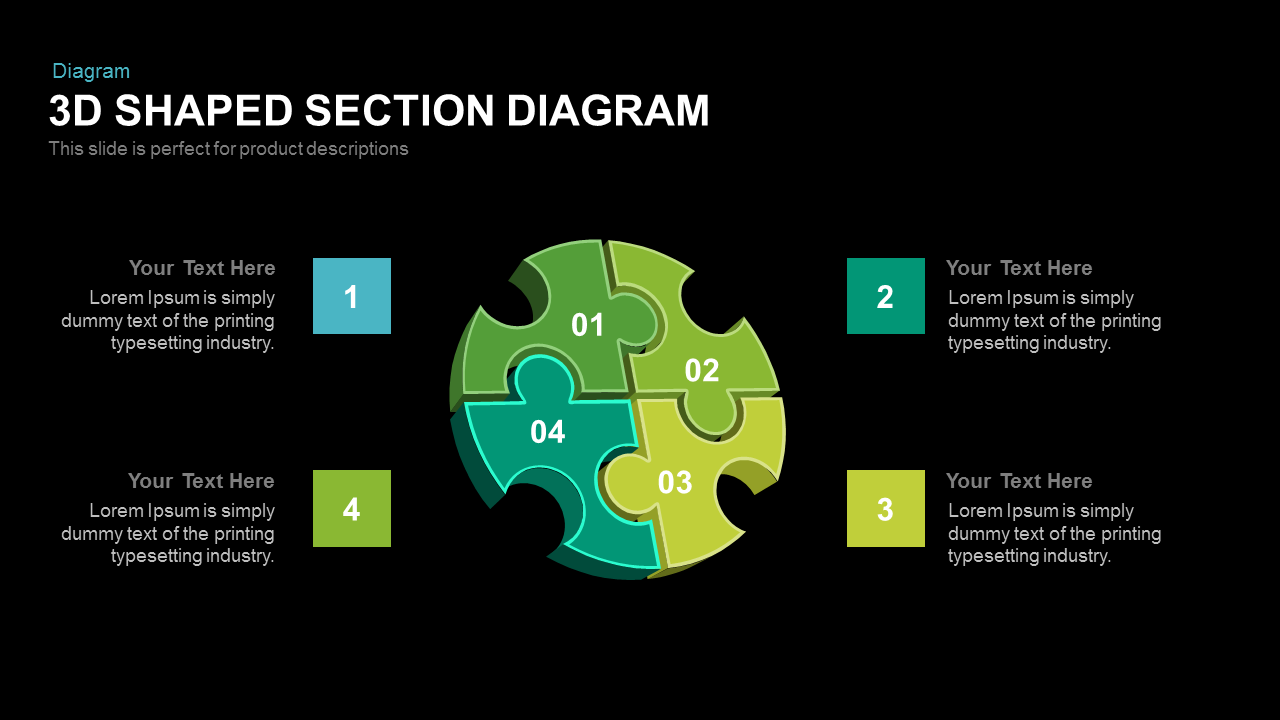
3D Shaped Section Diagram template for PowerPoint & Google Slides
Infographics
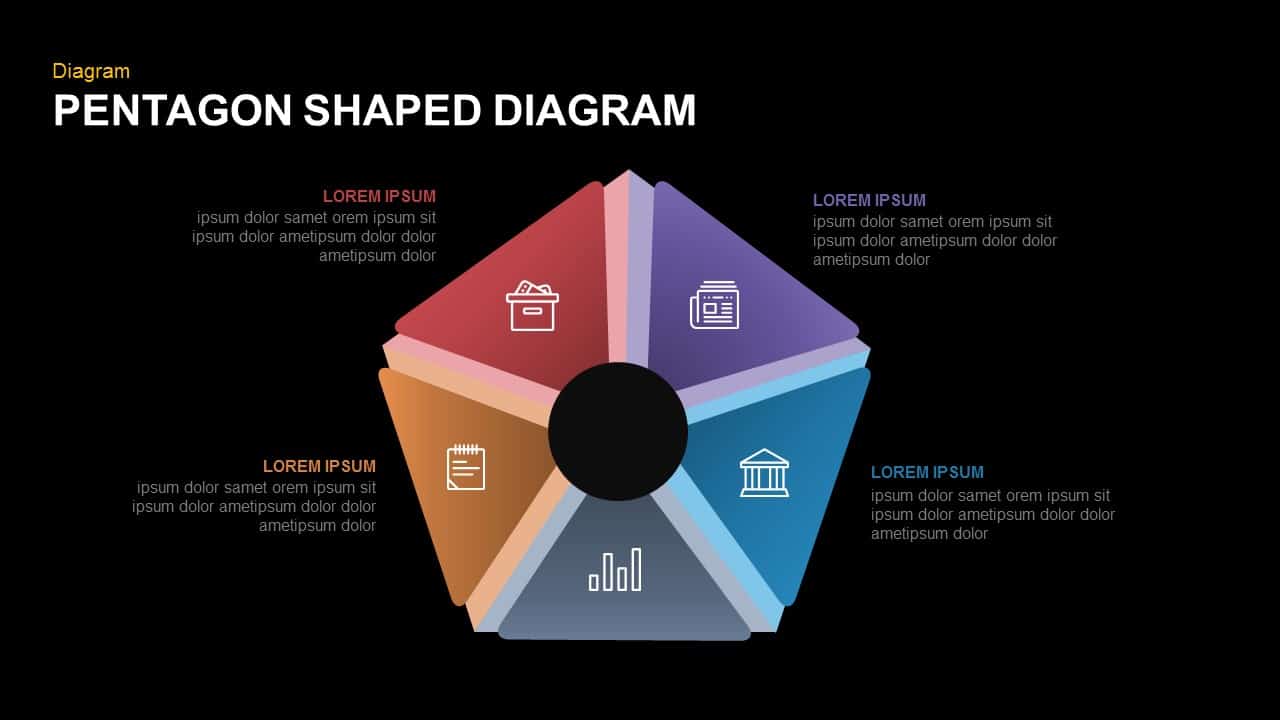
Five-Part Pentagon Shaped Diagram Template for PowerPoint & Google Slides
Process

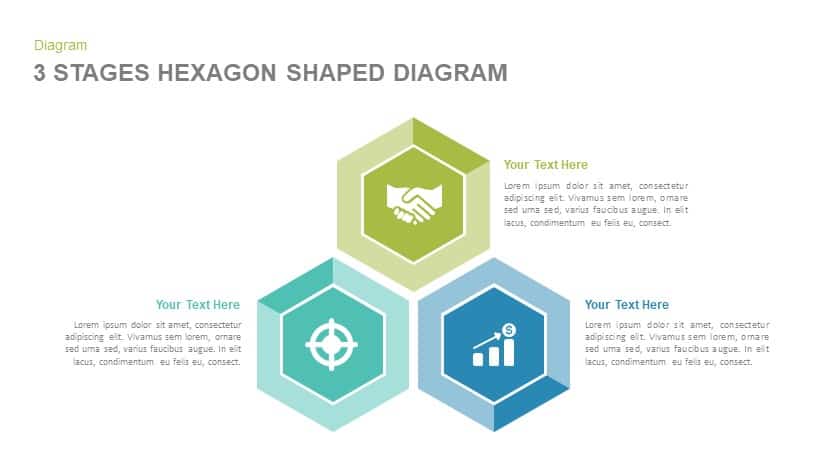
3 Stages Hexagon Shaped Diagram template for PowerPoint & Google Slides
Infographics
Snake Shaped Curve Diagram template for PowerPoint & Google Slides
Business
Three-Year Project Roadmap Timeline Template for PowerPoint & Google Slides
Timeline
Free Multi-Level Roadmap Infographic Template for PowerPoint & Google Slides
Roadmap
Free
Multi-Phase Research Roadmap Infographic Template for PowerPoint & Google Slides
Roadmap
Multi-Color Technology Roadmap Template Pack for PowerPoint & Google Slides
Roadmap
Animated Multi-Milestone Roadmap Template for PowerPoint & Google Slides
Roadmap
Year-over-Year Stacked Gender Bar Chart Template for PowerPoint & Google Slides
Bar/Column
Year-over-Year Performance Comparison Template for PowerPoint & Google Slides
Comparison Chart
Multi-Stage Timeline Infographics Template for PowerPoint & Google Slides
Timeline
Versatile 12-Month Multi-Style Timeline Template for PowerPoint & Google Slides
Timeline
Multi-Color Milestone Timeline Layout Template for PowerPoint & Google Slides
Timeline
Multi-Style Event Timeline Agenda Template for PowerPoint & Google Slides
Timeline
Delivery Timeline Multi-Row Template for PowerPoint & Google Slides
Timeline
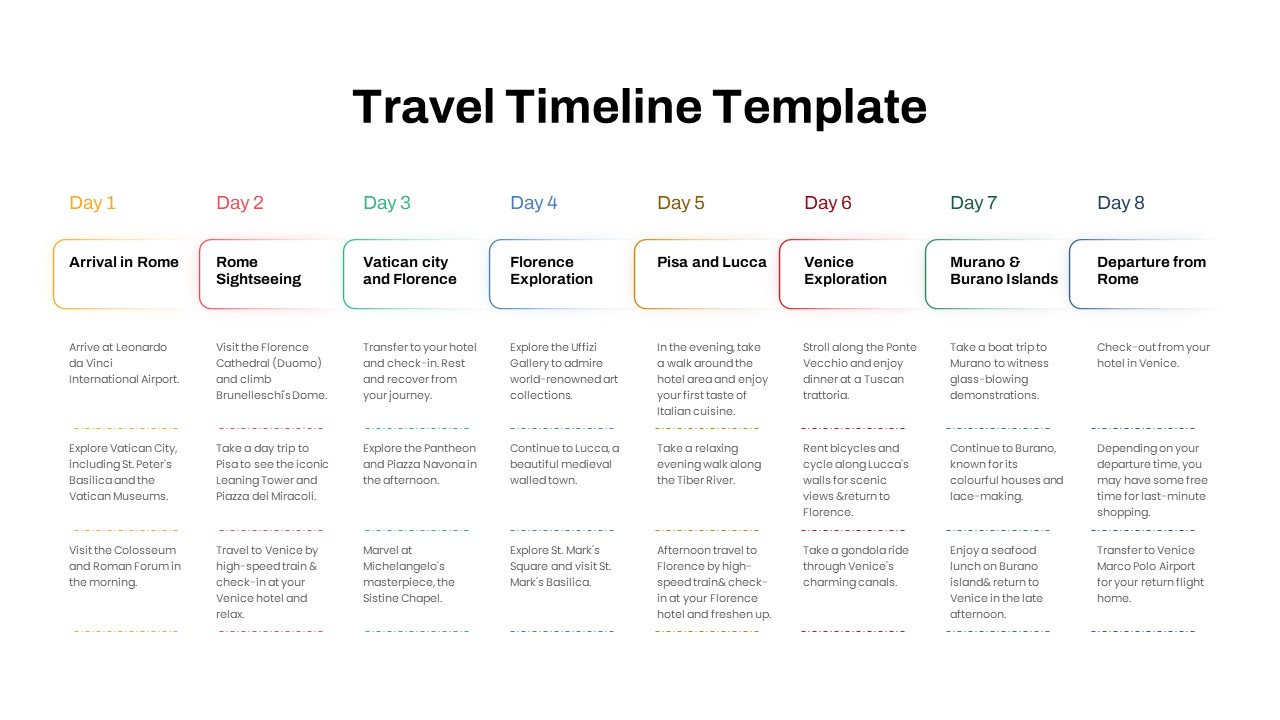
Free Elegant Multi-Day Travel Timeline Template for PowerPoint & Google Slides
Timeline
Free
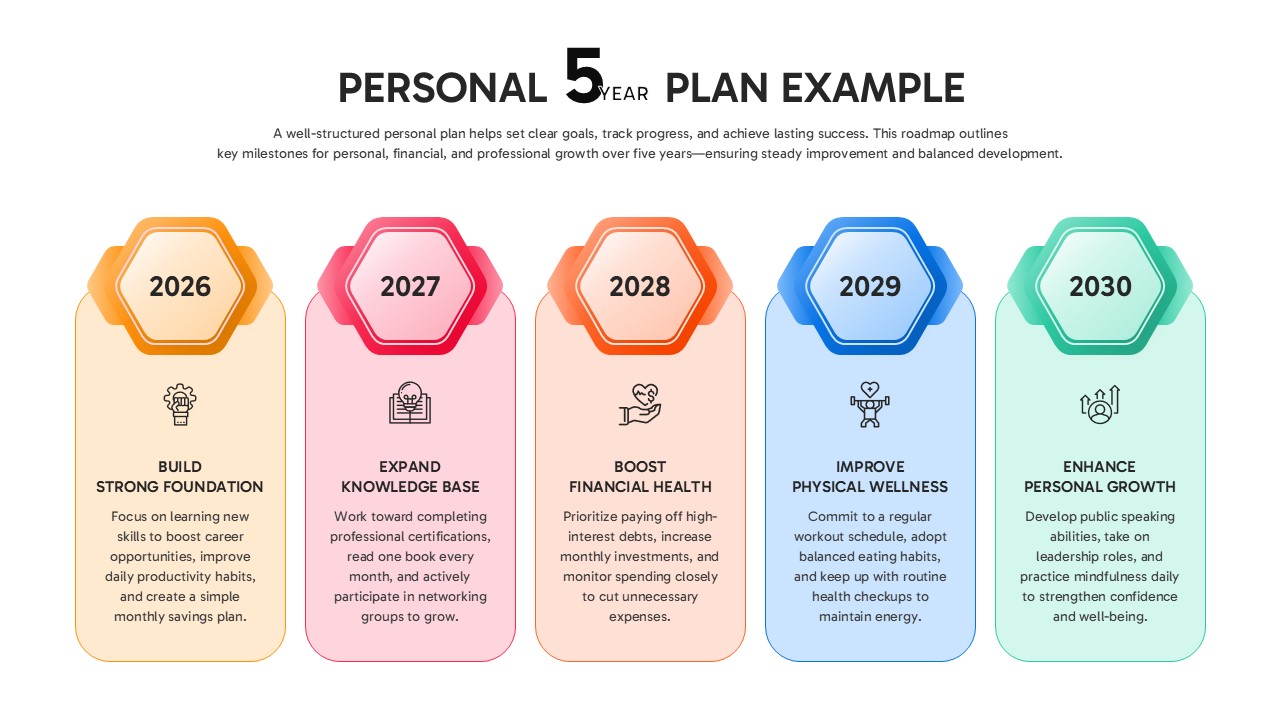
Personal 5-Year Roadmap Plan Example Template for PowerPoint & Google Slides
Timeline
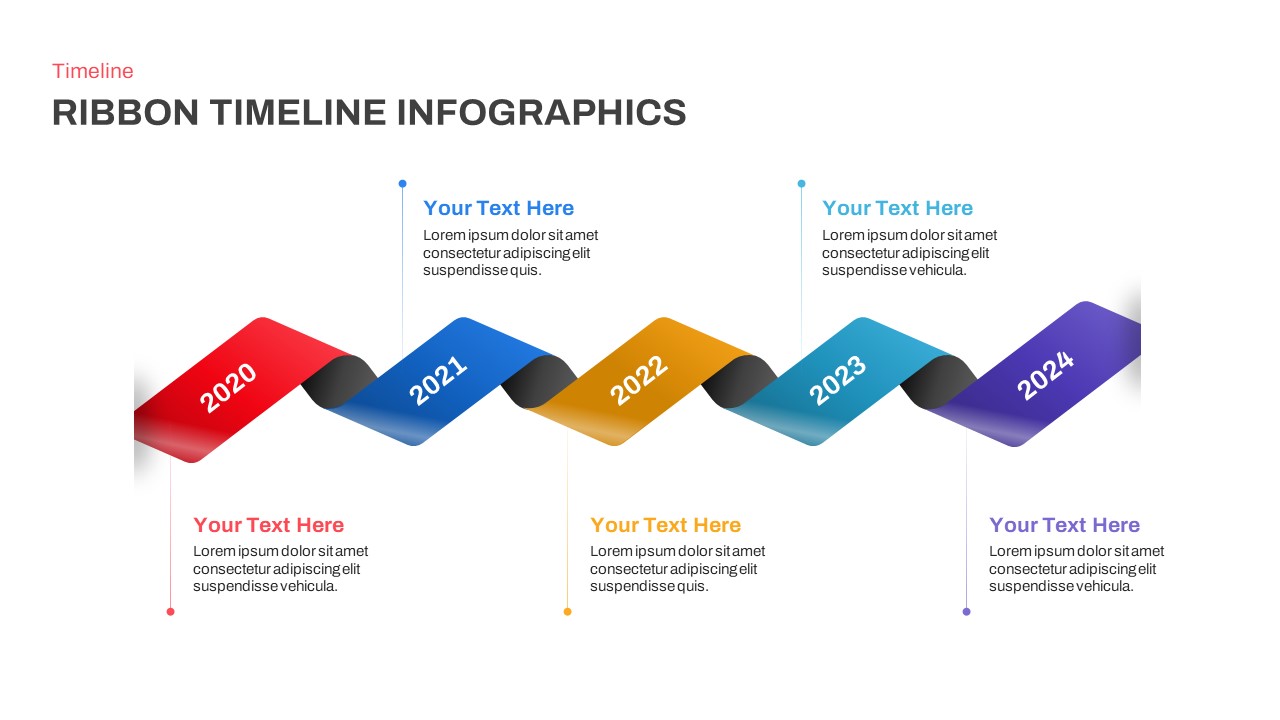
Five-Year Ribbon Timeline Diagram Template for PowerPoint & Google Slides
Timeline
Five-Year Gradient Timeline Infographic Template for PowerPoint & Google Slides
Timeline
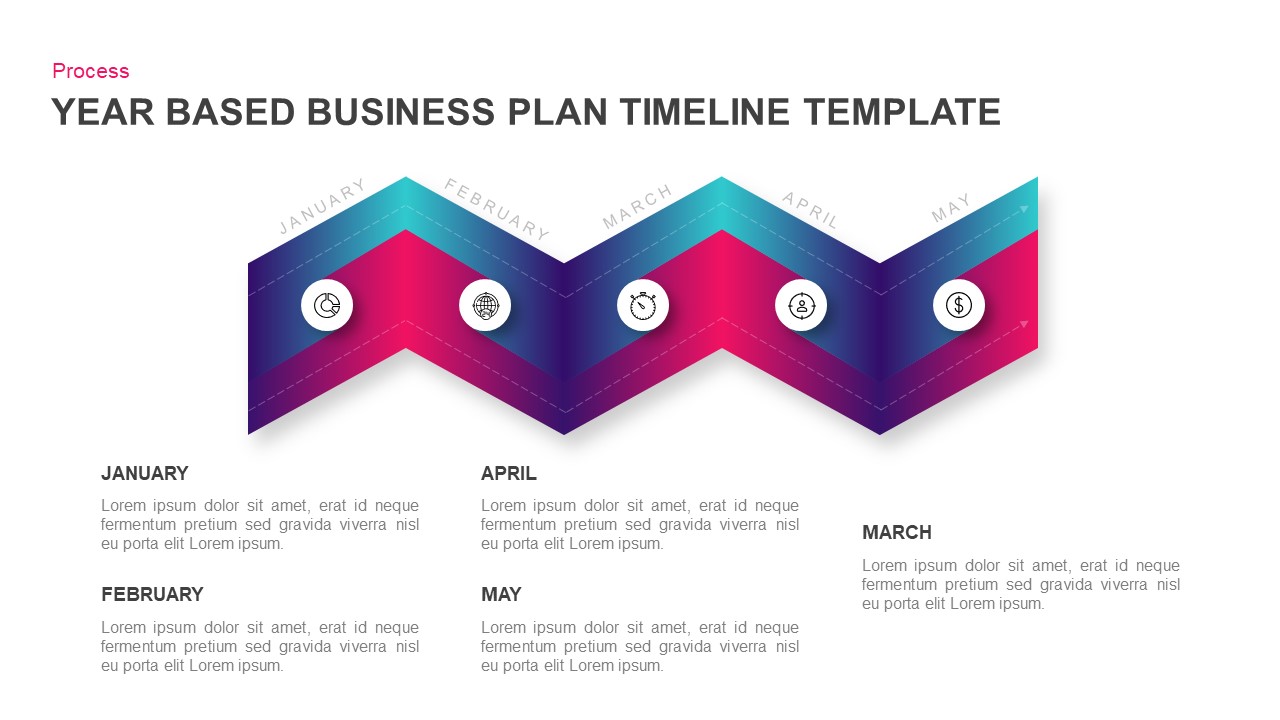
Year-Based Business Plan Zigzag Timeline Template for PowerPoint & Google Slides
Business Plan
Colorful Four-Year Timeline Layout Template for PowerPoint & Google Slides
Timeline
Colorful Five-Year Timeline Layout Template for PowerPoint & Google Slides
Timeline
Milestone Timeline with Year Markers Template for PowerPoint & Google Slides
Timeline
Three-Year Vertical Milestone Timeline Template for PowerPoint & Google Slides
Timeline
5 Year Timeline Template for PowerPoint & Google Slides
Timeline
Five-Year Plan Timeline Diagram Template for PowerPoint & Google Slides
Timeline
Three-Year Plan Timeline Diagram Template for PowerPoint & Google Slides
Timeline
5-Year Business Timeline Template for PowerPoint & Google Slides
Timeline
Smart Multi-Purpose PowerPoint Template for PowerPoint & Google Slides
Company Profile
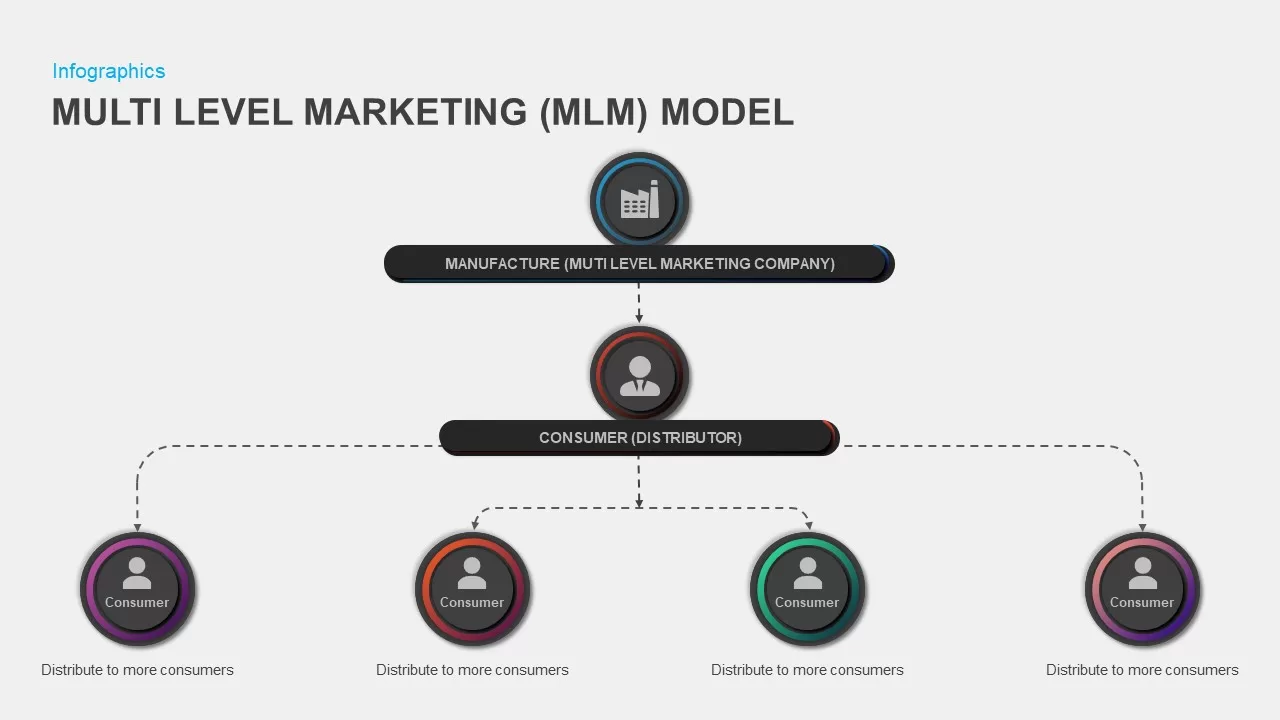
Multi-Level Marketing PowerPoint Template for PowerPoint & Google Slides
Business Models
Multi-Series Curved Line Graph Analytics Template for PowerPoint & Google Slides
Comparison Chart
Multi-Segment Circle Split Diagram template for PowerPoint & Google Slides
Circular
Horizontal Multi-Level Hierarchy Chart template for PowerPoint & Google Slides
Org Chart

Simple Multi-Branch Mind Map Template for PowerPoint & Google Slides
Mind Maps
Multi-layout Circle Spoke Diagram Template for PowerPoint & Google Slides
Circular
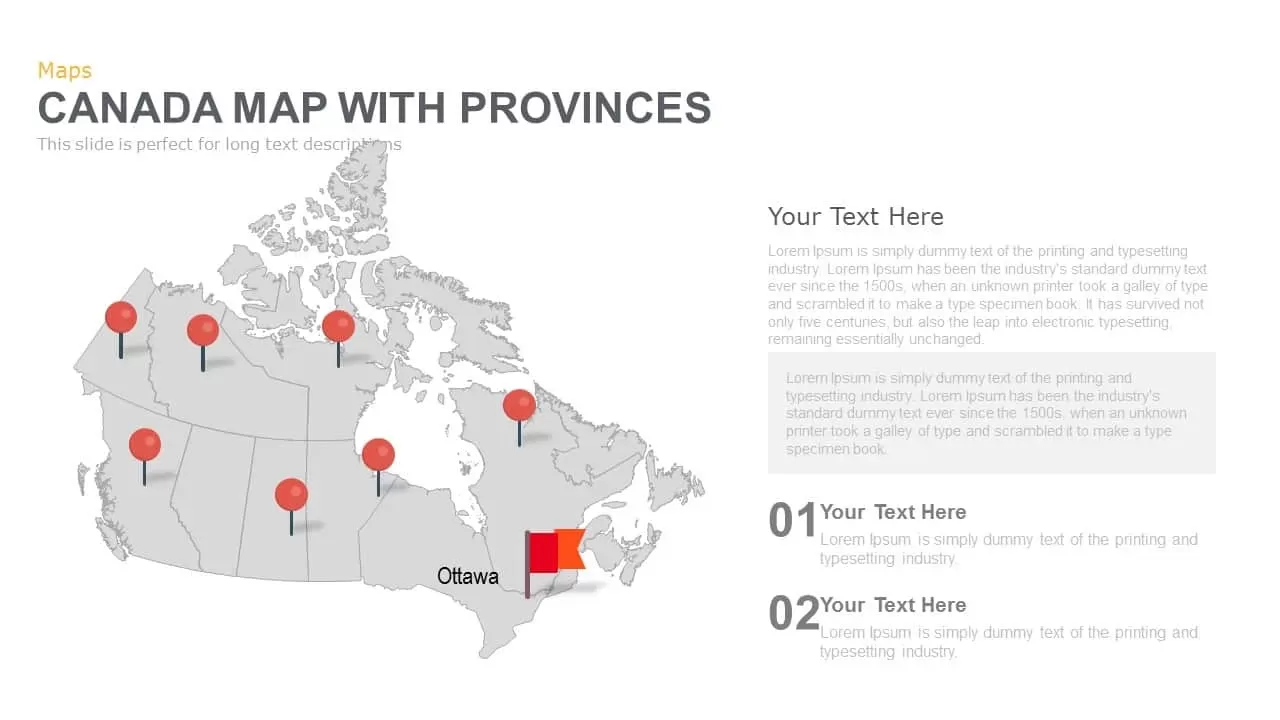
Canada Provinces Map Multi-Layout Template for PowerPoint & Google Slides
World Maps
Modern Multi-Section Circle Diagram Template for PowerPoint & Google Slides
Circular
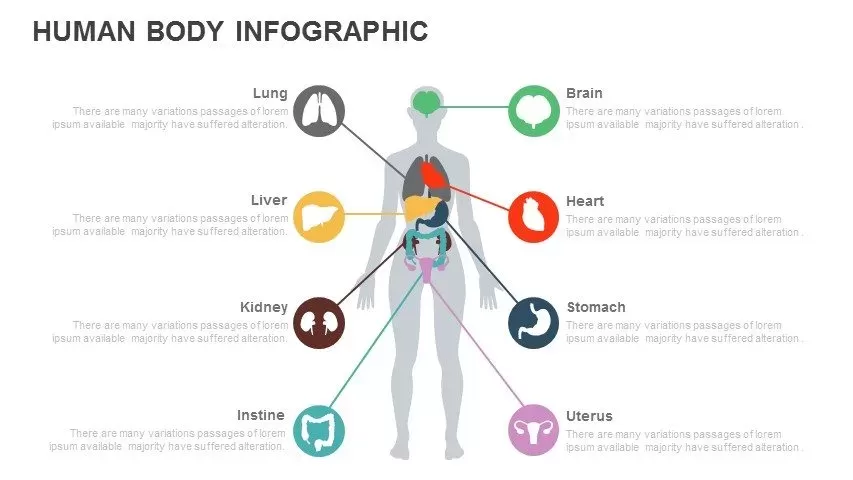
Multi-Organ Human Body Infographic Template for PowerPoint & Google Slides
Comparison
Multi-Color Eight-Step Ribbon Diagram Template for PowerPoint & Google Slides
Process
Multi-Style Presentation Agenda Template for PowerPoint & Google Slides
Agenda
Multi-Cluster Mind Map Infographic Template for PowerPoint & Google Slides
Mind Maps
Multi-Style Project Life Cycle Diagram Template for PowerPoint & Google Slides
Process
Multi-Functional Presentation Template for PowerPoint & Google Slides
Pitch Deck
Multi-Purpose Corporate Infographic Template for PowerPoint & Google Slides
Company Profile
Free
Multi-Color Enneagram Circular Diagram Template for PowerPoint & Google Slides
Circular
Multi-Item Agenda Hub-and-Spoke Diagram Template for PowerPoint & Google Slides
Agenda
Doodle Multi Presentation Template for PowerPoint & Google Slides
Company Profile
Free Circular Multi-Step Flow Chart Diagram Template for PowerPoint & Google Slides
Flow Charts
Free
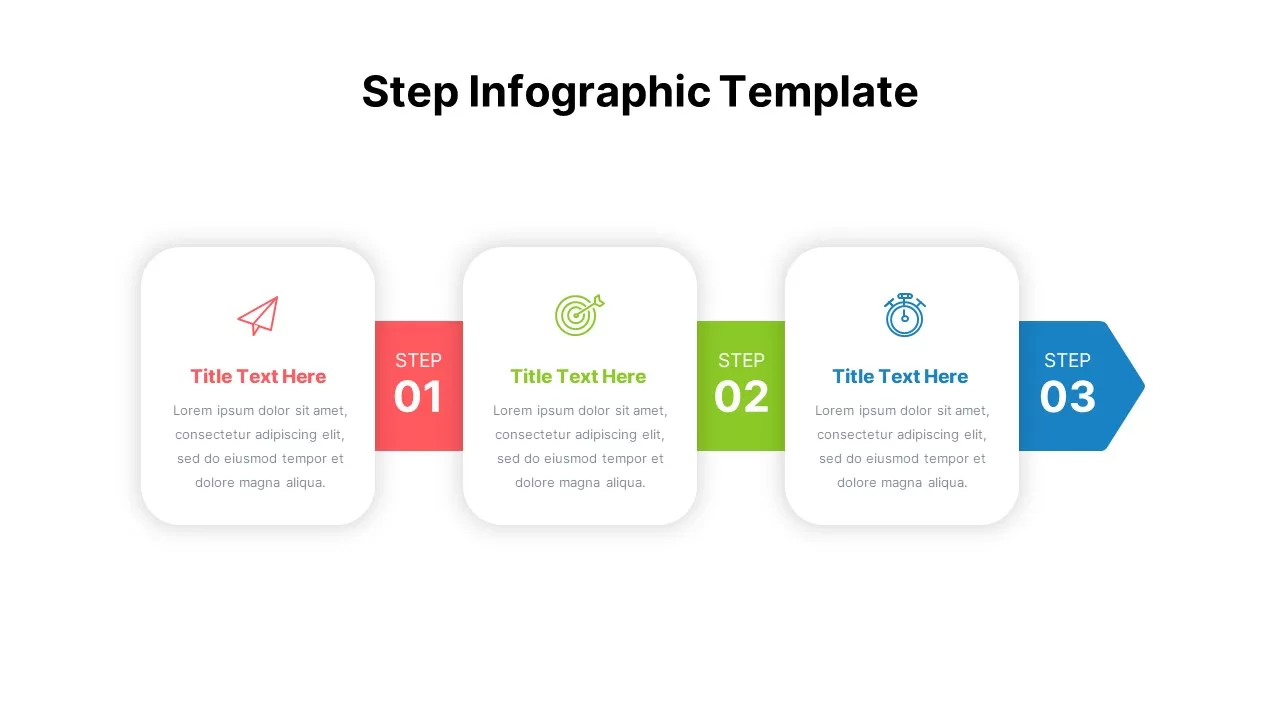
Multi-Step Infographic Process Layout Template for PowerPoint & Google Slides
Process
Multi-Style Flow Infographic Slide template for PowerPoint & Google Slides
Process
Multi-Color Five-Step Curved Arrow Template for PowerPoint & Google Slides
Process
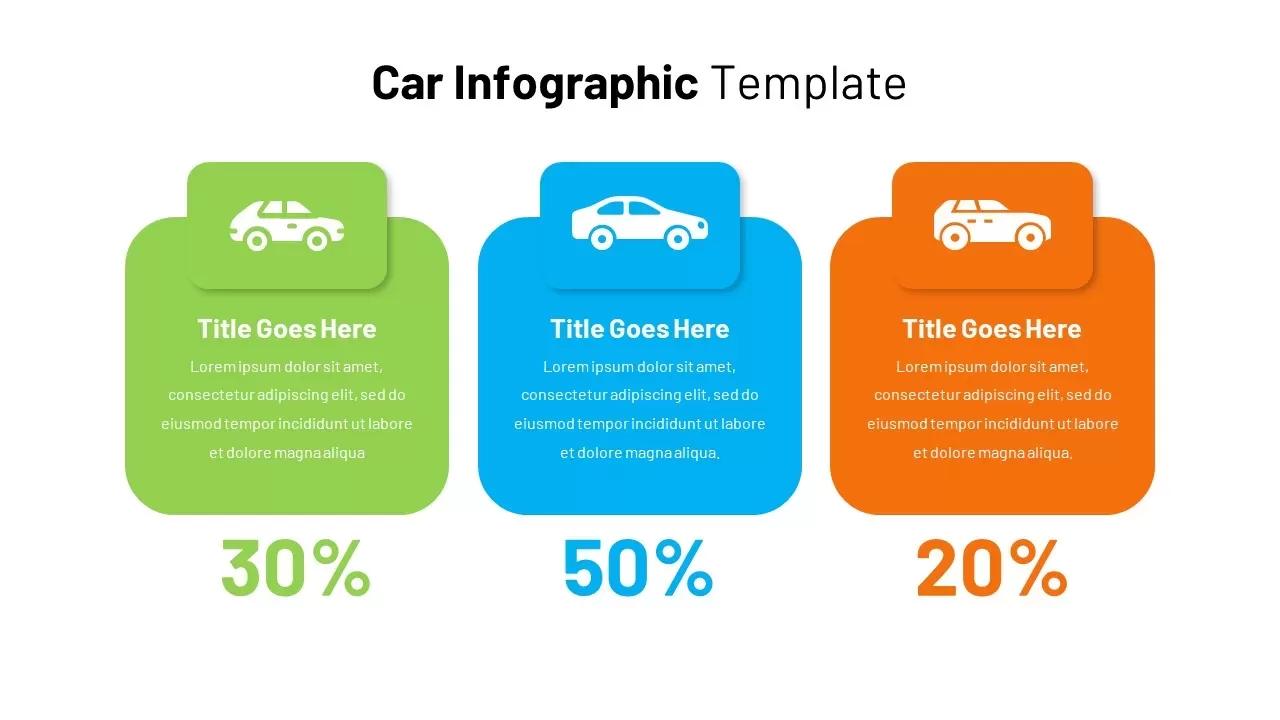
Automotive Infographic Multi-Layout Template for PowerPoint & Google Slides
Comparison
Multi-Series Stacked Bar Chart Template for PowerPoint & Google Slides
Bar/Column
Animated Multi-Gear Cluster Infographic Template for PowerPoint & Google Slides
Process
Editable Multi-Series Peak Line Chart Template for PowerPoint & Google Slides
Comparison Chart
Multi-Series Line Chart with Icons Template for PowerPoint & Google Slides
Comparison Chart
Multi-Series Vertical Dot Chart Template for PowerPoint & Google Slides
Comparison Chart
Multi-Variation Thermometer Chart Template for PowerPoint & Google Slides
Bar/Column
Interactive Multi-Use Cost Comparison Template for PowerPoint & Google Slides
Comparison
Multi-Style Clock Chart Diagram Template for PowerPoint & Google Slides
Circular
Multi-Variation Circular Chart Diagram Template for PowerPoint & Google Slides
Circular
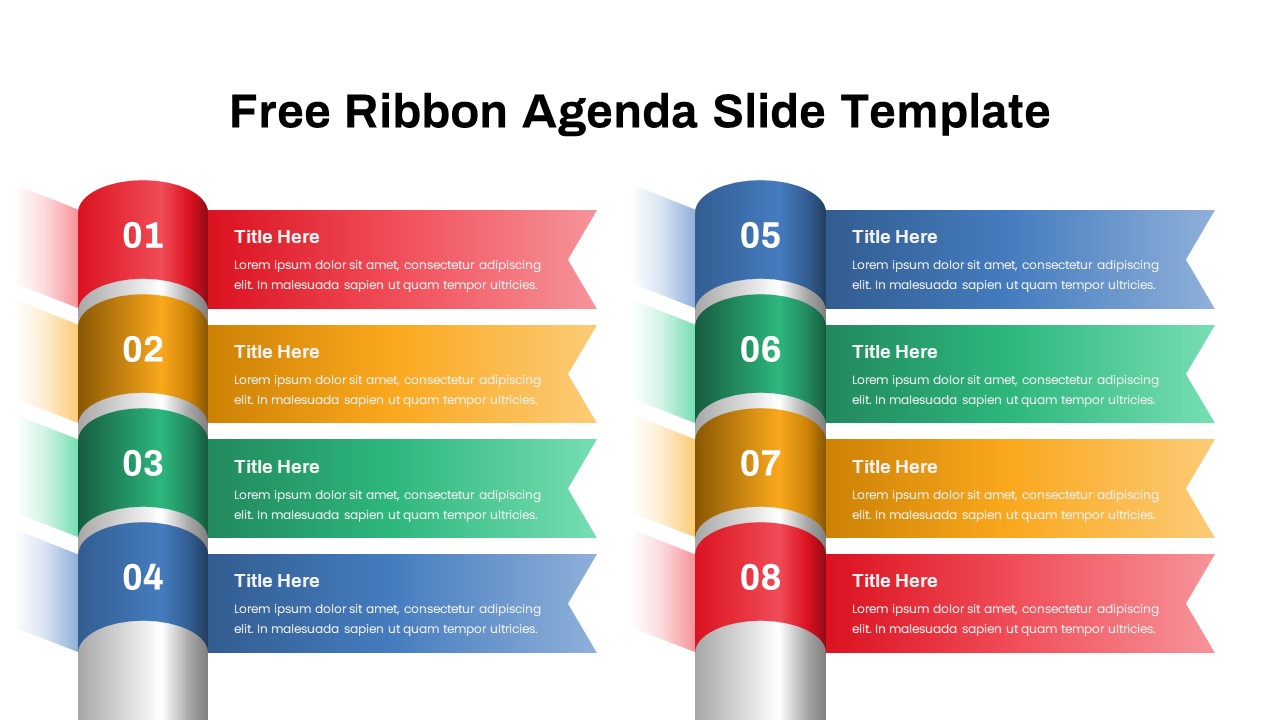
Free Editable Multi-Step Ribbon Agenda Slide Template for PowerPoint & Google Slides
Agenda
Free
Modern Multi-Color Polar Chart Diagram Template for PowerPoint & Google Slides
Charts
Multi-Level Wheel Chart Diagram template for PowerPoint & Google Slides
Pie/Donut
Multi-Level Colorful Pyramid Chart Template for PowerPoint & Google Slides
Pyramid
Free Multi-Step Funnel Infographic Slide Pack Template for PowerPoint & Google Slides
Funnel
Free
Free Minimal Multi-Color Table of Contents Template for PowerPoint & Google Slides
Agenda
Free
Colorful Multi-Branch Mind Map Slide Template for PowerPoint & Google Slides
Mind Maps
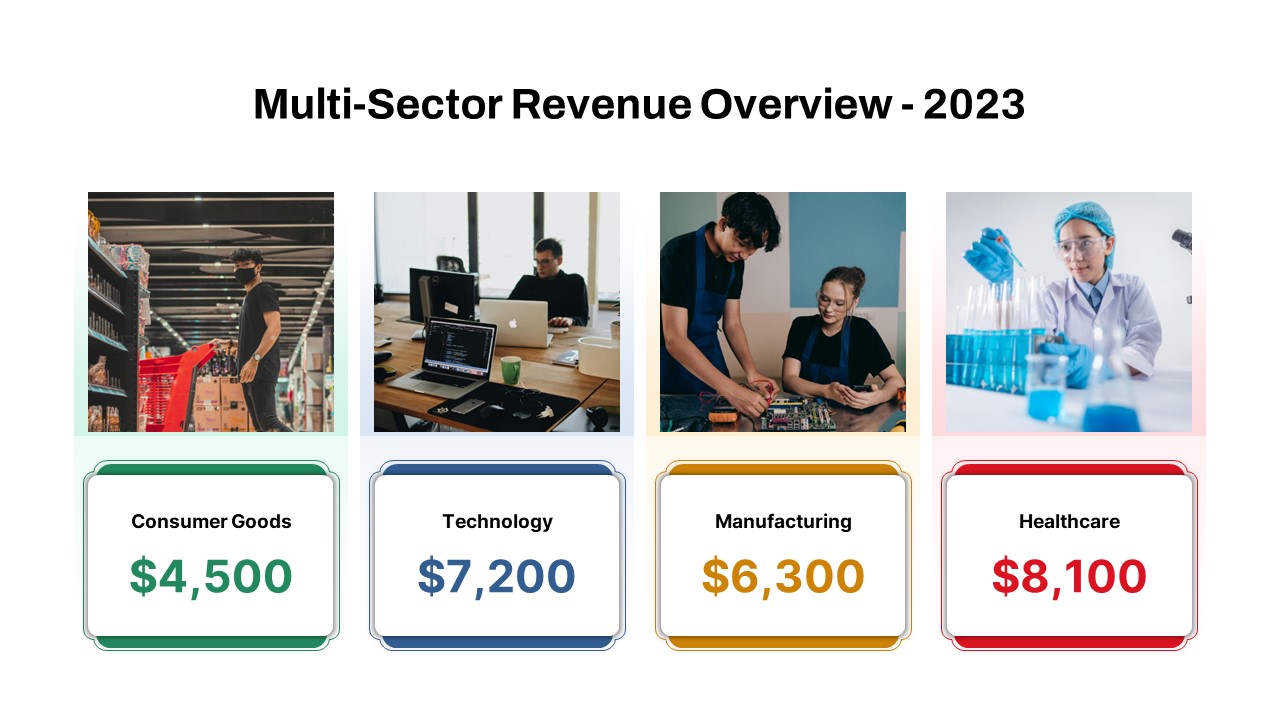
Multi-Sector Revenue Breakdown Cards Template for PowerPoint & Google Slides
Comparison
Multi-Style Board of Directors Profile Template for PowerPoint & Google Slides
Our Team
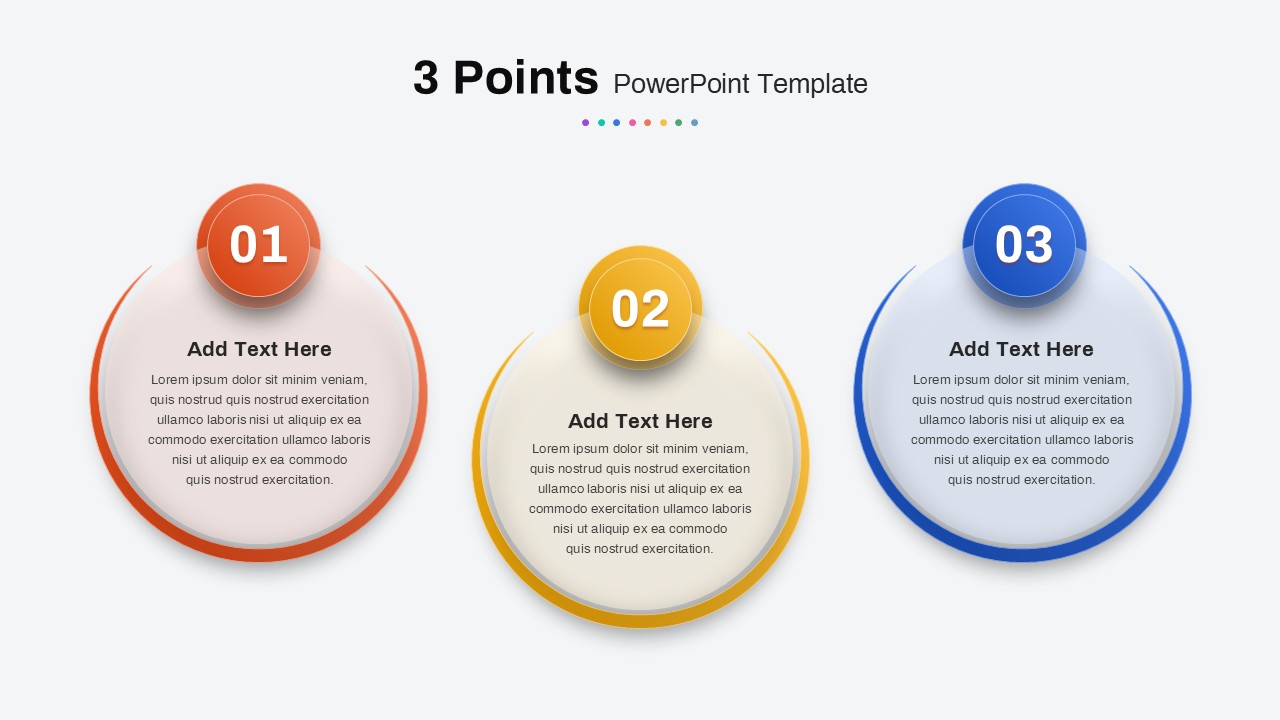
Multi-Point Diagram Presentation Template for PowerPoint & Google Slides
Process
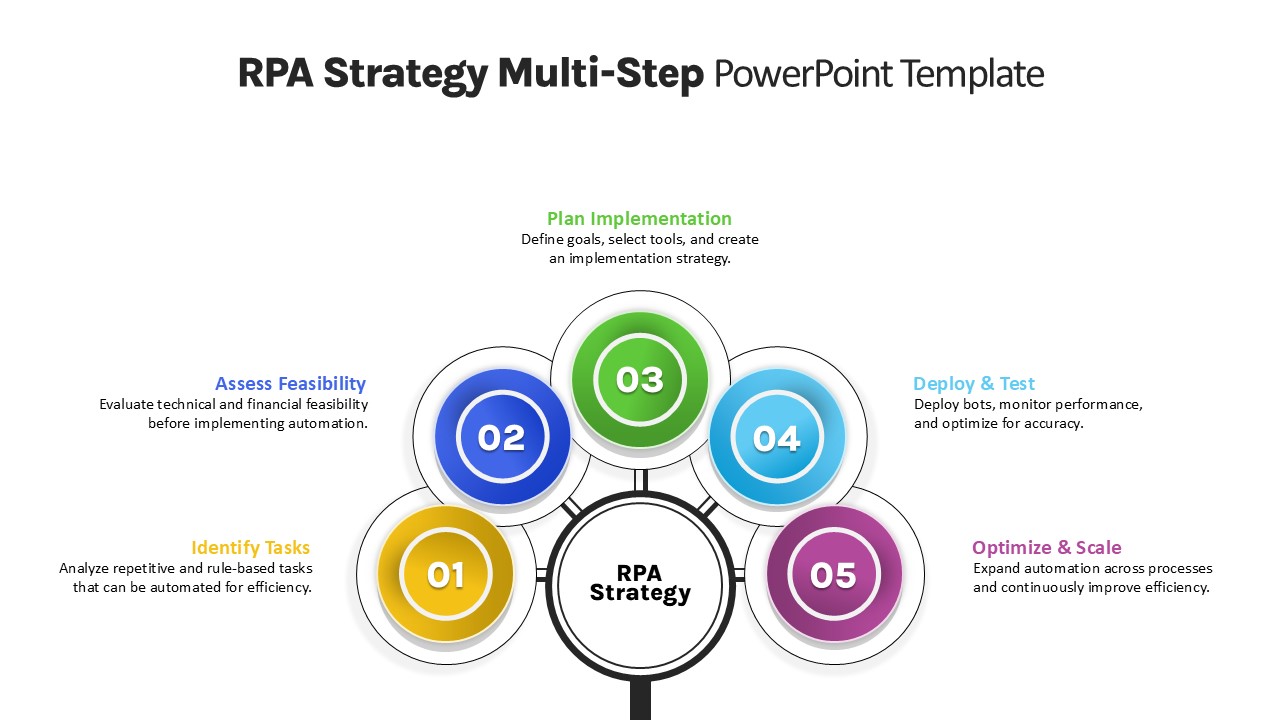
RPA Strategy Multi-Step Diagram Template for PowerPoint & Google Slides
Process
Multi-Column Table Presentation Template for PowerPoint & Google Slides
Table
Six-Row Multi-Column Table Presentation Template for PowerPoint & Google Slides
Table
Multi Color SWOT Analysis Quadrant Template for PowerPoint & Google Slides
SWOT
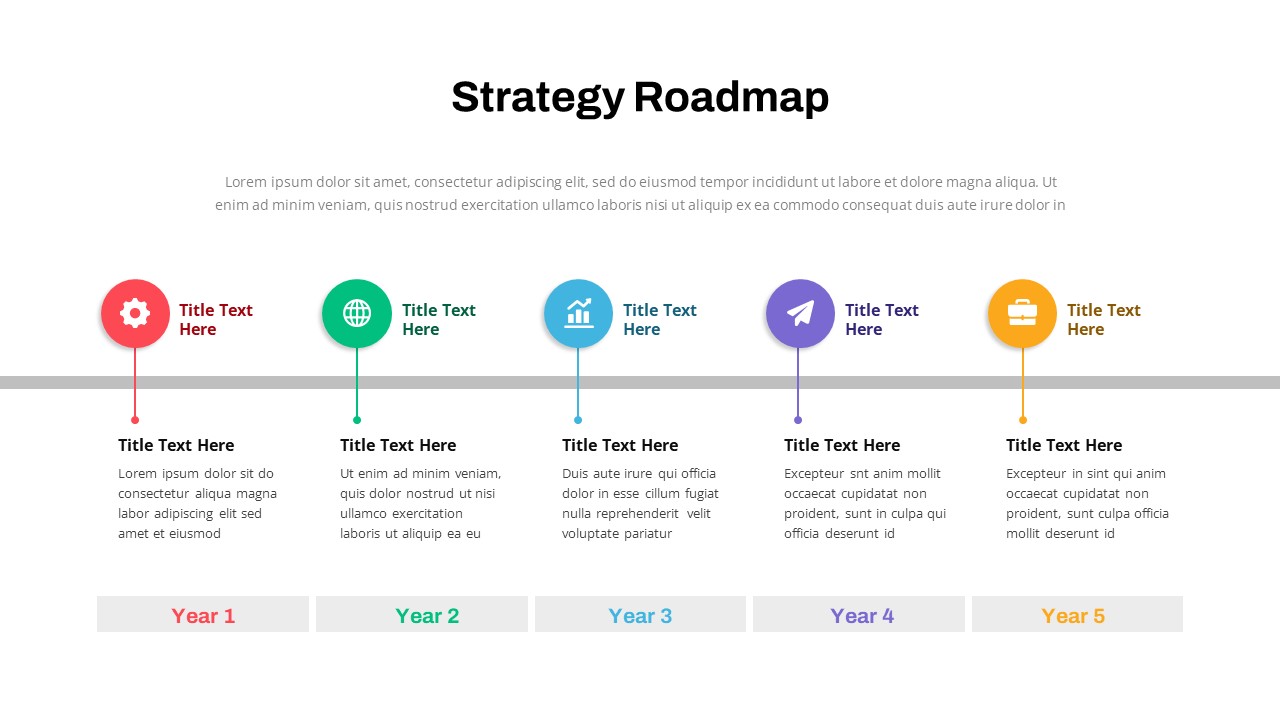
Strategy Roadmap Timeline Slides Template for PowerPoint & Google Slides
Roadmap
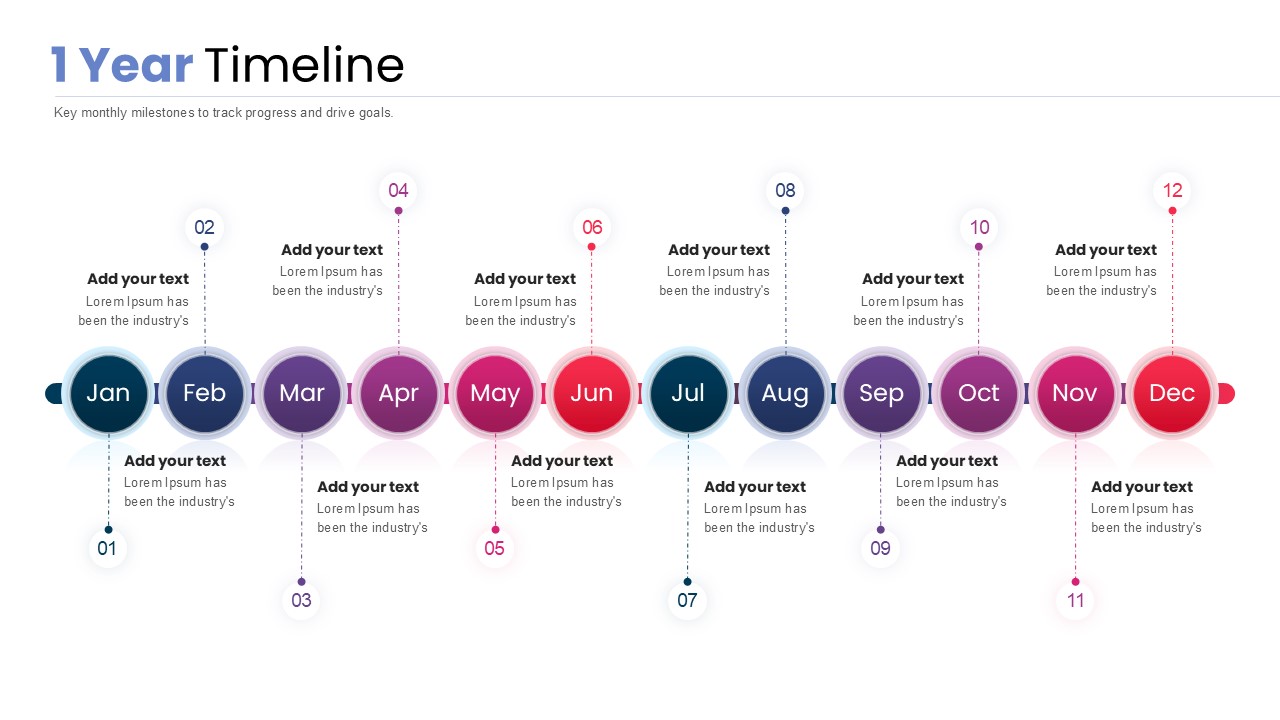
1 Year Timeline PowerPoint Template
Timeline
Product Roadmap Gantt Chart Timeline template for PowerPoint & Google Slides
Gantt Chart
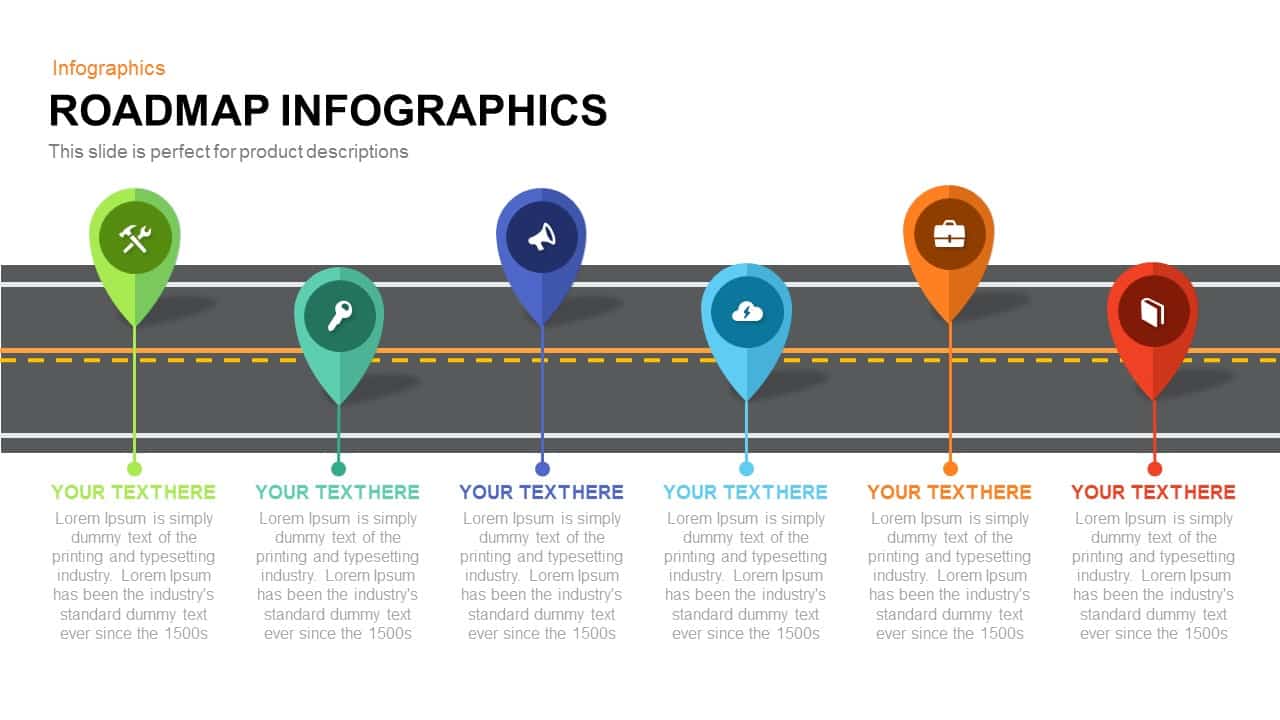
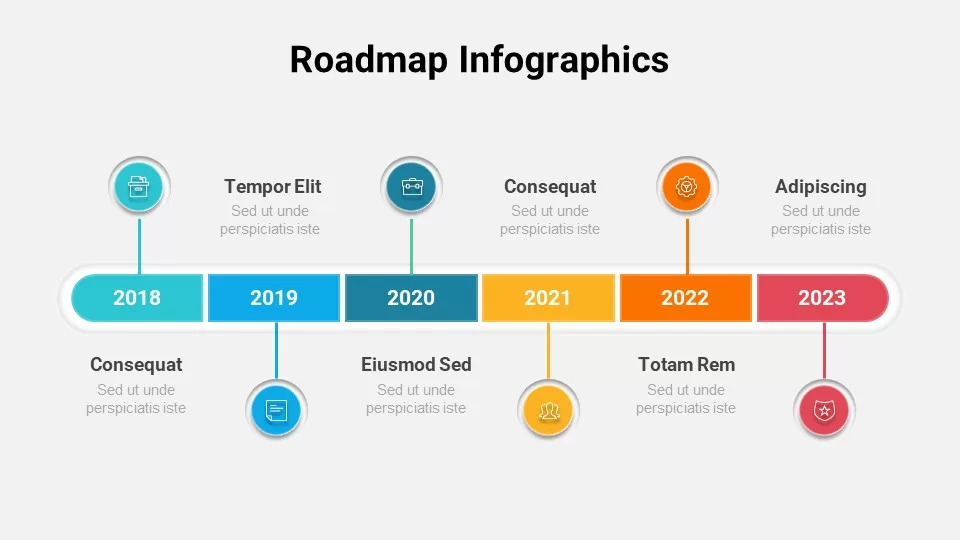
Roadmap Infographic Timeline Slide Template for PowerPoint & Google Slides
Roadmap
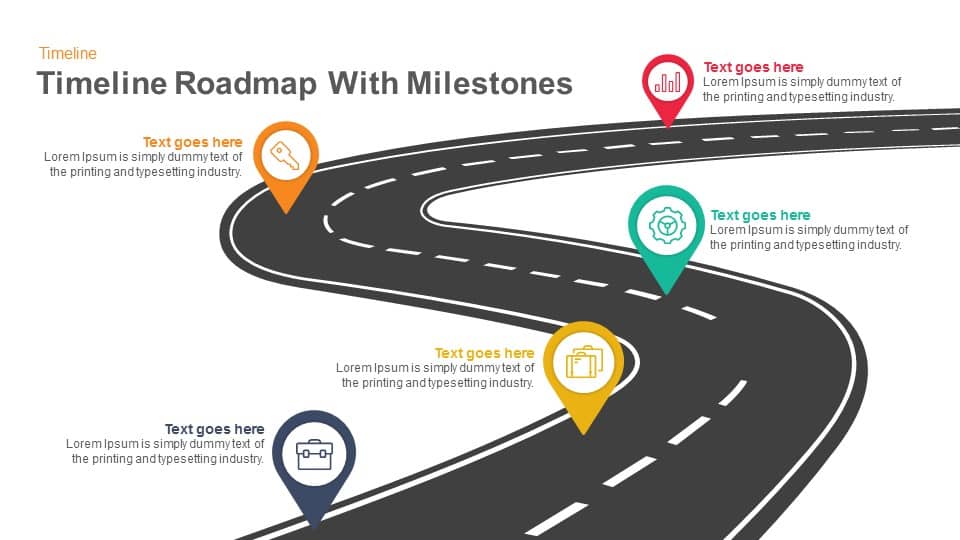
Timeline Roadmap with Milestones template for PowerPoint & Google Slides
Roadmap
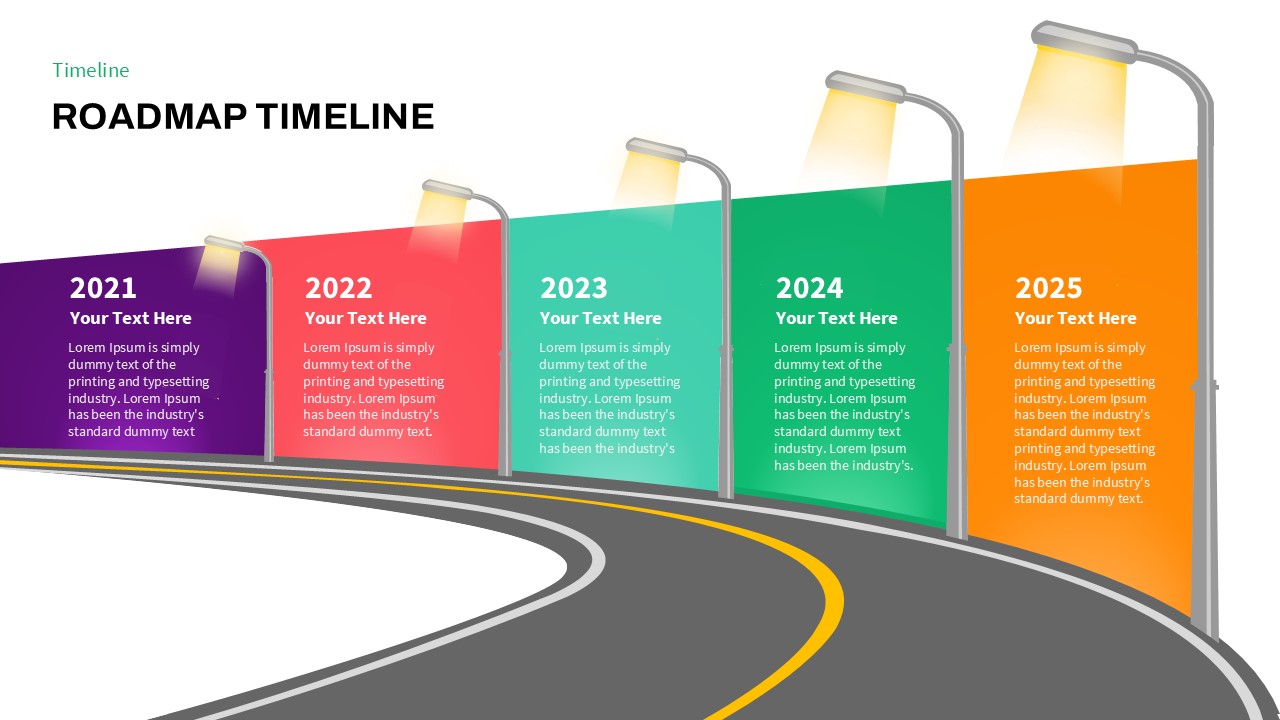
Curved Road Roadmap Timeline Diagram Template for PowerPoint & Google Slides
Roadmap
Free Colorful Roadmap Timeline Infographic Template for PowerPoint & Google Slides
Roadmap
Free
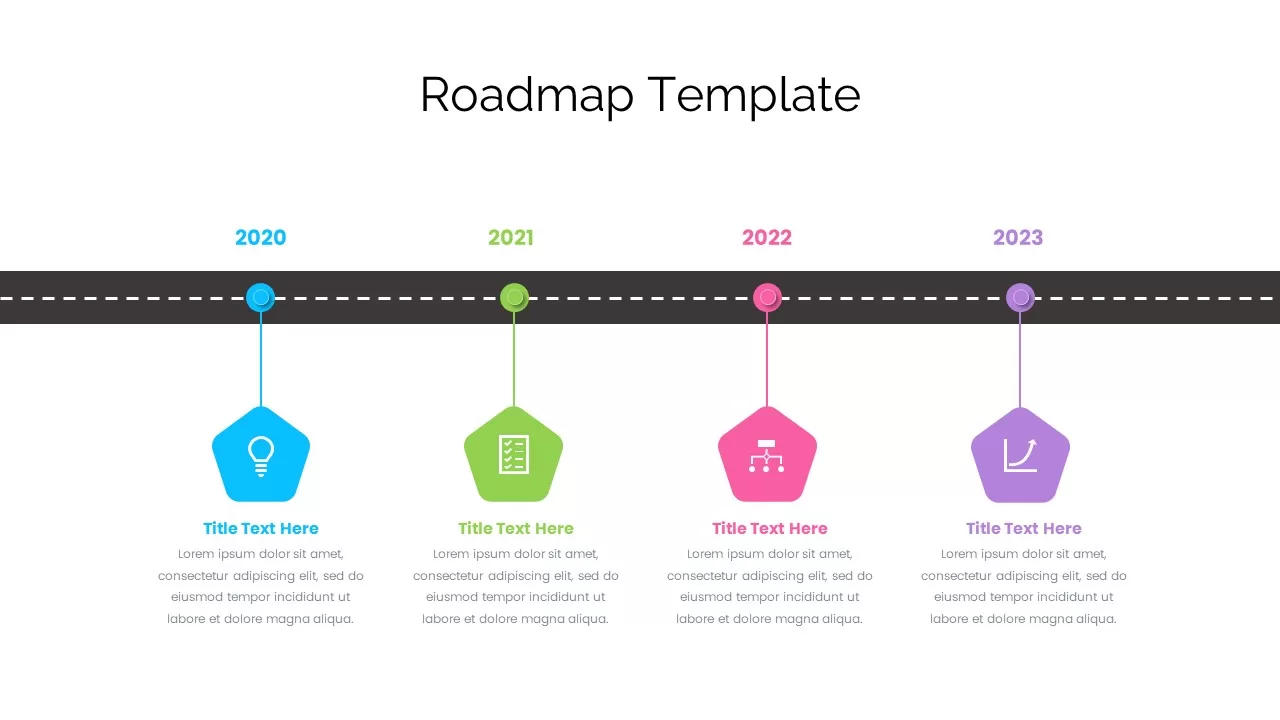
Roadmap Timeline Template for PowerPoint & Google Slides
Timeline
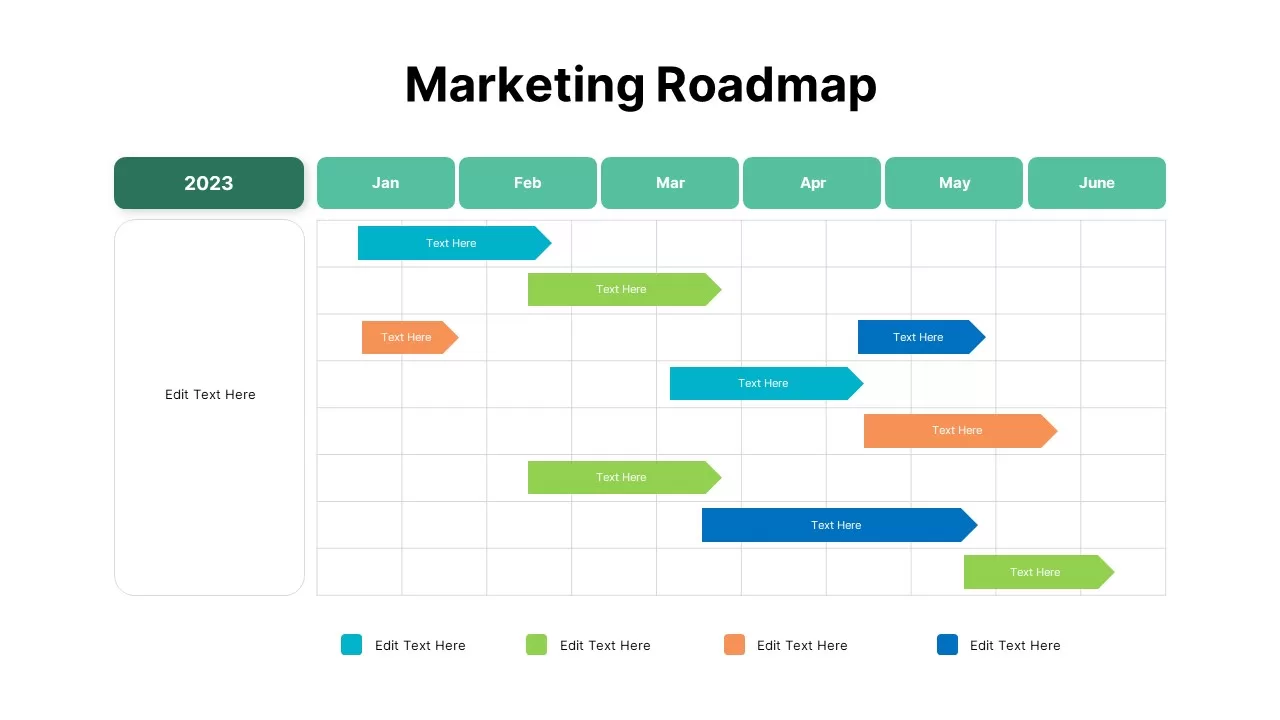
Customizable Marketing Roadmap Timeline Template for PowerPoint & Google Slides
Roadmap
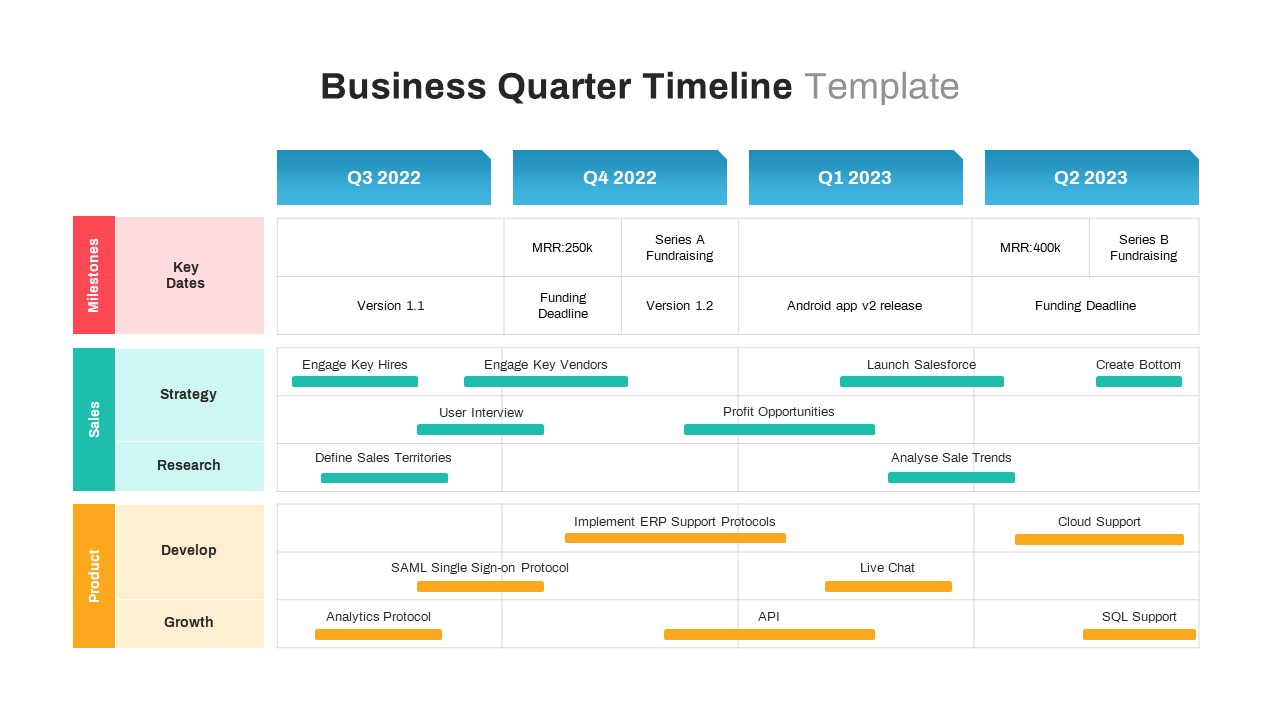
Business Quarter Roadmap Timeline Template for PowerPoint & Google Slides
Timeline
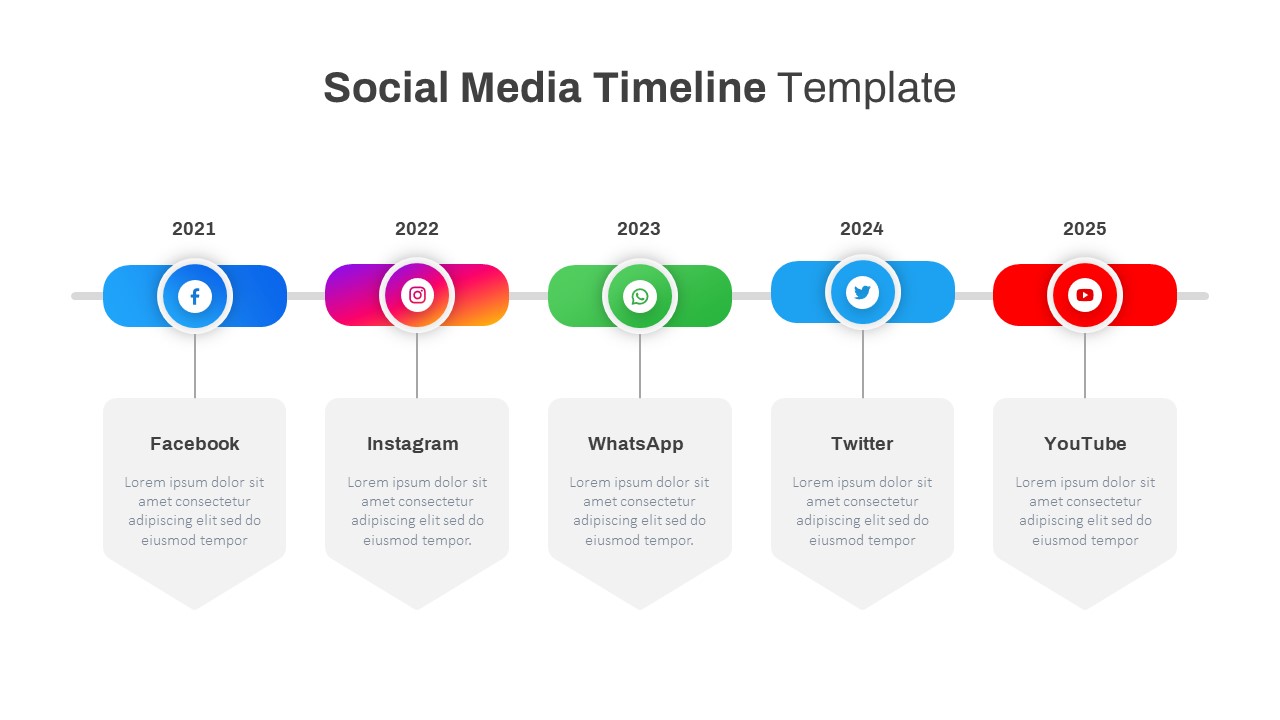
Modern Social Media Timeline Roadmap Template for PowerPoint & Google Slides
Timeline
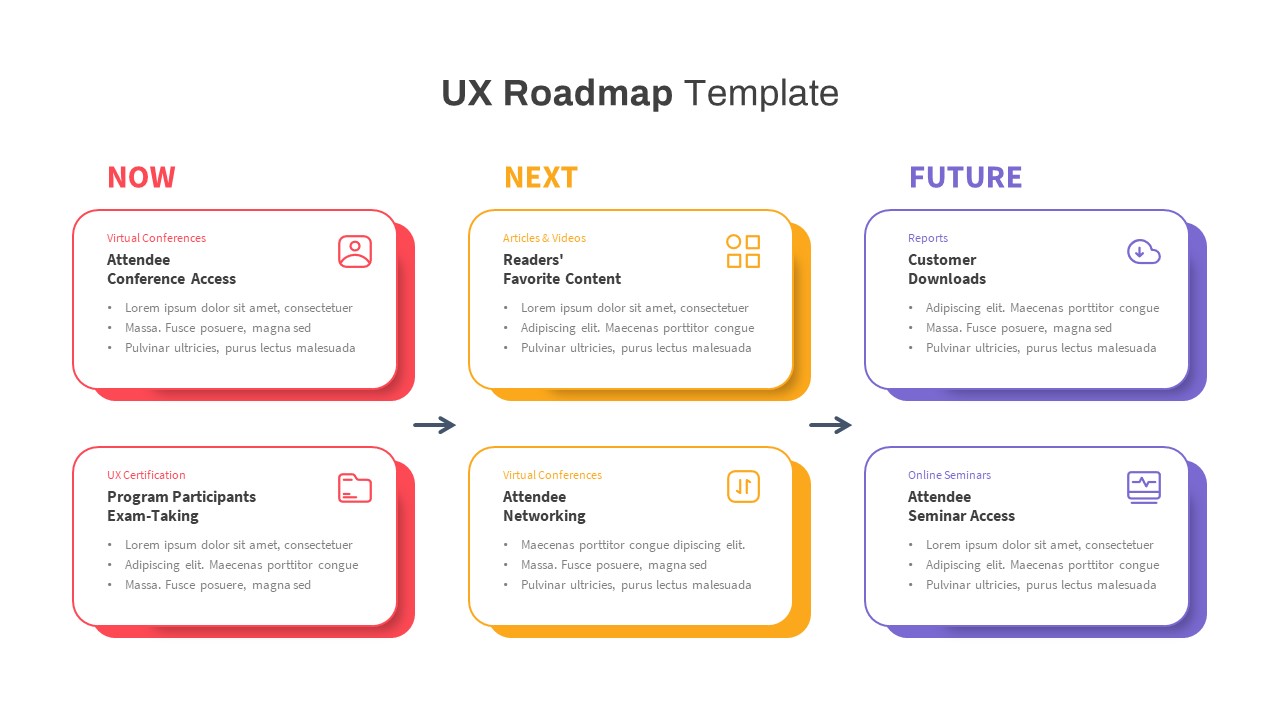
UX Roadmap Timeline Template for PowerPoint & Google Slides
Roadmap
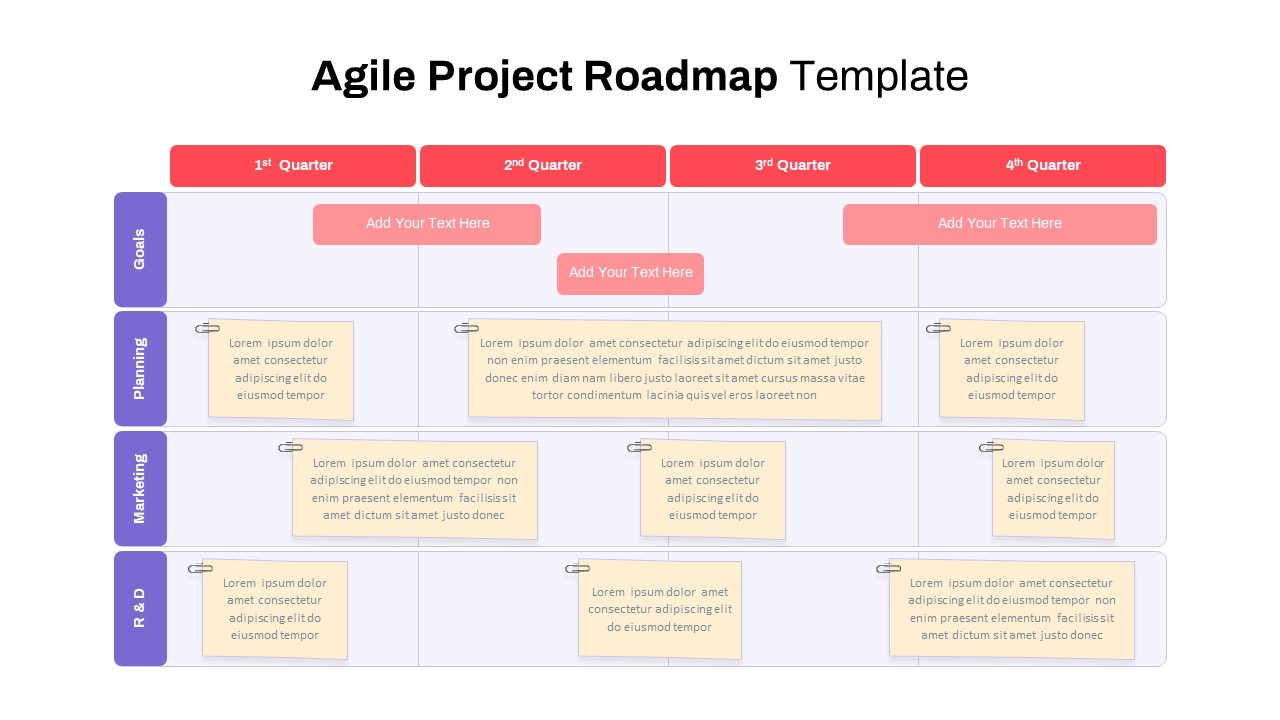
Agile Project Roadmap Timeline Template Pack for PowerPoint & Google Slides
Scrum
Clean Minimalist Roadmap Timeline Template for PowerPoint & Google Slides
Roadmap
Multicolor Alternating Timeline Roadmap Template for PowerPoint & Google Slides
Timeline
Interactive Innovation Timeline Roadmap Template for PowerPoint & Google Slides
Timeline
AI Roadmap & Planning Timeline Template for PowerPoint & Google Slides
Roadmap
Business Launch Timeline Roadmap 5-Phase Template for PowerPoint & Google Slides
Business
Campaign Timeline Marketing Roadmap Slide Template for PowerPoint & Google Slides
Timeline