Q-Learning Process Flow Diagram Template for PowerPoint & Google Slides


Description
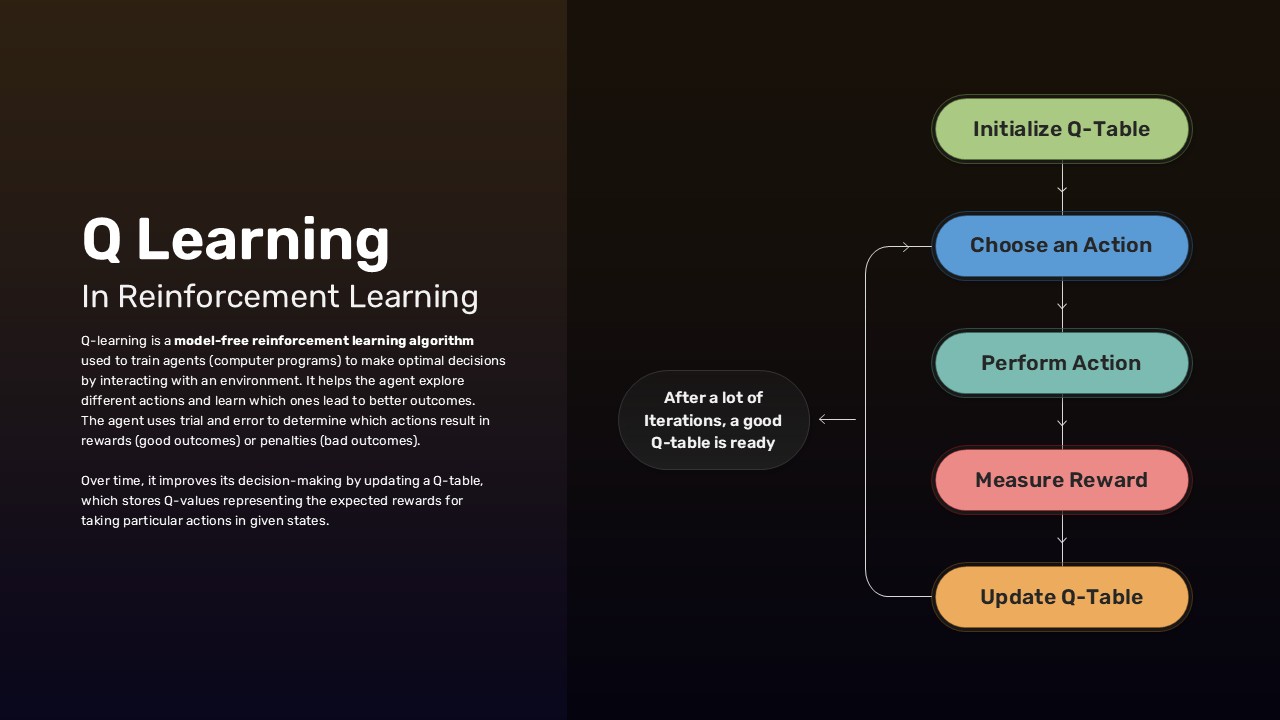
This slide visualizes the Q-Learning algorithm as an iterative, model-free reinforcement learning process. On the right, five rounded-rectangle shapes arranged in vertical alignment depict each core step: Initialize Q-Table, Choose an Action, Perform Action, Measure Reward, and Update Q-Table. A looping arrow traces the cycle from Update Q-Table back to Choose an Action, emphasizing continuous learning through trial and error. A central callout bubble highlights the convergence point: After numerous iterations, a robust Q-table emerges. On the left, a clear title and subtitle introduce the topic, accompanied by two concise paragraphs that define Q-Learning and explain its purpose in training agents to optimize decision-making by updating expected reward values for state-action pairs.
The design leverages a modern gradient palette—green, blue, teal, red, and orange—to differentiate each step, while subtle drop shadows and rounded corners reinforce a polished professional aesthetic. Compatible with both dark and light theme variants, the slide maintains visual consistency across presentations. All elements are built using editable master slides, enabling you to adjust colors, text, icons, and layout in seconds without breaking alignment or resolution.
Ideal for technical briefings, academic lectures, and data science workshops, this template simplifies the illustration of any cyclic process, beyond Q-Learning. Use it to map other reinforcement learning algorithms, optimization loops, or iterative business workflows. Rearrange the sequence, replace step labels and colors, or swap in custom icons to adapt the slide to machine learning, operations research, or project management contexts. Perfectly optimized for PowerPoint and Google Slides, this asset eliminates formatting headaches and accelerates content creation.
Who is it for
Machine learning engineers, data scientists, AI researchers and technical instructors will find this Q-Learning process diagram invaluable when explaining algorithm workflows, training teams, or presenting research findings. Data science educators and technical consultants can also leverage it to illustrate any iterative decision-making cycle.
Other Uses
Beyond Q-Learning, repurpose this diagram to map other reinforcement learning algorithms, optimization loops, or iterative processes such as control systems, A/B testing cycles and agile sprint retrospectives. Simply relabel the steps, swap icons and update colors to fit your audience or domain, from operations research to project management.
Login to download this file

Item ID
SB05060
Related Templates

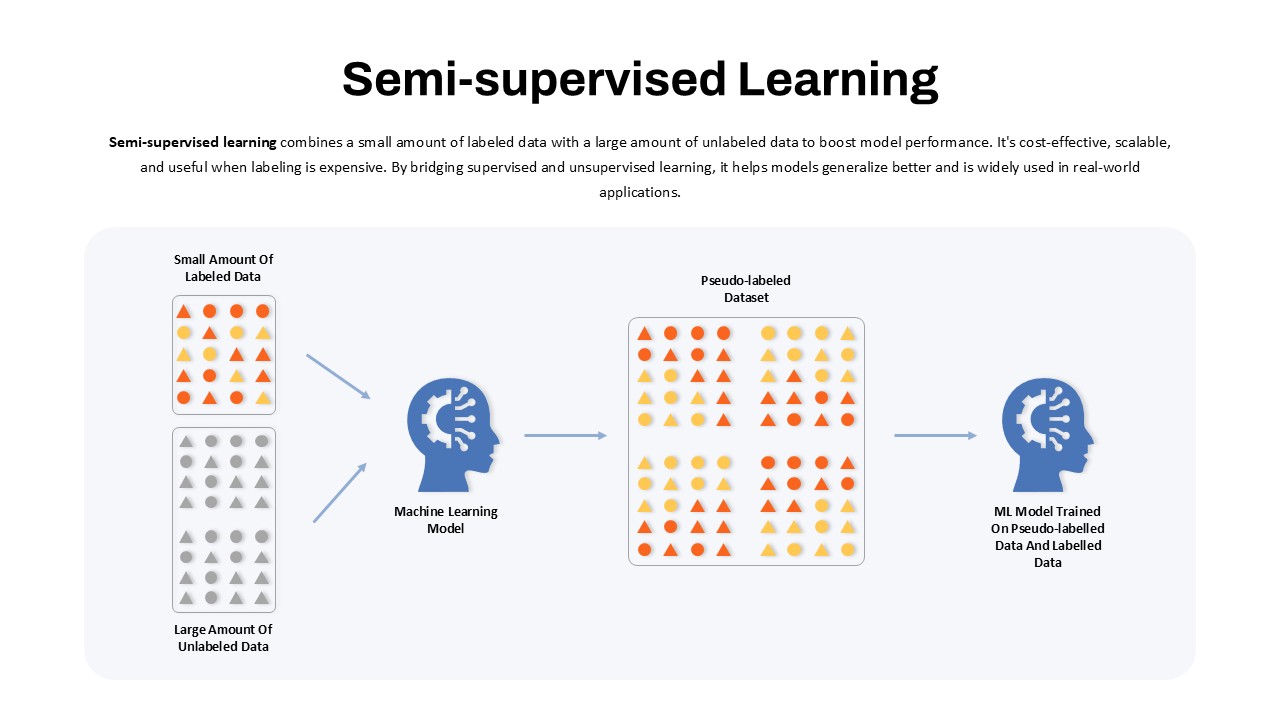
Semi-Supervised Learning Flow Diagram Template for PowerPoint & Google Slides
Machine Learning
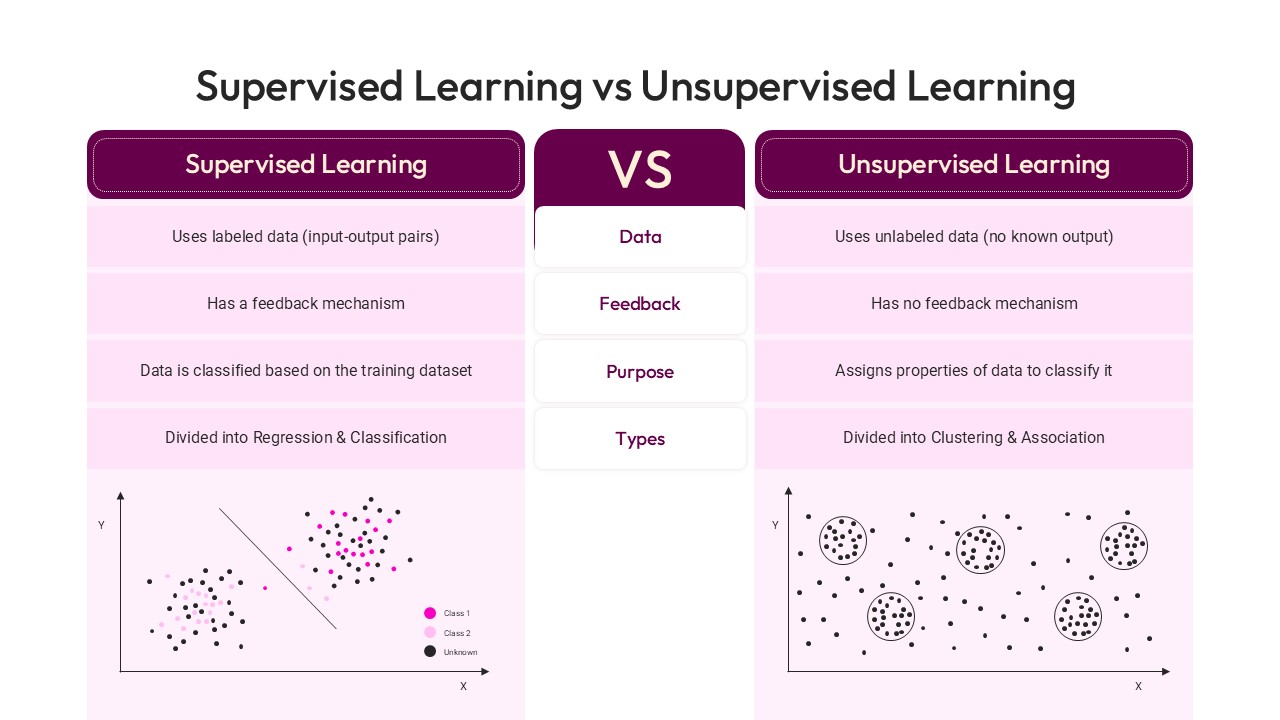
Supervised Learning vs Unsupervised Learning template for PowerPoint & Google Slides
Technology
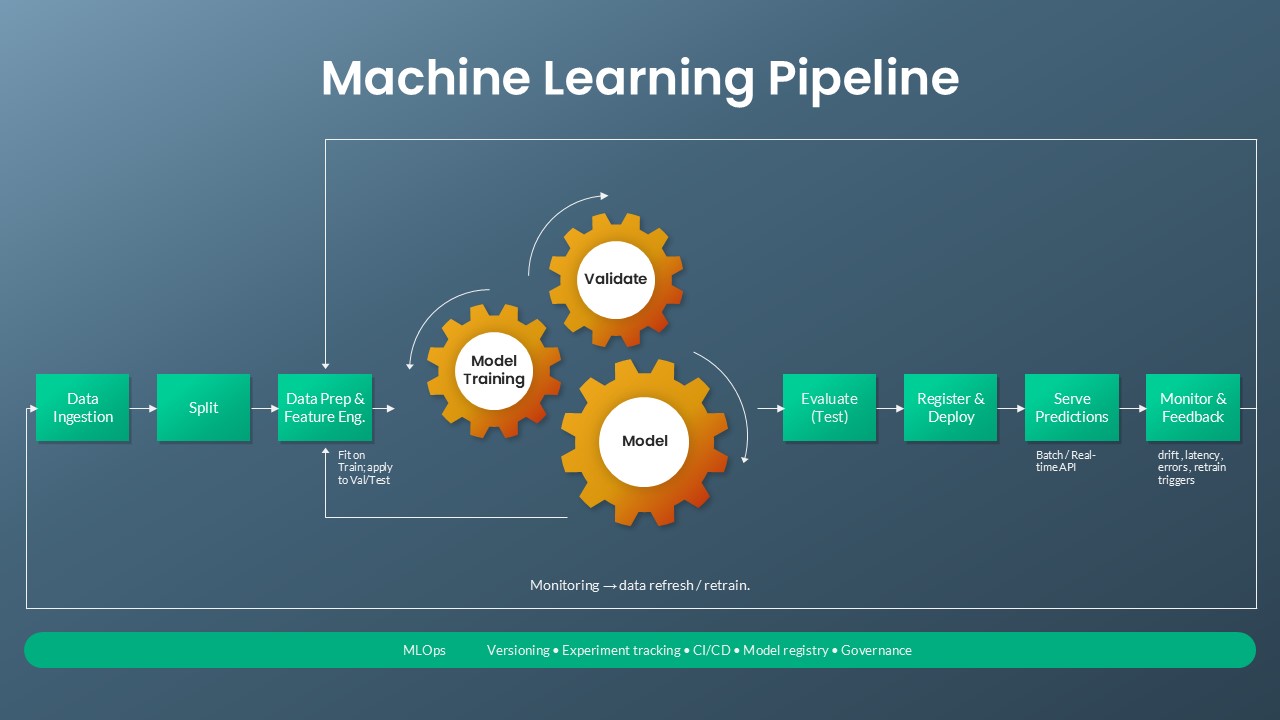
Machine Learning Pipeline & MLOps Flow Template for PowerPoint & Google Slides
Machine Learning
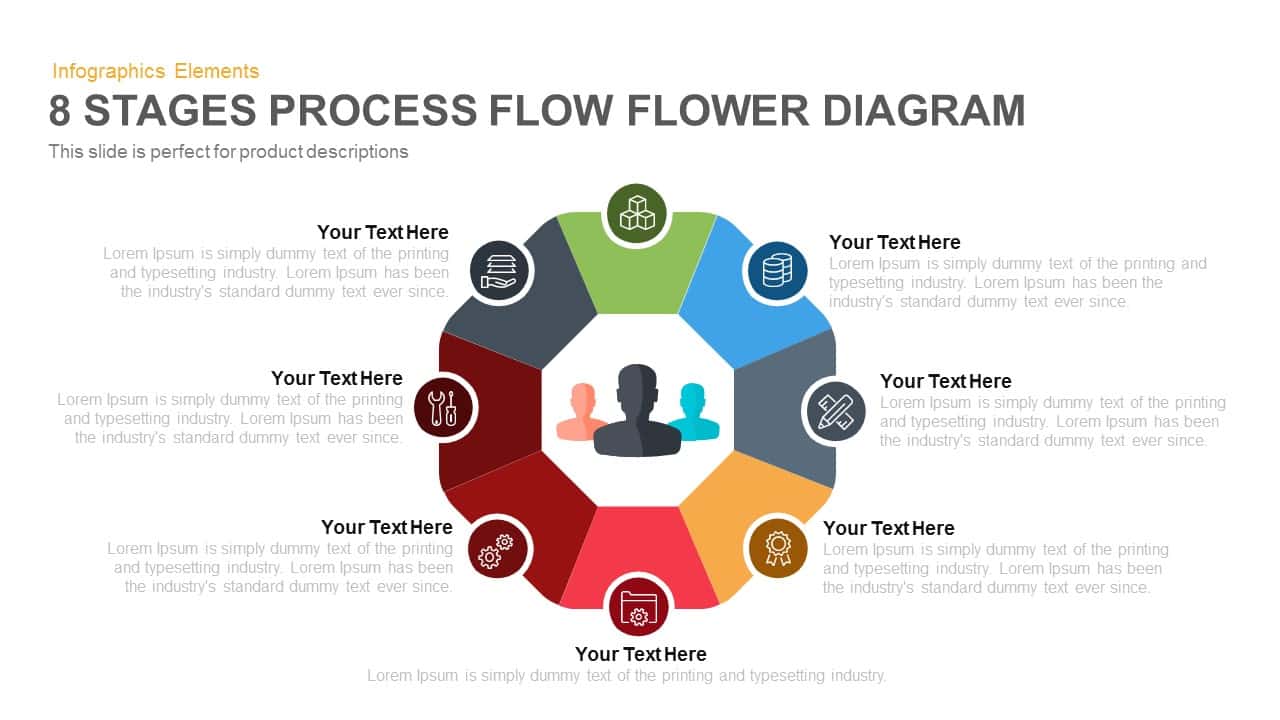
8-Stage Process Flow Flower Diagram Template for PowerPoint & Google Slides
Infographics
4 Section Pipe Diagram Process Flow Template for PowerPoint & Google Slides
Process
Dynamic Shield Process Flow Diagram template for PowerPoint & Google Slides
Process
Six Hexagon Stages Process Flow Diagram Template for PowerPoint & Google Slides
Process
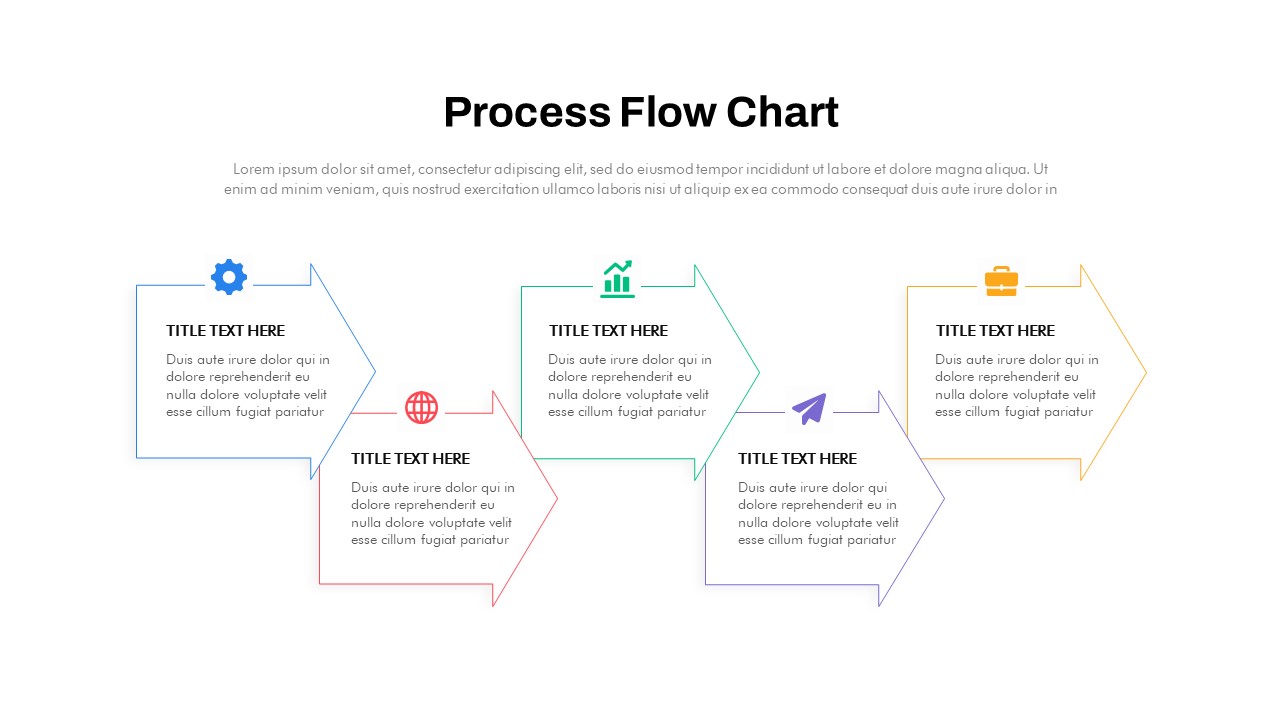
Process Flow Diagram template for PowerPoint & Google Slides
Infographics

15-Step Process Flow Diagram Template for PowerPoint & Google Slides
Process
3D Shape Linear Process Flow Diagram Template for PowerPoint & Google Slides
Process
Linear Process Flow Circles Diagram Template for PowerPoint & Google Slides
Process
Six-Stage Zig-Zag Process Flow Diagram Template for PowerPoint & Google Slides
Process
Vertical Business Process Flow Diagram Template for PowerPoint & Google Slides
Process
Six-Sided Shutter Diagram Process Flow Template for PowerPoint & Google Slides
Process

10 Stages Business Flow Process Diagram template for PowerPoint & Google Slides
Business

Eight-Stage Radial Process Flow Diagram Template for PowerPoint & Google Slides
Process
Four-Plus Process Flow Diagram Template for PowerPoint & Google Slides
Process
Five Stage Linear Process Flow Diagram Template for PowerPoint & Google Slides
Process
Five-Stage Linear Process Flow Diagram Template for PowerPoint & Google Slides
Process
Six-Step Hexagon Process Flow Diagram Template for PowerPoint & Google Slides
Process
Five-Stage Circular Process Flow Diagram Template for PowerPoint & Google Slides
Circular
5-Stage Gear Process Flow Diagram Template for PowerPoint & Google Slides
Process
3D Seven-Stage Process Flow Diagram Template for PowerPoint & Google Slides
Process
Four-Stage Linear Process Flow Diagram Template for PowerPoint & Google Slides
Process
5-Stage Linear Process Flow Diagram Template for PowerPoint & Google Slides
Process
5 Stage Linear Process Flow Diagram Template for PowerPoint & Google Slides
Process
Five-Stage Process Flow Diagram Template for PowerPoint & Google Slides
Process
4 Stage Linear Process Flow Diagram Template for PowerPoint & Google Slides
Process
7 Stage Linear Process Flow Diagram Template for PowerPoint & Google Slides
Process
8 Step Circular Process Flow Diagram Template for PowerPoint & Google Slides
Process
4 Stage Linear Process Flow Diagram Template for PowerPoint & Google Slides
Process
6-Step Business Process Flow Diagram Template for PowerPoint & Google Slides
Process
6-Step Circular Process Flow Diagram Template for PowerPoint & Google Slides
Process
4-Stage Linear Process Flow Diagram Template for PowerPoint & Google Slides
Process
4-Step Linear Process Flow Diagram Template for PowerPoint & Google Slides
Process
Business Process Management Flow Diagram Template for PowerPoint & Google Slides
Process
Colorful 8-Stage Droplet Process Flow Diagram Template for PowerPoint & Google Slides
Process
Minimal Process Flow Diagram Infographic Template for PowerPoint & Google Slides
Process
Process Flow Diagram template for PowerPoint & Google Slides
Process
Curved Arrow Process Flow Diagram Template for PowerPoint & Google Slides
Process
Curved Arrow Process Flow Diagram Template for PowerPoint & Google Slides
Arrow
3D Conveyor Belt Process Flow Diagram Template for PowerPoint & Google Slides
Process
E-Waste Management Process Flow Diagram Template for PowerPoint & Google Slides
Process
Comprehensive Process Flow Diagram Template for PowerPoint & Google Slides
Process
Animated Gears Process Flow Diagram Template for PowerPoint & Google Slides
Process
Capital Investments Process Flow Diagram Template for PowerPoint & Google Slides
Process
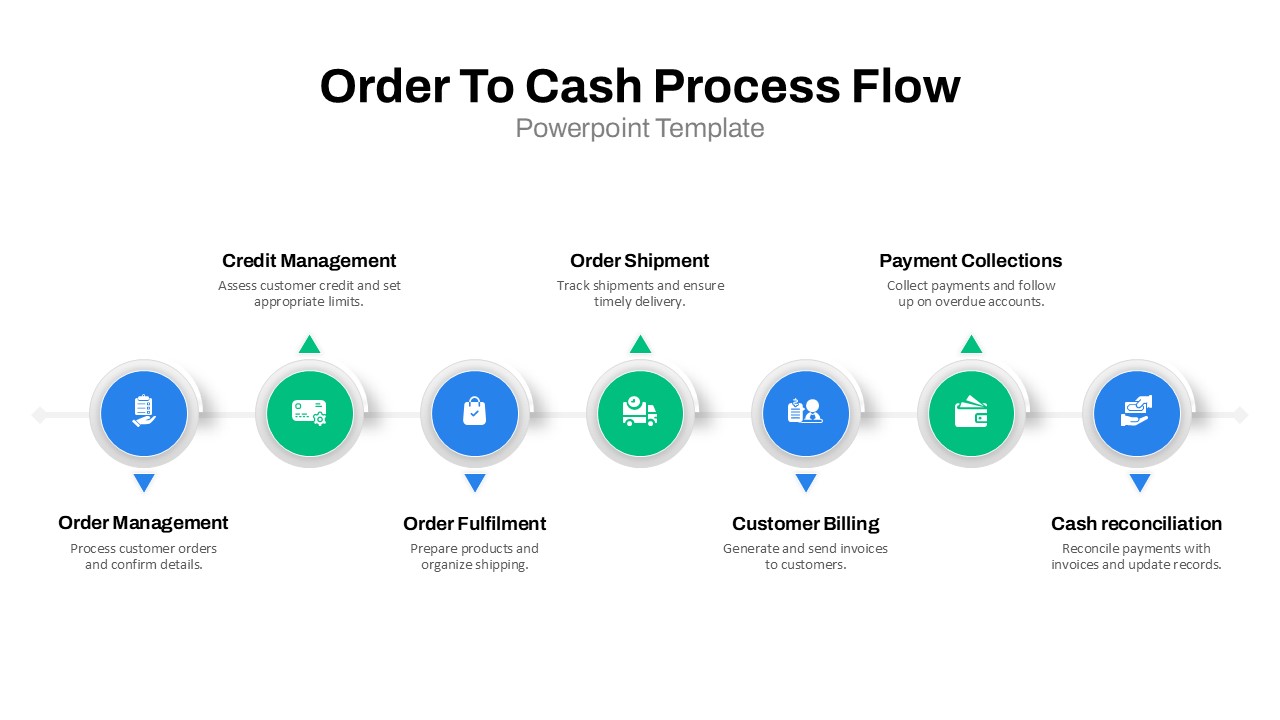
Order to Cash Process Flow Diagram Template for PowerPoint & Google Slides
Process
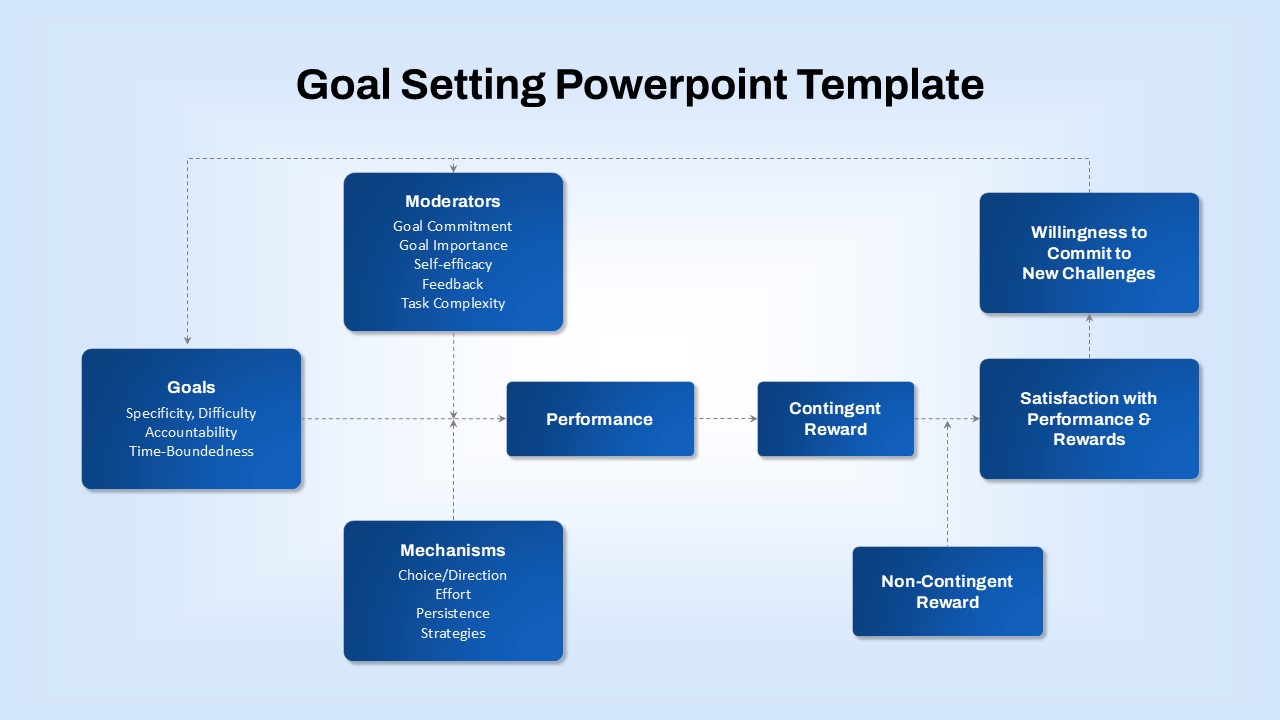
Goal-Setting Process Flow Diagram Template for PowerPoint & Google Slides
Goals
Resume Screening Process Flow Diagram Template for PowerPoint & Google Slides
Process
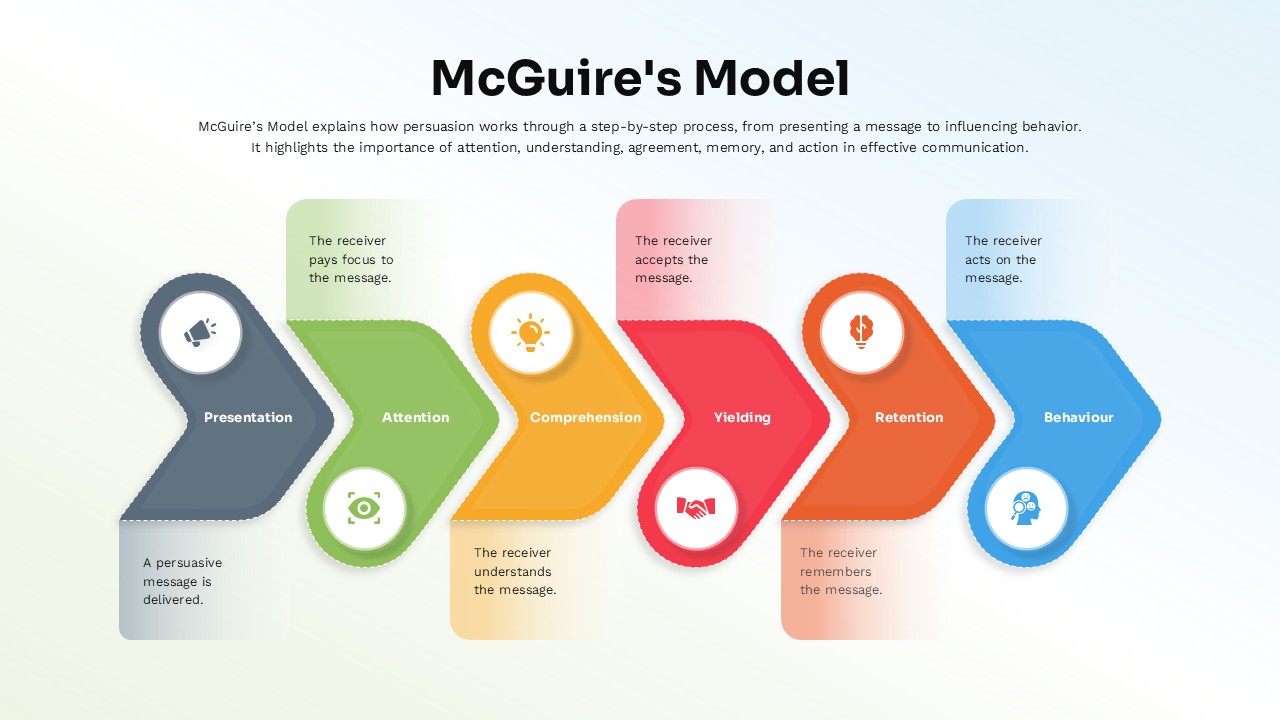
McGuire’s Persuasion Process Flow Diagram Template for PowerPoint & Google Slides
Marketing
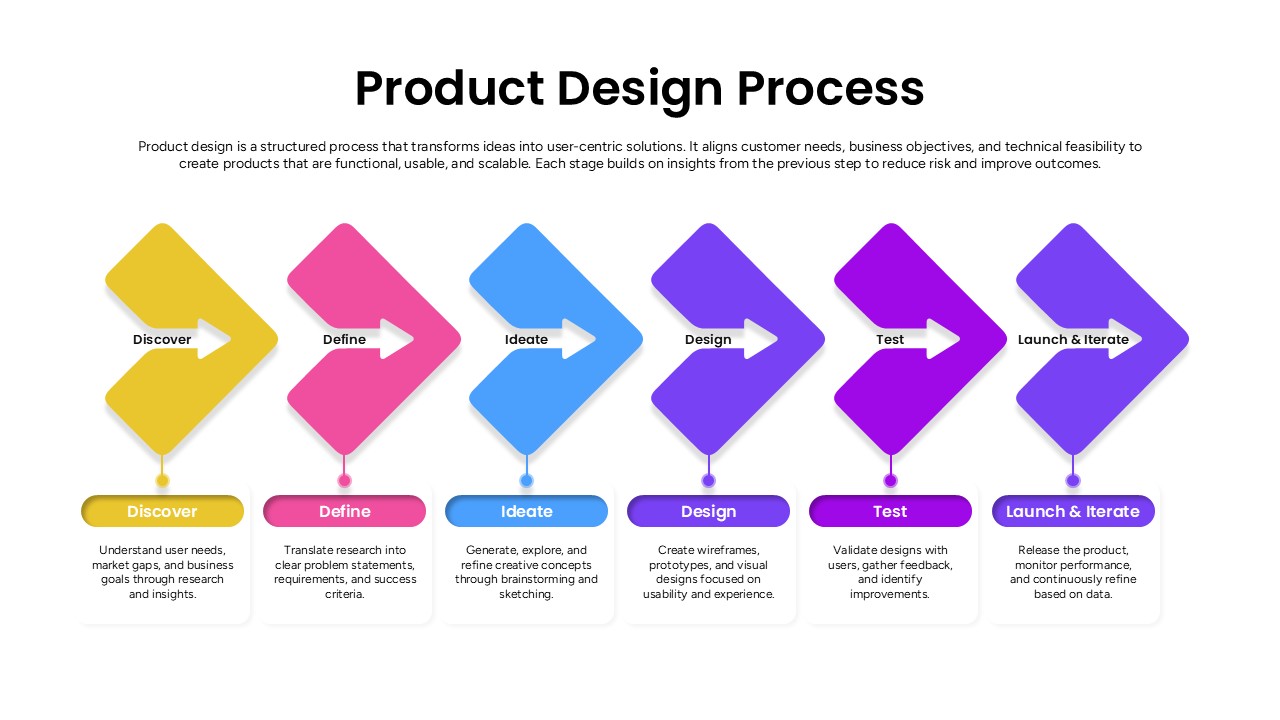
Product Design Process Flow Diagram Template for PowerPoint & Google Slides
Process
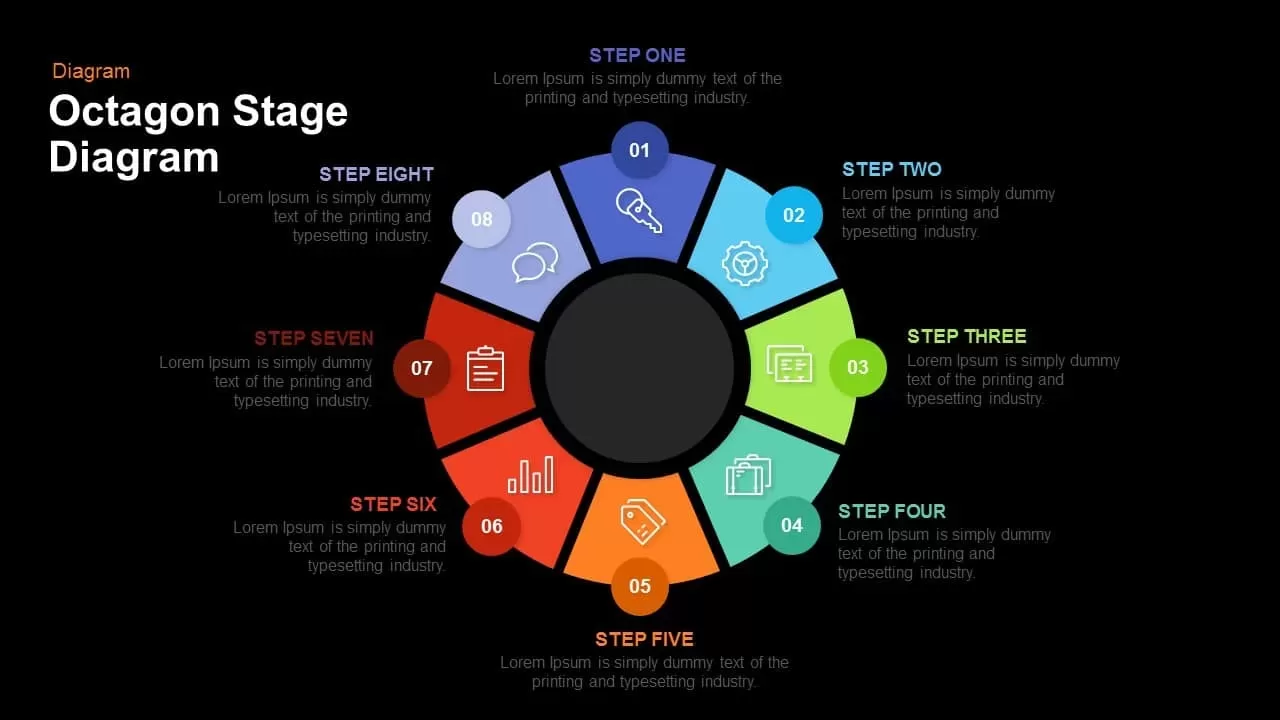
Octagon Stage Process Flow Diagram for PowerPoint & Google Slides
Process
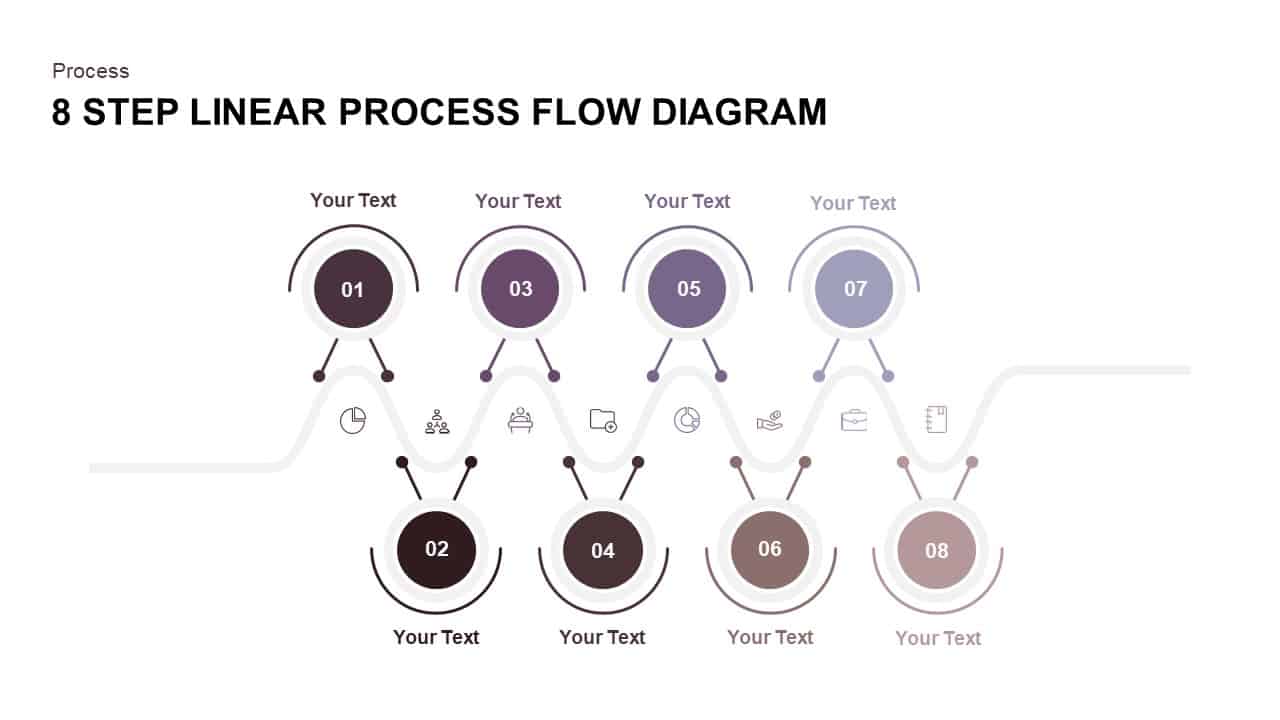
8 Step Linear Process Flow Diagram for PowerPoint & Google Slides
Process
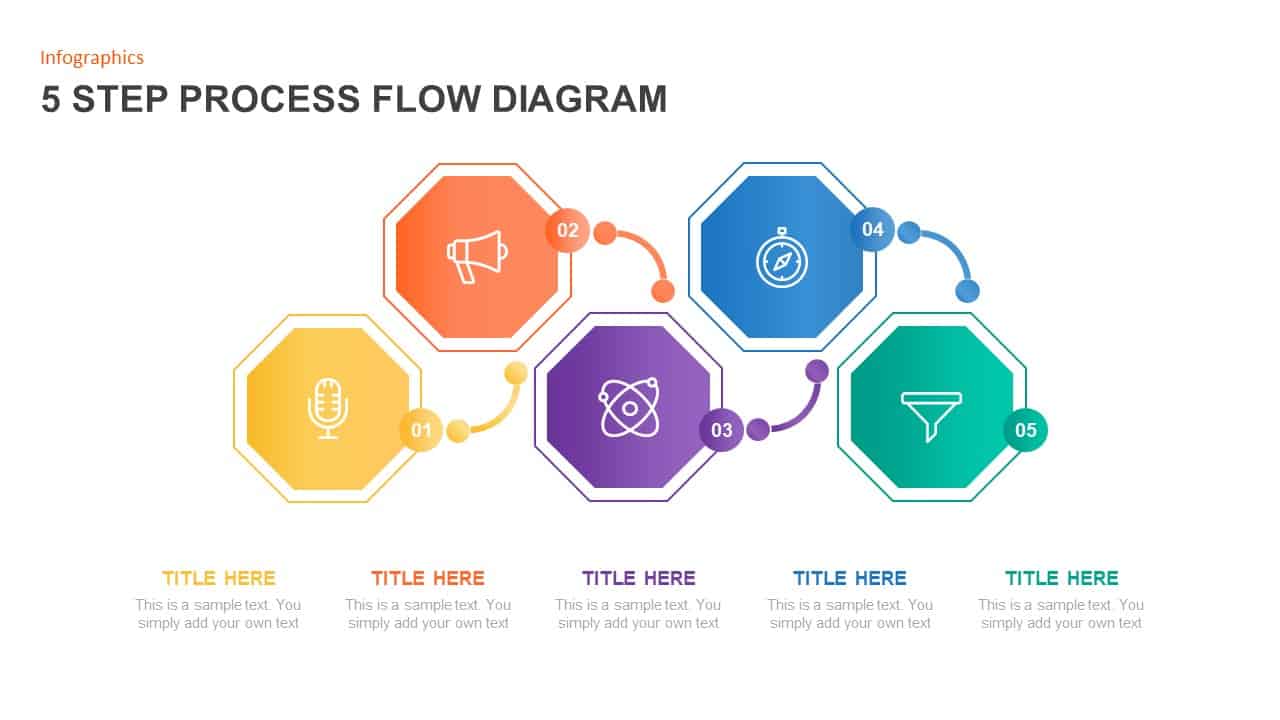
5 Step Process Flow Diagram for PowerPoint & Google Slides
Process

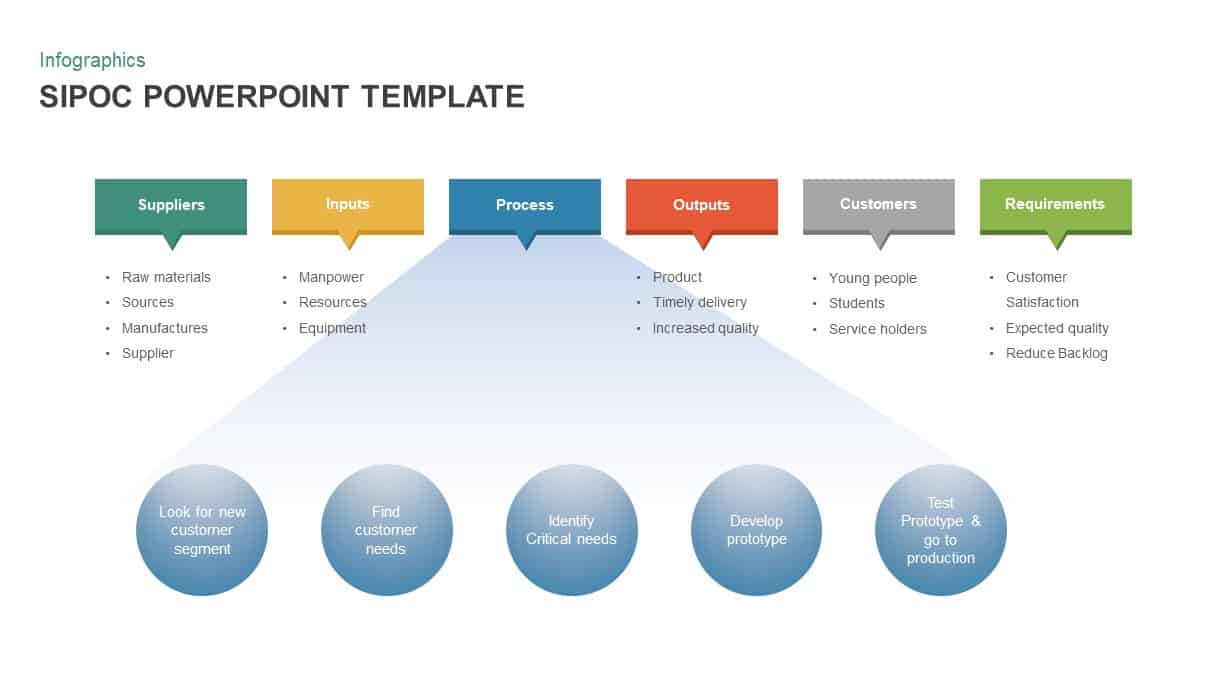
Color-Coded SIPOC Diagram with Process Flow for PowerPoint & Google Slides
Process
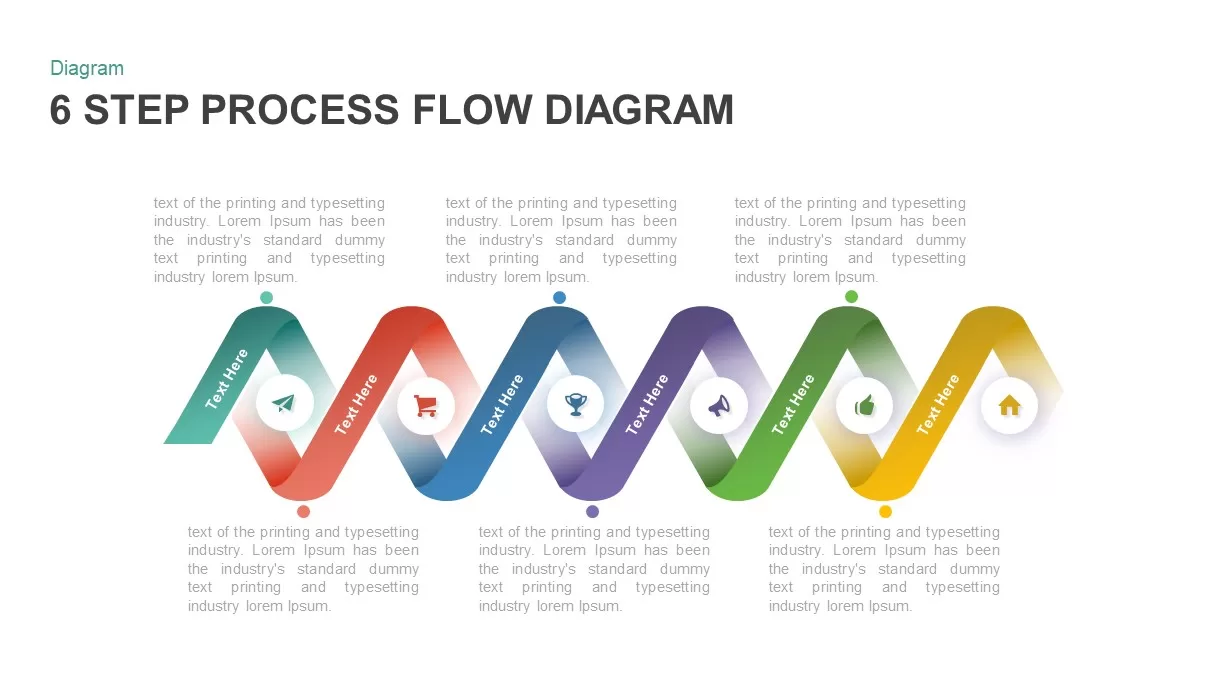
6 Step Process Flow Diagram for PowerPoint & Google Slides
Charts
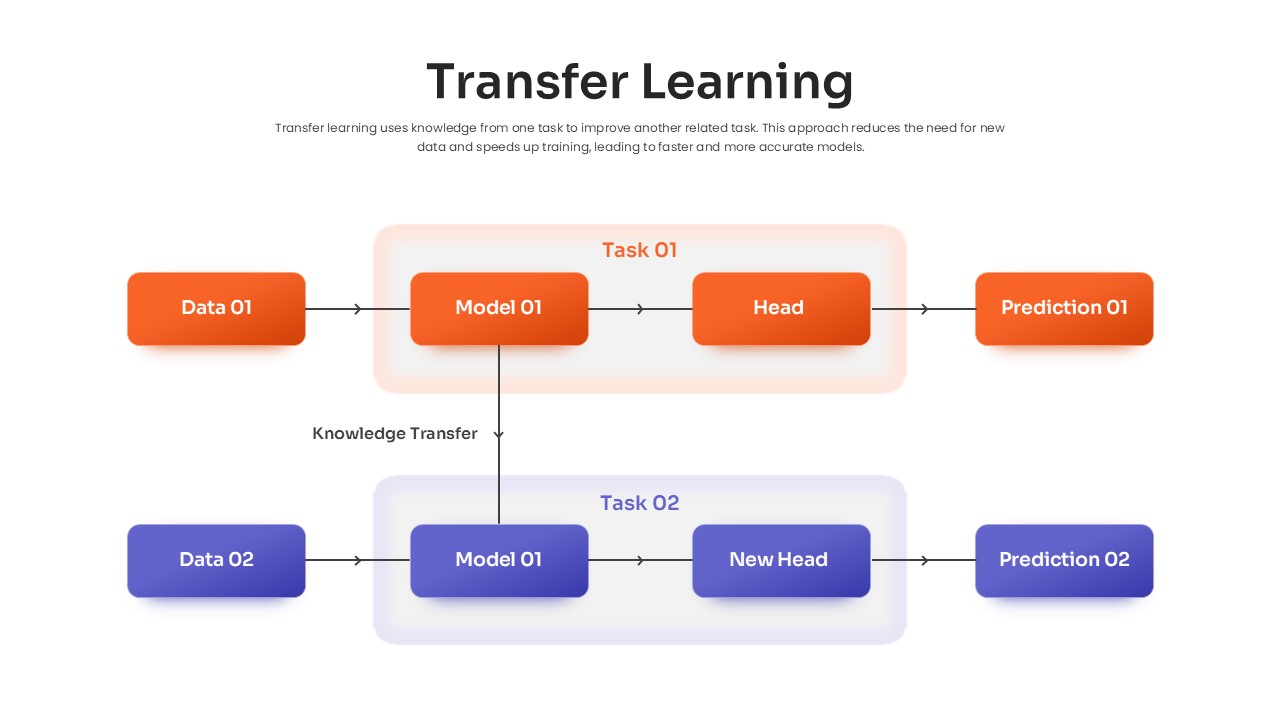
Transfer Learning Process template for PowerPoint & Google Slides
Technology
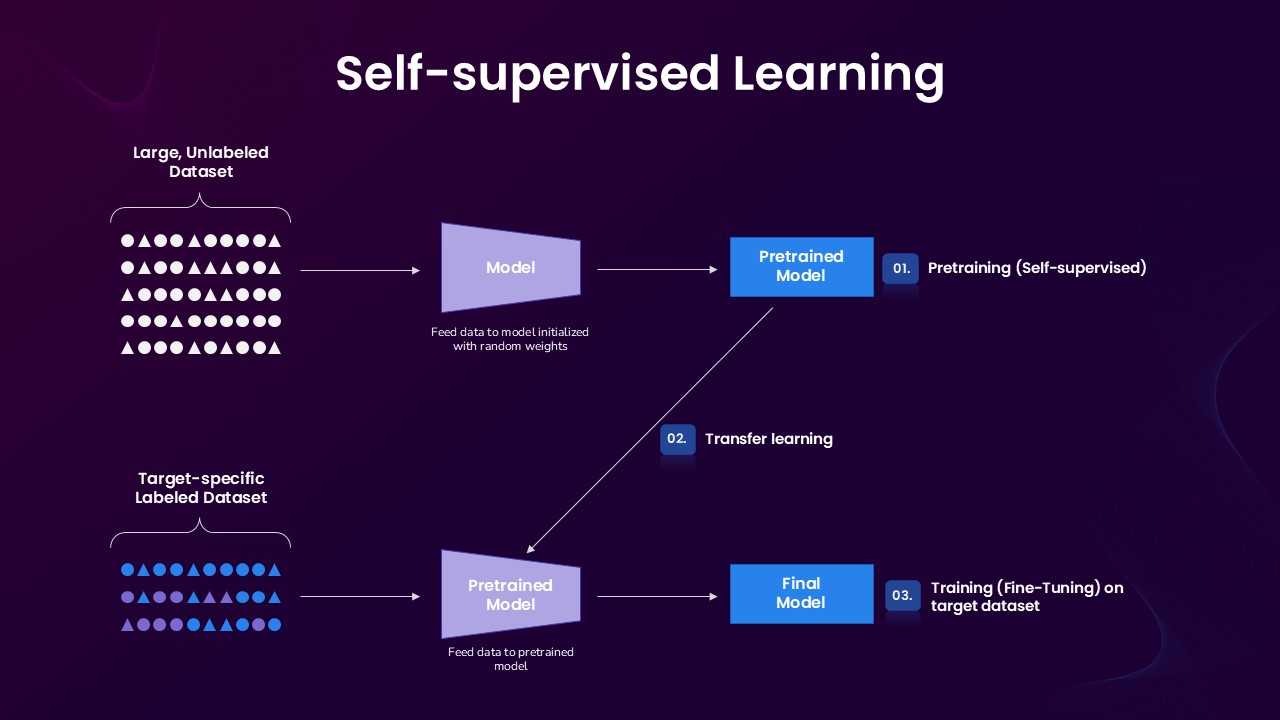
Self-supervised Learning Process template for PowerPoint & Google Slides
Technology
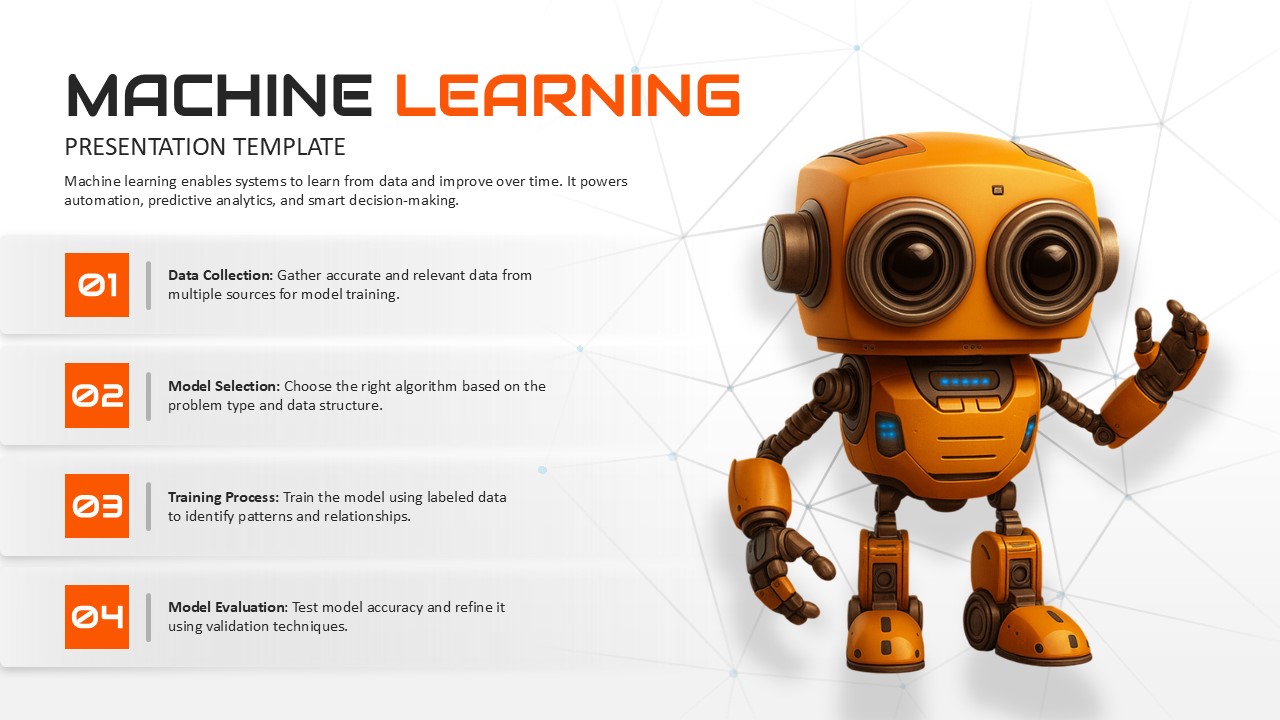
Machine Learning Four-Step Process Template for PowerPoint & Google Slides
Machine Learning
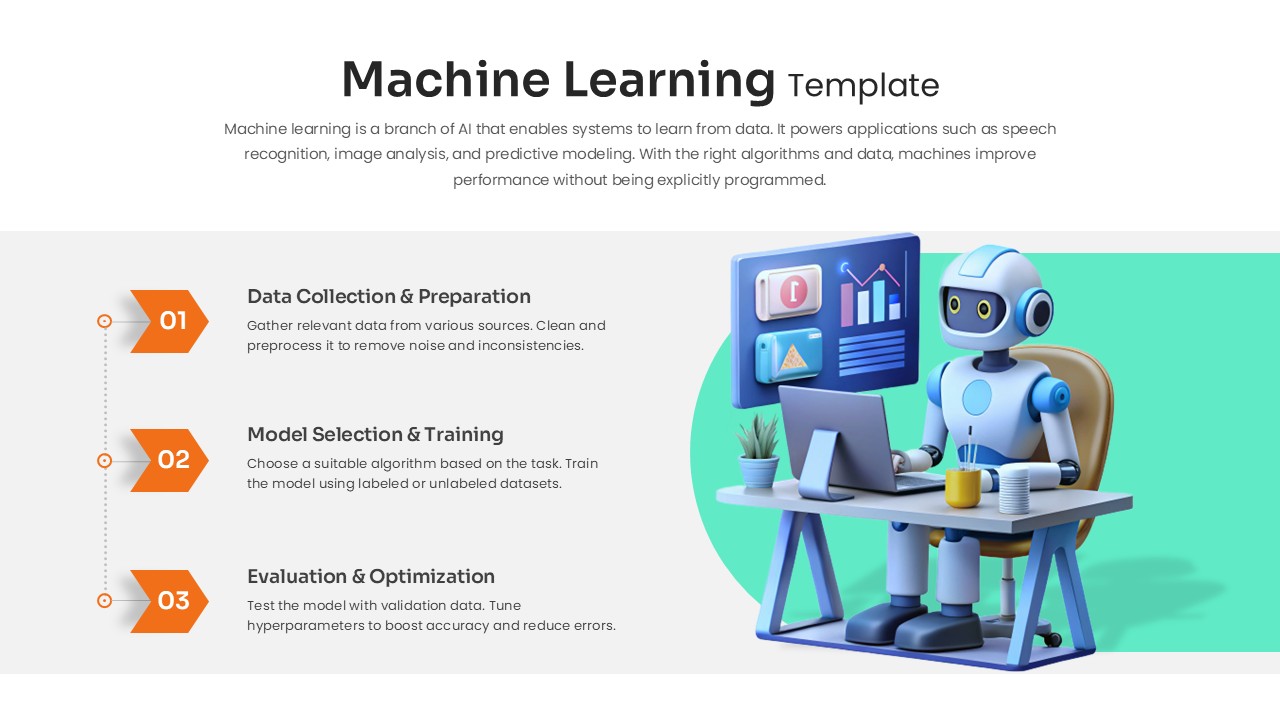
Machine Learning Three-Step Process Template for PowerPoint & Google Slides
Machine Learning
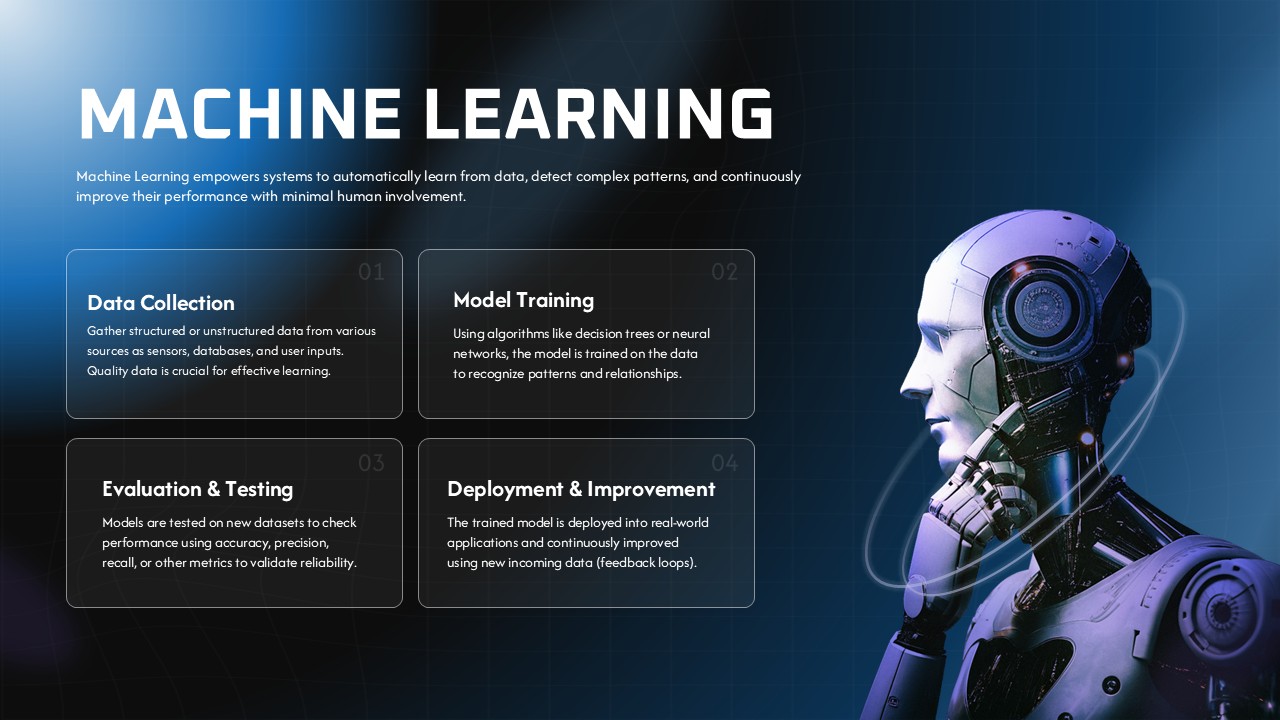
Machine Learning Process Template for PowerPoint & Google Slides
Machine Learning
4MAT Learning Cycle Circular Diagram Template for PowerPoint & Google Slides
Circular
Machine Learning Diagram Template for PowerPoint & Google Slides
Process
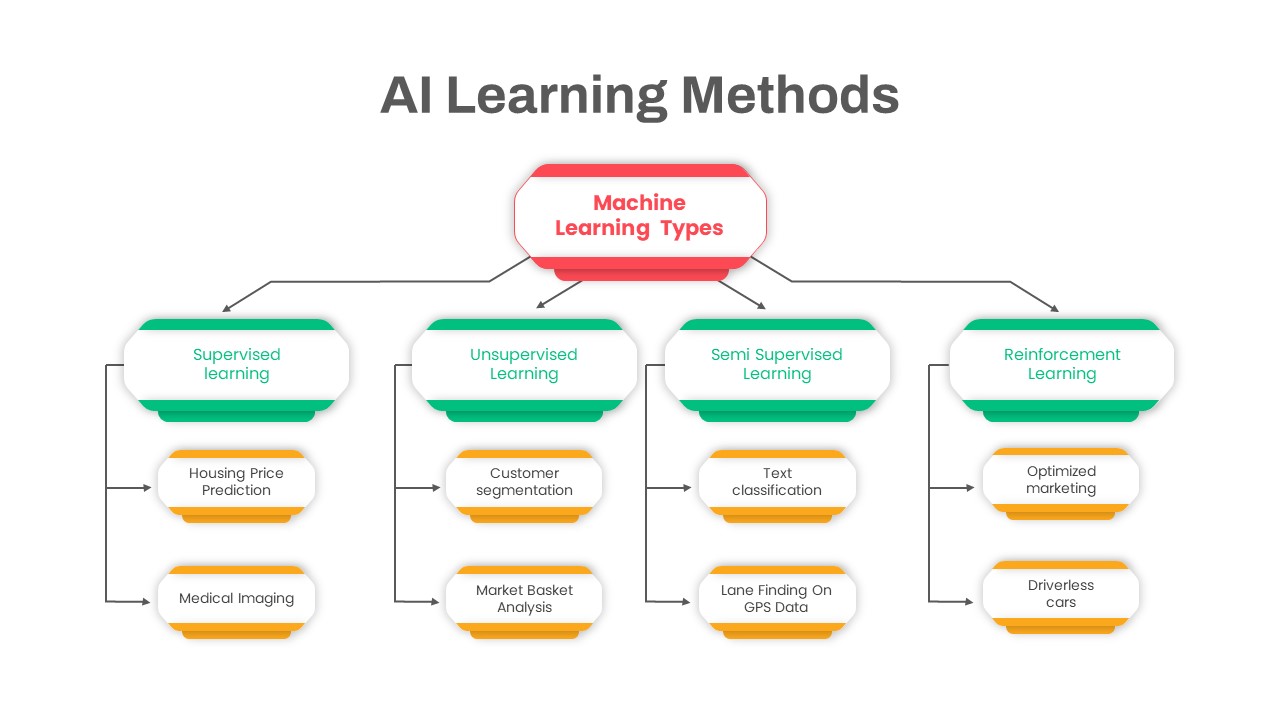
AI Learning Methods Flowchart Diagram Template for PowerPoint & Google Slides
Flow Charts
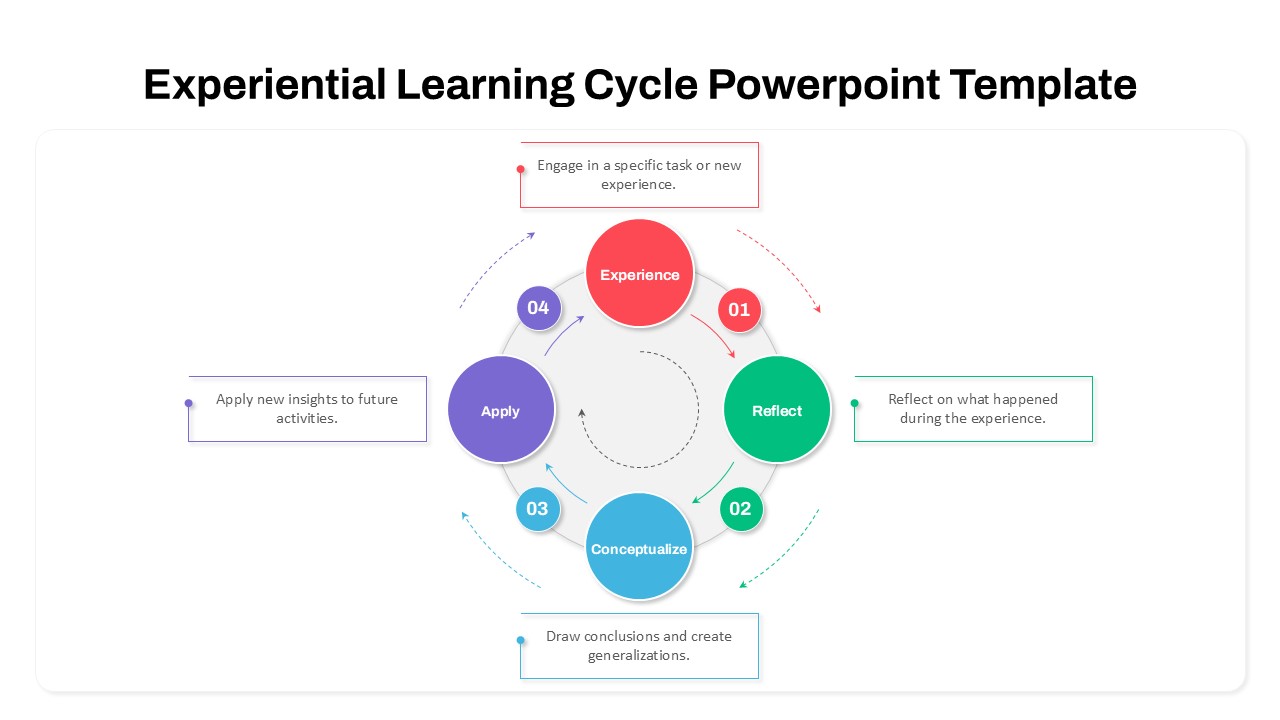
Experiential Learning Cycle Diagram Template for PowerPoint & Google Slides
Circular
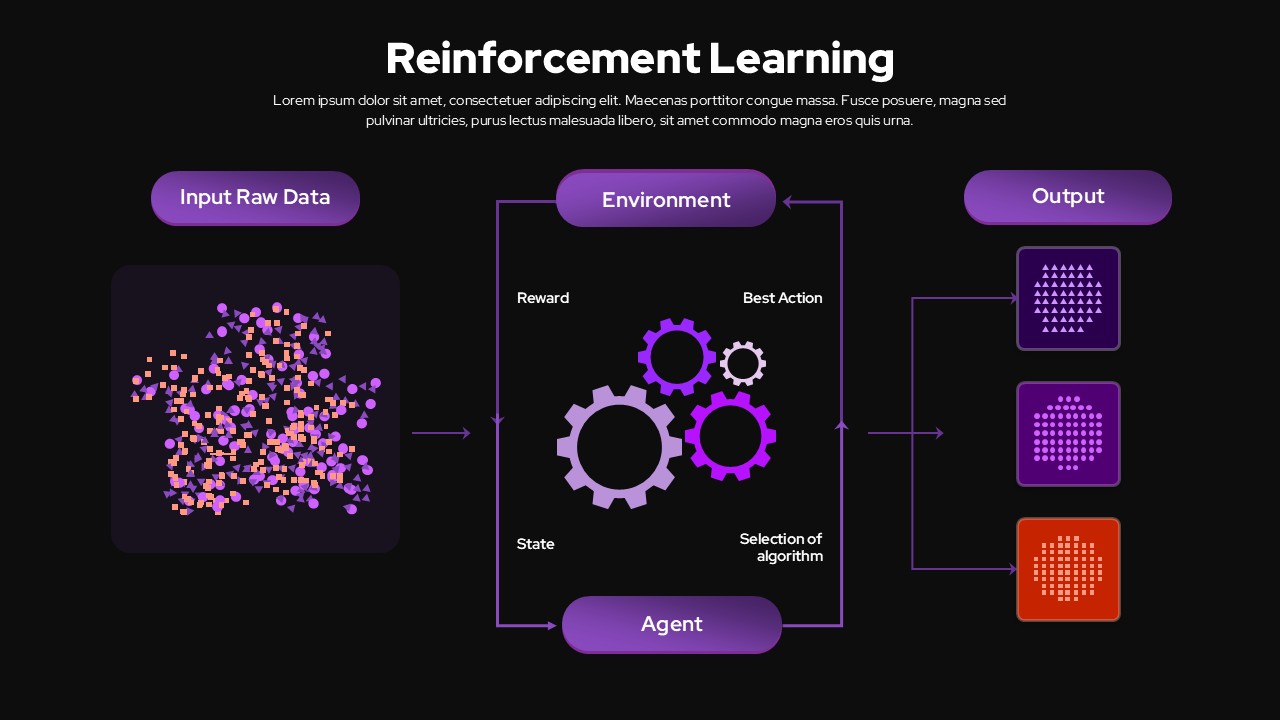
Reinforcement Learning Diagram Dark Template for PowerPoint & Google Slides
Machine Learning
5 Steps Linear Process Flow Diagram template
Process
Puzzle Pipe Infographics Process Flow Template for PowerPoint & Google Slides
Process
Five Stage Linear Process Flow Template for PowerPoint & Google Slides
Process
5-Stage Arrow Infographics Process Flow Template for PowerPoint & Google Slides
Arrow
Four-Stage Circular Process Flow Template for PowerPoint & Google Slides
Process
Five-Step Hexagonal Process Flow Template for PowerPoint & Google Slides
Process
5-Step Circular Gradient Process Flow Template for PowerPoint & Google Slides
Process
Modern 5-Step Process Flow Infographic Template for PowerPoint & Google Slides
Process
Five-Step Process Flow Infographic Template for PowerPoint & Google Slides
Process
Free Colorful Process Flow Infographics Template for PowerPoint & Google Slides
Process
Free
Process Flow Overview template for PowerPoint & Google Slides
Business
Colorful Process Flow Template for PowerPoint & Google Slides
Process
Colorful Process Flow Infographics Template for PowerPoint & Google Slides
Process
Process Flow Template for PowerPoint & Google Slides
Process
Free
Process Flow Template for PowerPoint & Google Slides
Process
Free
4 stage Process Flow template for PowerPoint & Google Slides
Process
Curved Arrow Process Flow Infographic Template for PowerPoint & Google Slides
Process
Curved Arrow Process Flow template for PowerPoint & Google Slides
Process
Circular Arrows Process Flow template for PowerPoint & Google Slides
Process
Curved Arrow Process Flow template for PowerPoint & Google Slides
Process
Circle Arrow Process Flow template for PowerPoint & Google Slides
Process
Animated Accordion Process Flow Template for PowerPoint & Google Slides
Process
Conveyor Belt Infographic Process Flow Template for PowerPoint & Google Slides
Process
Conveyor Belt Sequential Process Flow Template for PowerPoint & Google Slides
Process
Comprehensive Hiring Process Flow Chart Template for PowerPoint & Google Slides
Flow Charts
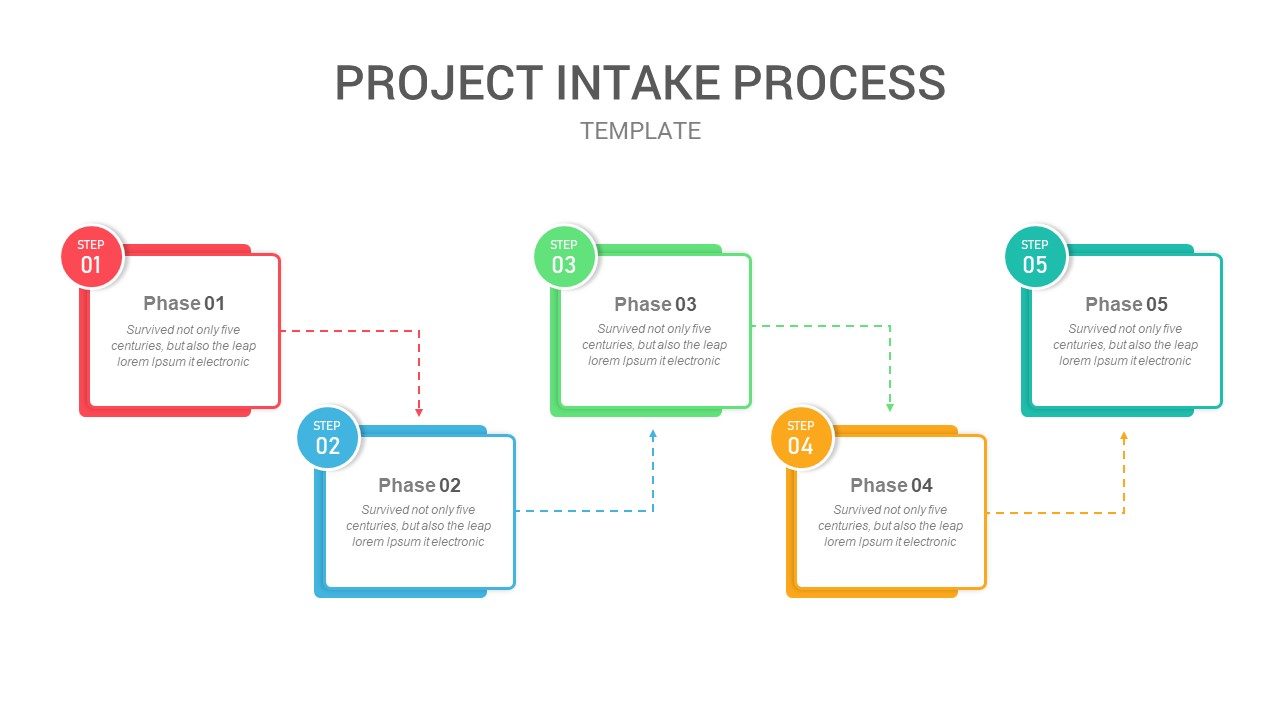
Five-Phase Project Intake Process Flow Template for PowerPoint & Google Slides
Process
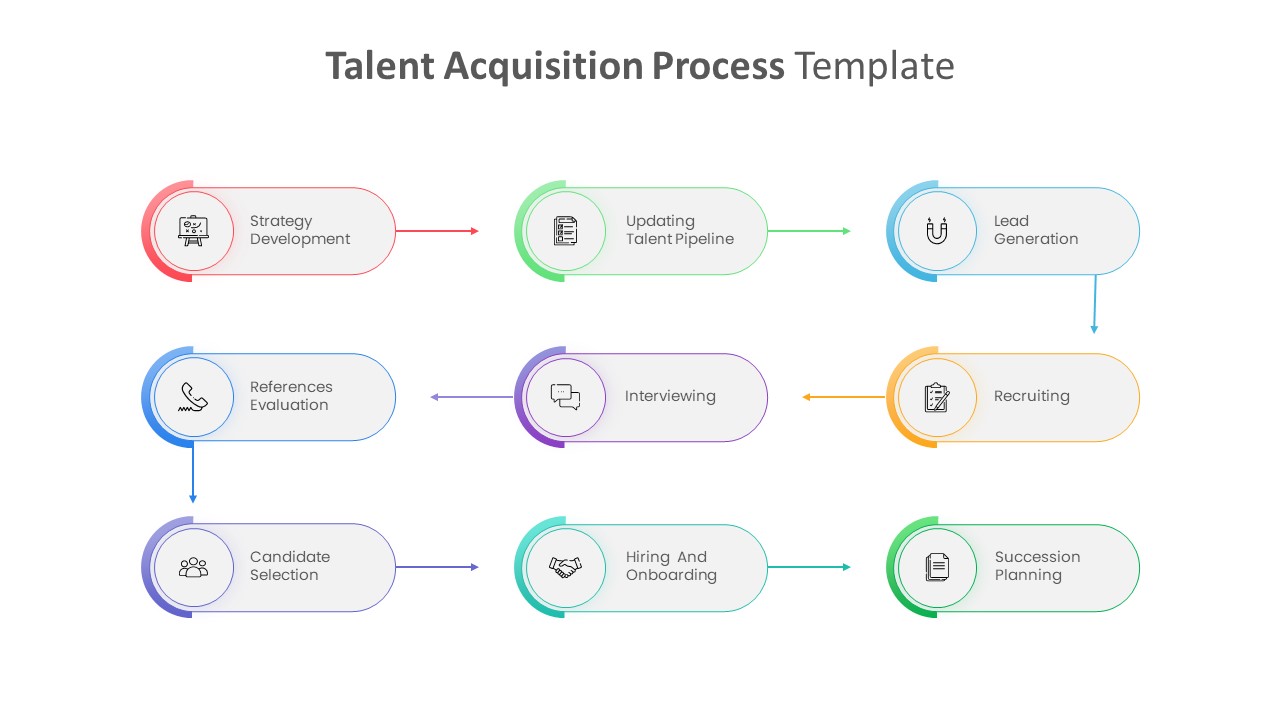
Talent Acquisition Process Flow Template for PowerPoint & Google Slides
Recruitment
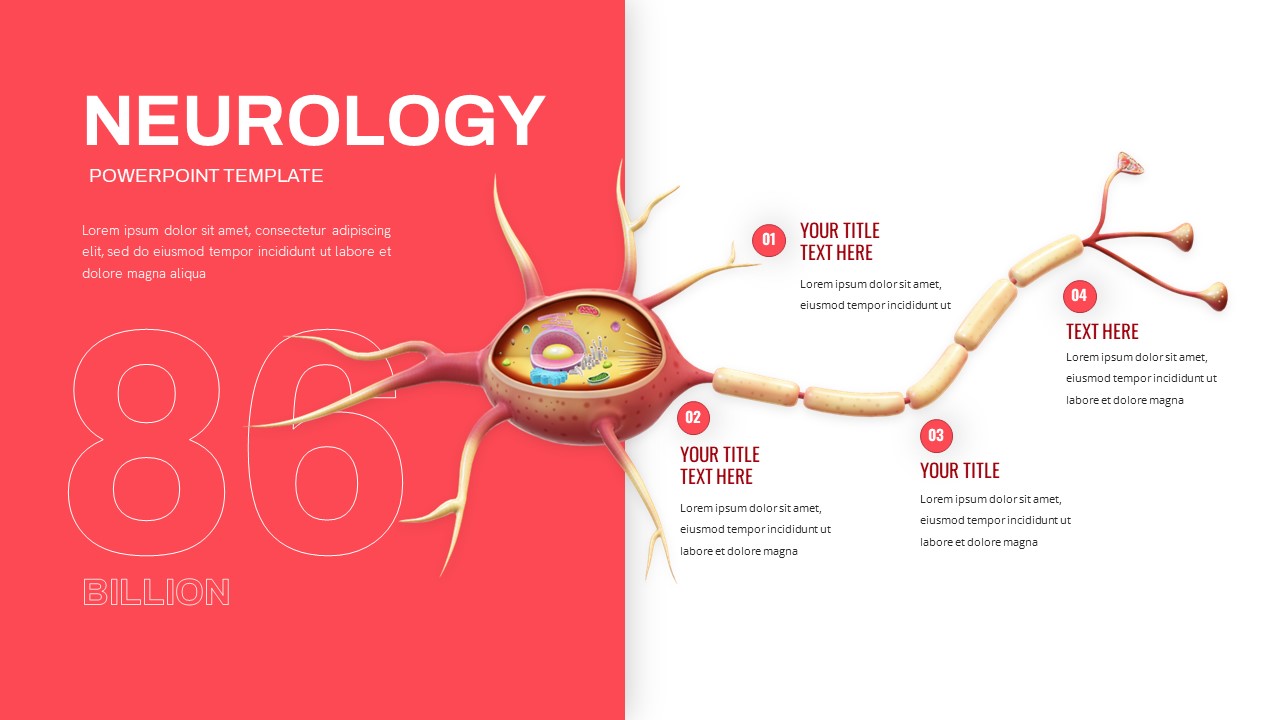
Neurology Neuron Structure Process Flow Template for PowerPoint & Google Slides
Health
Animated Process Flow Chart Template for PowerPoint & Google Slides
Infographics
Chevron Process Flow Sequence Slide Template for PowerPoint & Google Slides
Arrow
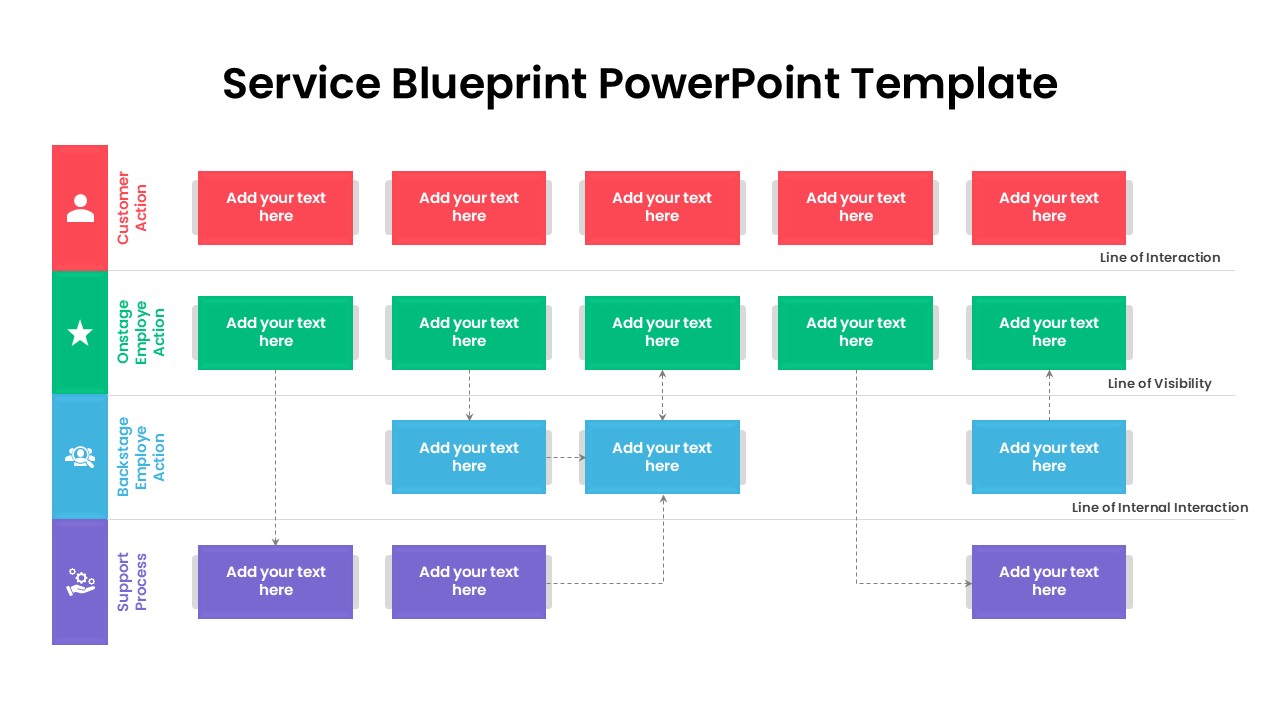
Service Blueprint Process Flow Template for PowerPoint & Google Slides
Process
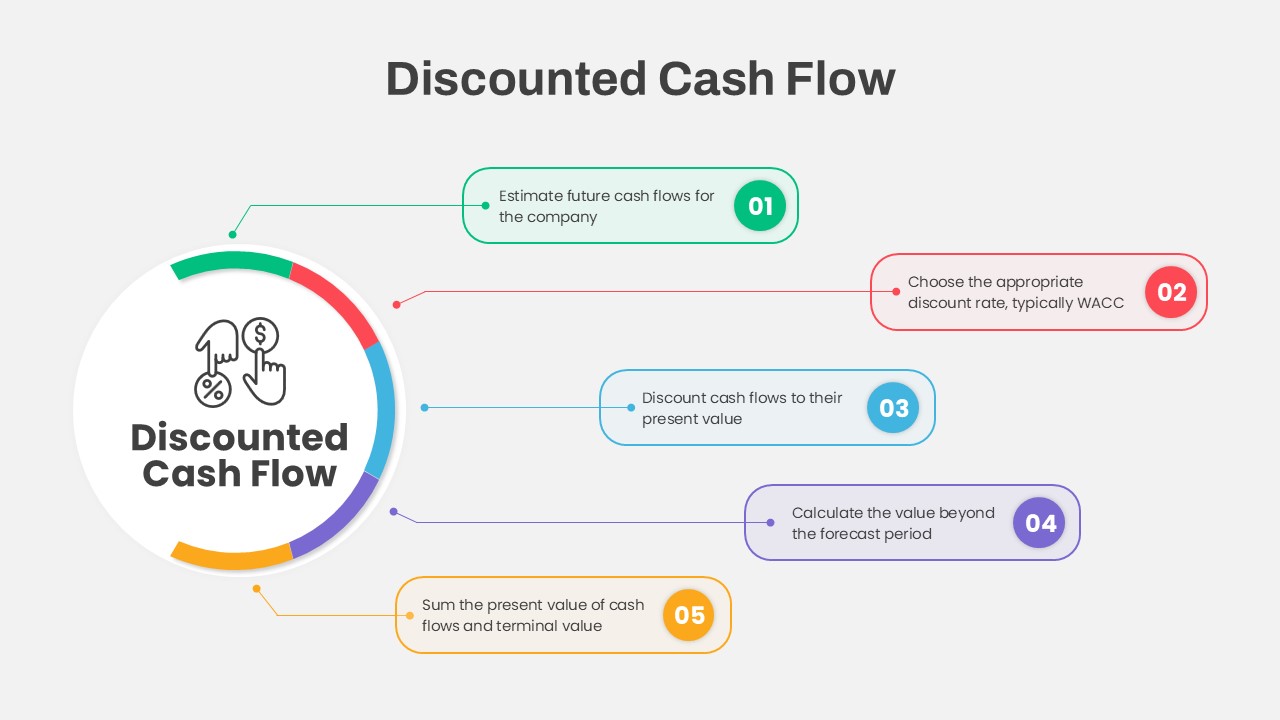
Discounted Cash Flow Five-Step Process Template for PowerPoint & Google Slides
Process
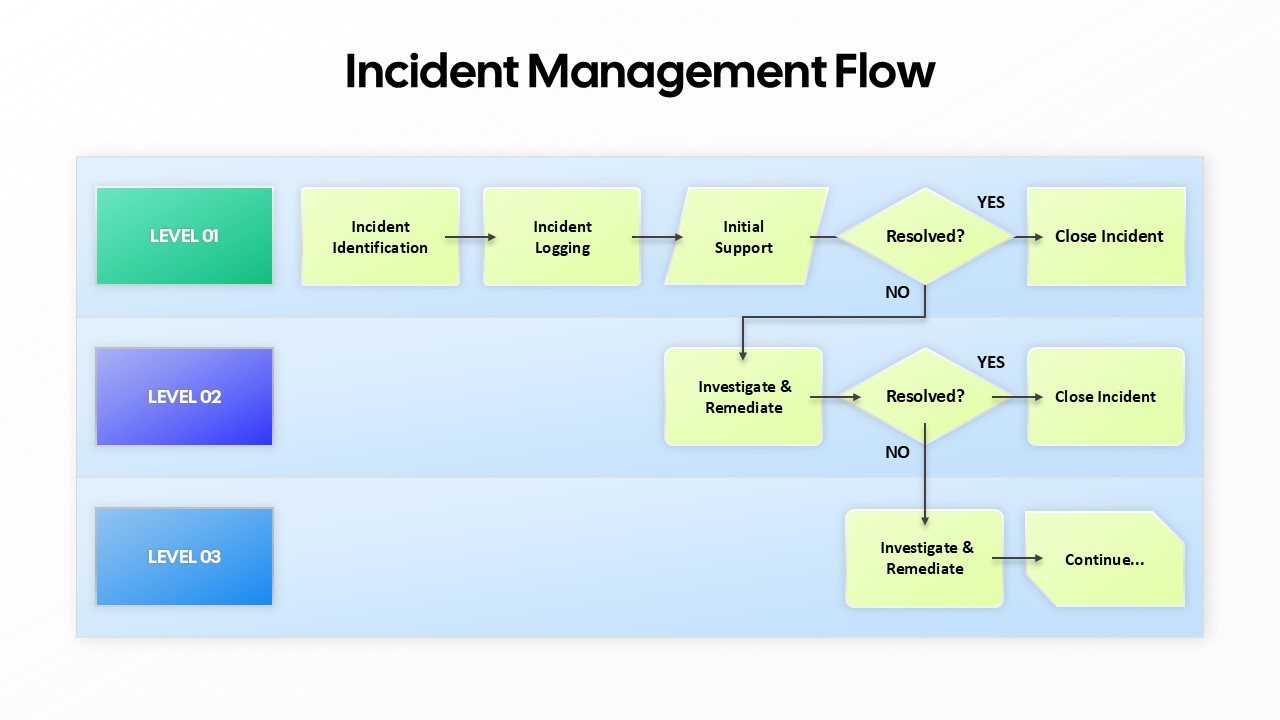
Incident Management Flow Process template for PowerPoint & Google Slides
Flow Charts
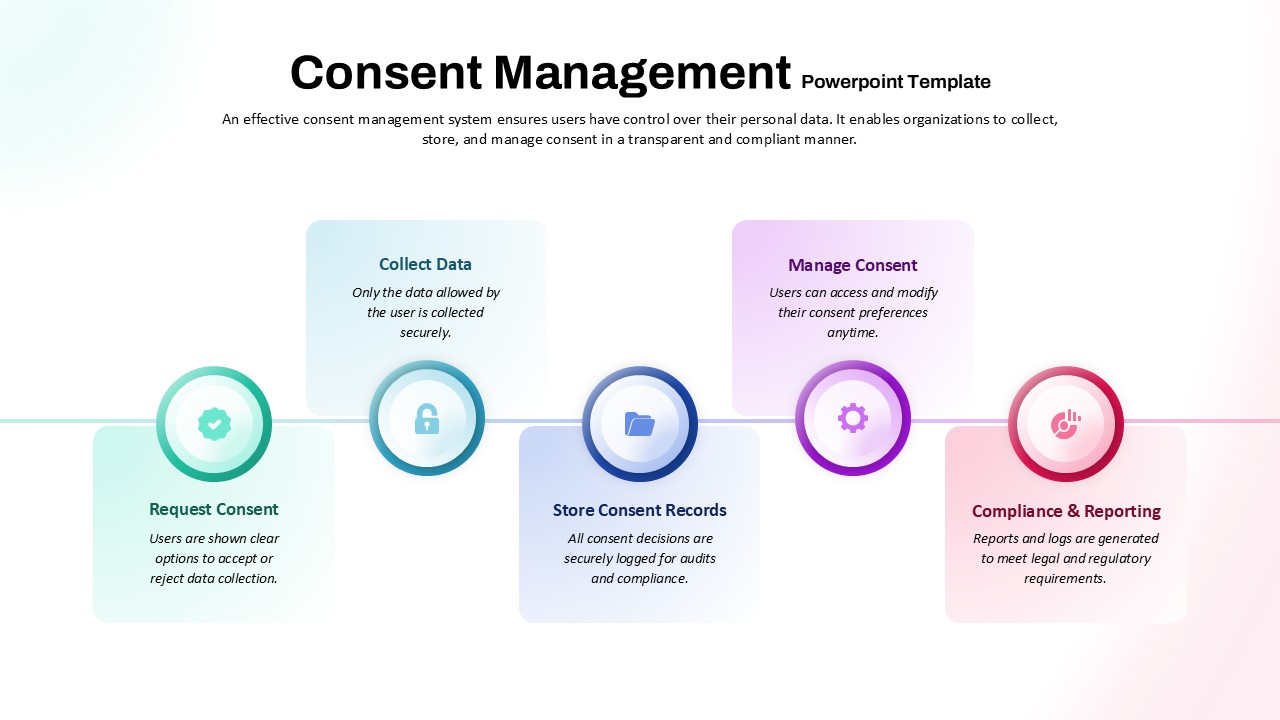
Consent Management System Process Flow Template for PowerPoint & Google Slides
Process