Budget Forecast Dashboard & Donut Charts Template for PowerPoint & Google Slides

Description
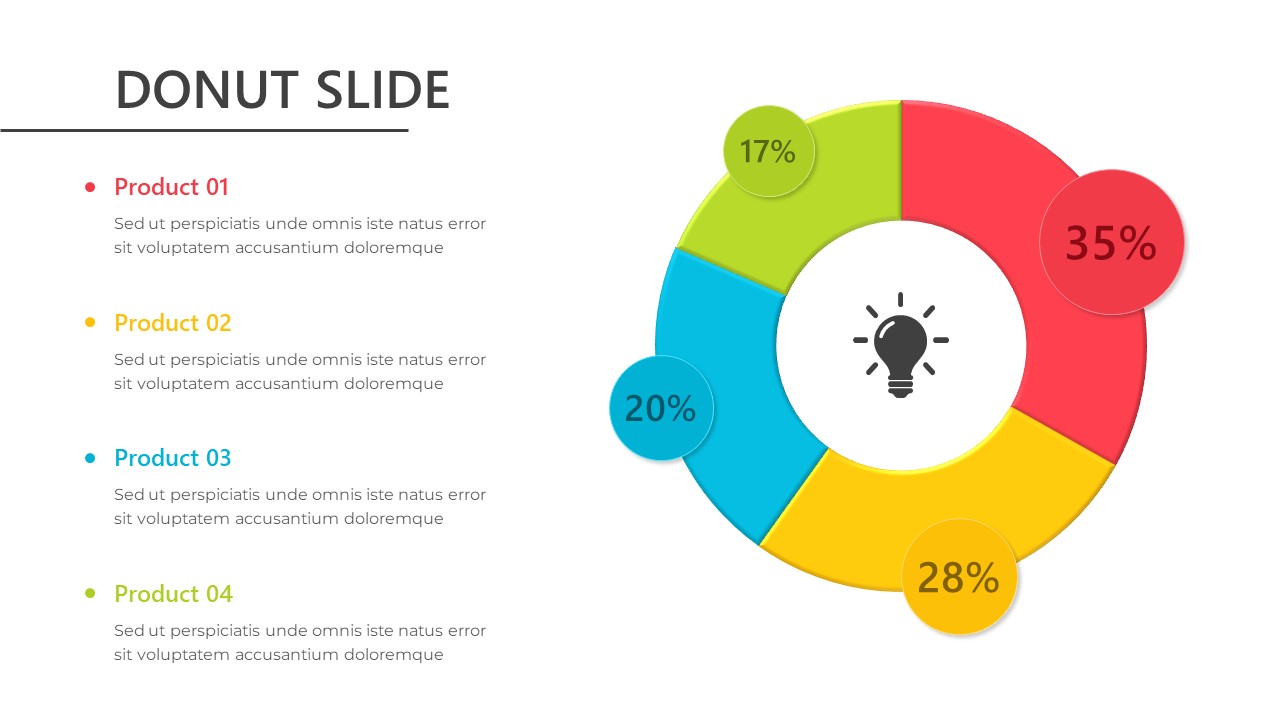
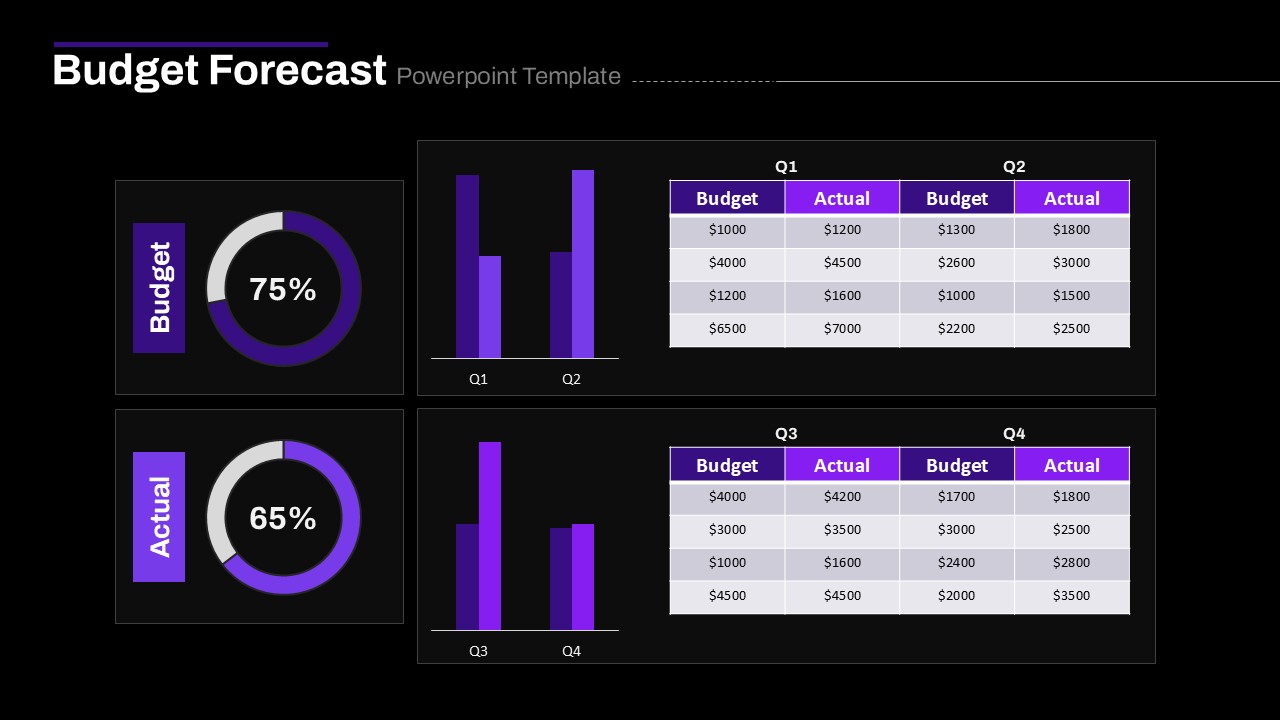
This comprehensive Budget Forecast Dashboard Template features a dual donut gauge layout on the left side, displaying budgeted vs. actual percentages with bold numeric labels, accompanied by intuitive legends. On the right, side-by-side vertical bar column charts illustrate quarter-by-quarter comparisons for Q1–Q4, using contrasting violet and purple hues to distinguish planned budgets from realized expenditures. Beneath each chart, editable data tables provide structured rows and columns for inputting budget and actual figures, complete with color-coded headers for easy scanning. The clean, minimalist design—with crisp lines, ample white space, and bold purple accents—ensures legibility and cohesive branding on both light and dark backgrounds. Built on master slides, the template offers seamless customization of chart styles, color themes, fonts, and data placeholders, enabling rapid updates to reflect evolving financial scenarios.
Ideal for finance teams, project managers, CFOs, and business analysts, this slide simplifies quarterly budget reviews, forecasting sessions, and stakeholder presentations by consolidating critical metrics into a single view. Presenters can easily adjust percentage values, overwrite budget figures, or swap color accents with a few clicks, thanks to intuitive placeholders and defined theme settings. This slide also integrates seamlessly into broader decks, enhancing financial reports, executive summaries, or investor pitch books. Beyond budget forecasting, repurpose the framework for KPI reporting, performance tracking, sales targets, and operational dashboards. The versatile design translates complex numeric comparisons into accessible visual insights, fostering data-driven discussions and strategic decision-making. Fully compatible with both PowerPoint and Google Slides, this asset maintains consistent formatting across devices and platforms, eliminating version-control headaches and ensuring professional polish in every presentation.
Who is it for
Finance teams, CFOs, accountants, project managers, and business analysts will benefit from this template when presenting quarterly forecasts, budget reviews, or stakeholder updates.
Other Uses
Repurpose this slide for KPI tracking, performance dashboards, sales target comparisons, operational reporting, investor briefings, and executive summaries to visualize ratios and tables in one cohesive view.
Login to download this file

Item ID
SB04684
Related Templates

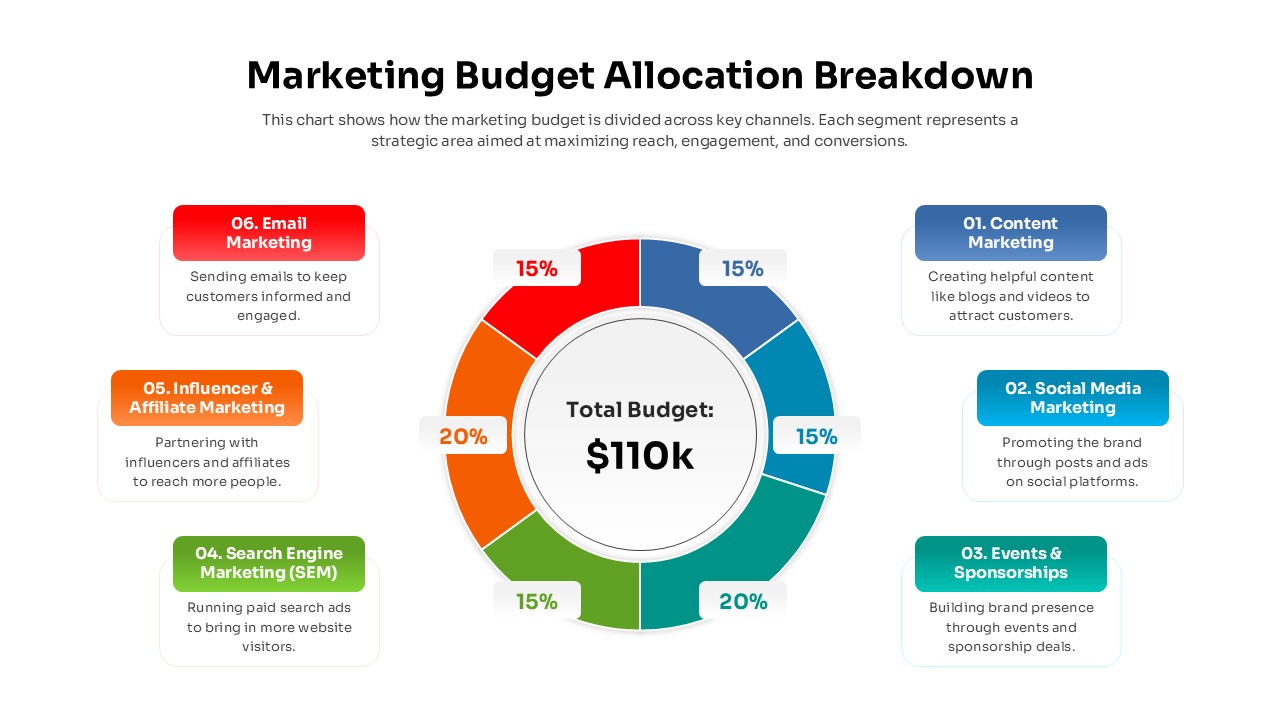
Marketing Budget Allocation Donut Chart Template for PowerPoint & Google Slides
Marketing
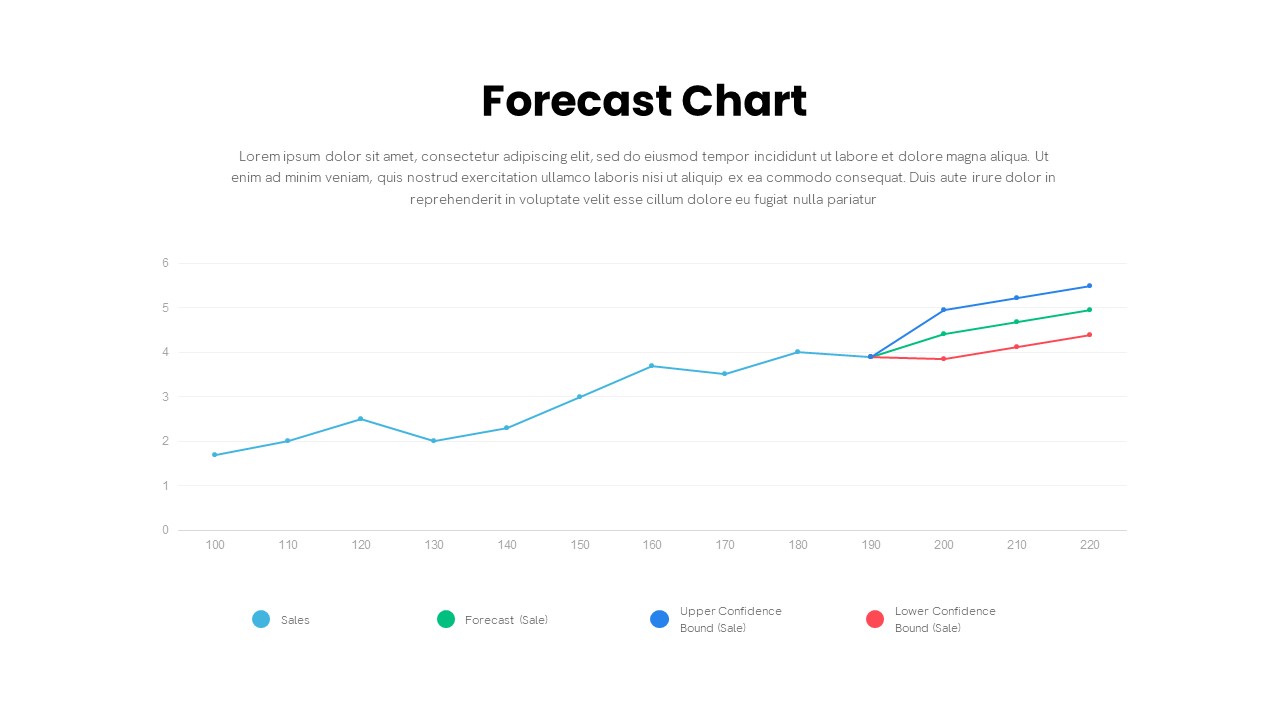
Forecast Chart with Confidence Bounds Template for PowerPoint & Google Slides
Comparison Chart
Project Progress Dashboard Pie Charts Template for PowerPoint & Google Slides
Project
Donut Split Analysis template for PowerPoint & Google Slides
Pie/Donut
Donut Chart template for PowerPoint & Google Slides
Pie/Donut
Donut Chart template for PowerPoint & Google Slides
Pie/Donut
Donut Chart Split Template for PowerPoint & Google Slides
Charts
Success Key Diagram with Donut Chart Template for PowerPoint & Google Slides
Pie/Donut

Eight Section Donut Chart Infographic Template for PowerPoint & Google Slides
Pie/Donut
30-60-90 Day Donut Chart Plan Infographic Template for PowerPoint & Google Slides
Timeline
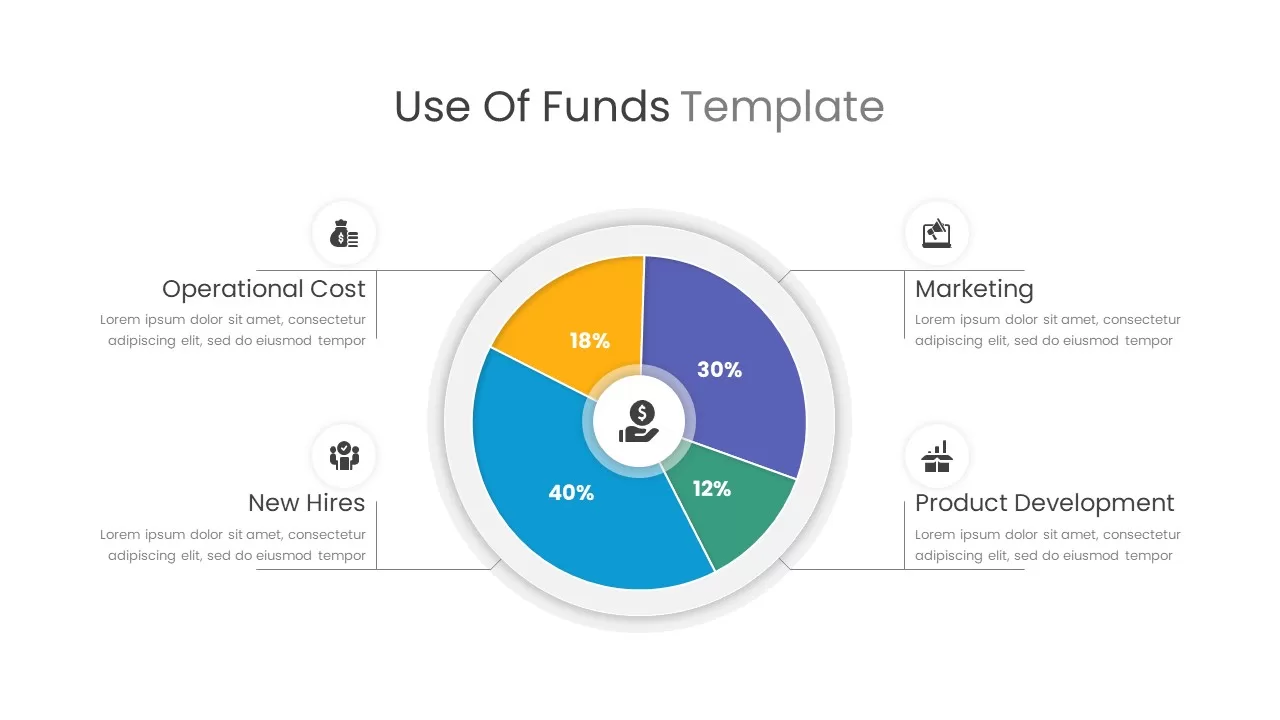
Use of Funds Donut Chart Infographic Template for PowerPoint & Google Slides
Circular
Cost Reduction Strategy Donut Chart Template for PowerPoint & Google Slides
Pie/Donut
Donut Chart Data Breakdown template for PowerPoint & Google Slides
Pie/Donut
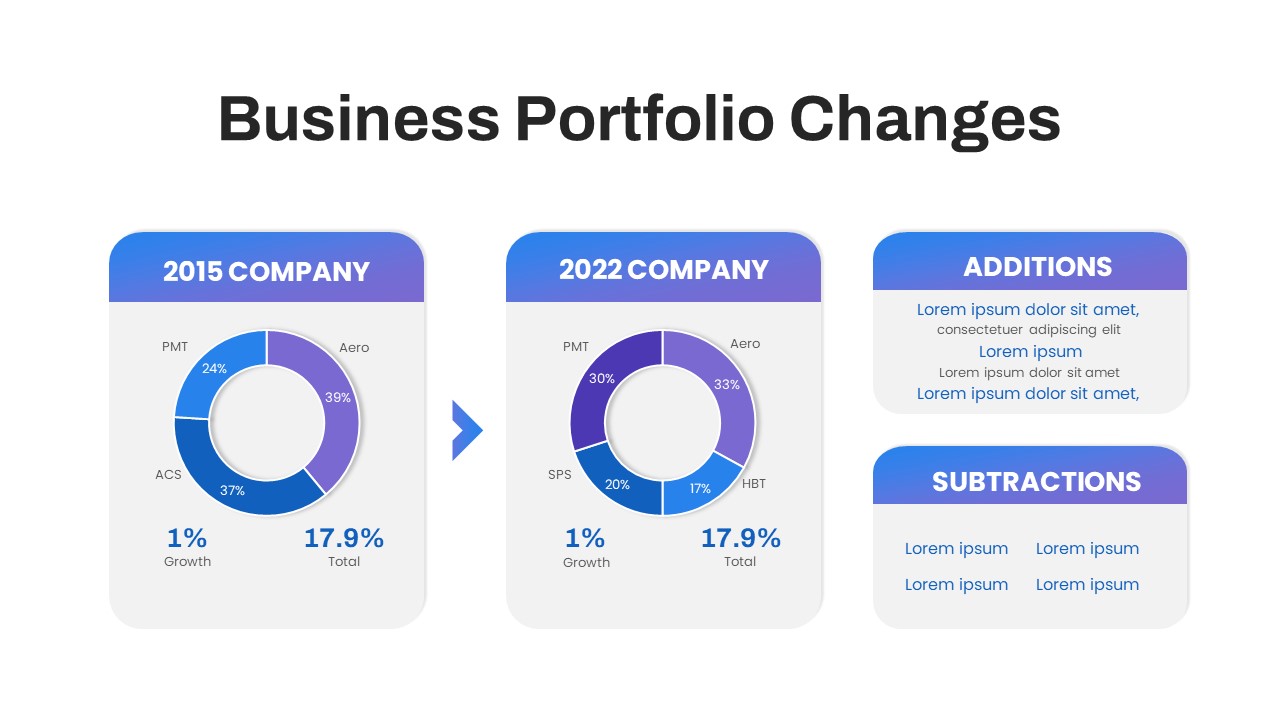
Business Portfolio Changes Donut Chart Template for PowerPoint & Google Slides
Pie/Donut
Technical Skills Donut Chart Overview Template for PowerPoint & Google Slides
HR
Three Segment Donut Chart KPI Infographic Template for PowerPoint & Google Slides
Pie/Donut
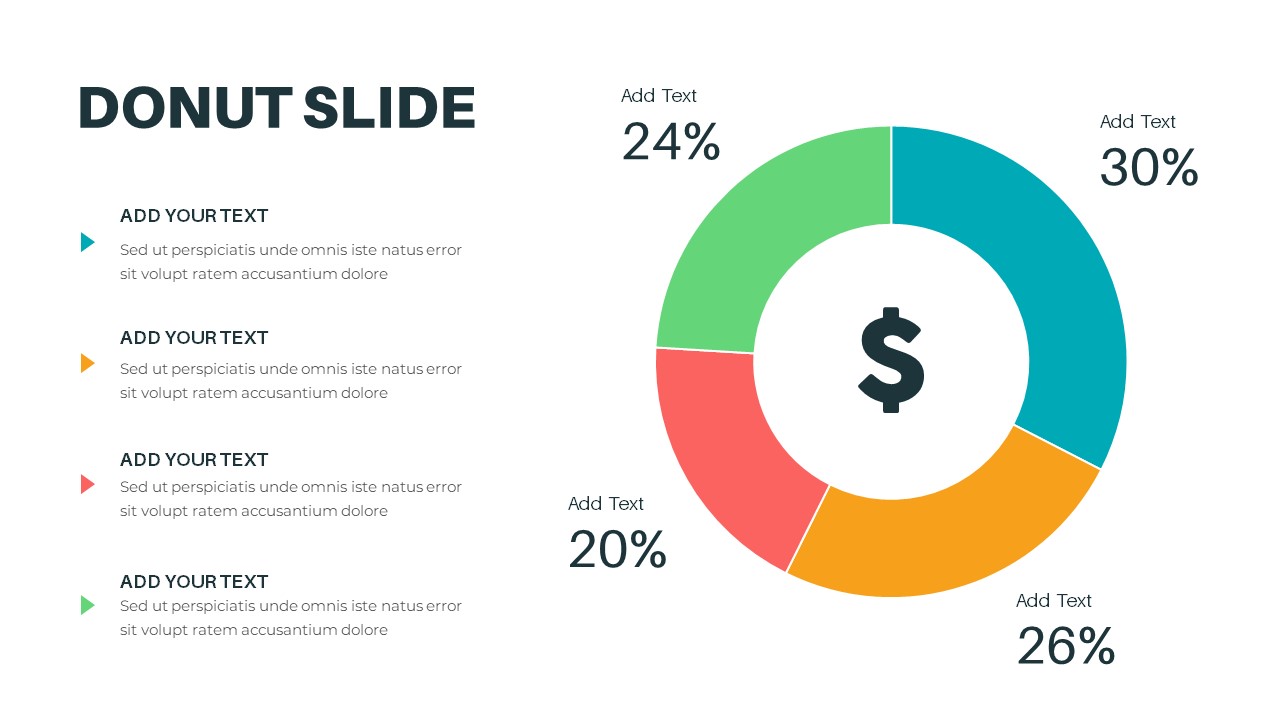
Donut Chart for PowerPoint & Google Slides
Pie/Donut
Donut Chart for PowerPoint & Google Slides
Pie/Donut
Donut Chart for PowerPoint & Google Slides
Pie/Donut
Donut Chart Presentation for PowerPoint & Google Slides
Pie/Donut
Social Media Market Share Pie Charts Template for PowerPoint & Google Slides
Pie/Donut
Dynamic Statistics & Progress Charts Template for PowerPoint & Google Slides
Pie/Donut
Free Research Poster with Charts Template for PowerPoint & Google Slides
Pie/Donut
Free

Free Comprehensive Charts & Graphs Template for PowerPoint & Google Slides
Charts
Free

Free Charts & Graphs Presentation Deck Template for PowerPoint & Google Slides
Pitch Deck
Free
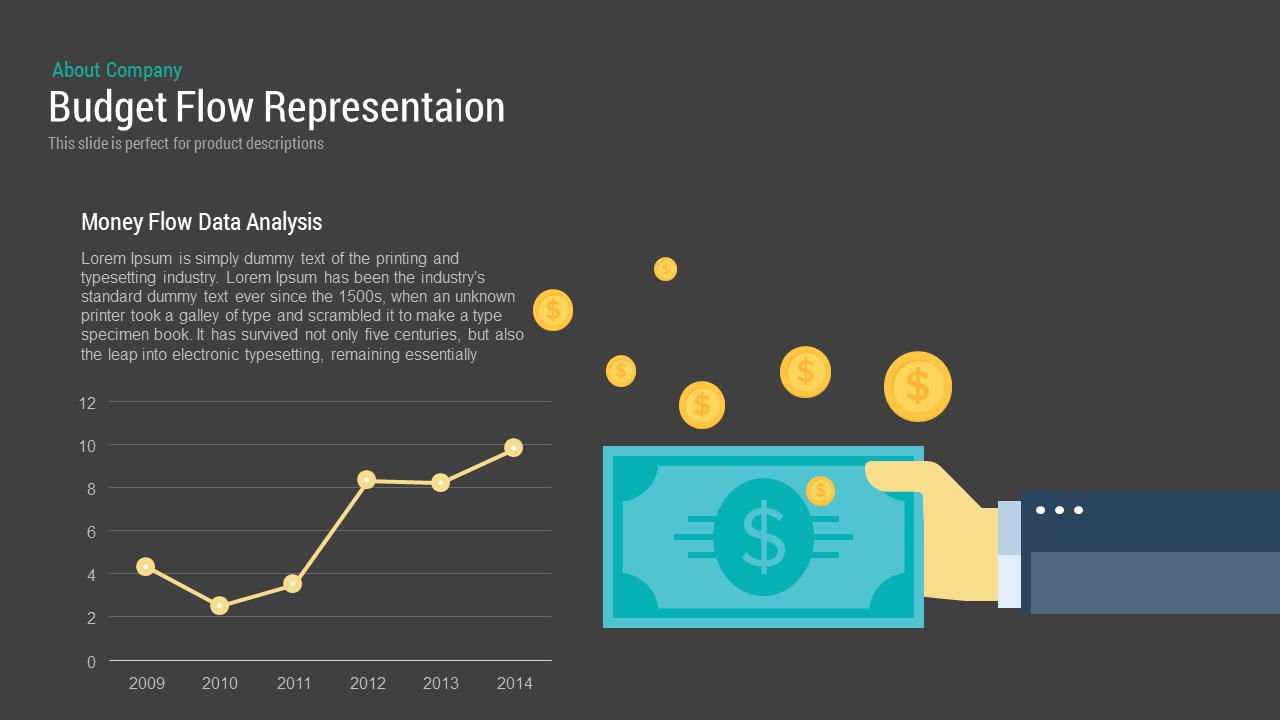
Budget Flow Representation template for PowerPoint & Google Slides
Process
Sales vs Budget Performance Chart Template for PowerPoint & Google Slides
Bar/Column
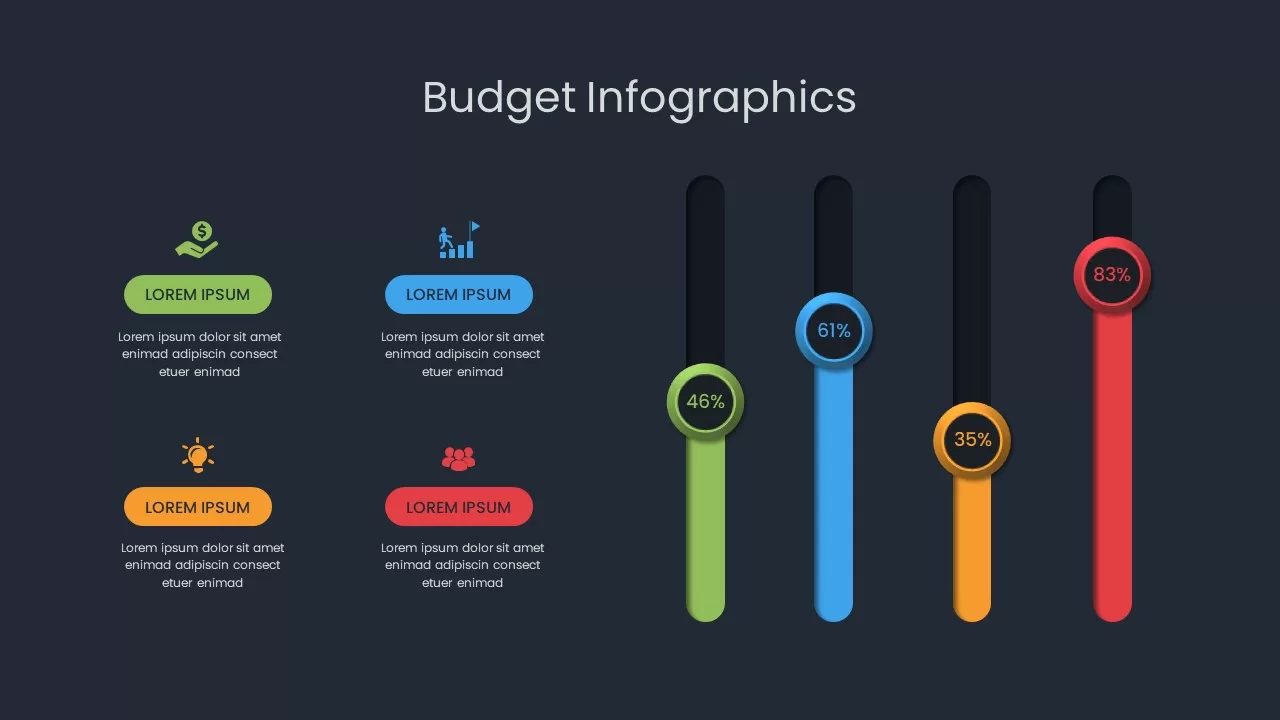
Budget Infographic & Expense Tracker Template for PowerPoint & Google Slides
Finance
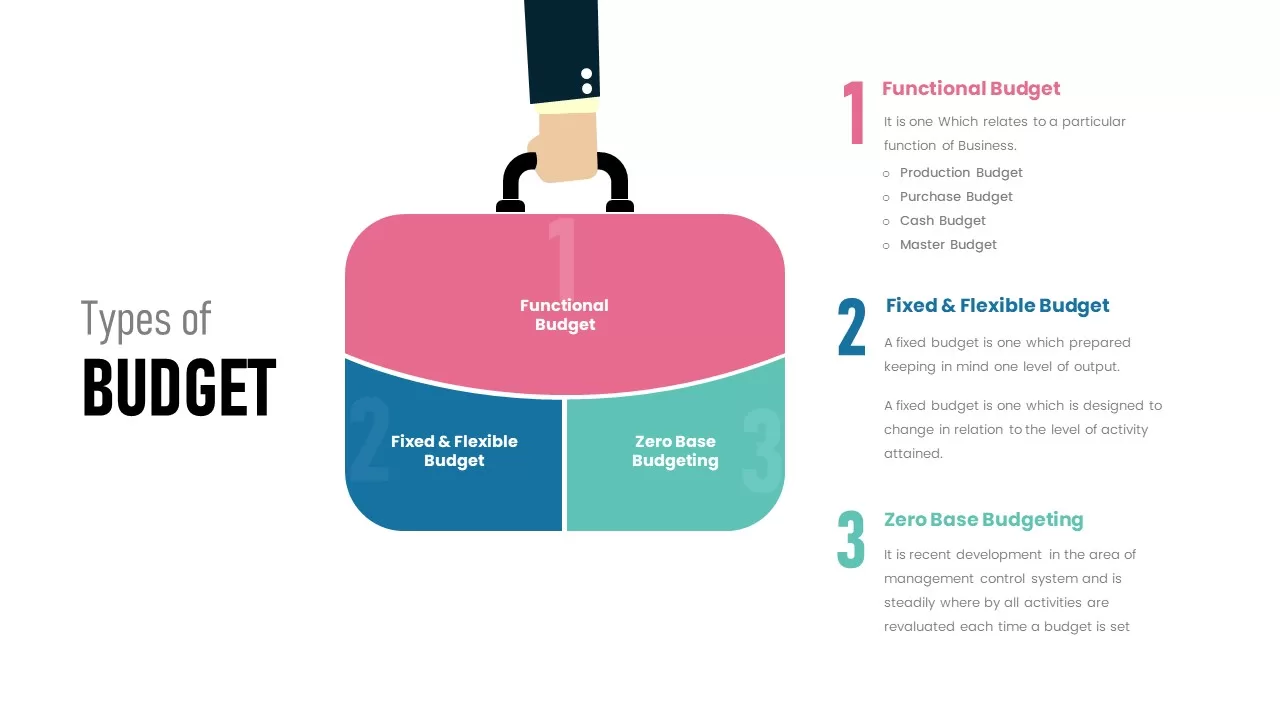
Types of Budget Infographic Pack Template for PowerPoint & Google Slides
Comparison
Engaging Dark Blue Budget Presentation Template for PowerPoint & Google Slides
Pitch Deck
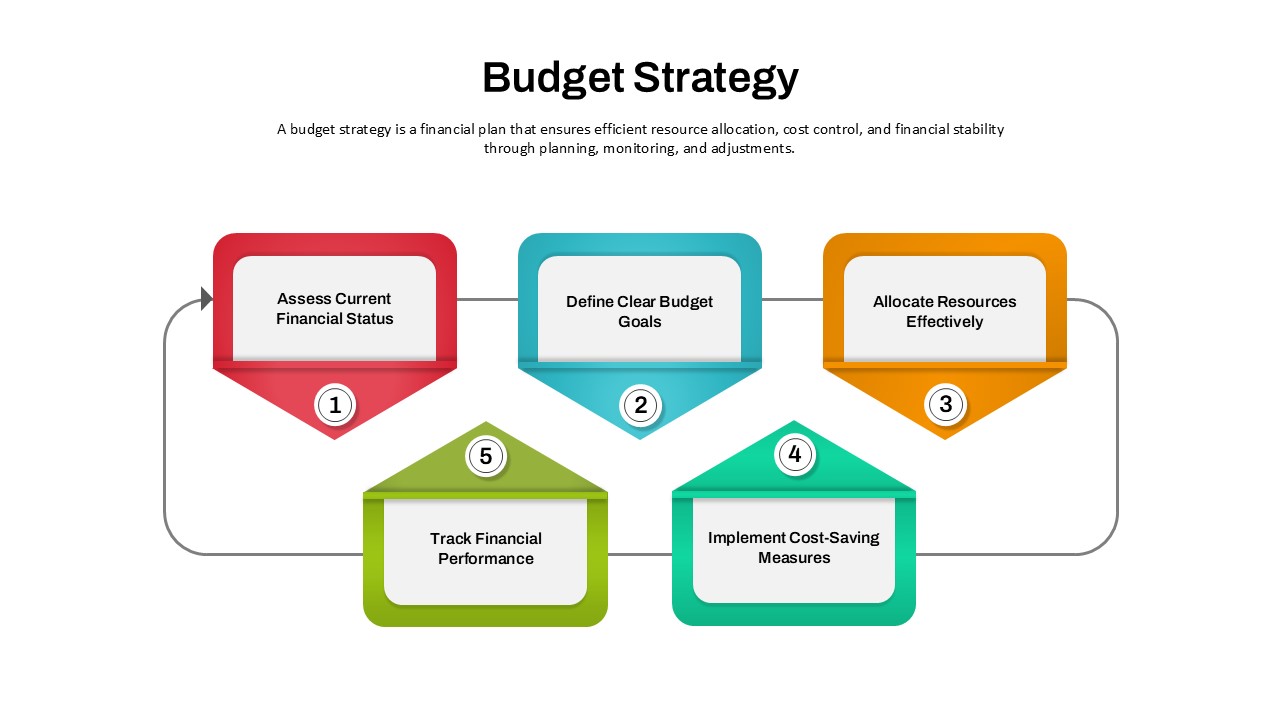
Budget Strategy Five-Step Process Template for PowerPoint & Google Slides
Finance
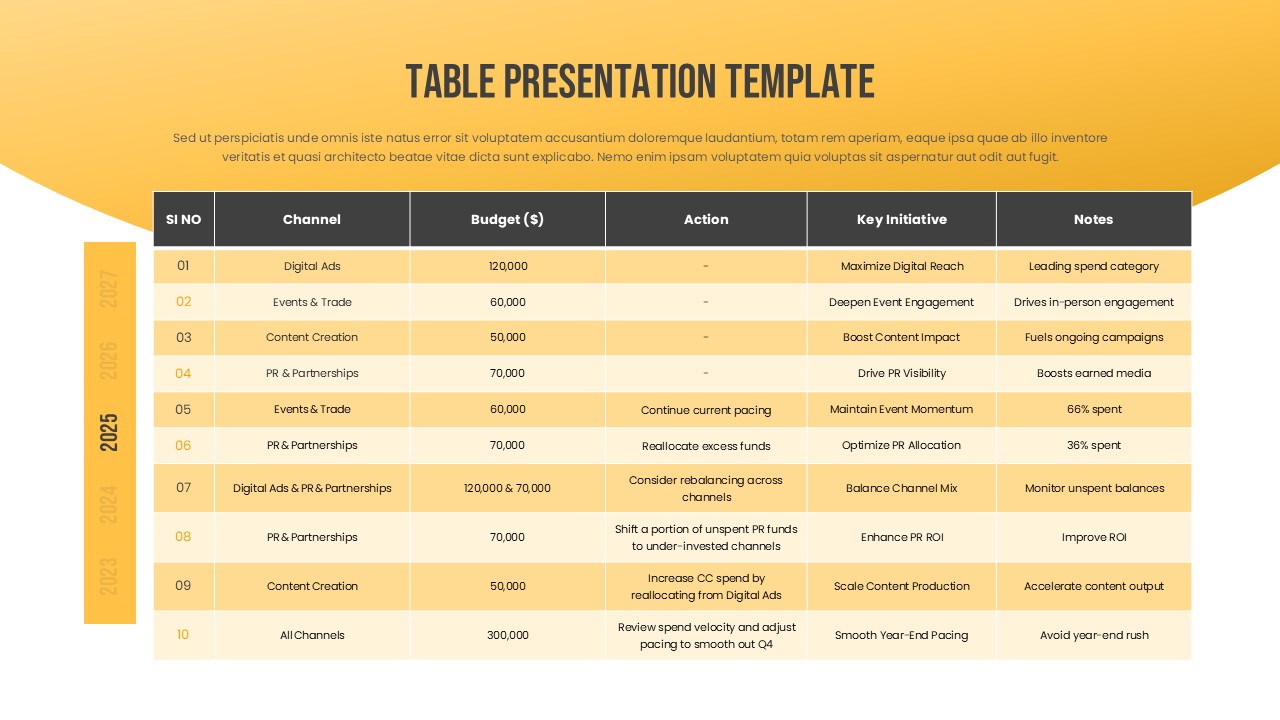
Marketing Budget Table Template for PowerPoint & Google Slides
Business
Marketing Budget Allocation Breakdown Template for PowerPoint & Google Slides
Finance

Comparison Donut Chart PowerPoint Template and Keynote
Pie/Donut
Free KPI Dashboard PowerPoint Template for PowerPoint & Google Slides
Charts
Free
Dynamic Data Dashboard Infographic Template for PowerPoint & Google Slides
Bar/Column
Product Usage Analytics Dashboard Chart Template for PowerPoint & Google Slides
Bar/Column
Data Analytics Dashboard Design template for PowerPoint & Google Slides
Bar/Column

Efficiency KPI Dashboard Metaphor Template for PowerPoint & Google Slides
Infographics
Business Dashboard Analytics & KPIs Template for PowerPoint & Google Slides
Bar/Column
Professional Team Efficiency Dashboard Template for PowerPoint & Google Slides
Business Report
Project Management Dashboard Template for PowerPoint & Google Slides
Project
Website Performance Dashboard template for PowerPoint & Google Slides
Charts
Sales Performance Dashboard template for PowerPoint & Google Slides
Business Report
Employee Skill Analysis Dashboard Template for PowerPoint & Google Slides
Employee Performance
Social Media Performance Dashboard Template for PowerPoint & Google Slides
Bar/Column
Net Promoter Score Dashboard Template for PowerPoint & Google Slides
Customer Experience
Modern Project Status Report Dashboard Template for PowerPoint & Google Slides
Project Status
Performance KPI Dashboard Slide Template for PowerPoint & Google Slides
Business Report
KPI Dashboard template for PowerPoint & Google Slides
Business Report
KPI Dashboard Overview template for PowerPoint & Google Slides
Finance
KPI Dashboard Data Visualization Template for PowerPoint & Google Slides
Bar/Column
KPI Dashboard Data Overview Slide Template for PowerPoint & Google Slides
Bar/Column
Professional Nurse Infographic Dashboard Template for PowerPoint & Google Slides
Nursing
Interactive Benchmarking Gauge Dashboard Template for PowerPoint & Google Slides
Pie/Donut
Heat Map Risk Matrix Dashboard Template for PowerPoint & Google Slides
Comparison Chart
Project Status Dashboard Table Template for PowerPoint & Google Slides
Project Status
Colorful Project Status Dashboard Template for PowerPoint & Google Slides
Project Status
Weekly Update Schedule Dashboard Template for PowerPoint & Google Slides
Agenda
Project Status Dashboard Template for PowerPoint & Google Slides
Project Status
Weekly Status Report Dashboard Template for PowerPoint & Google Slides
HR
Free Metro UI Dashboard Infographic Template for PowerPoint & Google Slides
Business Report
Free
Website Performance Monitoring Dashboard Template for PowerPoint & Google Slides
Business Report
One Pager Project Status Dashboard Template for PowerPoint & Google Slides
Project Status
One Pager Annual Report Dashboard Template for PowerPoint & Google Slides
Business Report
Social Media Analytics Dashboard Template for PowerPoint & Google Slides
Digital Marketing
Social Media Statistics 2023 Dashboard Template for PowerPoint & Google Slides
Comparison
Mastodon Metrics Infographic Dashboard Template for PowerPoint & Google Slides
Business Report
Soccer Match Stats Dashboard Slide Template for PowerPoint & Google Slides
Graphics
Employee Satisfaction Survey Dashboard Template for PowerPoint & Google Slides
Employee Performance
Customer Satisfaction KPI Dashboard Template for PowerPoint & Google Slides
Customer Experience
Weekly Project Status Dashboard Template for PowerPoint & Google Slides
Project Status
Freight Logistics Dashboard Infographic Template for PowerPoint & Google Slides
Comparison Chart
Free Quarterly Business Review Dashboard Template for PowerPoint & Google Slides
Business
Free
Cost Cutting Savings Dashboard Template for PowerPoint & Google Slides
Pie/Donut
Macroeconomic Indicators Dashboard Template for PowerPoint & Google Slides
PEST
Free Monthly Report PowerPoint Template for PowerPoint & Google Slides
Business Report
Free
Michigan County Map with KPI Dashboard Template for PowerPoint & Google Slides
World Maps
Quarterly Financial Summary Dashboard Template for PowerPoint & Google Slides
Business Report
Banking Financial Overview Dashboard Template for PowerPoint & Google Slides
Finance
Purchasing KPI Metrics Dashboard Template for PowerPoint & Google Slides
Business Report
Monthly Sales Performance Dashboard Template for PowerPoint & Google Slides
Charts
Inventory Management Dashboard Template for PowerPoint & Google Slides
Process
Digital Marketing KPIs Dashboard Dark Template for PowerPoint & Google Slides
Business Report
Employee Performance Metrics Dashboard Template for PowerPoint & Google Slides
Employee Performance
Turnover Analysis Dashboard Template for PowerPoint & Google Slides
Employee Performance
Electronic Health Records Dashboard template for PowerPoint & Google Slides
Health
Customer Interview Insights Dashboard Template for PowerPoint & Google Slides
Customer Experience
Account Overview Dashboard template for PowerPoint & Google Slides
Business
Project Status Dashboard Report Template for PowerPoint & Google Slides
Project Status
Project Status Update Dashboard Table Template for PowerPoint & Google Slides
Project Status
Cohort Analysis Retention Dashboard Template for PowerPoint & Google Slides
Comparison Chart
Project Status Dashboard Template for PowerPoint & Google Slides
Project Status
Dashboard Project Status Template for PowerPoint & Google Slides
Project Status
Task Completion Rate Dashboard Template for PowerPoint & Google Slides
Business
Project Status Dashboard with RAG Legend Template for PowerPoint & Google Slides
Project Status
End of Year Review Dashboard Template for PowerPoint & Google Slides
Business Report
Construction Project Dashboard Template for PowerPoint & Google Slides
Project
Employee Headcount Dashboard Report Template for PowerPoint & Google Slides
Employee Performance
4DX Scoreboard KPI Gauge Dashboard Template for PowerPoint & Google Slides
Business Strategy