Budget Flow Representation PowerPoint Template


The Budget Flow Representation PowerPoint Template gives finance teams and business analysts a precise way to present monetary trends, budget movement, and financial performance over time. This template works for quarterly budget reviews, annual financial reports, and investor briefings. It is fully editable in PowerPoint and Google Slides, so teams can update data points, adjust colors, and rework layouts without rebuilding slides from scratch.
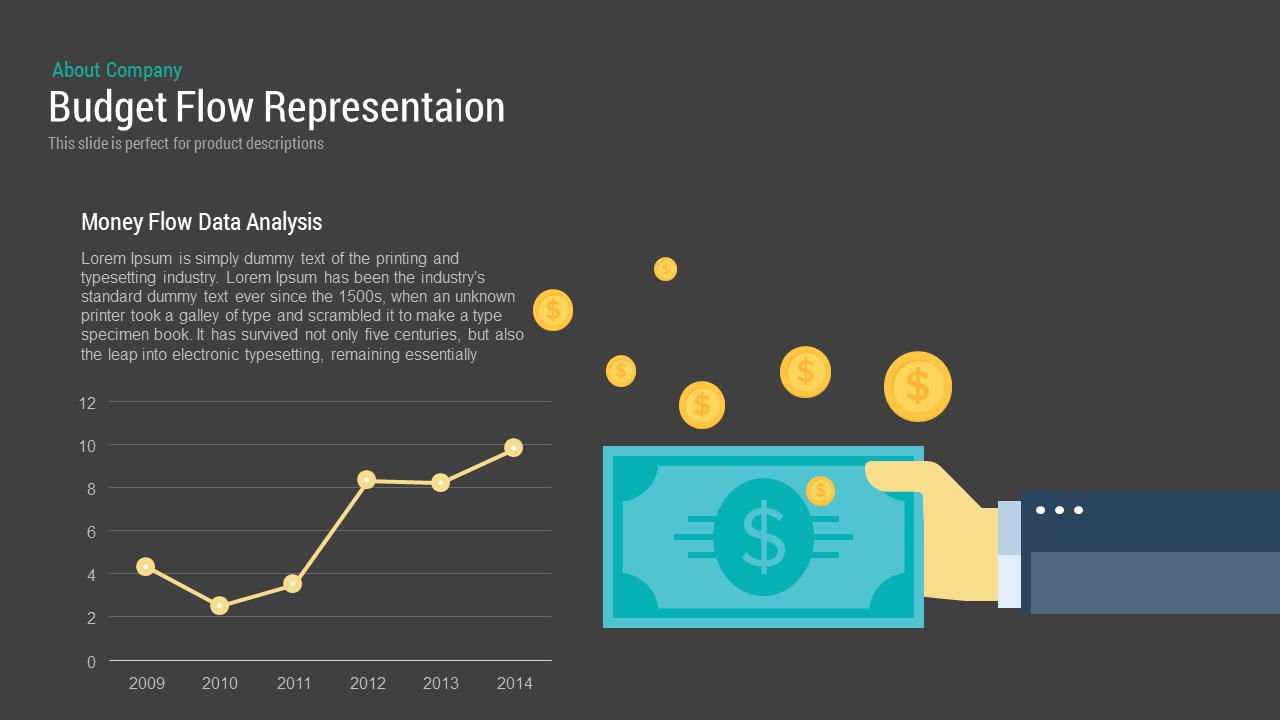
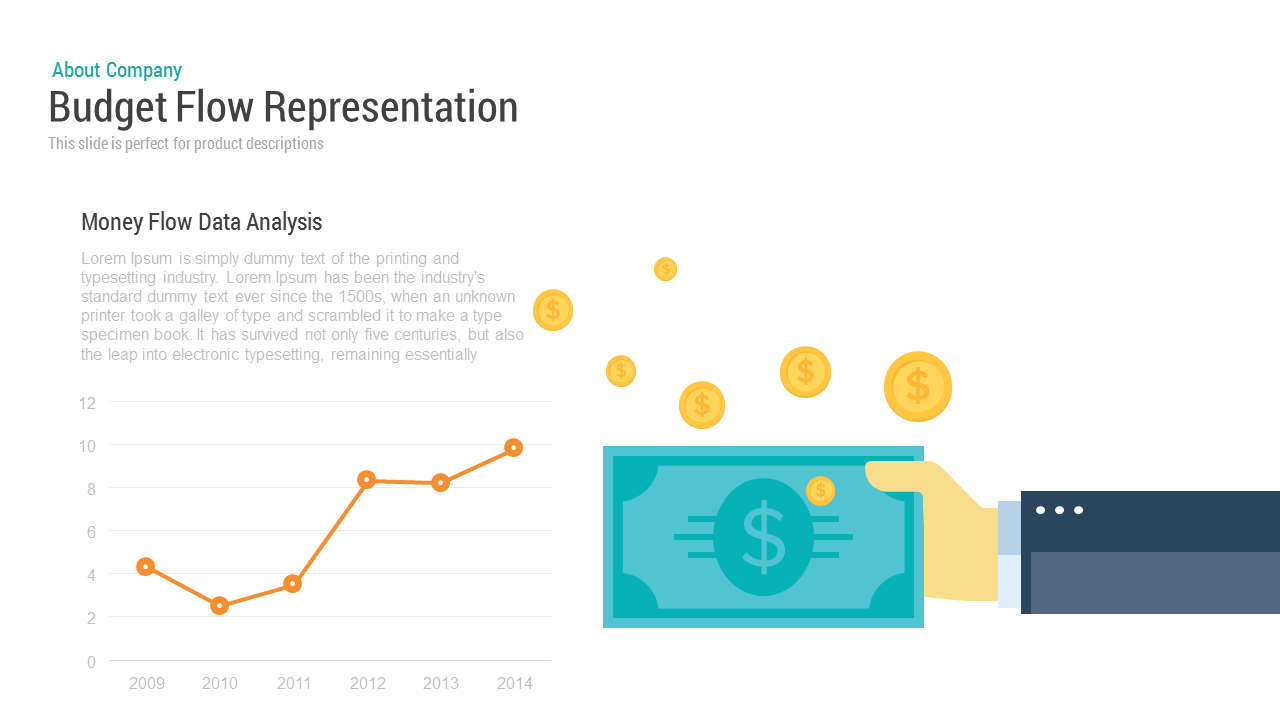
The template features a dark charcoal background with teal and yellow as the primary accent colors, creating strong visual contrast that draws attention to key figures. The left side of the slide holds a title block, a short descriptive text section, and a line chart plotting budget values from 2009 through 2014. Data points along the line mark each year, allowing viewers to trace upward and downward movements across the six-year period. The right side presents a flat-style illustration of a hand holding a banknote surrounded by gold coin icons, reinforcing the financial context of the data. The two-column layout separates analytical content from visual representation, supporting a logical reading order.
All shapes, chart elements, icons, and text boxes are editable. Users can replace the sample line chart data with current figures, swap the illustration for a different graphic, adjust the color scheme to match brand guidelines, and modify the heading and body text fields. The layout scales without distortion across standard widescreen slide dimensions.
Download the Budget Flow Representation Template and present your financial data with structure and accuracy today.
Login to download this file

Item ID
SB00007
Related Templates

Circle Spider Diagram Template for PowerPoint and Google Slides
Circular
Sales vs Budget Performance Chart Template for PowerPoint & Google Slides
Bar/Column
Budget Infographic & Expense Tracker Template for PowerPoint & Google Slides
Finance
Types of Budget Infographic Pack Template for PowerPoint & Google Slides
Comparison
Budget Forecast Dashboard & Donut Charts Template for PowerPoint & Google Slides
Pie/Donut
Engaging Dark Blue Budget Presentation Template for PowerPoint & Google Slides
Pitch Deck
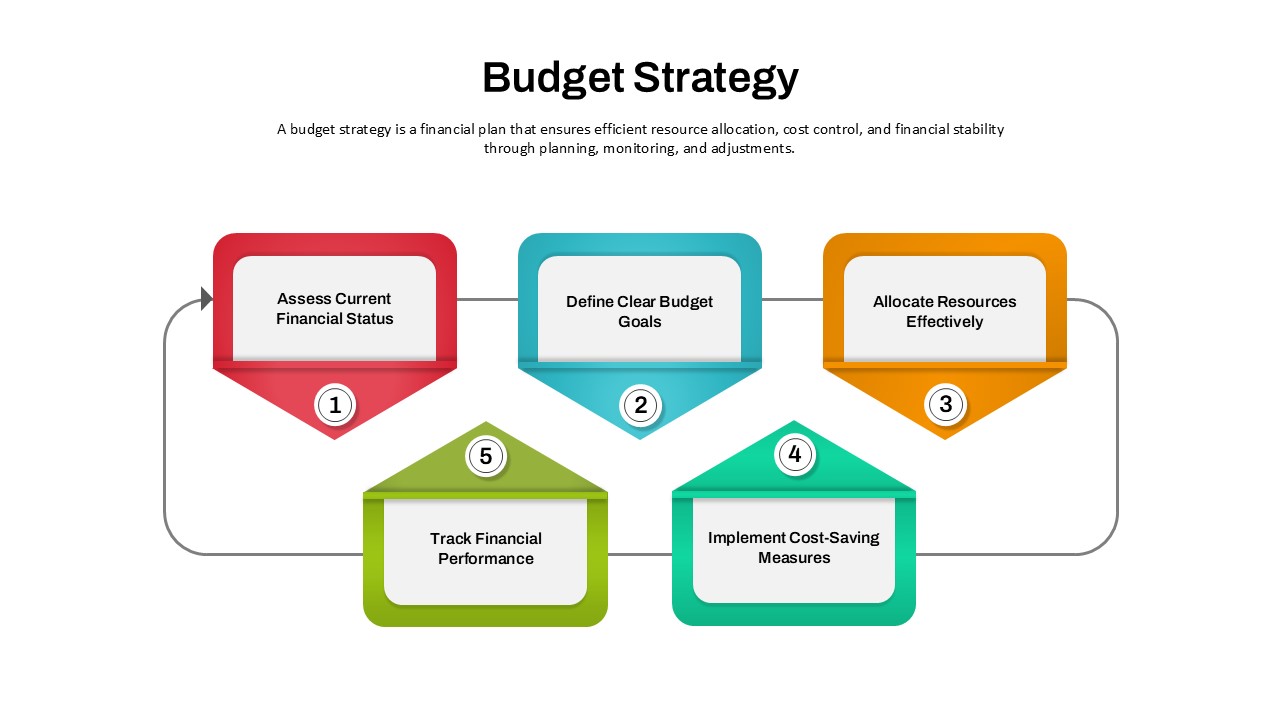
Budget Strategy Five-Step Process Template for PowerPoint & Google Slides
Finance
Marketing Budget Allocation Donut Chart Template for PowerPoint & Google Slides
Marketing
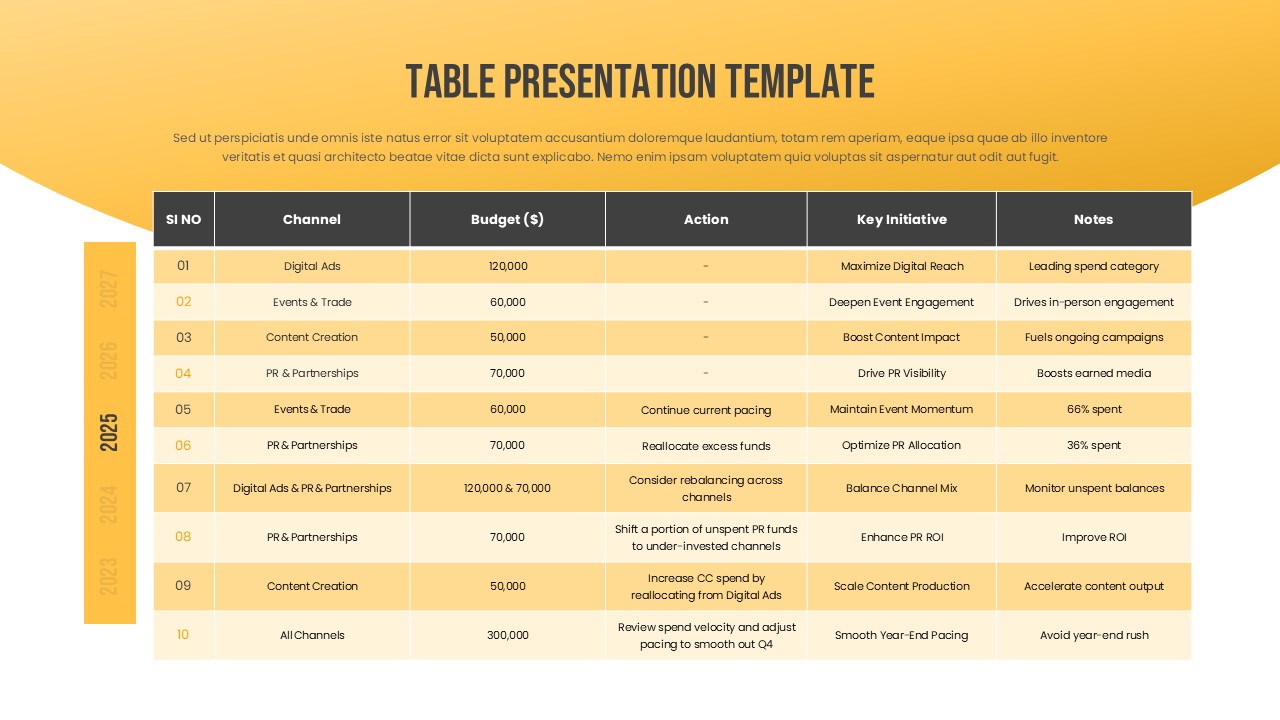
Marketing Budget Table Template for PowerPoint & Google Slides
Business
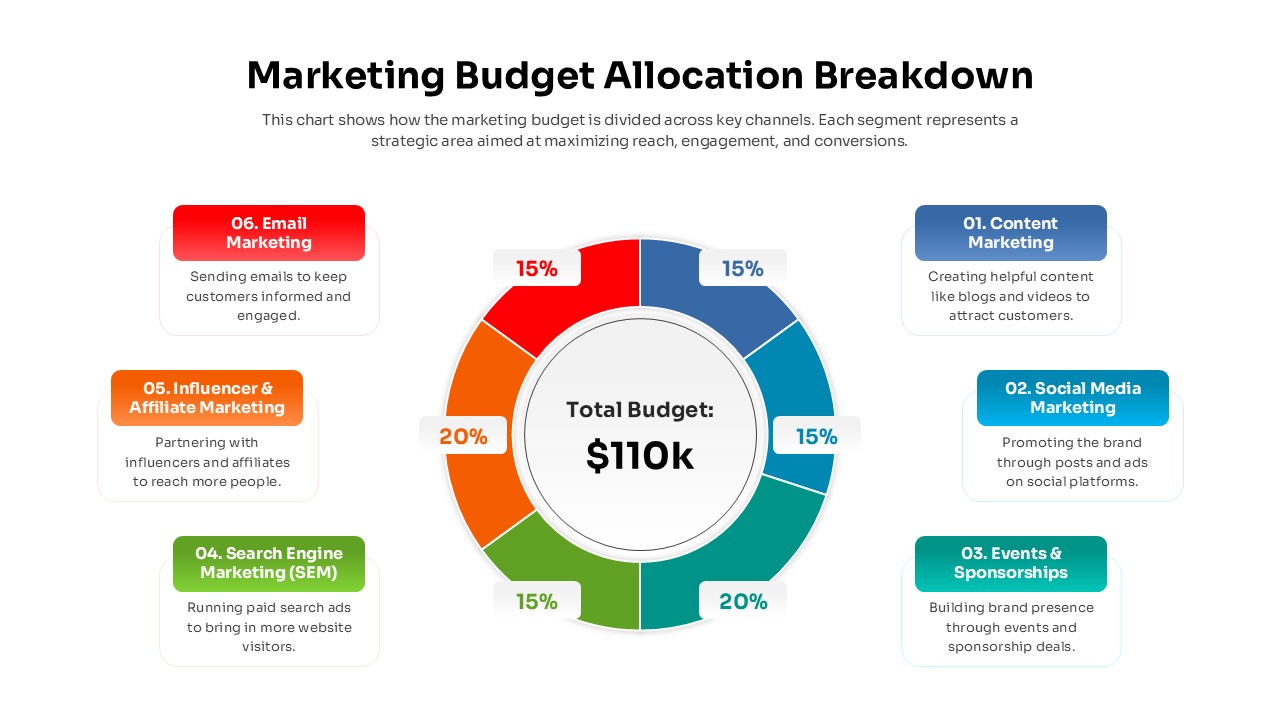
Marketing Budget Allocation Breakdown Template for PowerPoint & Google Slides
Finance
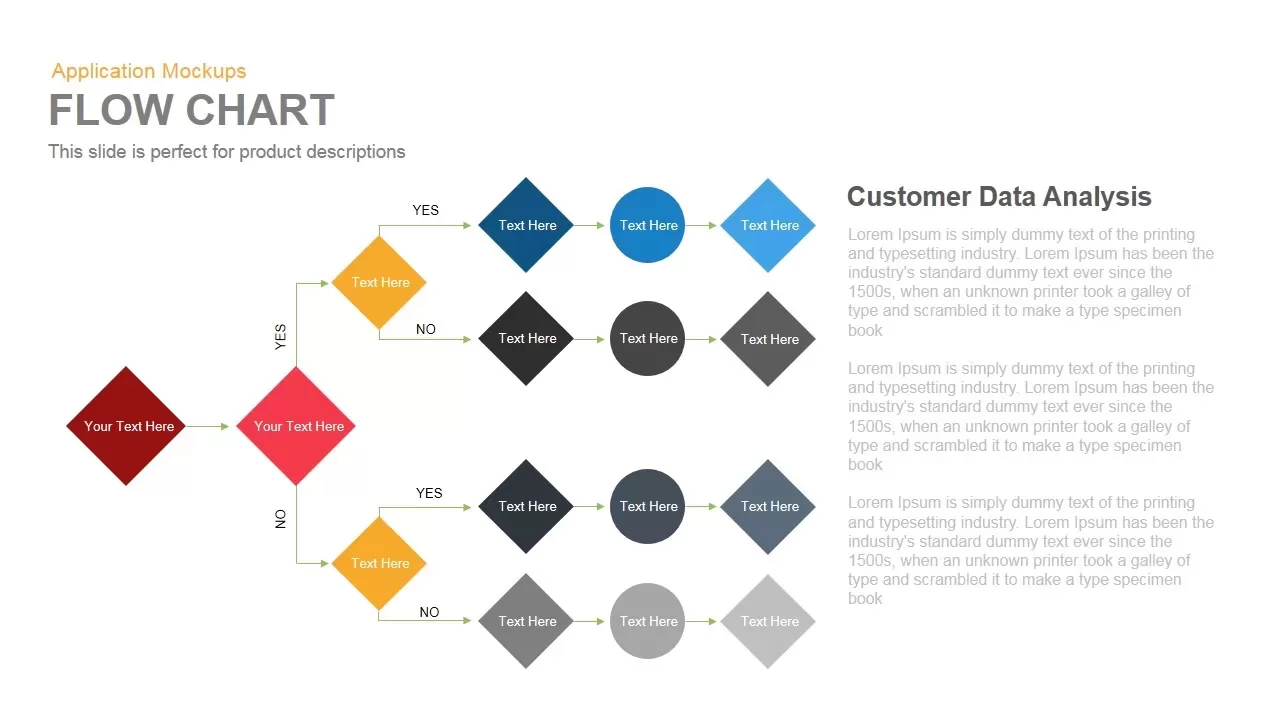
Flow Chart template for PowerPoint & Google Slides
Flow Charts
Octagon Process Flow template for PowerPoint & Google Slides
Process
8-Stage Process Flow Flower Diagram Template for PowerPoint & Google Slides
Infographics
Circular Flow Diagram Template for PowerPoint & Google Slides
Infographics
Puzzle Pipe Infographics Process Flow Template for PowerPoint & Google Slides
Process
Six Hexagon Stages Process Flow Diagram Template for PowerPoint & Google Slides
Process
Ribbon Diagram Flow template for PowerPoint & Google Slides
Process
5-Stage Arrow Infographics Process Flow Template for PowerPoint & Google Slides
Arrow
Process Flow Diagram template for PowerPoint & Google Slides
Infographics
Icon Section Flow template for PowerPoint & Google Slides
Process
3D Shape Linear Process Flow Diagram Template for PowerPoint & Google Slides
Process

Three Important Services PowerPoint Template
Process
Linear Process Flow Circles Diagram Template for PowerPoint & Google Slides
Process
Six-Stage Zig-Zag Process Flow Diagram Template for PowerPoint & Google Slides
Process
Vertical Business Process Flow Diagram Template for PowerPoint & Google Slides
Process
Direct Flow Arrow PowerPoint Template
Arrow
Six-Sided Shutter Diagram Process Flow Template for PowerPoint & Google Slides
Process
10 Stages Business Flow Process Diagram template for PowerPoint & Google Slides
Business
Gear Flow Diagram template for PowerPoint & Google Slides
Process

Four Plus Process Diagrams PowerPoint Template
Process
Four-Stage Circular Process Flow Template for PowerPoint & Google Slides
Process
4 Step Revenue Growth Flow Diagram Template for PowerPoint & Google Slides
Process
Wavy Five-Stage Transformation Flow Template for PowerPoint & Google Slides
Process
Five-Stage Linear Process Flow Diagram Template for PowerPoint & Google Slides
Process
Gradient Chevron Five-Stage Process Flow Template for PowerPoint & Google Slides
Arrow
Five-Stage Agenda Flow Diagram Template for PowerPoint & Google Slides
Agenda
Six-Step Hexagon Process Flow Diagram Template for PowerPoint & Google Slides
Process
Five-Stage Circular Flow Diagram Template for PowerPoint & Google Slides
Circular
5-Stage Gear Process Flow Diagram Template for PowerPoint & Google Slides
Process
4 Stage Linear Process Flow Diagram Template for PowerPoint & Google Slides
Process
7 Stage Linear Process Flow Diagram Template for PowerPoint & Google Slides
Process
8 Step Circular Process Flow Diagram Template for PowerPoint & Google Slides
Process
Employee Attrition Flow Template for PowerPoint & Google Slides
Recruitment
4-Stage Linear Process Flow Diagram Template for PowerPoint & Google Slides
Process
4-Step Linear Process Flow Diagram Template for PowerPoint & Google Slides
Process
Colorful 8-Stage Droplet Process Flow Diagram Template for PowerPoint & Google Slides
Process
5-Step Circular Gradient Process Flow Template for PowerPoint & Google Slides
Process

Modern Process Flow Infographic Template
Process
Five-Step Process Flow Infographic Template for PowerPoint & Google Slides
Process
Flow Chart Diagram template for PowerPoint & Google Slides
Flow Charts
Process Flow Diagram template for PowerPoint & Google Slides
Process
Flow Chart Decision Tree Template for PowerPoint & Google Slides
Flow Charts
Colorful Process Flow Template for PowerPoint & Google Slides
Process
Free Process Flow PowerPoint Slides Template
Process
Free
5 Stage Process Flow Overview template for PowerPoint & Google Slides
Process
Free Circular Multi-Step Flow Chart Diagram Template for PowerPoint & Google Slides
Flow Charts
Free
Multi-Style Flow Infographic Slide template for PowerPoint & Google Slides
Process
Curved Arrow Template PowerPoint
Process
Curved Arrow Process Flow Diagram Template for PowerPoint & Google Slides
Process
Curved Arrow Infographics
Arrow
Curved Arrow Flow Diagram template for PowerPoint & Google Slides
Business
Curved Arrow Flow Template for PowerPoint & Google Slides
Process
Three-Step Wavy Arrow Flow Template for PowerPoint & Google Slides
Process
Curved Arrow Process Flow template for PowerPoint & Google Slides
Process
Circular Arrows Process Flow template for PowerPoint & Google Slides
Process
Circular Arrows Process Flow template for PowerPoint & Google Slides
Process
Circular Arrows Process Flow template for PowerPoint & Google Slides
Process
Circle Arrow Process Flow template for PowerPoint & Google Slides
Process
4 Step Circle Arrows Template
Process
Accordion Animated Slide
Process
Conveyor Belt Infographic Process Flow Template for PowerPoint & Google Slides
Process
Conveyor Belt Sequential Process Flow Template for PowerPoint & Google Slides
Process
3D Conveyor Belt Process Flow Diagram Template for PowerPoint & Google Slides
Process
E-Waste Management PowerPoint Template
Process
Current vs Future Process PowerPoint Template
Comparison
Project Intake Process Template PPT and Google Slides
Process

DevOps PowerPoint Template and Google Slides
Information Technology
Business Intelligence Infographic & Flow Template for PowerPoint & Google Slides
Business Report
Neurology Neuron Structure Process Flow Template for PowerPoint & Google Slides
Health
Process Flow Diagram Template PowerPoint & Google Slides
Process
Animated Gears PowerPoint Template
Process
Free Ecological Energy Flow Pyramid Template for PowerPoint & Google Slides
Pyramid
Free
Cross Functional Swimlane Flow Chart Template for PowerPoint & Google Slides
Flow Charts
Wastewater Treatment Process Flow Chart Template for PowerPoint & Google Slides
Flow Charts
Advanced Data Flow Diagram Pack Template for PowerPoint & Google Slides
Flow Charts
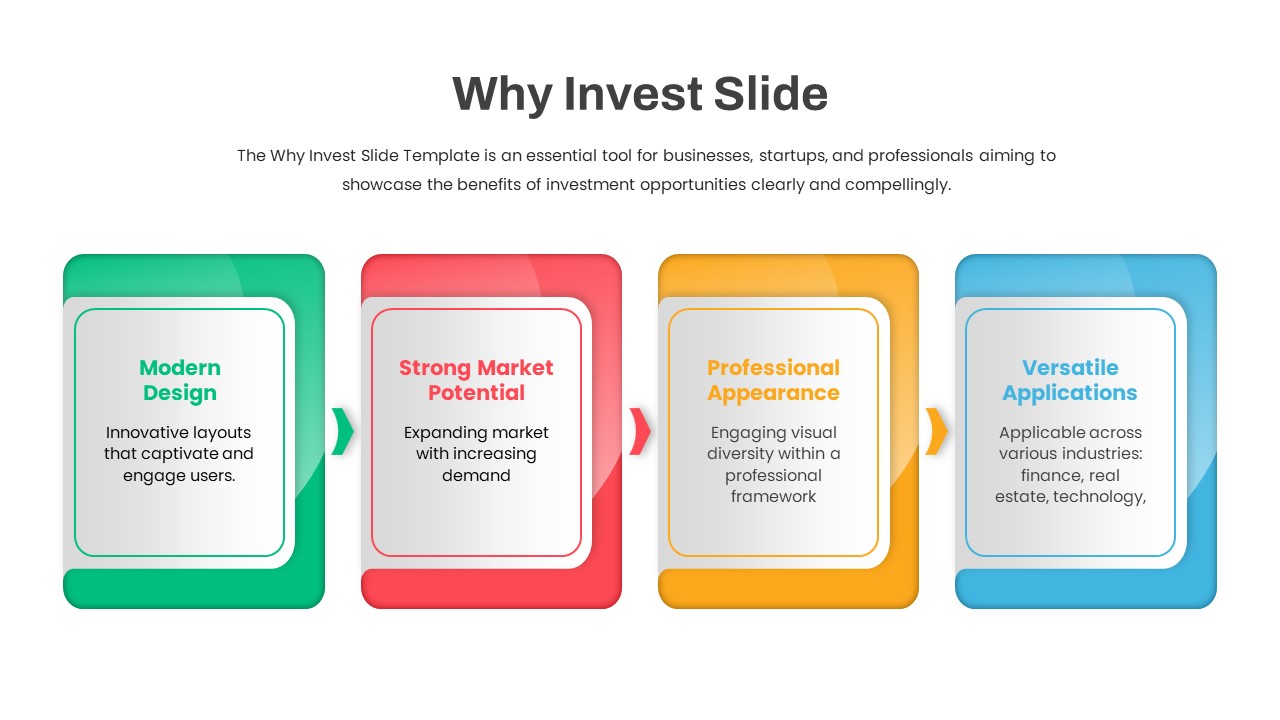
Why Invest PowerPoint Template
Business Plan
Capital Investments Process Flow Diagram Template for PowerPoint & Google Slides
Process
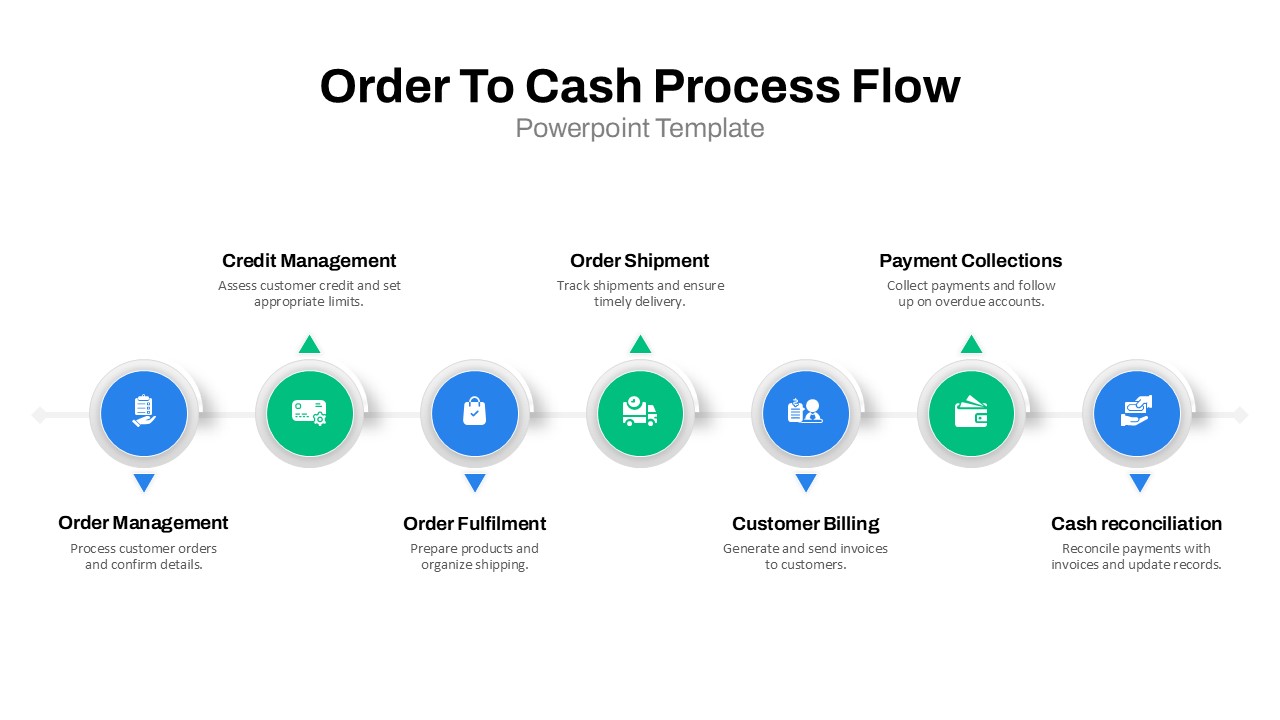
Order to Cash Process Flow Diagram Template for PowerPoint & Google Slides
Process
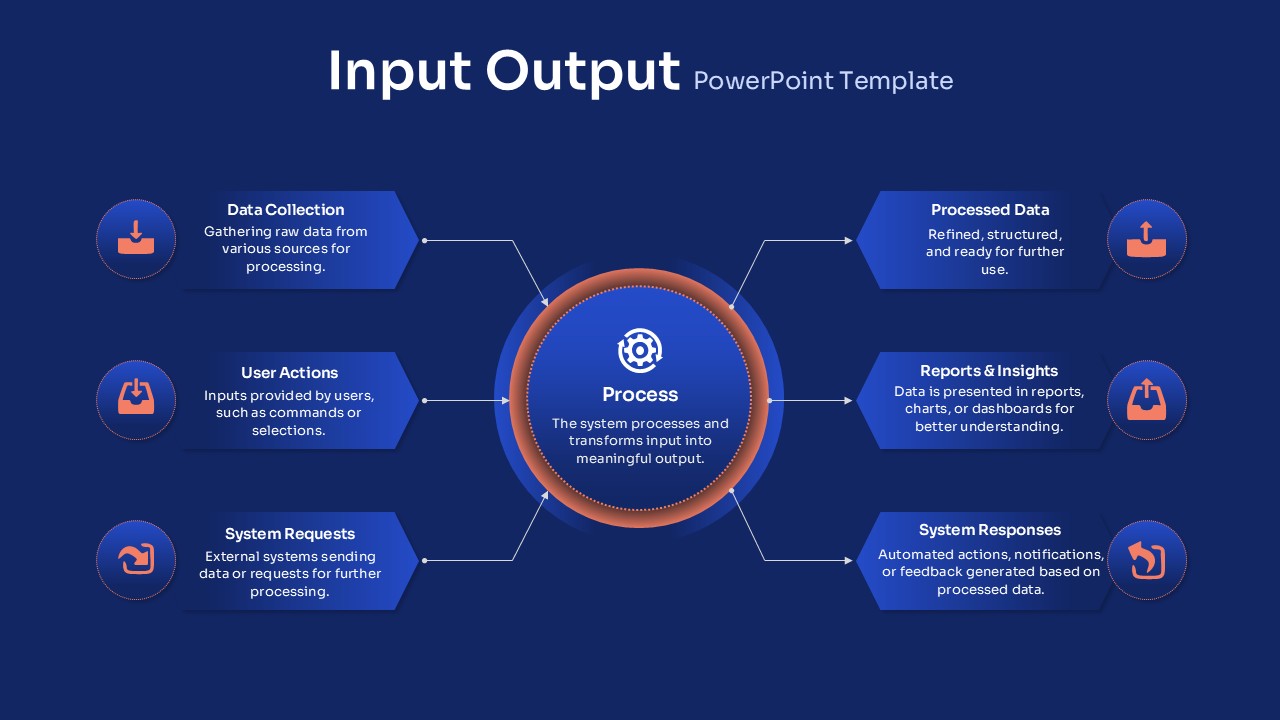
Input-Output Flow Template for PowerPoint & Google Slides
Process
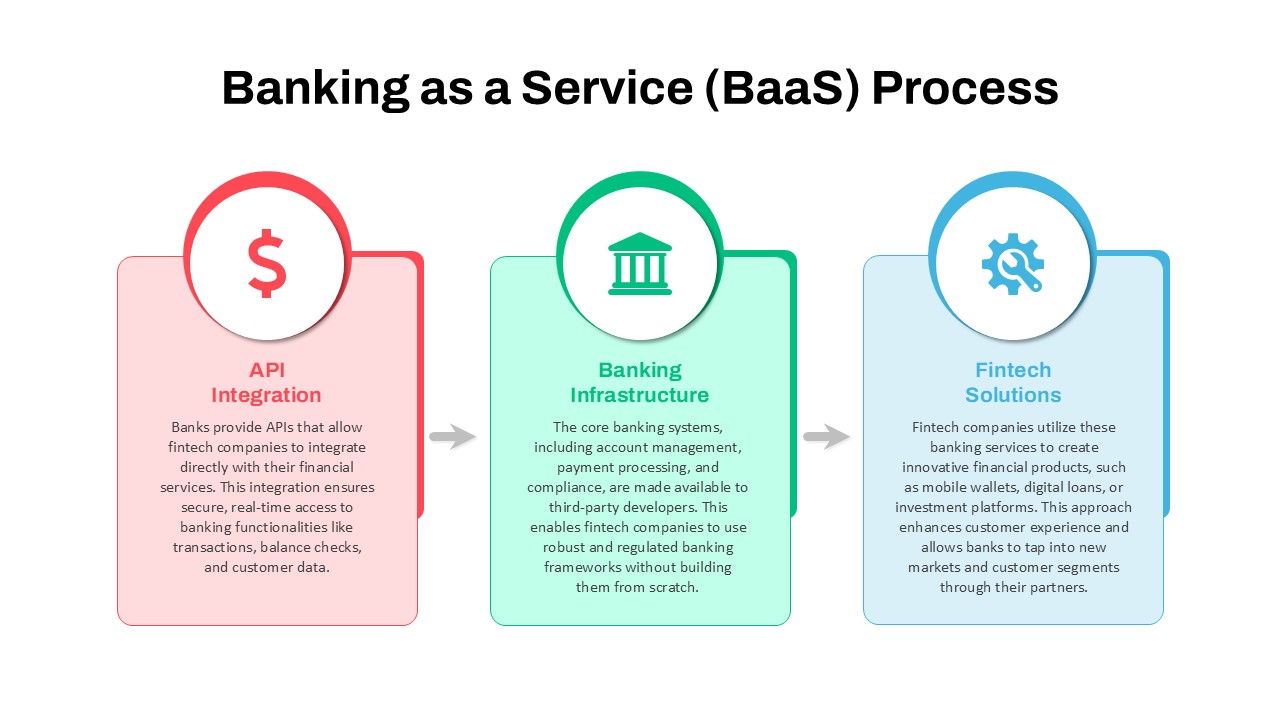
Banking as a Service (BaaS) Process Flow Template for PowerPoint & Google Slides
Process
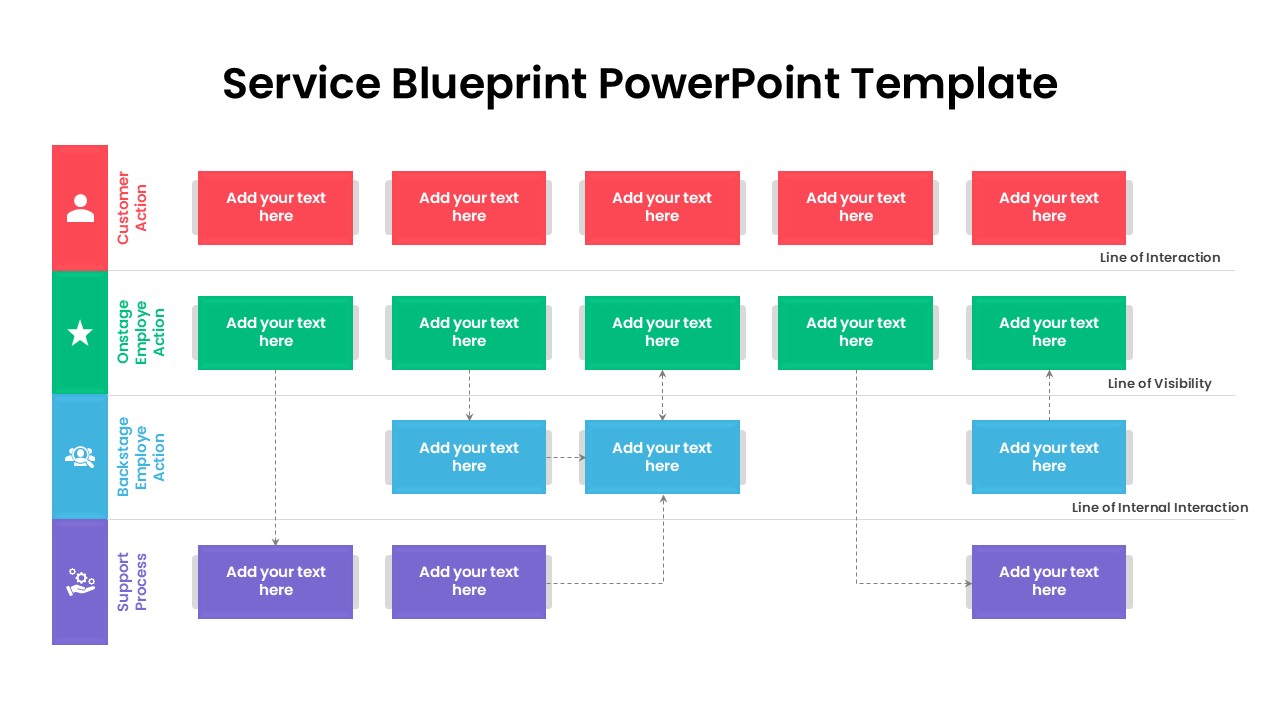
Service Blueprint Process Flow Template for PowerPoint & Google Slides
Process
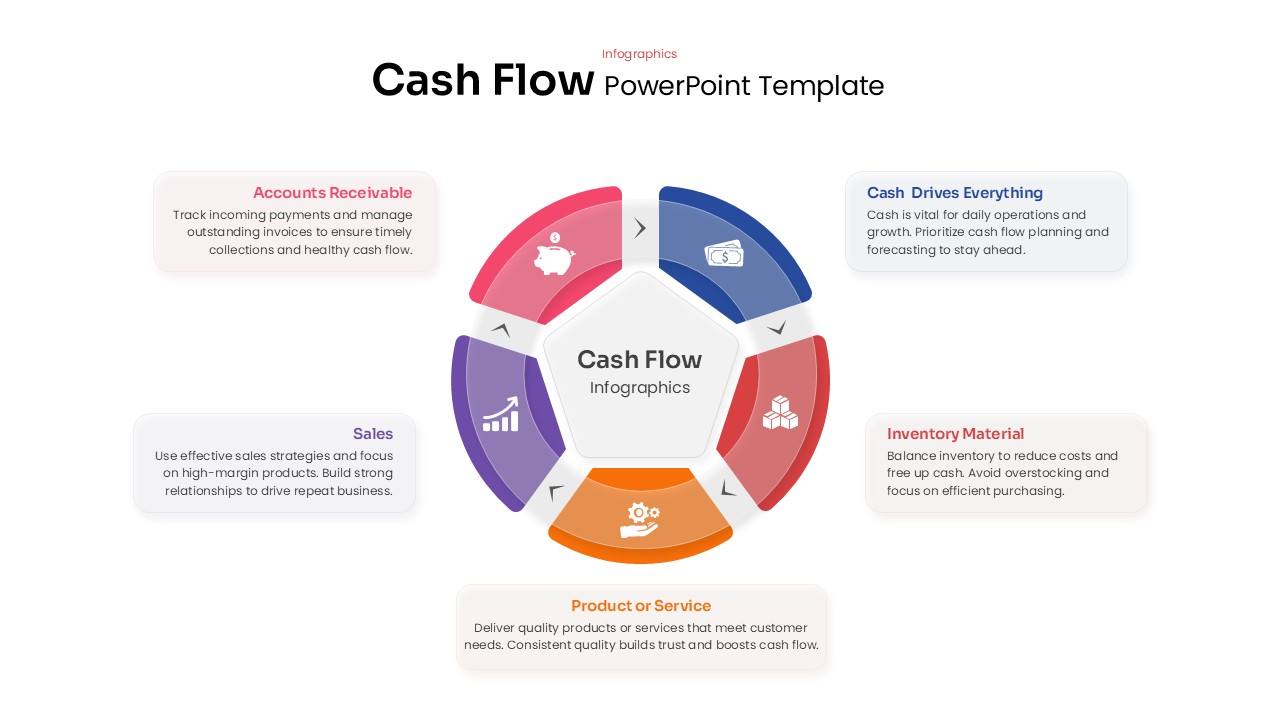
Cash Flow Infographics template for PowerPoint & Google Slides
Business
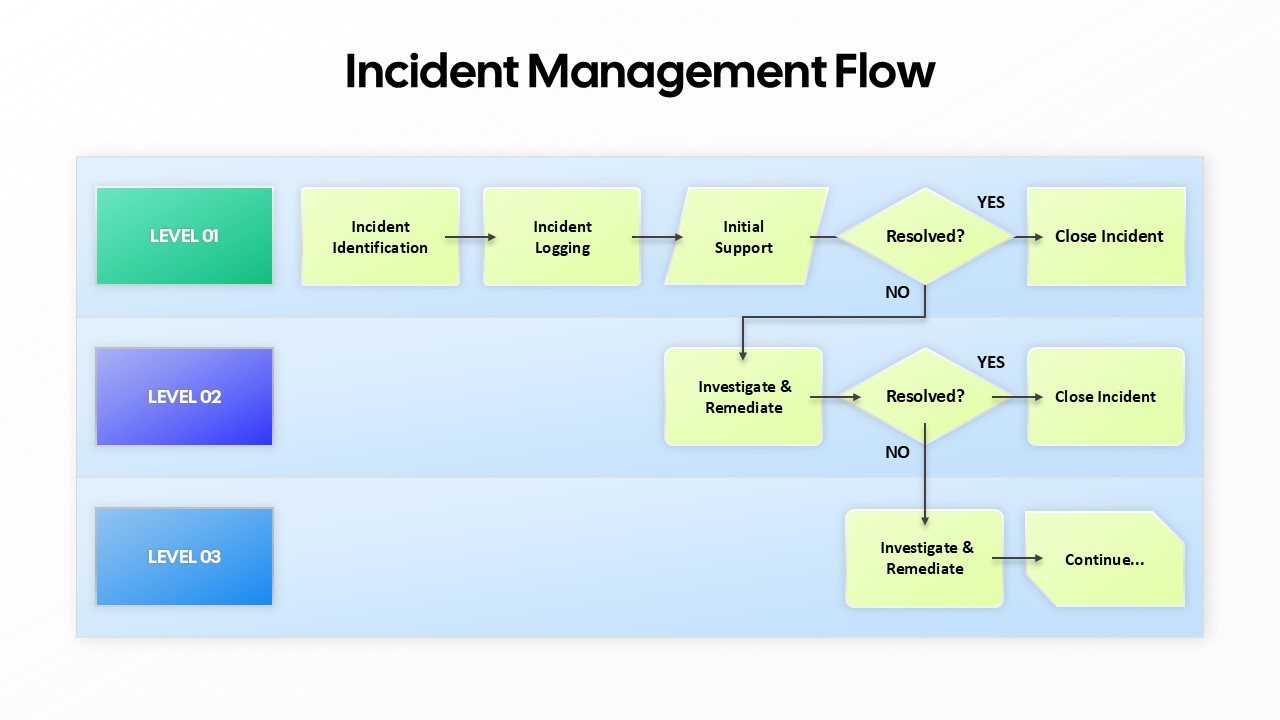
Incident Management Flow Process template for PowerPoint & Google Slides
Flow Charts
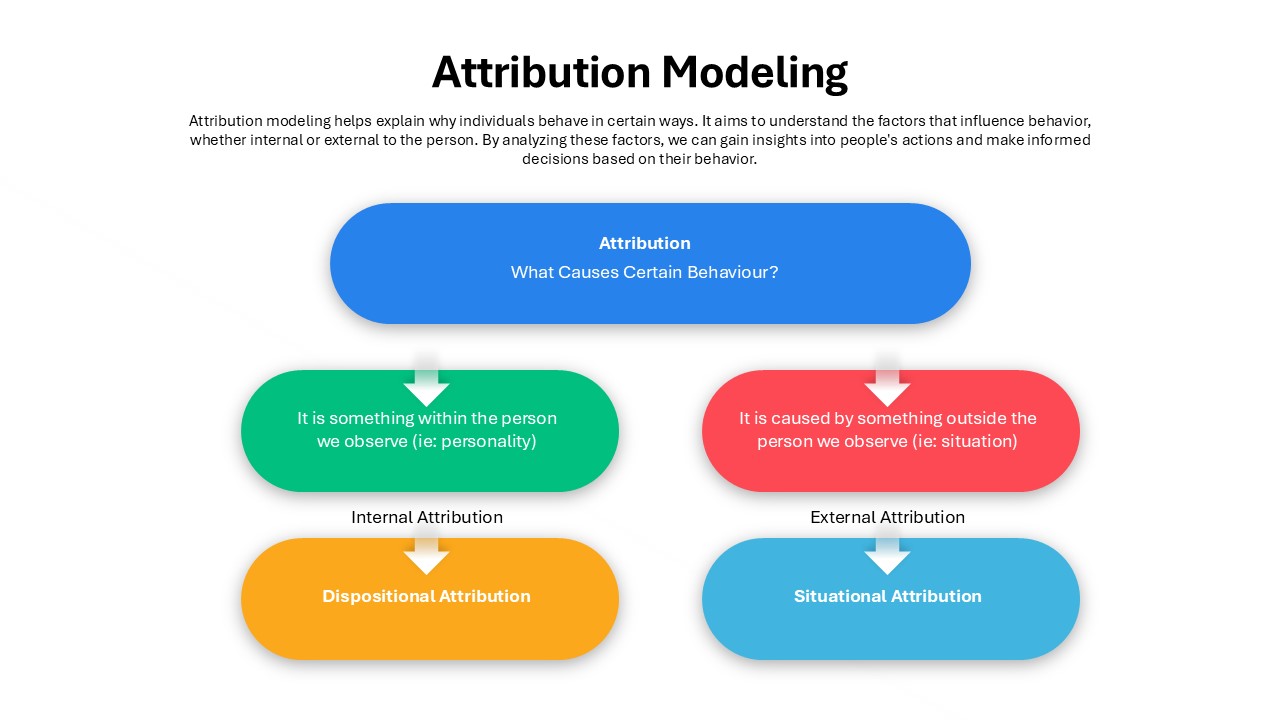
Attribution Modeling Flow Chart Template for PowerPoint & Google Slides
Flow Charts
Resume Screening Process Flow Diagram Template for PowerPoint & Google Slides
Process
Q-Learning Process Flow Diagram Template for PowerPoint & Google Slides
Process
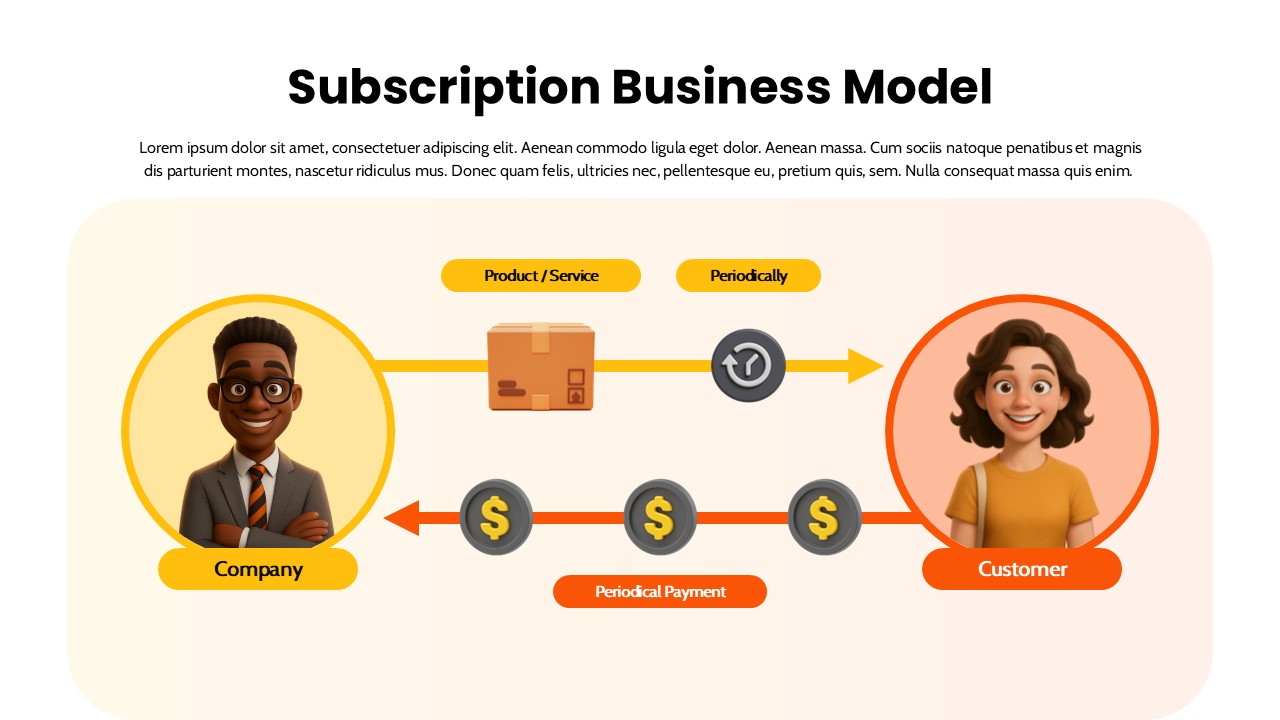
Subscription Business Model Flow Diagram Template for PowerPoint & Google Slides
Business Models
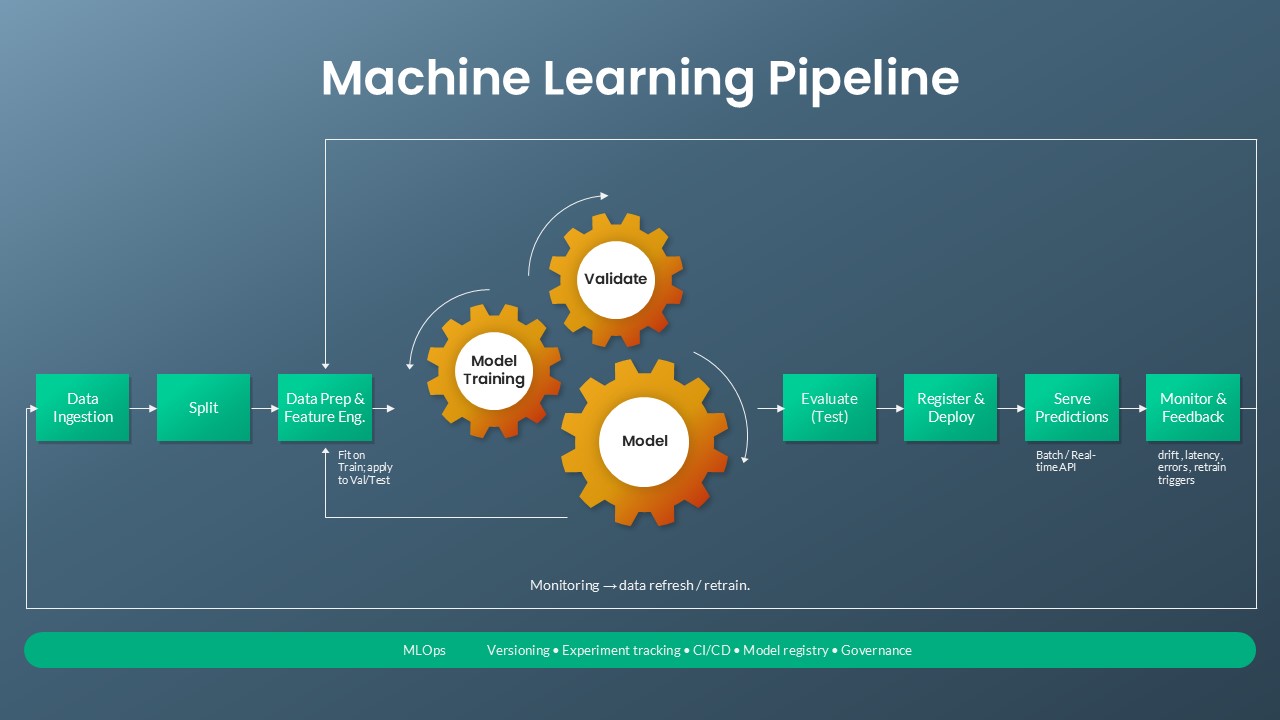
Machine Learning Pipeline & MLOps Flow Template for PowerPoint & Google Slides
Machine Learning
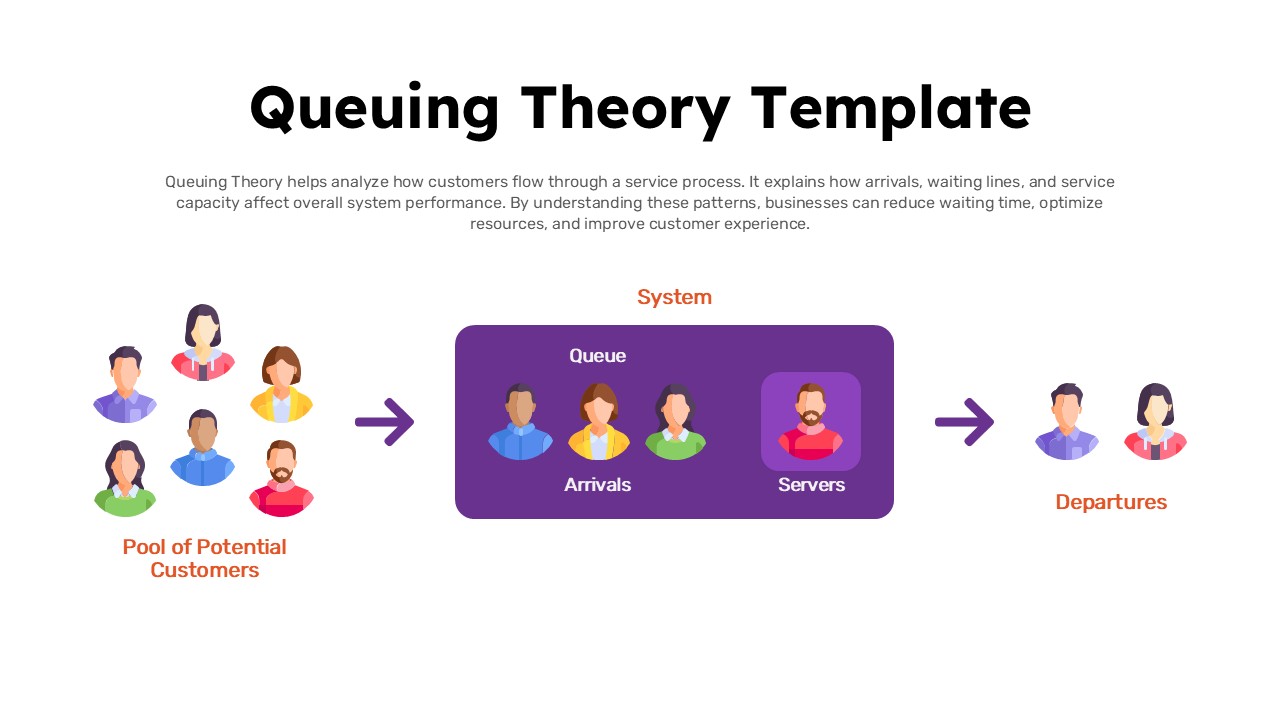
Queuing Theory System Flow Diagram Template for PowerPoint & Google Slides
Process
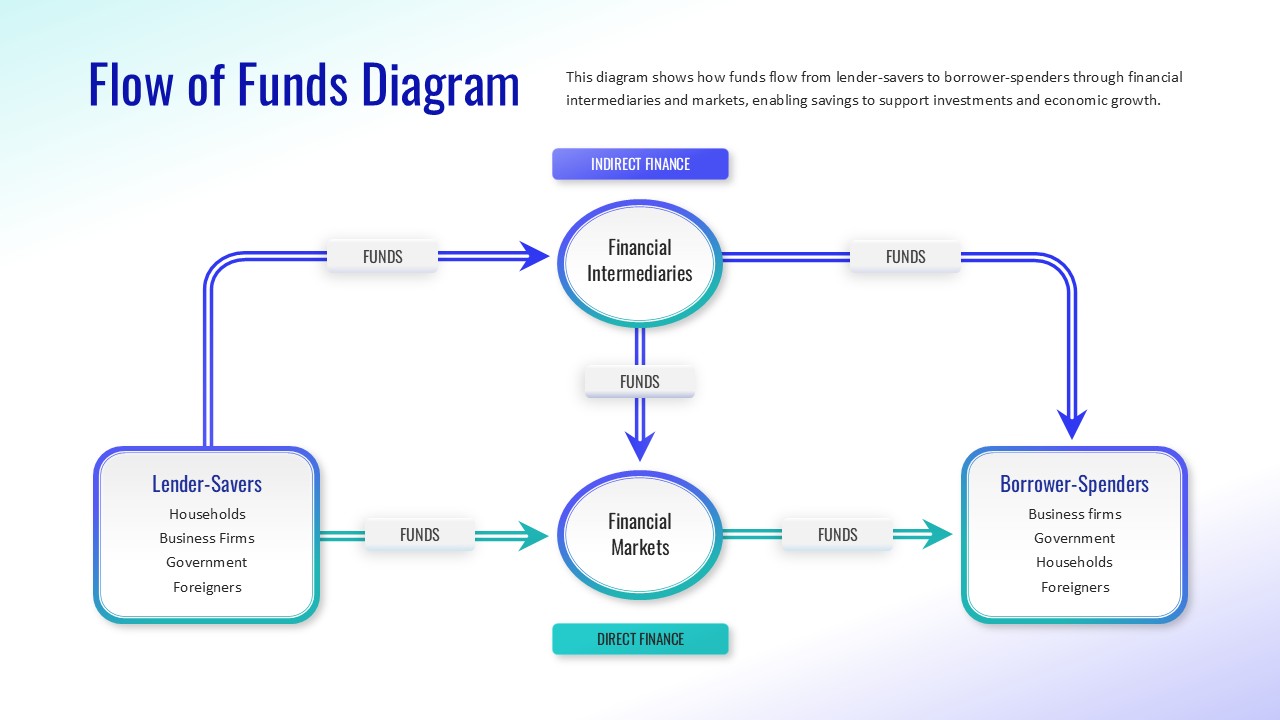
Flow of Funds Financial System Diagram Template for PowerPoint & Google Slides
Finance