Pirate Metrics AARRR Funnel Framework Template for PowerPoint & Google Slides

Description
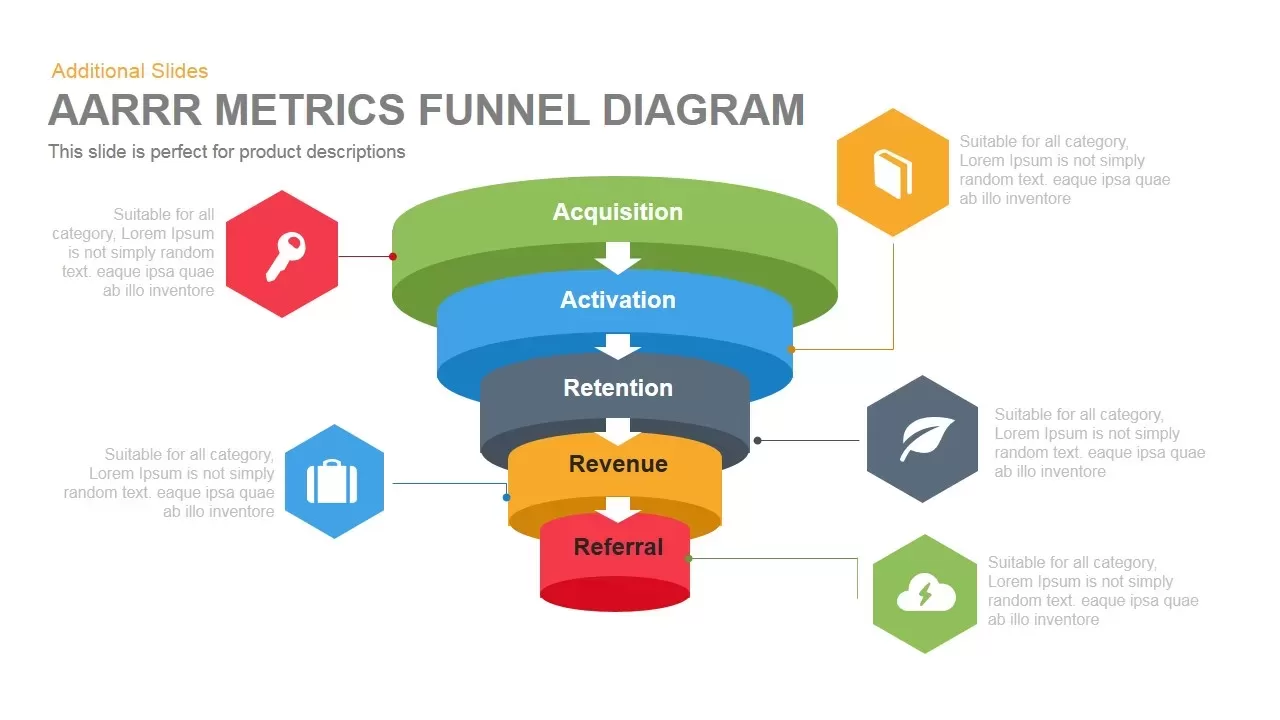
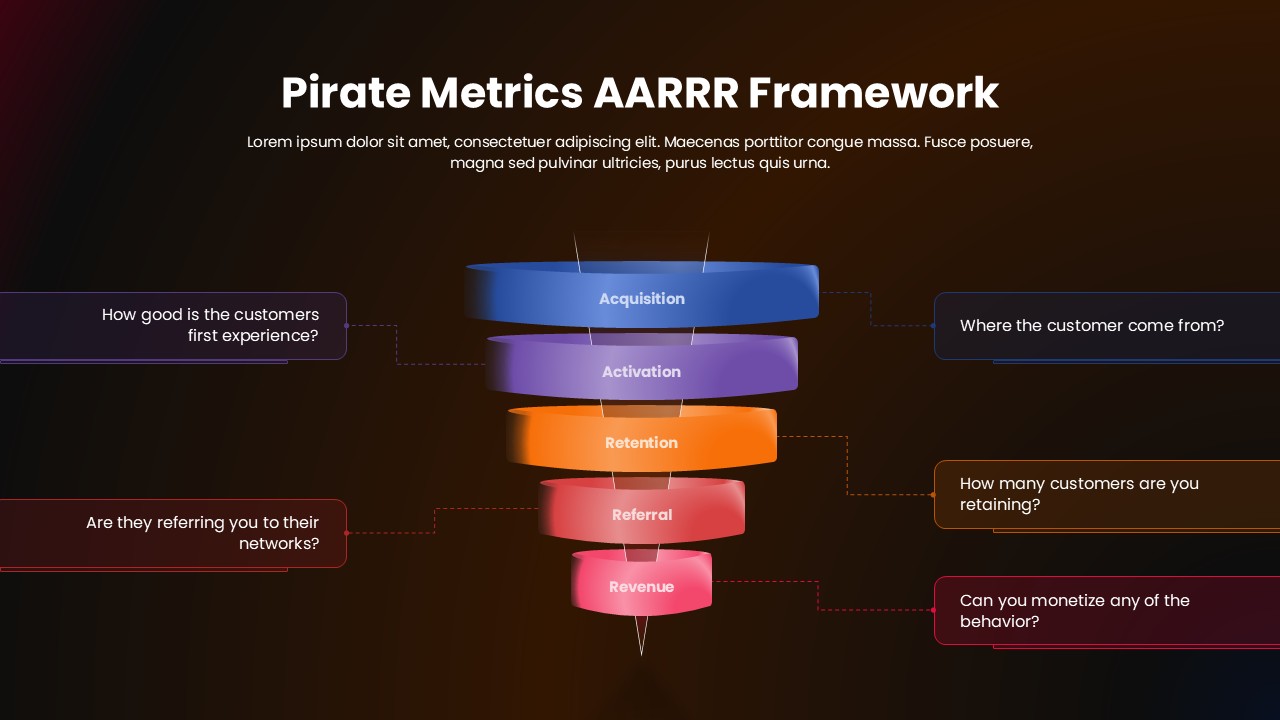
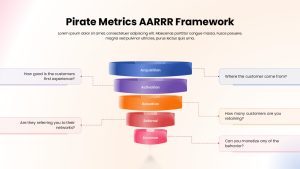
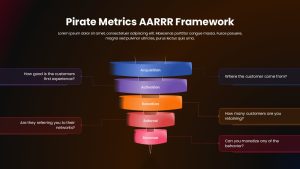
Use this Pirate Metrics AARRR Funnel slide to illustrate the five key stages of customer lifecycle measurement—Acquisition, Activation, Retention, Referral, and Revenue—in a visually striking, multi-color 3D funnel. Each tier of the inverted funnel is rendered in a distinct gradient hue, with dashed connectors leading to editable callouts on either side where you can pose critical diagnostic questions (e.g., “Where do customers come from?” or “Can you monetize any of the behavior?”). The soft background gradient and subtle drop shadow ground the design without distracting from your data, while consistent typography and grouped objects ensure pixel-perfect alignment in both PowerPoint and Google Slides.
Built on master slides, this template streamlines customization: swap stage labels, adjust gradient colors to match your brand palette, or replace callout text with your own metrics and insights. No manual realignment is necessary—just drag and drop new icons, reposition callouts, or duplicate funnel tiers to expand the framework. Whether you’re mapping early-stage acquisition channels, benchmarking activation rates, or measuring referral growth, this funnel diagram accelerates your slide creation and drives stakeholder alignment around growth-hacking strategies.
Who is it for
Marketing managers, growth hackers, product teams, startup founders, and performance analysts will benefit from this slide when planning customer acquisition campaigns, optimizing user onboarding, or reporting on monetization funnels.
Other Uses
Repurpose this layout for sales pipelines, recruitment funnels, conversion optimization workshops, or any five-step process that requires clear, staged visualization. Simply update labels, colors, and callout prompts to fit your scenario.
Login to download this file

Item ID
SB05275Designed By
Filda
Related Templates

AARRR Funnel Diagram template for PowerPoint & Google Slides
Funnel
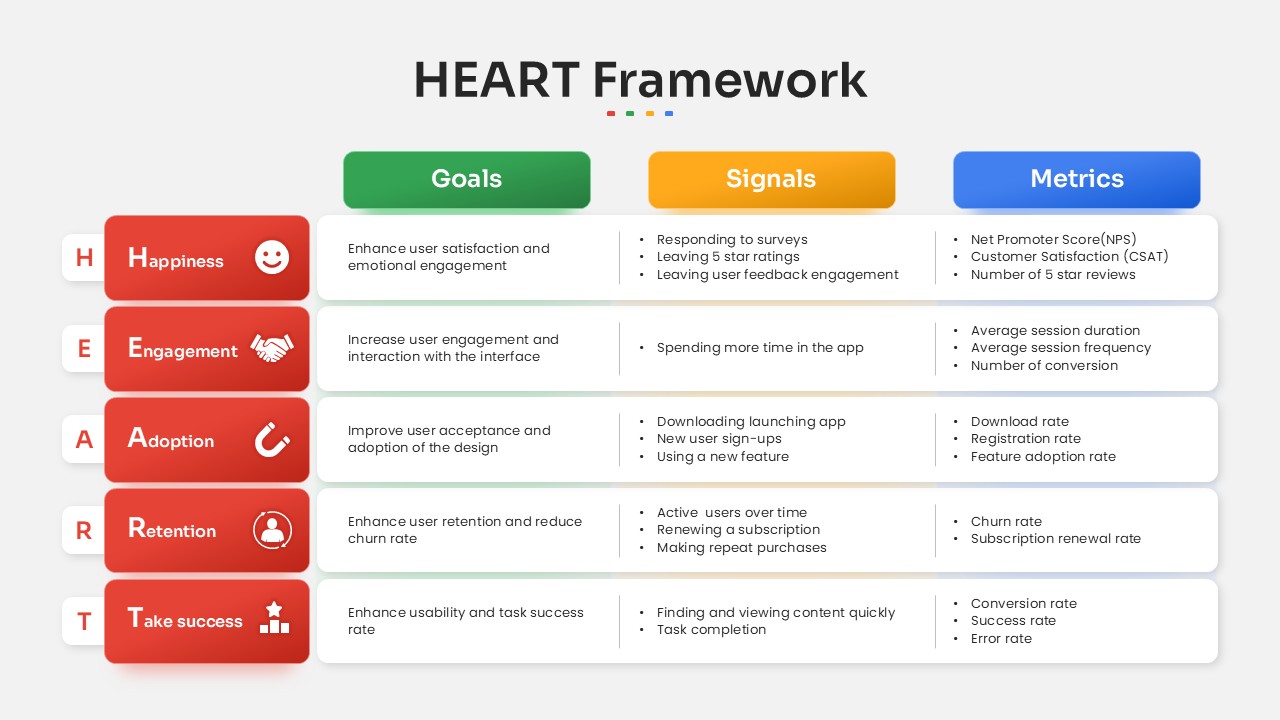
HEART Framework Goals, Signals & Metrics Template for PowerPoint & Google Slides
Process
iPad App Mockup with Progress Metrics Template for PowerPoint & Google Slides
Bar/Column
Asia Map with KPI Metrics and Legend Template for PowerPoint & Google Slides
World Maps
Bubble Head Metrics Infographic Template for PowerPoint & Google Slides
Circular
Circle Segment Sales Metrics Infographic Template for PowerPoint & Google Slides
Circular
Social Media Metrics template for PowerPoint & Google Slides
Comparison Chart
Mobile Usage Metrics template for PowerPoint & Google Slides
Comparison Chart

Scale Metaphor Metrics Comparison Template for PowerPoint & Google Slides
Charts
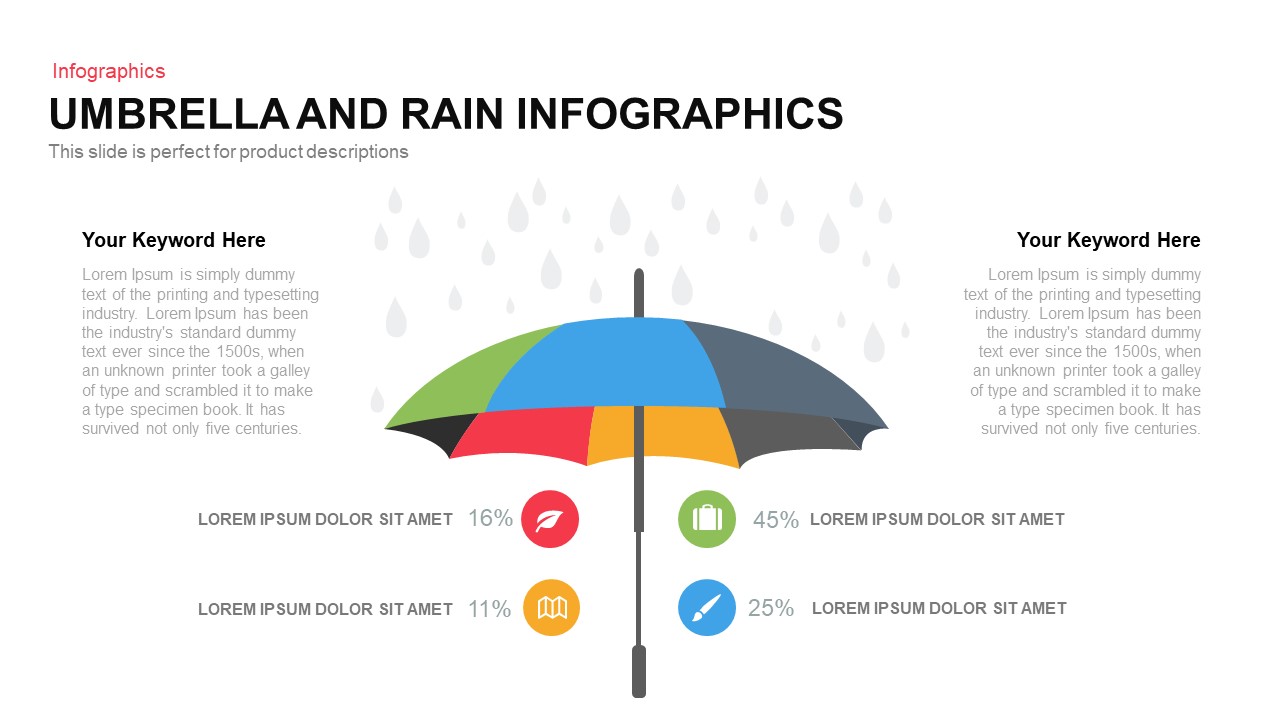
Umbrella and Rain Infographic Metrics Template for PowerPoint & Google Slides
Comparison
Comprehensive Recruitment Metrics Report Template for PowerPoint & Google Slides
Recruitment
Colorful Block Infographic Metrics Slide Template for PowerPoint & Google Slides
Infographics
Benchmarking Metrics Comparison Slide Template for PowerPoint & Google Slides
Pie/Donut
Project Status Dashboard with Metrics Template for PowerPoint & Google Slides
Project Status
Circular Image Gallery & KPI Metrics Template for PowerPoint & Google Slides
Pie/Donut
Statistics & Global Metrics Infographic Template for PowerPoint & Google Slides
Bar/Column
Agriculture Infographics Slide with Progress Rings & Metrics Template for PowerPoint & Google Slides
Pie/Donut
Annual Recurring Revenue Metrics Template for PowerPoint & Google Slides
Bar/Column
Social Media Analysis Metrics Slide Deck Template for PowerPoint & Google Slides
Digital Marketing
LinkedIn Metrics Infographic Slide Template for PowerPoint & Google Slides
Digital Marketing
Facebook Social Metrics Infographic Template for PowerPoint & Google Slides
Graphics
Instagram Infographic Metrics Slide Template for PowerPoint & Google Slides
Marketing
Mastodon Metrics Infographic Dashboard Template for PowerPoint & Google Slides
Business Report
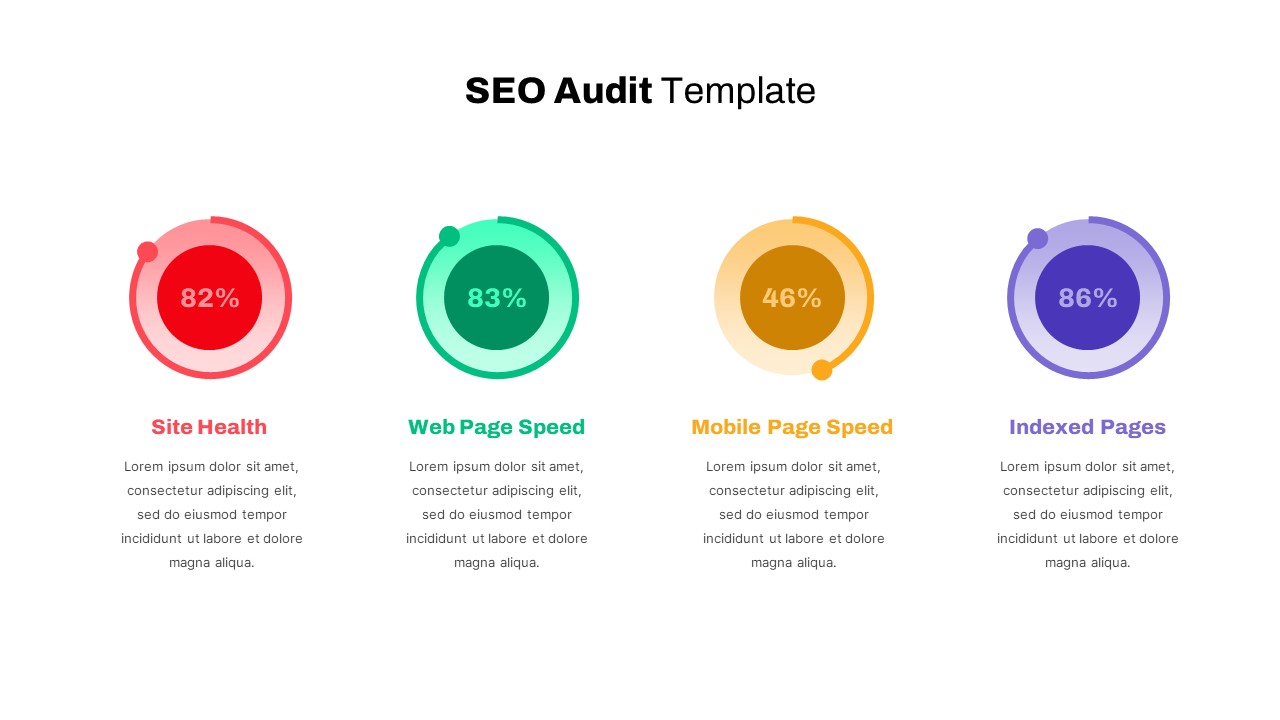
Detailed SEO Audit Metrics Overview Template for PowerPoint & Google Slides
Circular
Free Editable U.S. Map with Regional Metrics Template for PowerPoint & Google Slides
World Maps
Free
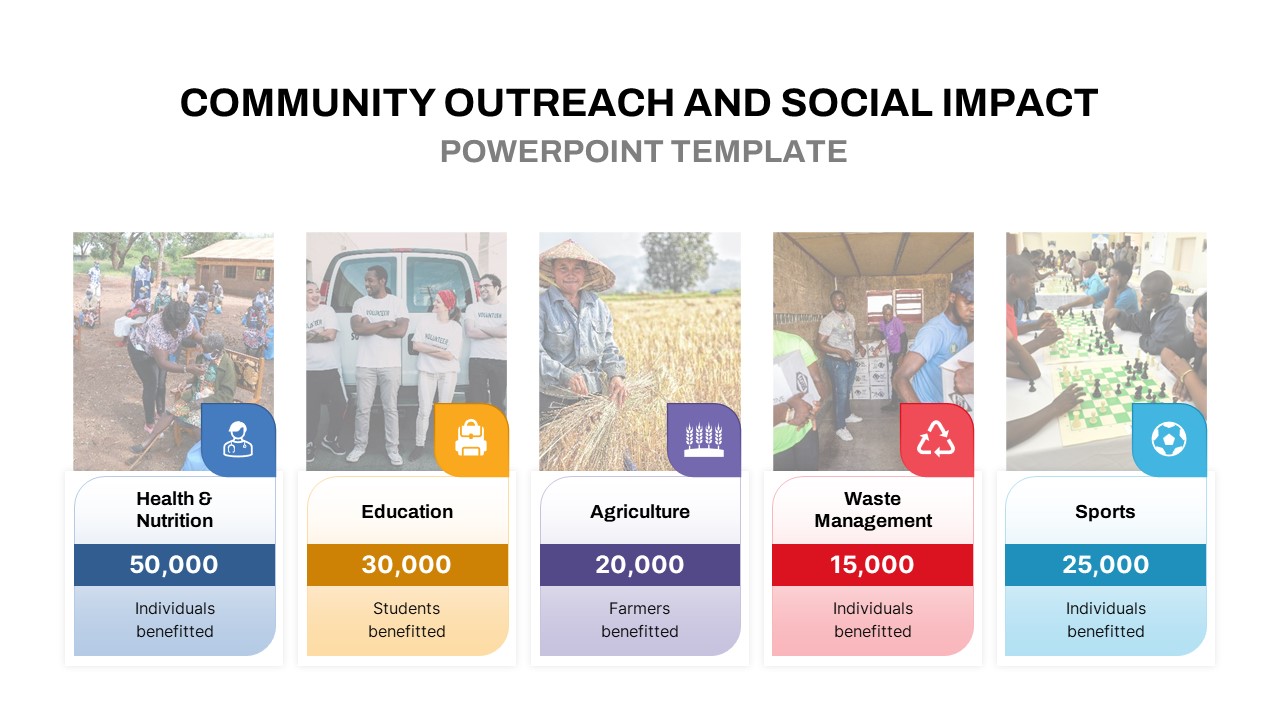
Community Outreach Impact Metrics Template for PowerPoint & Google Slides
Accomplishment
DevOps KPI Dashboard Performance Metrics Template for PowerPoint & Google Slides
Software Development
Purchasing KPI Metrics Dashboard Template for PowerPoint & Google Slides
Business Report
Financial Snapshot & Metrics Overview Template for PowerPoint & Google Slides
Finance
Procurement KPI Dashboard & Metrics Template for PowerPoint & Google Slides
Business Report
Market Validation Metrics Overview Template for PowerPoint & Google Slides
Business
Employee Performance Metrics Dashboard Template for PowerPoint & Google Slides
Employee Performance
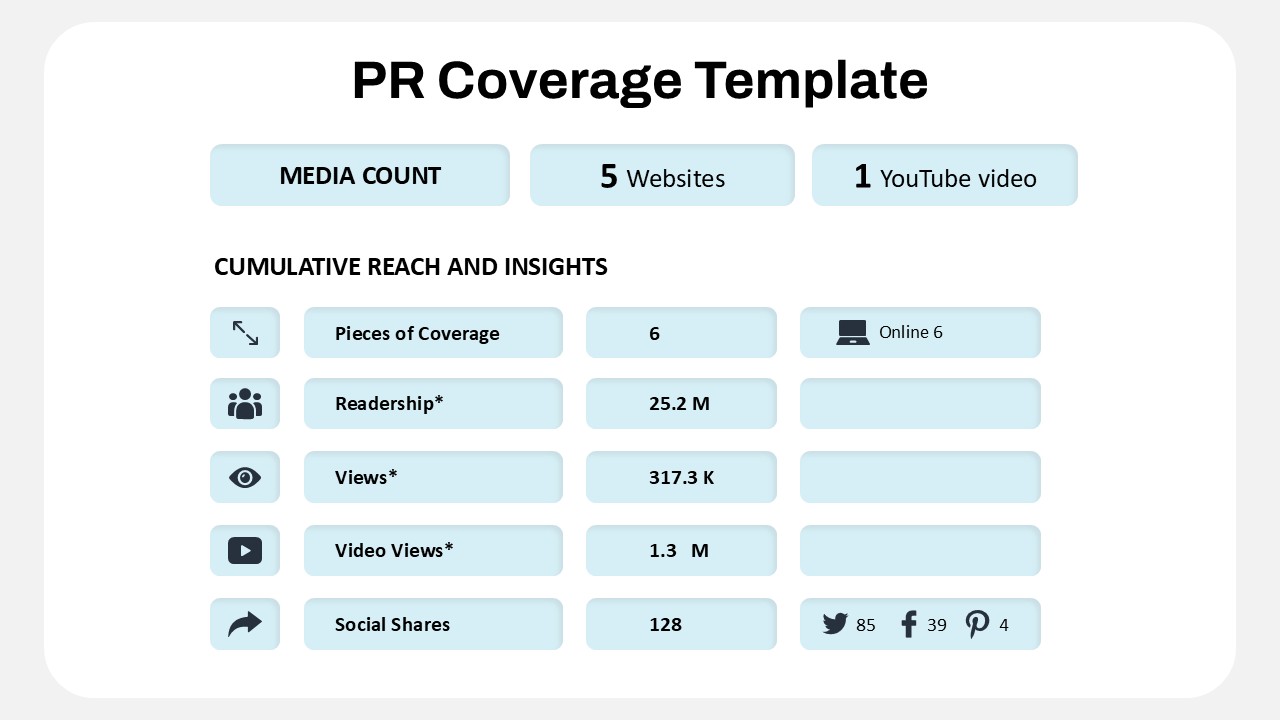
Public Relations Coverage Metrics Template for PowerPoint & Google Slides
Business Report

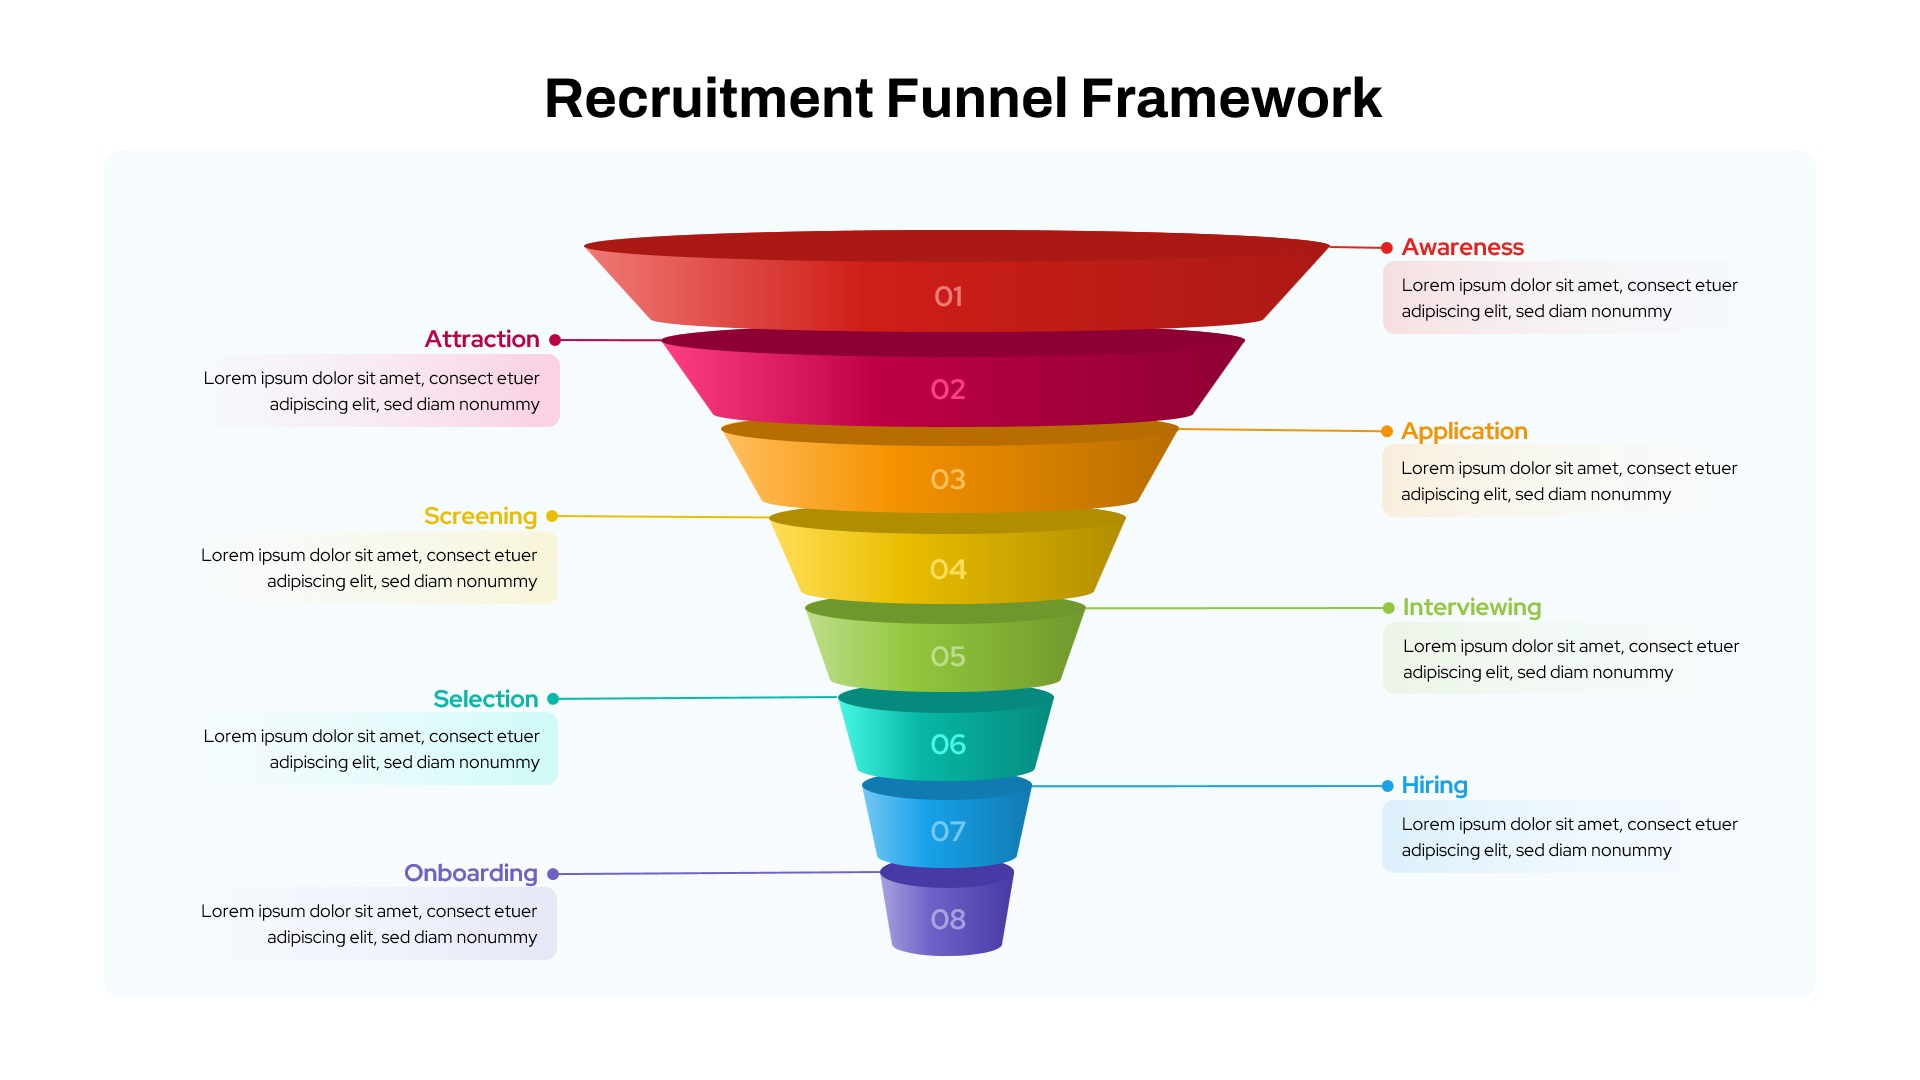
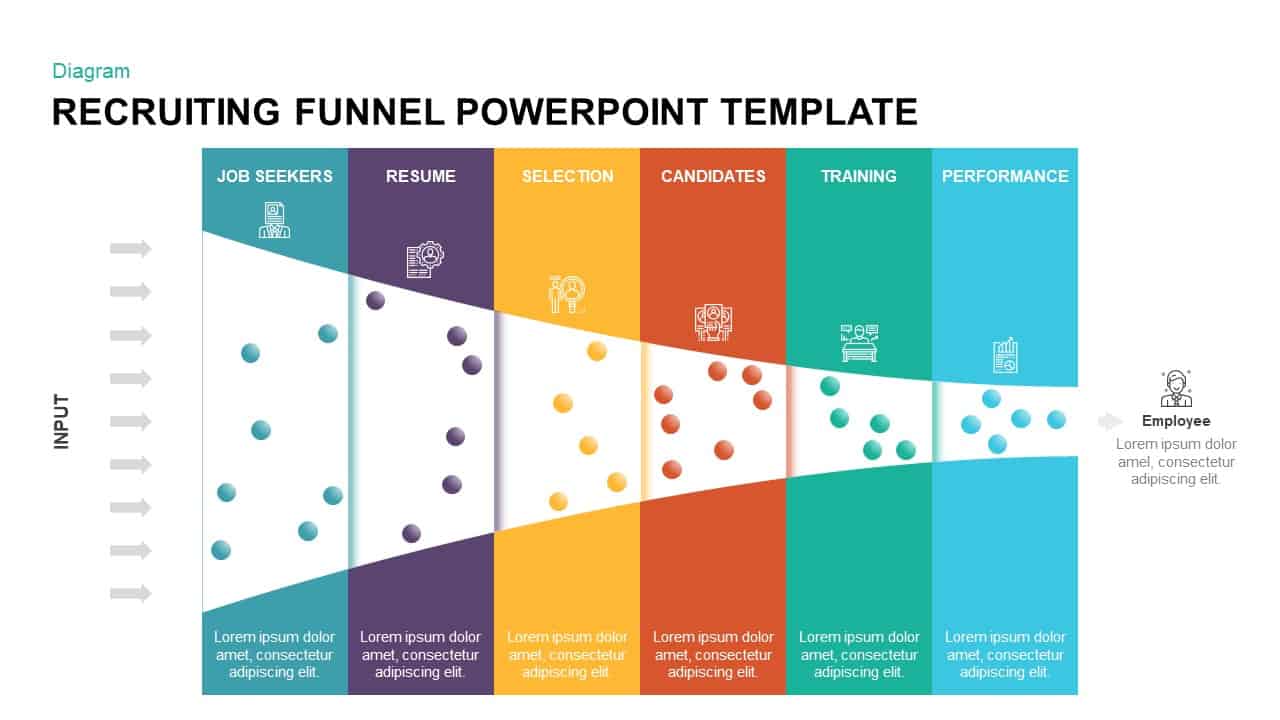
Recruitment Funnel Framework template for PowerPoint & Google Slides
Recruitment

Innovation Ambition Matrix & Funnel Strategy Slides for PowerPoint & Google Slides
Process
Sales Process Workflow Funnel Diagram PowerPoint Template for PowerPoint & Google Slides
Funnel
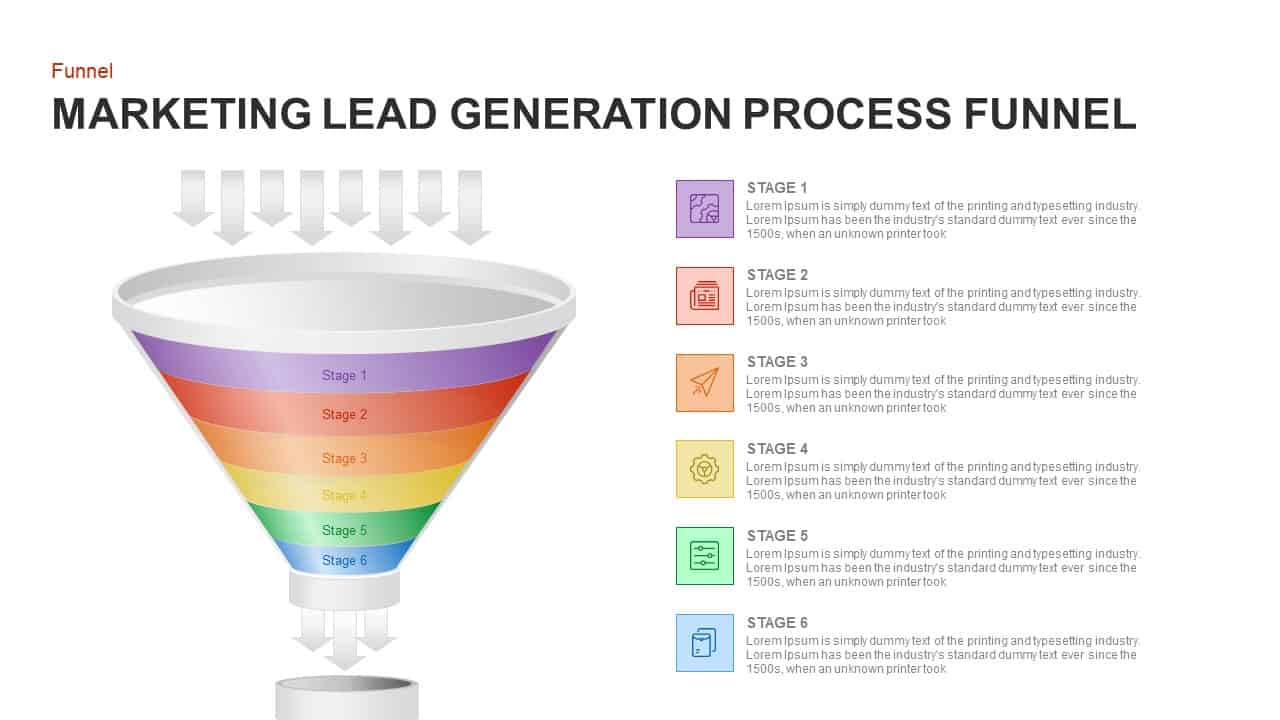
Marketing Lead Generation Process Funnel PowerPoint Template for PowerPoint & Google Slides
Funnel
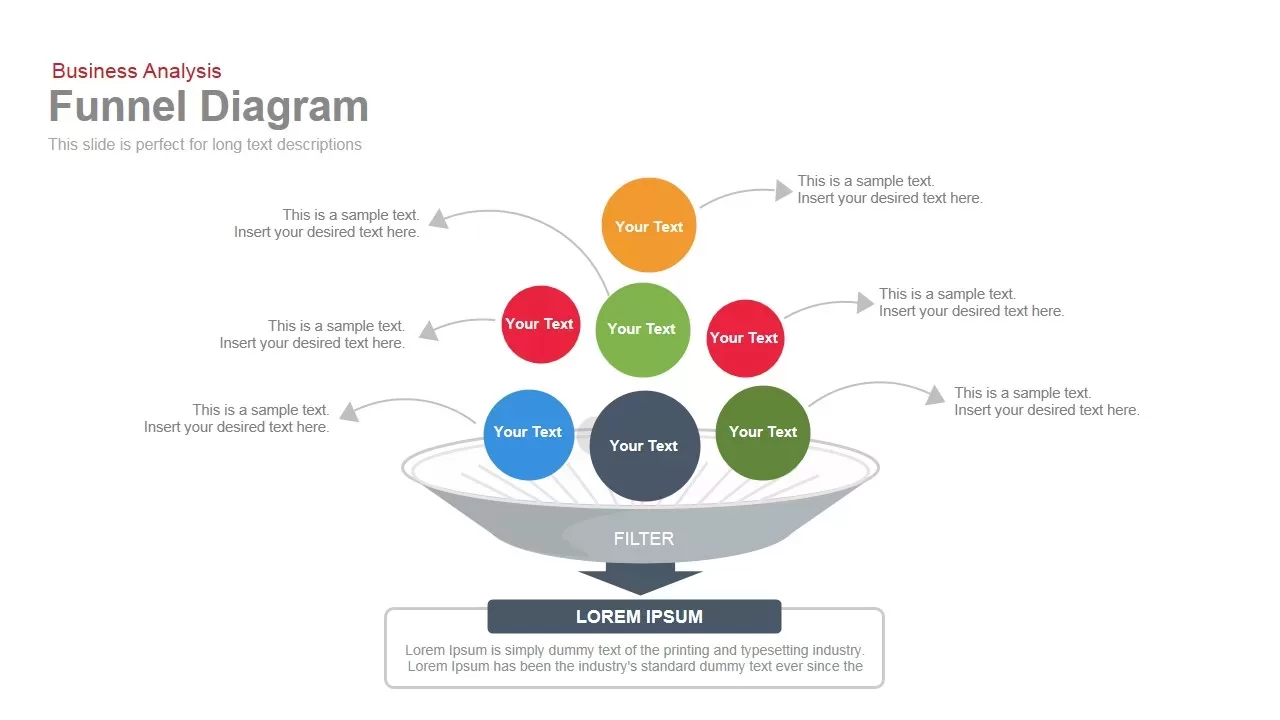
Business Funnel Diagram template for PowerPoint & Google Slides
Funnel
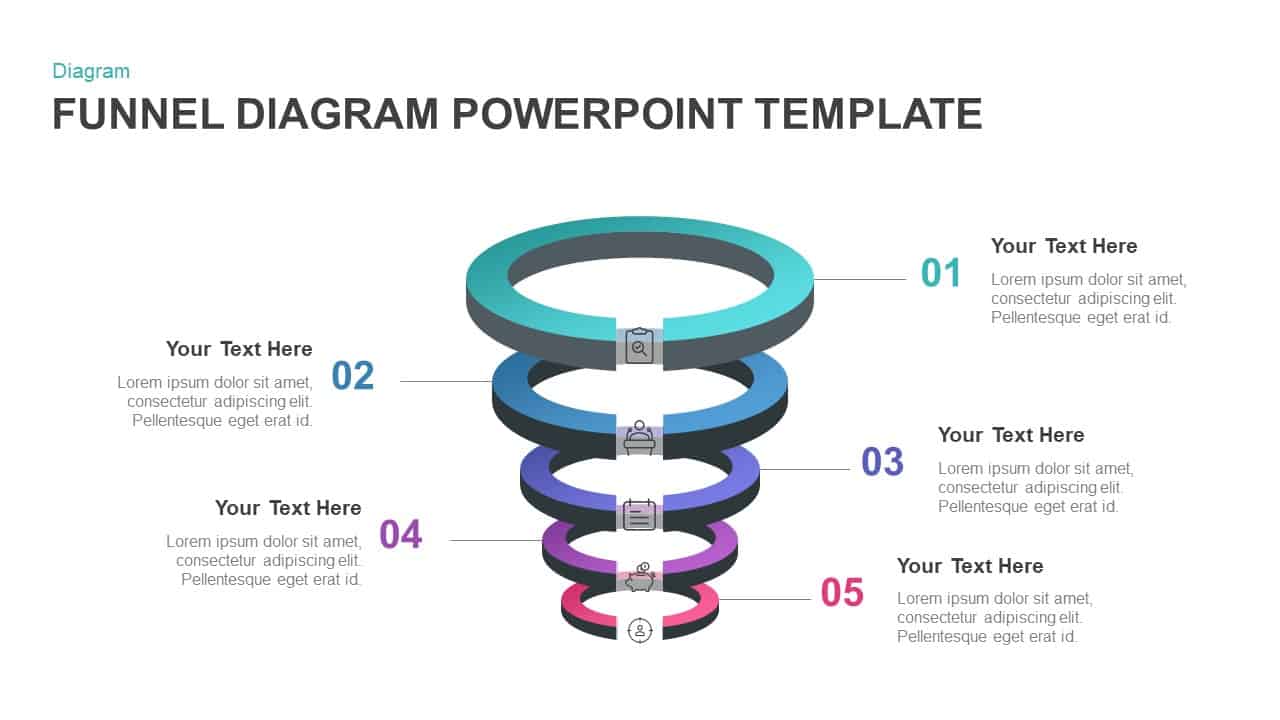
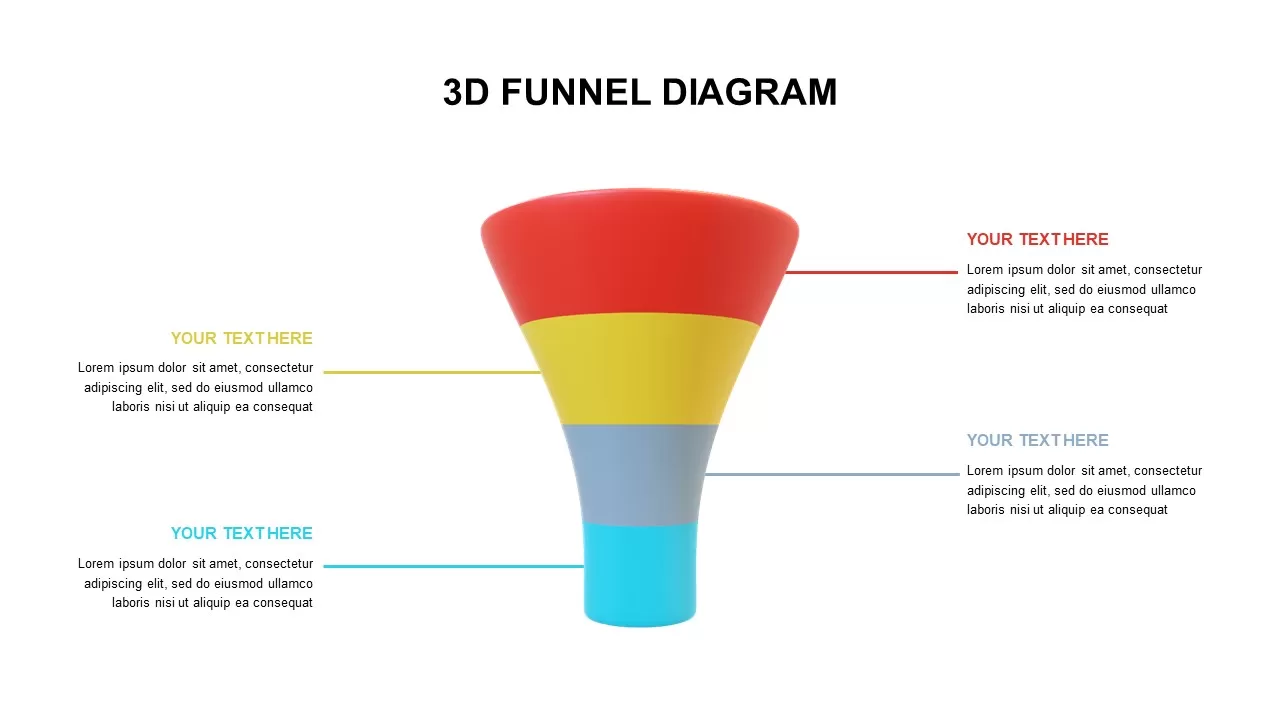
Professional 3D Funnel Infographic Template for PowerPoint & Google Slides
Funnel
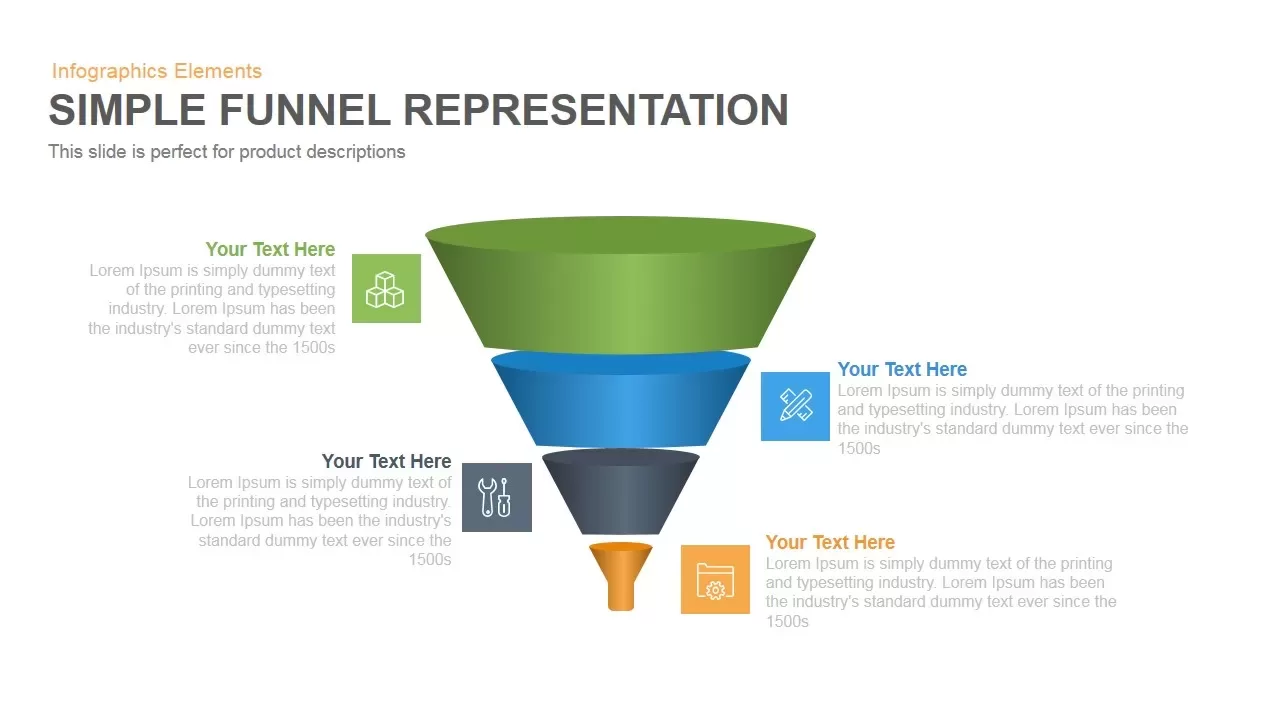
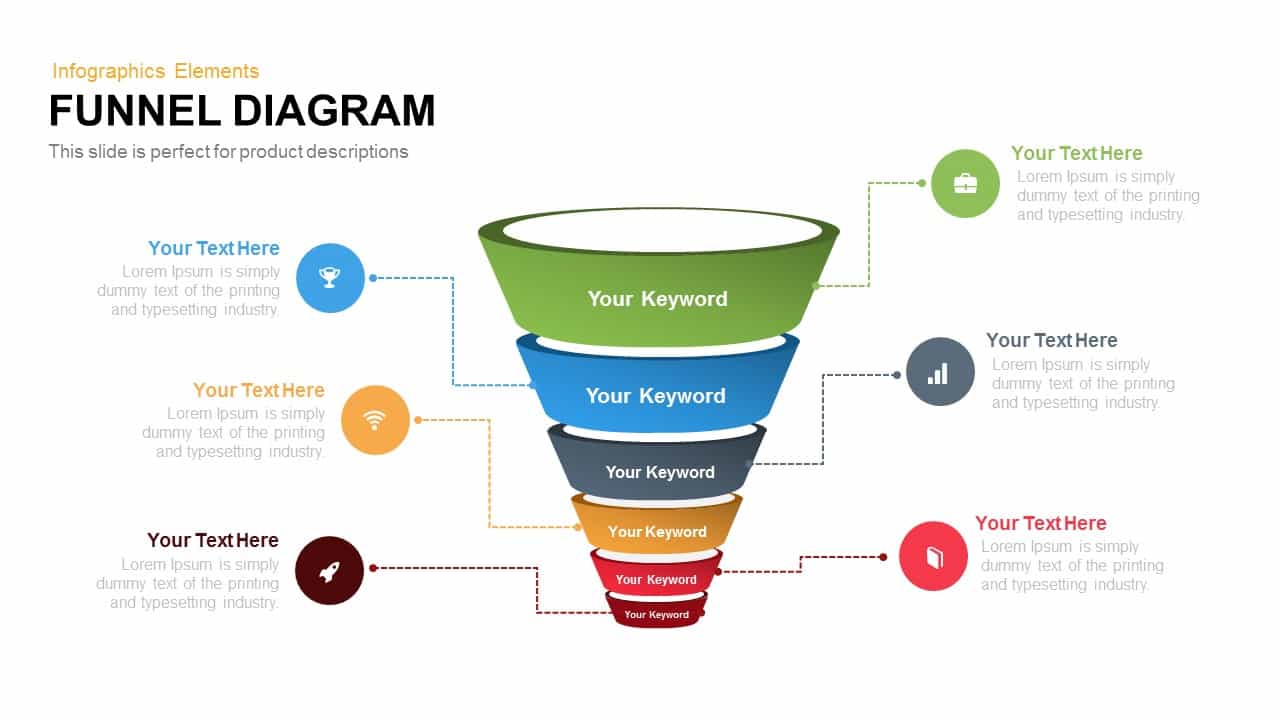
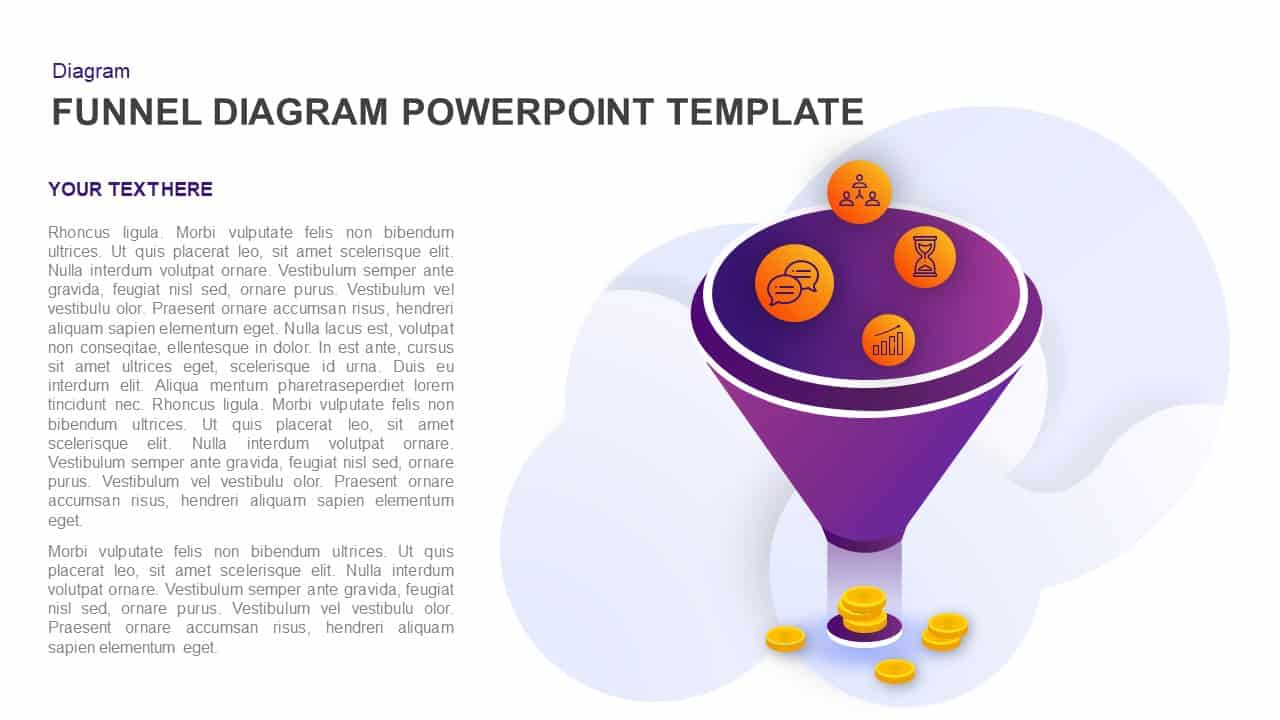
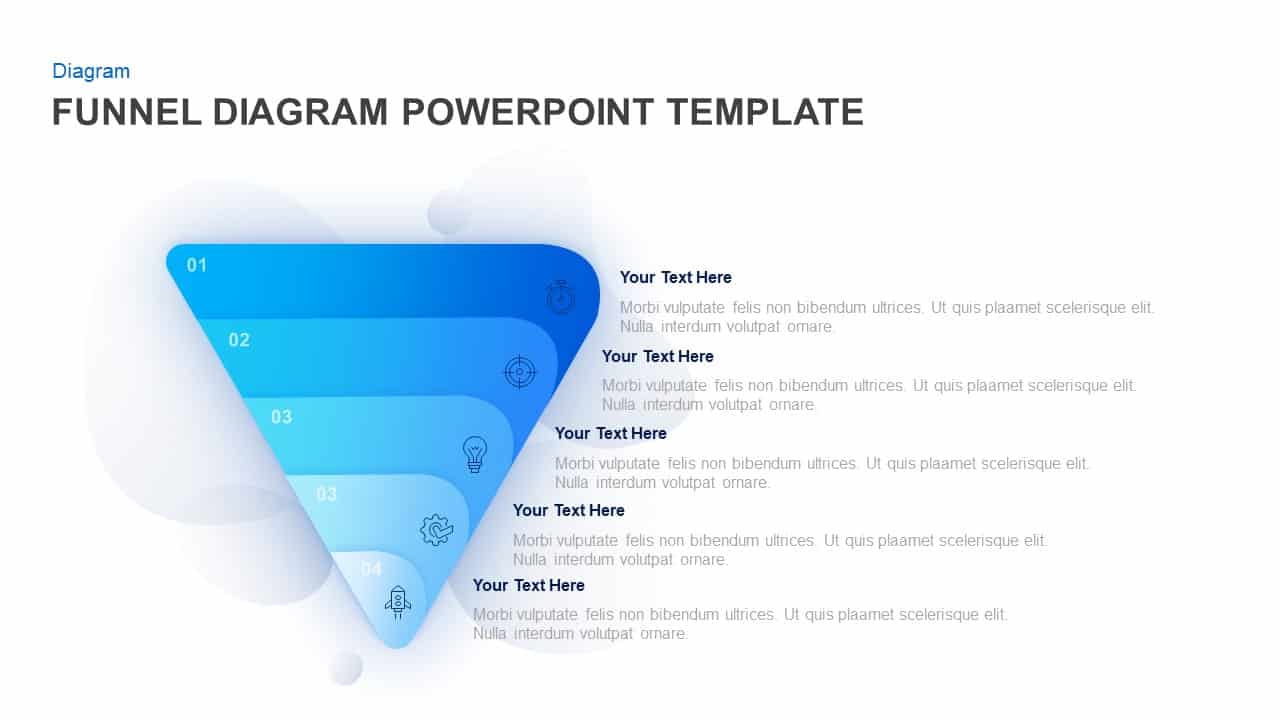
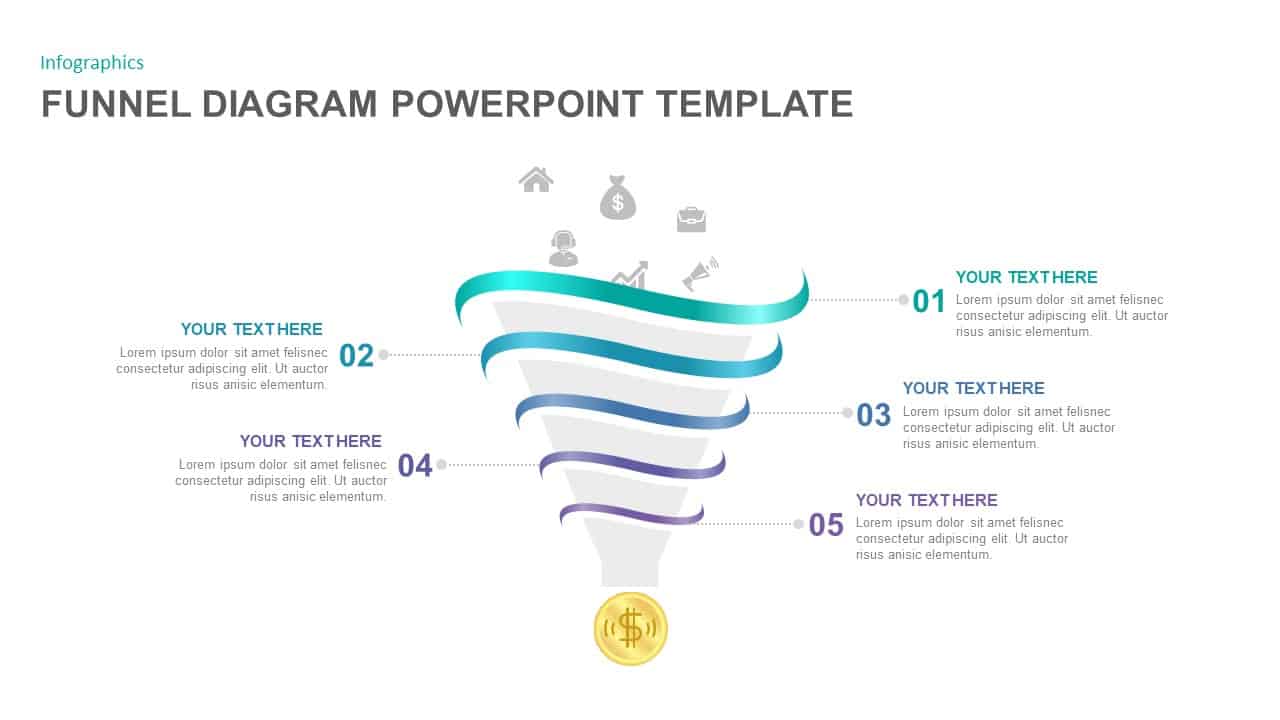
Funnel Diagram Template for PowerPoint & Google Slides
Infographics
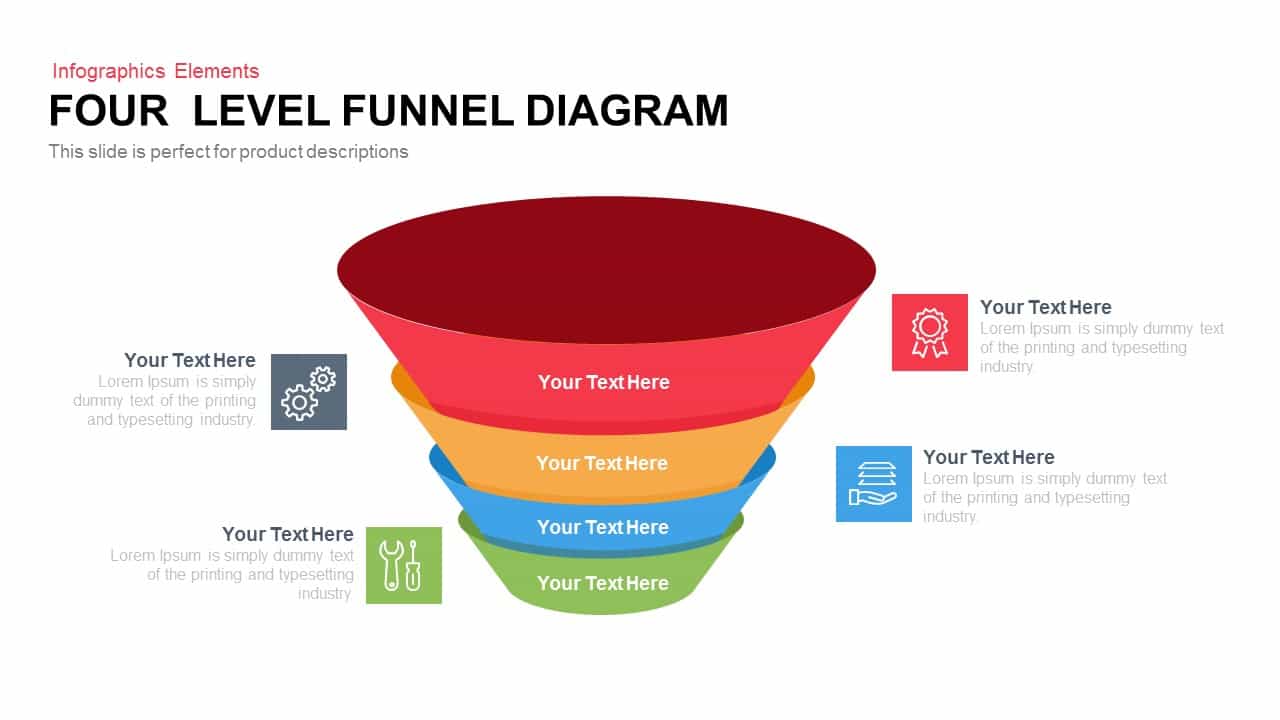
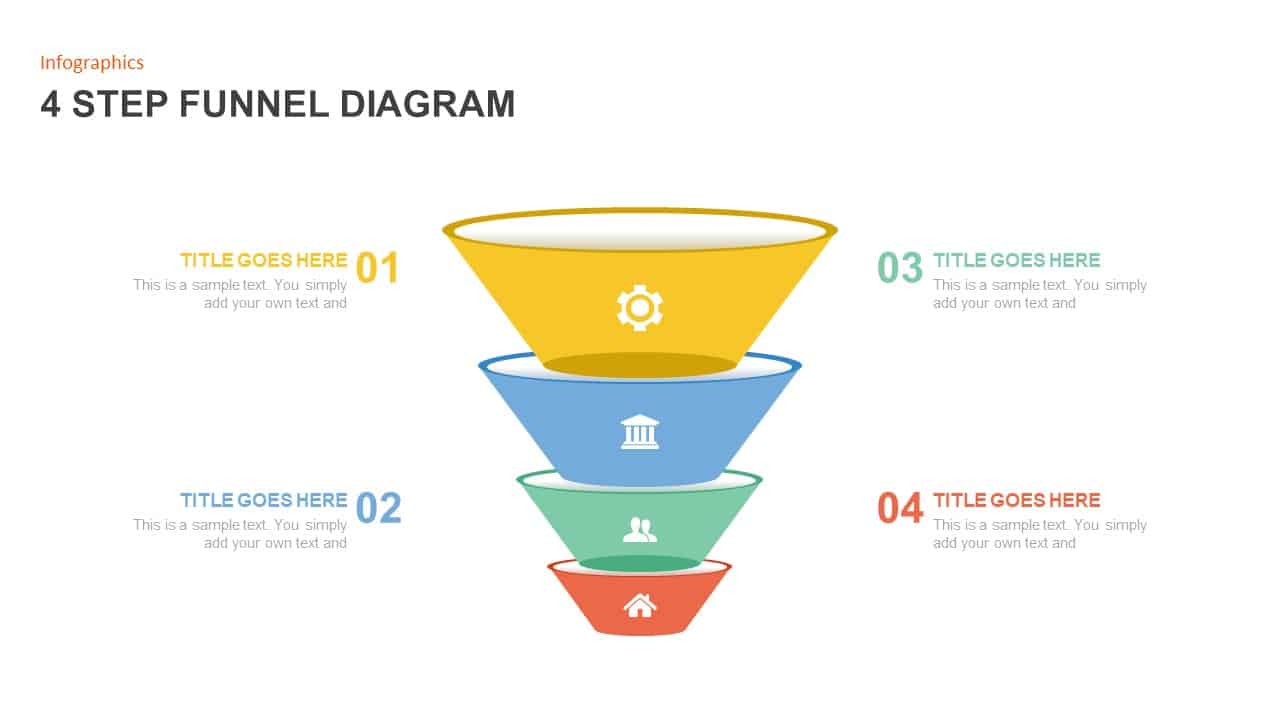
4 Level Funnel Diagram Template for PowerPoint & Google Slides
Funnel
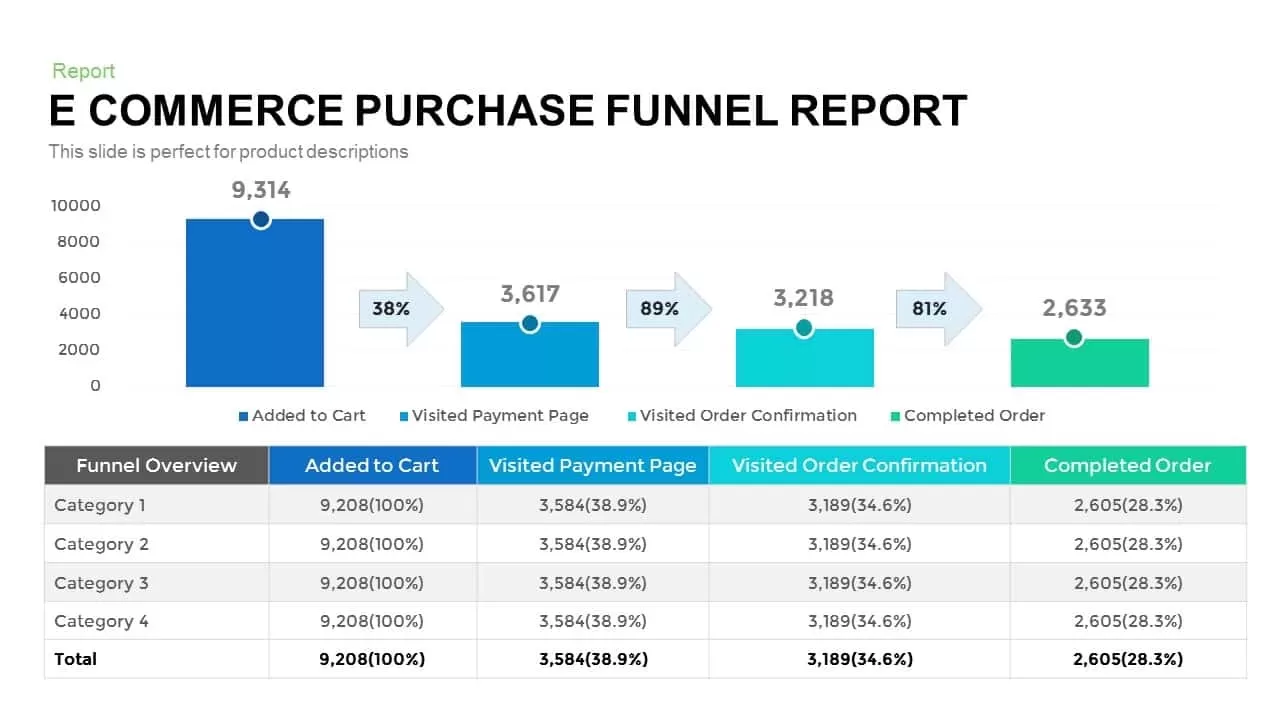
E-commerce Purchase Funnel Report template for PowerPoint & Google Slides
Funnel
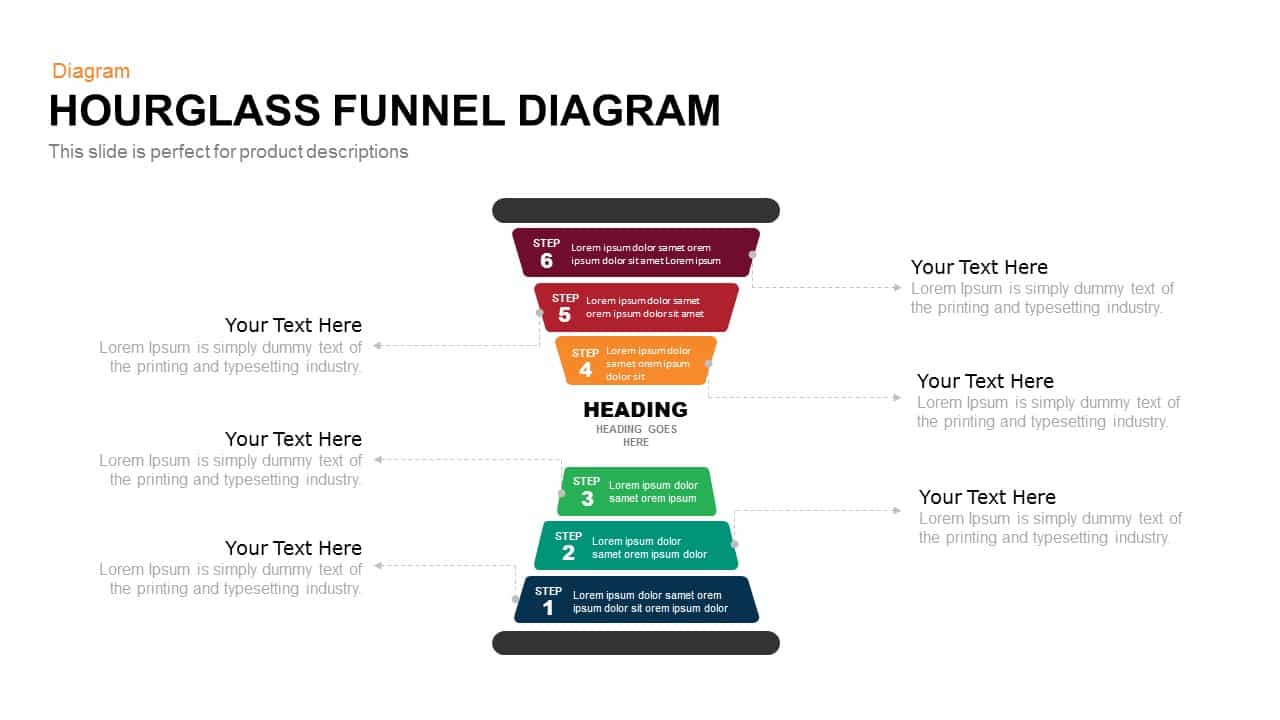
Hourglass Funnel Diagram Process Template for PowerPoint & Google Slides
Funnel
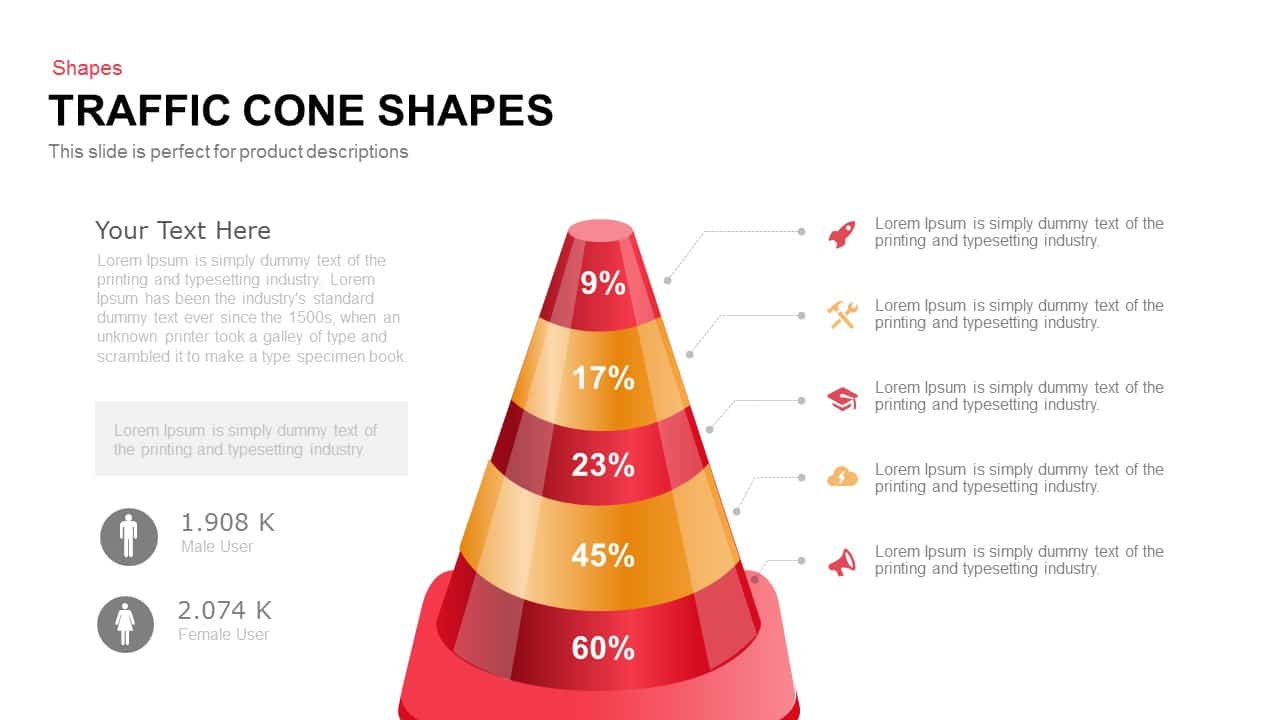
Traffic Cone Funnel Diagram Slide Template for PowerPoint & Google Slides
Funnel
Professional Four-Stage Funnel Diagram Template for PowerPoint & Google Slides
Funnel
Four and Five-Stage Funnel Diagram Template for PowerPoint & Google Slides
Funnel
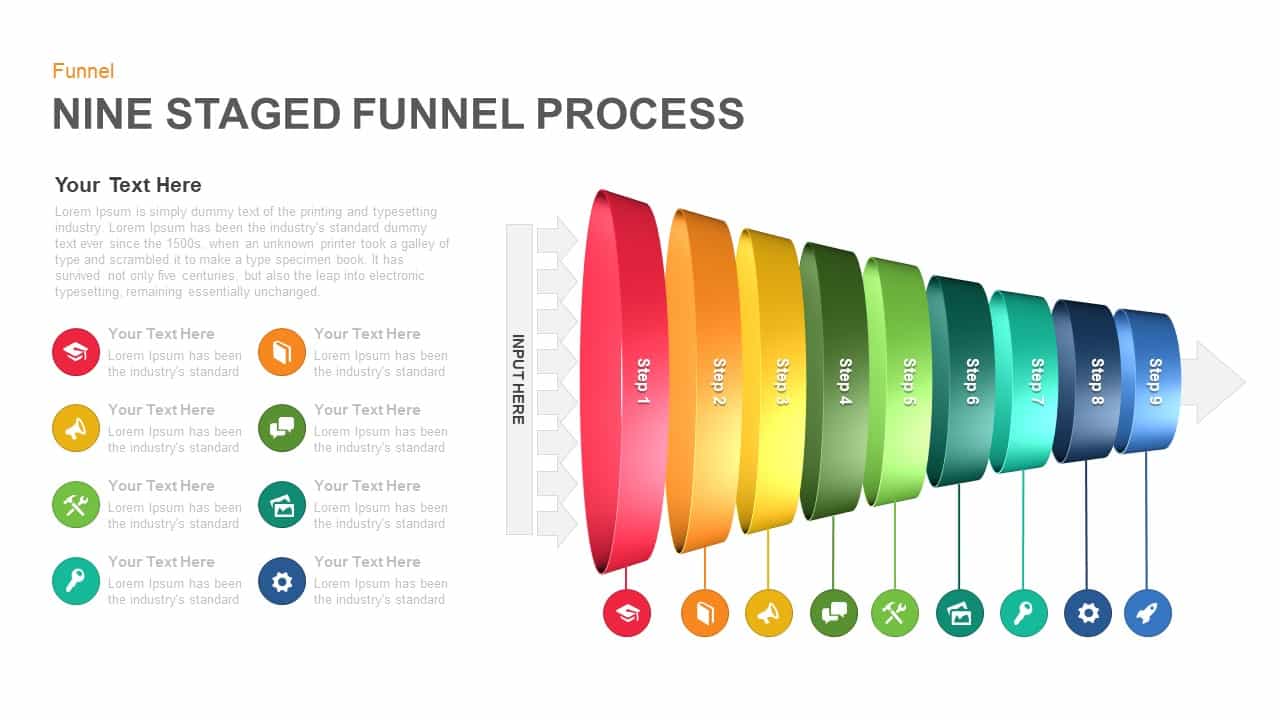
Nine-Stage 3D Funnel Process Diagram Template for PowerPoint & Google Slides
Funnel
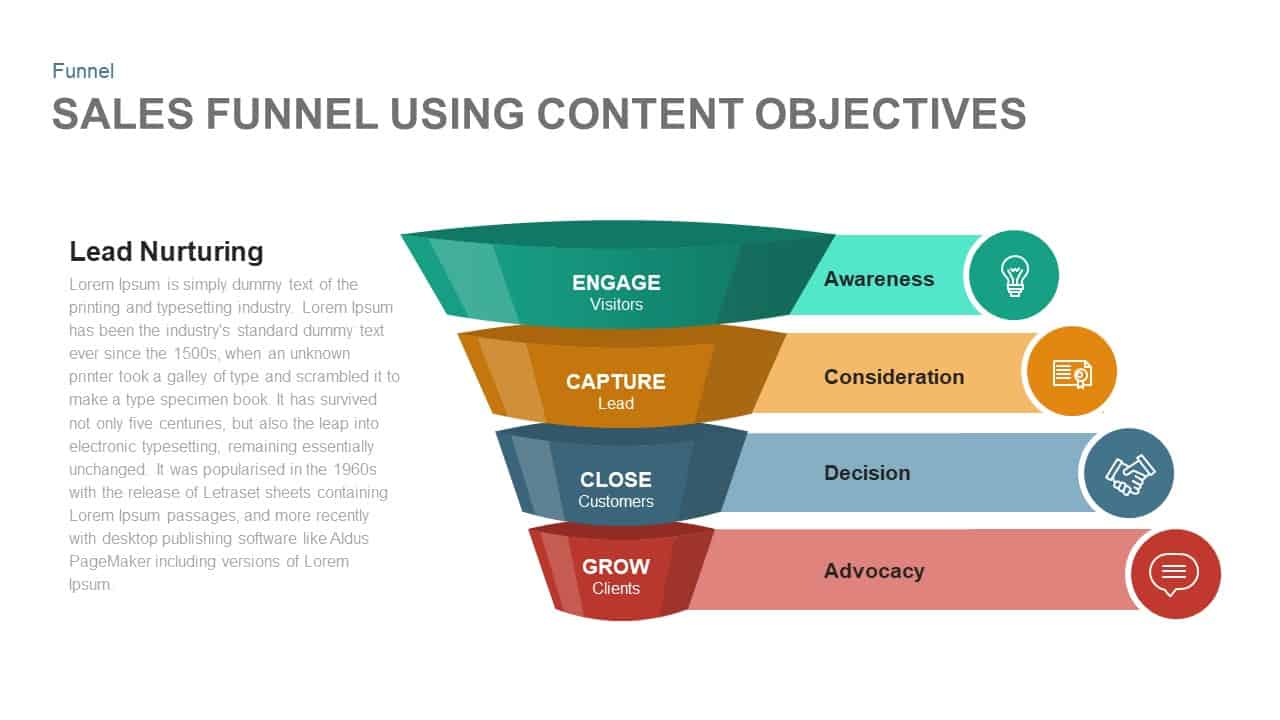
Sales Funnel Using Content Objectives Template for PowerPoint & Google Slides
Funnel
Three Level Funnel Process Diagram Template for PowerPoint & Google Slides
Funnel

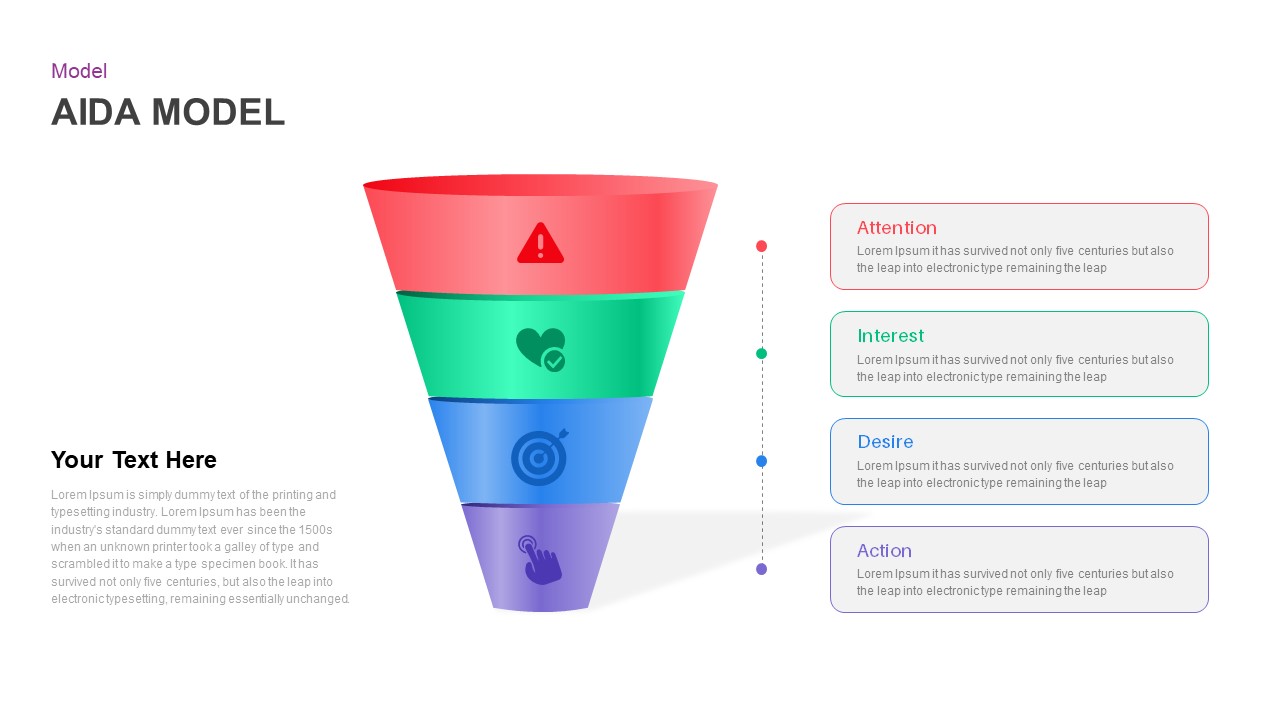
AIDA Model Funnel Thumb Diagram Template for PowerPoint & Google Slides
Process
A/B Testing Funnel Diagram Template for PowerPoint & Google Slides
Digital Marketing
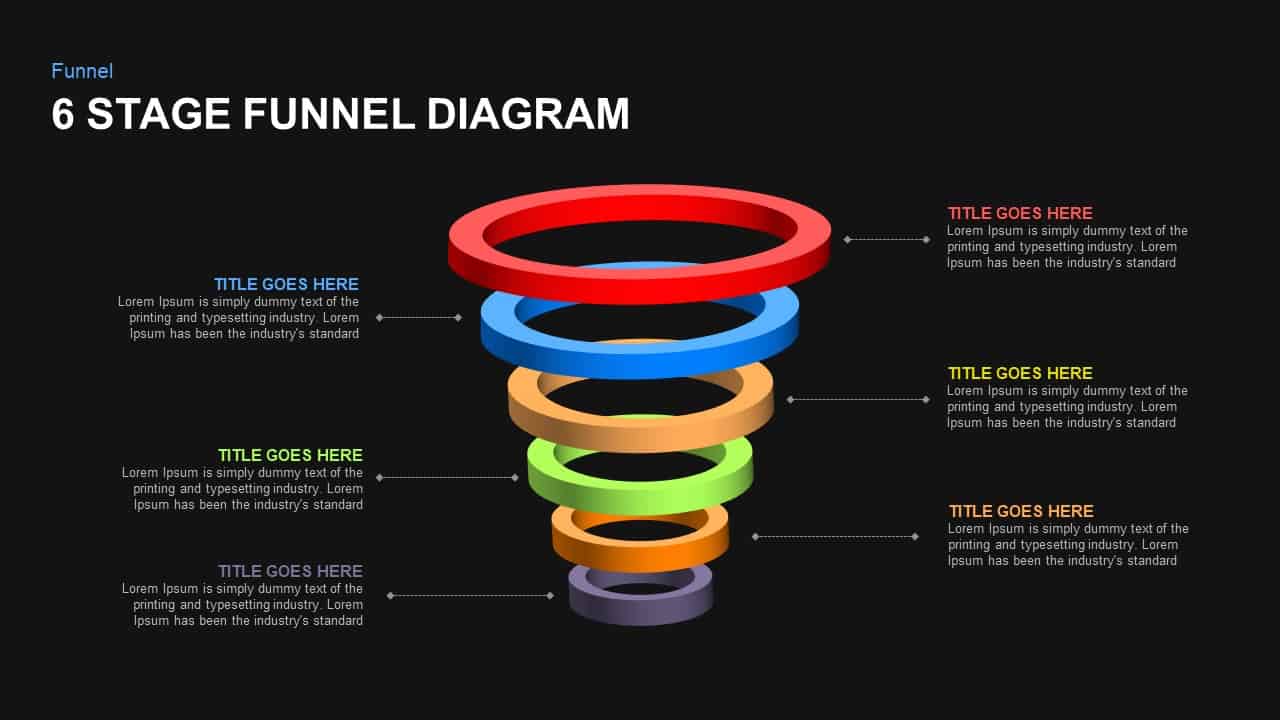
6-Stage Funnel Diagram Infographic Template for PowerPoint & Google Slides
Funnel
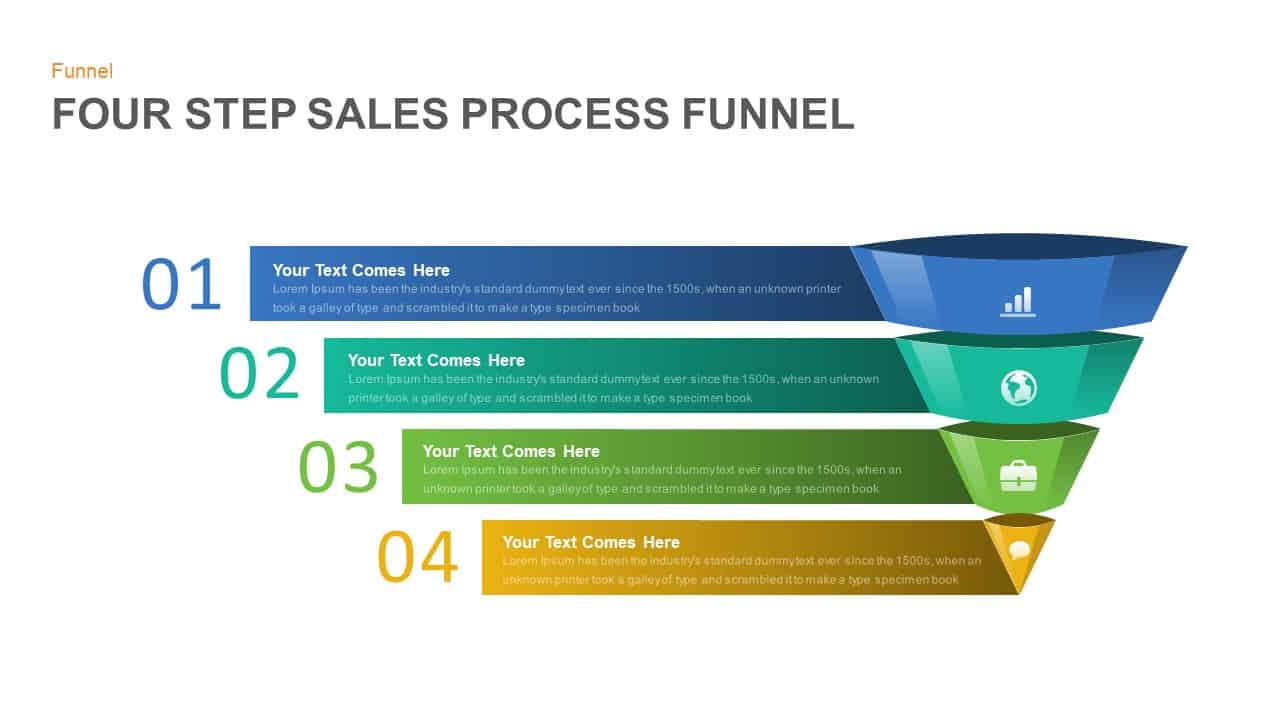
Four Step Sales Process Funnel Template for PowerPoint & Google Slides
Funnel
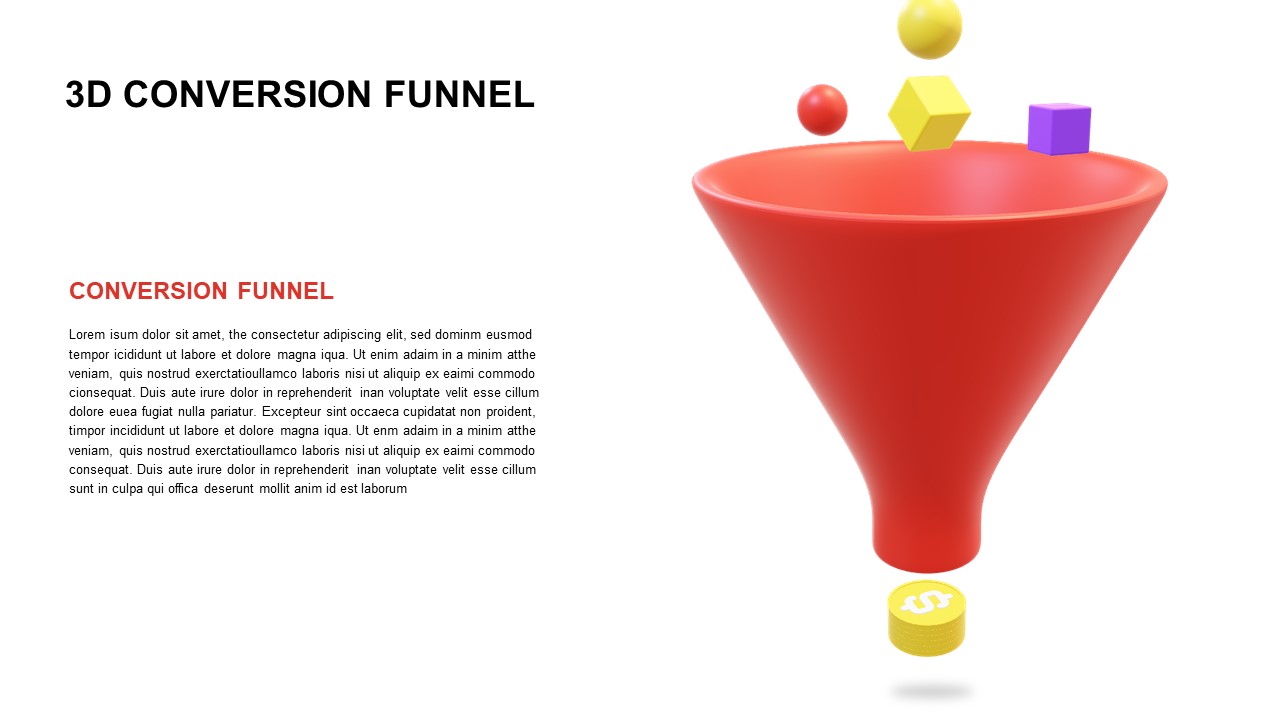
3D Conversion Funnel Diagram Infographic Template for PowerPoint & Google Slides
Funnel
AIDA Marketing Funnel Model Template for PowerPoint & Google Slides
Marketing
Gradient 5-Stage Funnel Infographic Template for PowerPoint & Google Slides
Funnel
Animated Recruiting Funnel Diagram Template for PowerPoint & Google Slides
Funnel
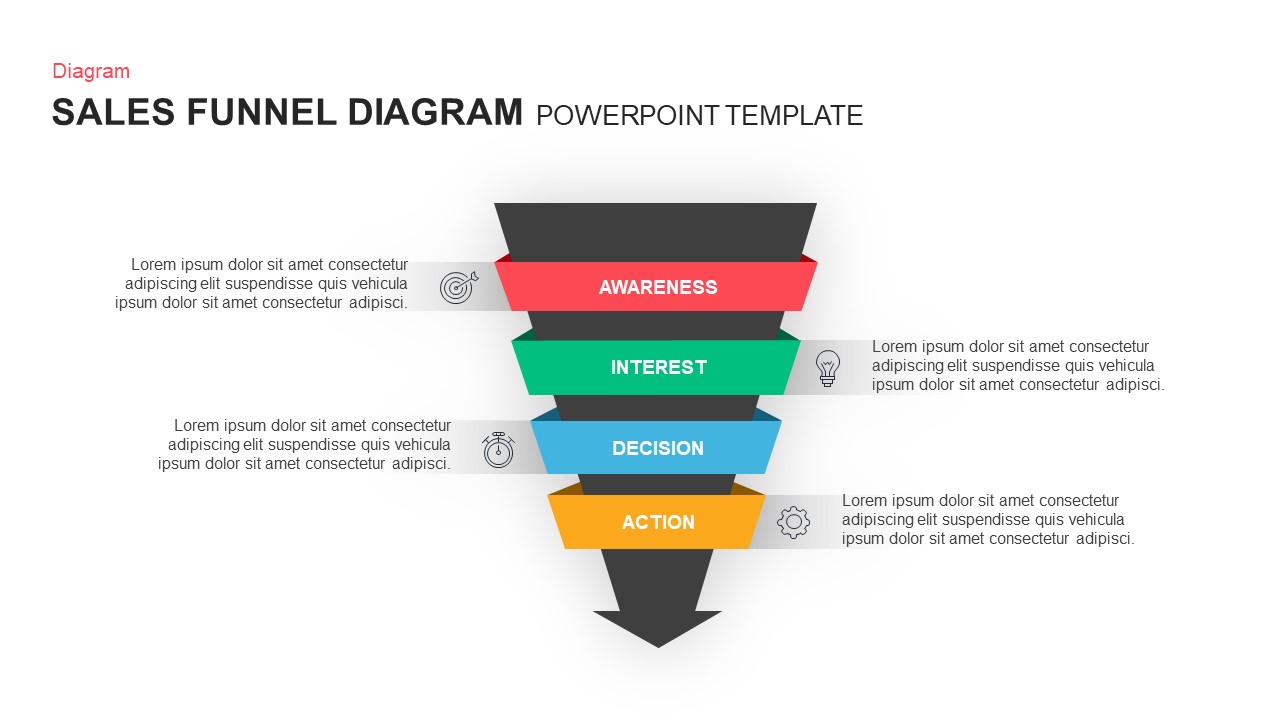
Professional Sales Funnel Diagram Template for PowerPoint & Google Slides
Funnel
Five-Step Gradient Blue Funnel Diagram Template for PowerPoint & Google Slides
Funnel
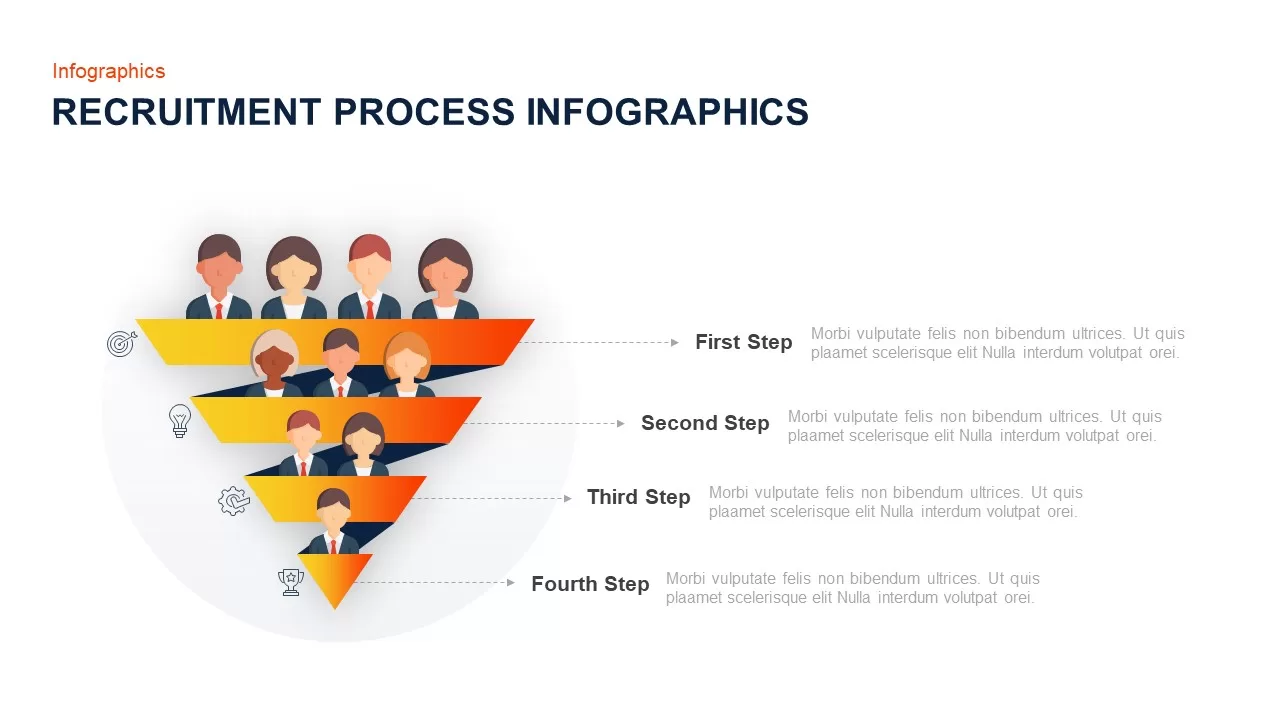
Recruitment Process Funnel Infographics Template for PowerPoint & Google Slides
Recruitment
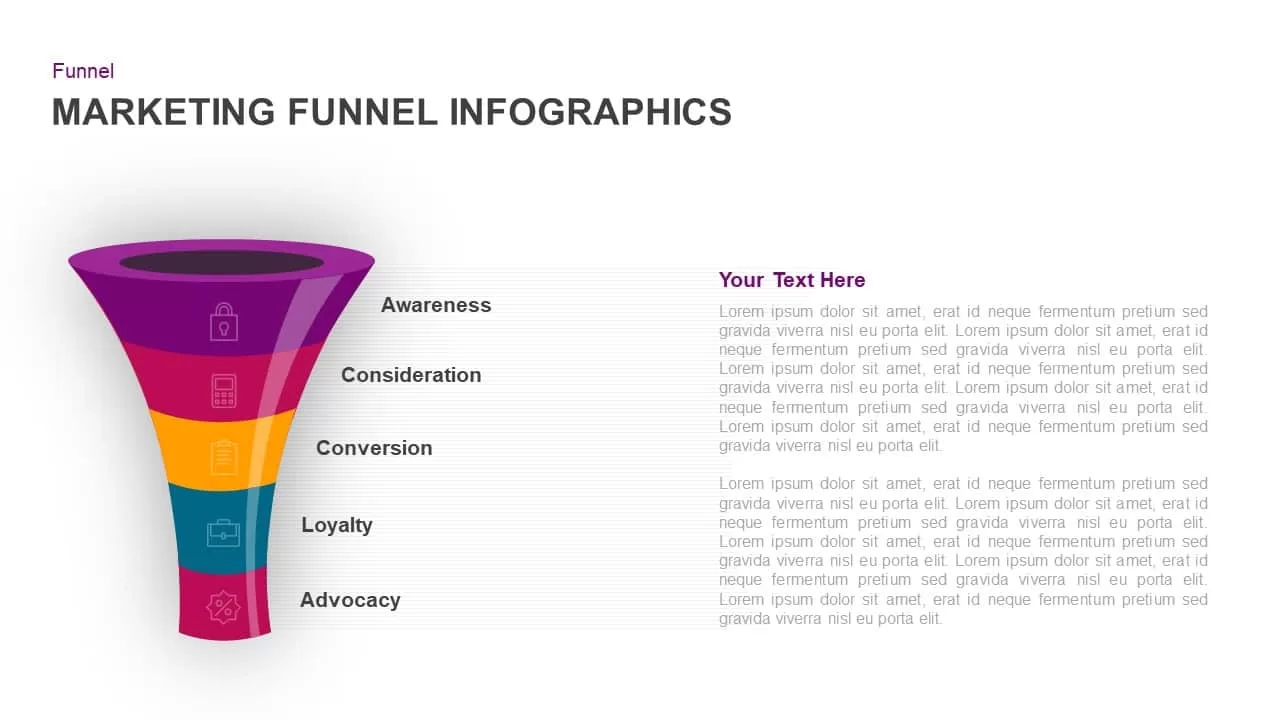
Five-Stage Marketing Funnel Infographic Template for PowerPoint & Google Slides
Funnel
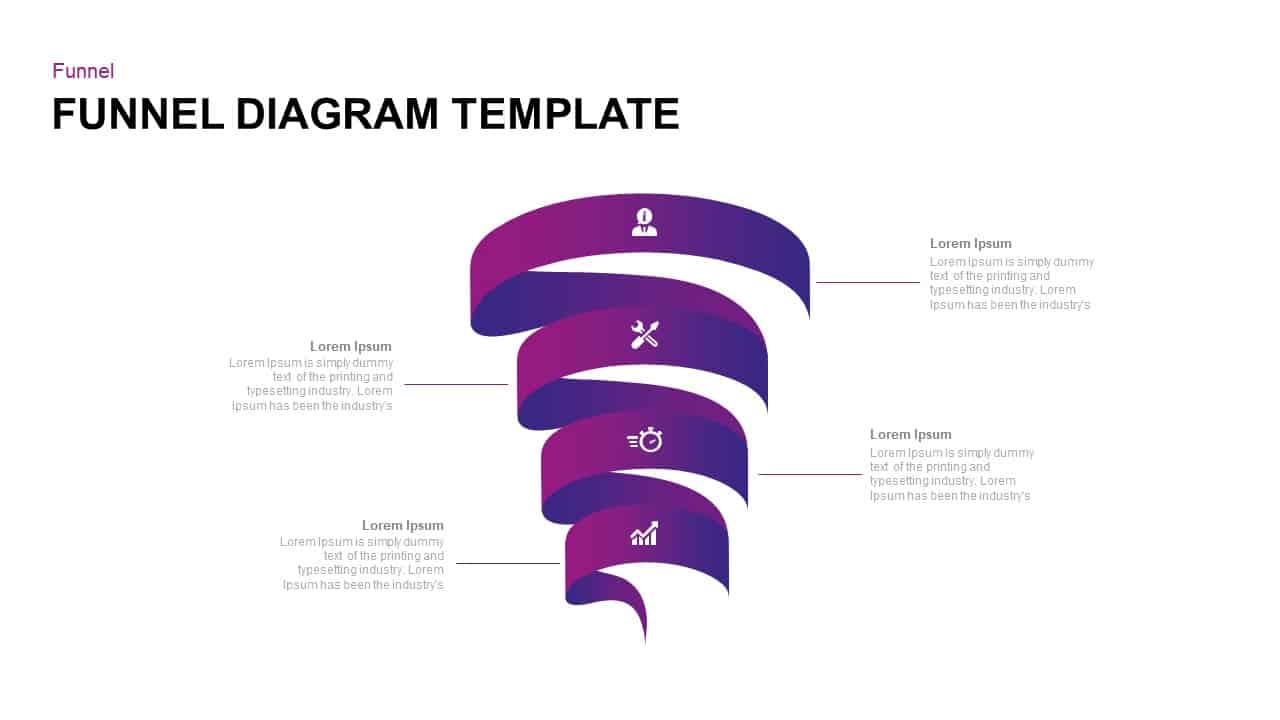
Four-Step Spiral Funnel Diagram Template for PowerPoint & Google Slides
Funnel
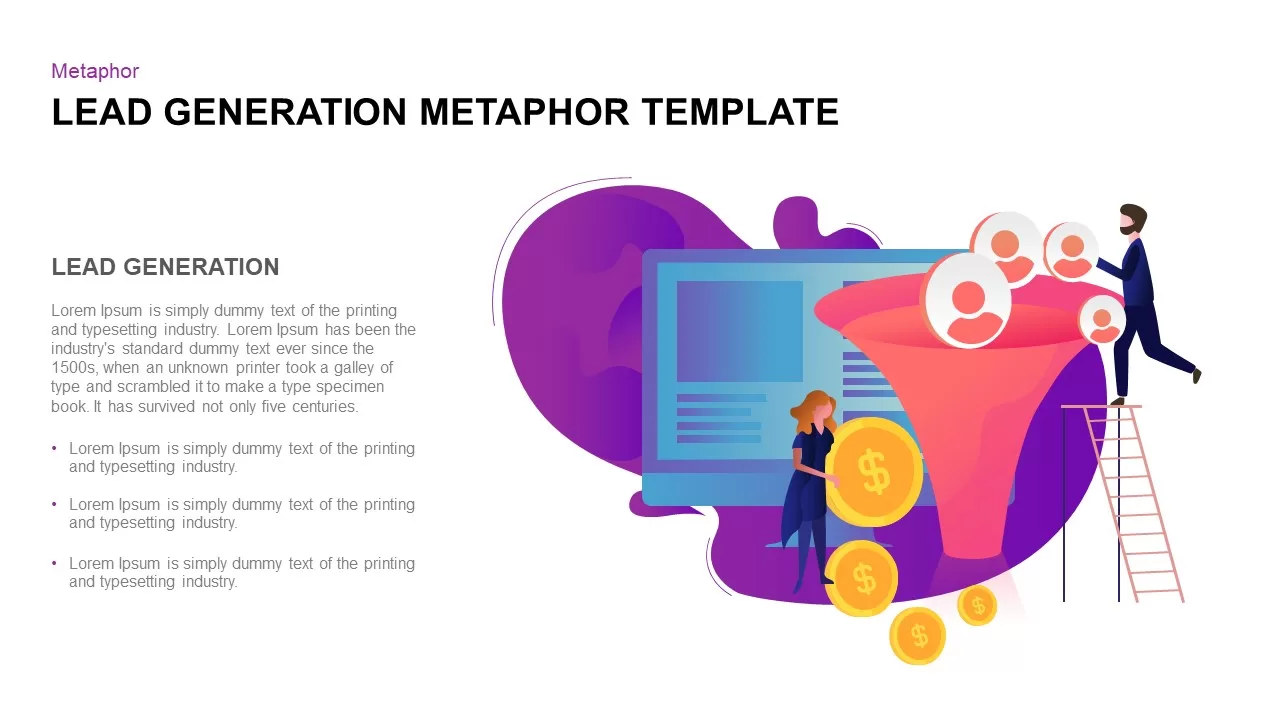
Lead Generation Funnel Metaphor Template for PowerPoint & Google Slides
Marketing Funnel
5-Step Colorful Funnel Diagram Template for PowerPoint & Google Slides
Funnel
Four-Step Funnel Infographic Pack Template for PowerPoint & Google Slides
Funnel
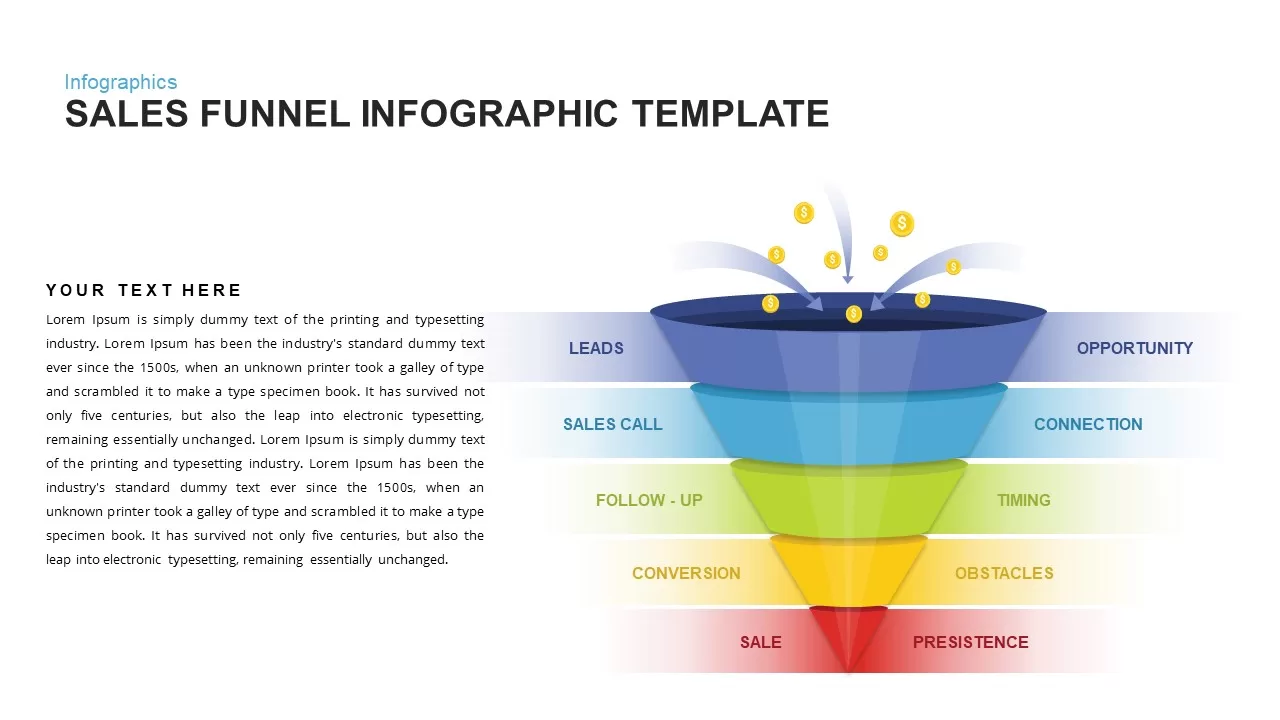
Sales Funnel Infographic Diagram Template for PowerPoint & Google Slides
Funnel
Free 4-Step 3D Funnel Diagram Template for PowerPoint & Google Slides
Funnel
Free
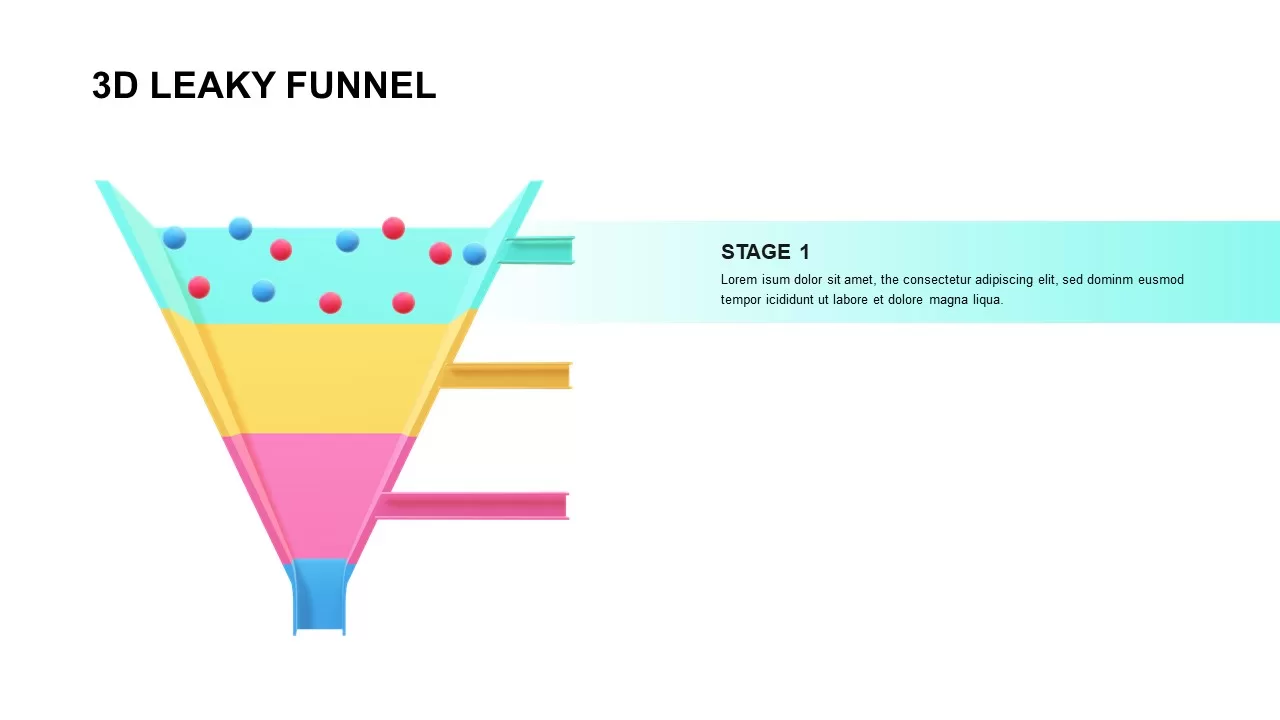
3D Leaky Funnel Diagram template for PowerPoint & Google Slides
Funnel
Free 3D Conversion Funnel Overview template for PowerPoint & Google Slides
Funnel
Free
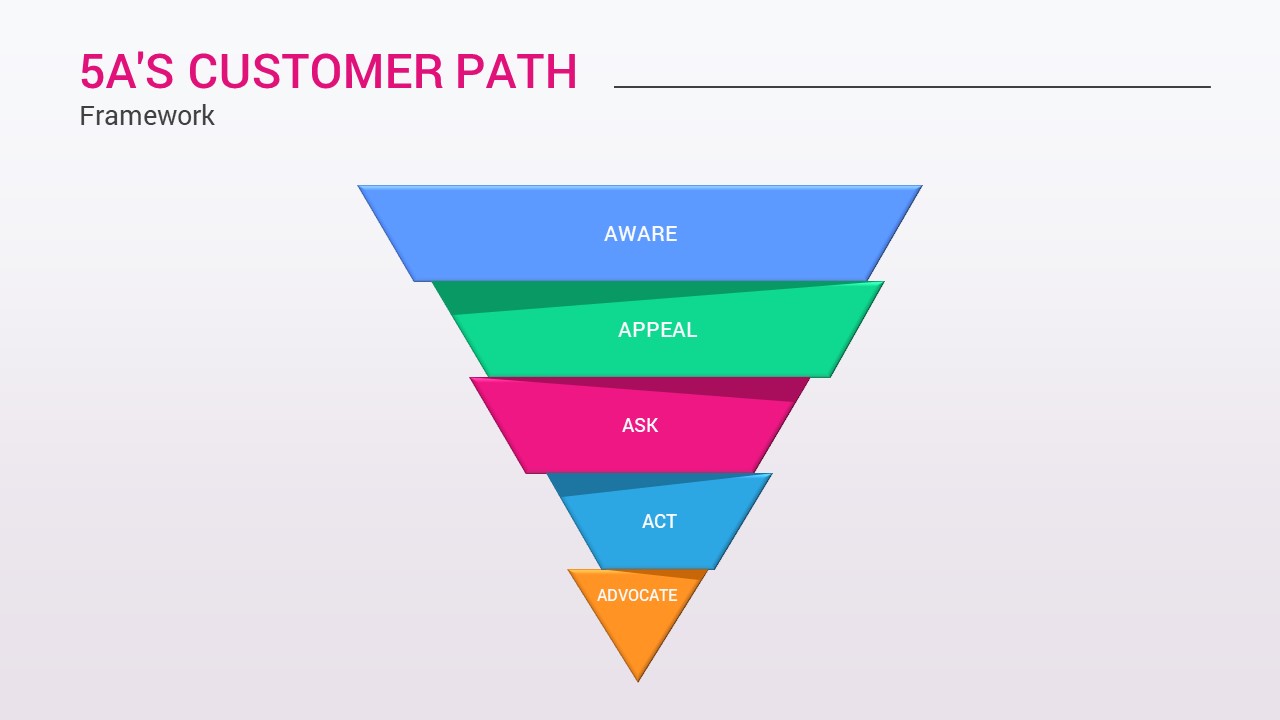
5A’s Customer Path Funnel Diagram Template for PowerPoint & Google Slides
Funnel
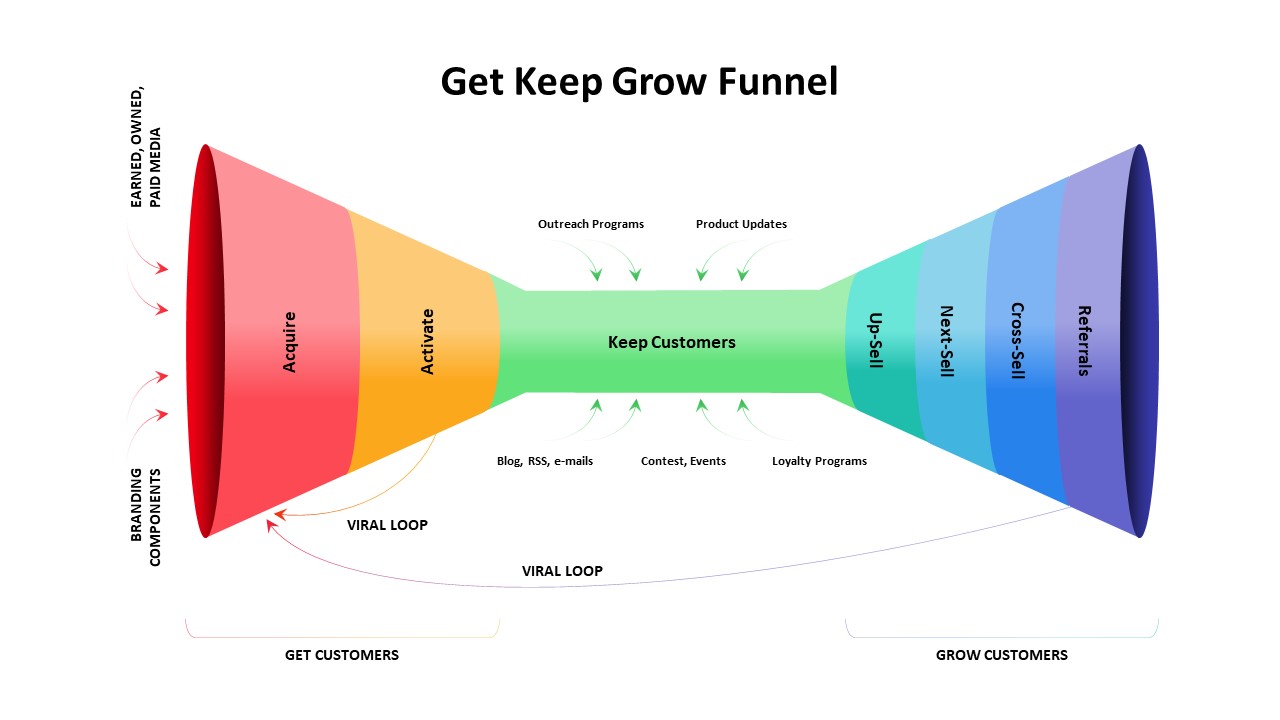
Get Keep Grow Customer Funnel Lifecycle Template for PowerPoint & Google Slides
Funnel
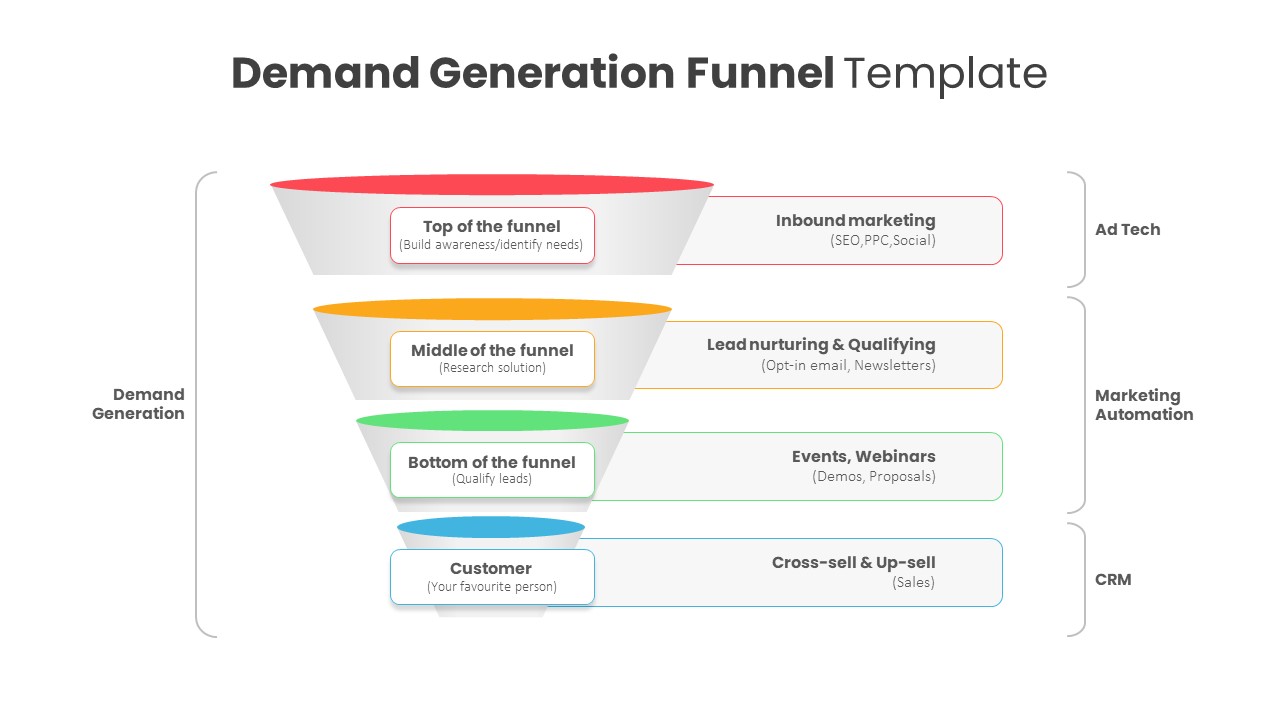
Demand Generation Funnel Diagram Template for PowerPoint & Google Slides
Funnel
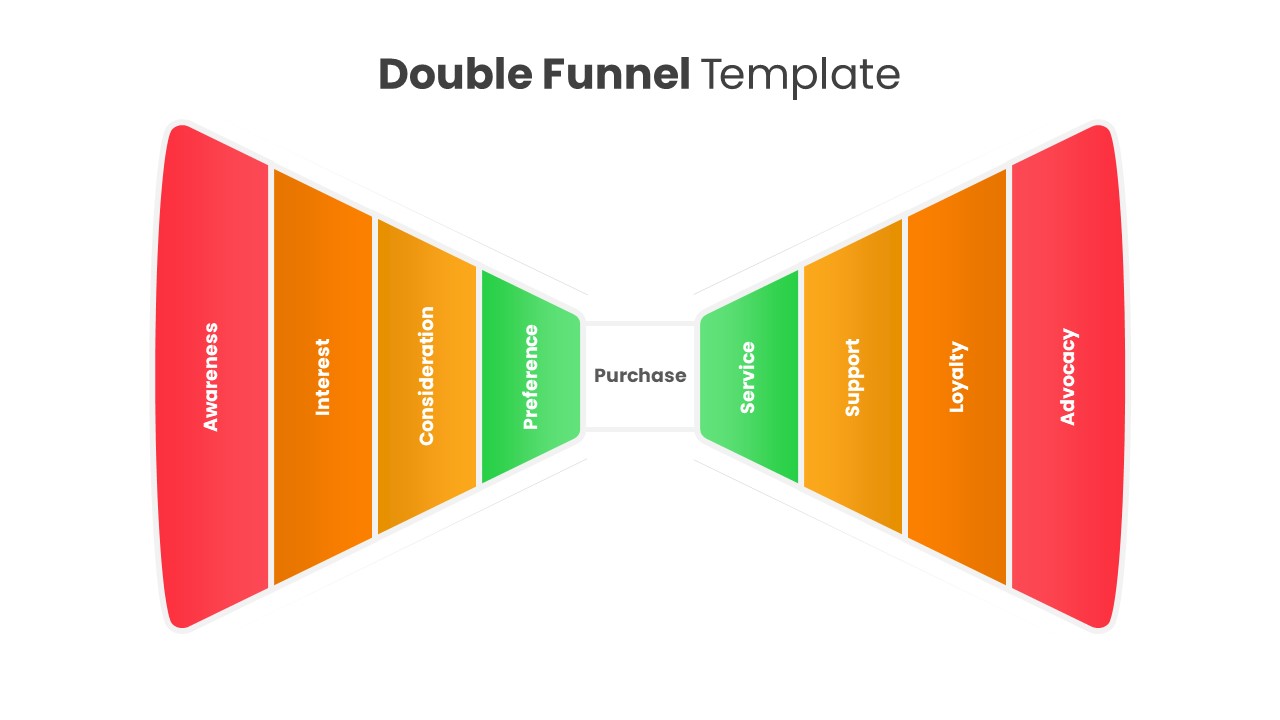
Double Funnel Lifecycle Diagram Template for PowerPoint & Google Slides
Funnel
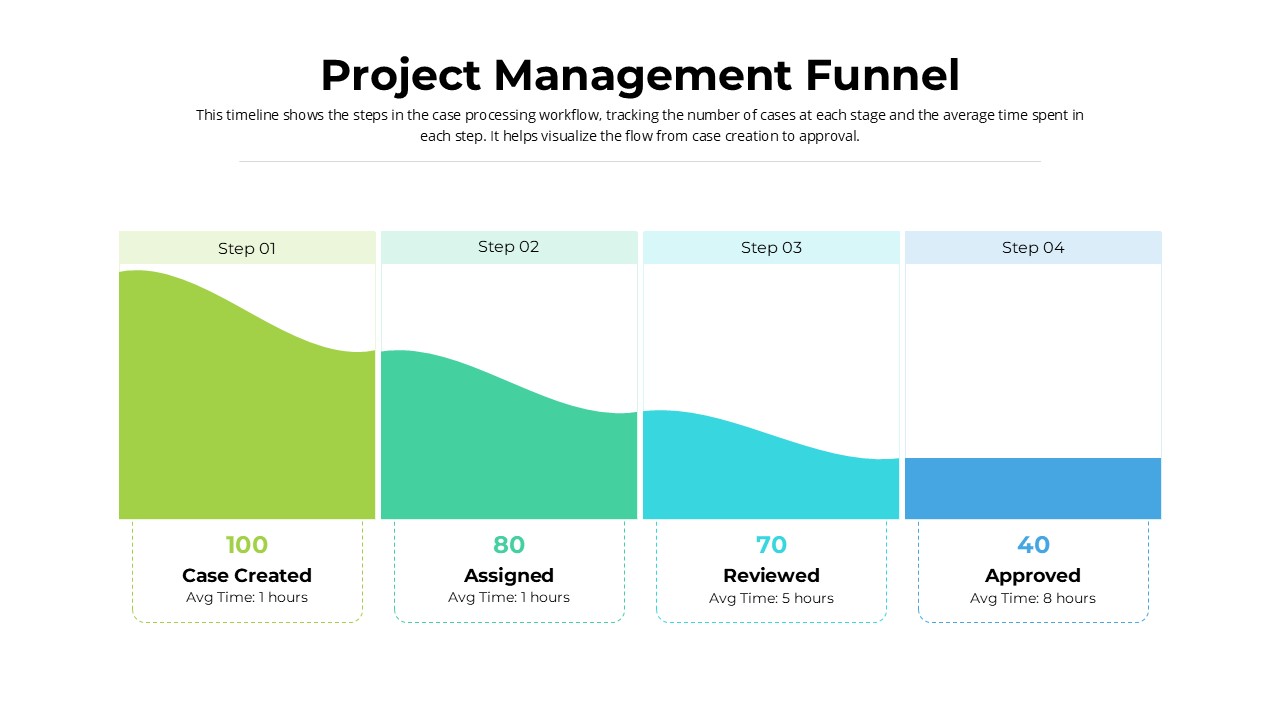
Project Management Funnel template for PowerPoint & Google Slides
Project
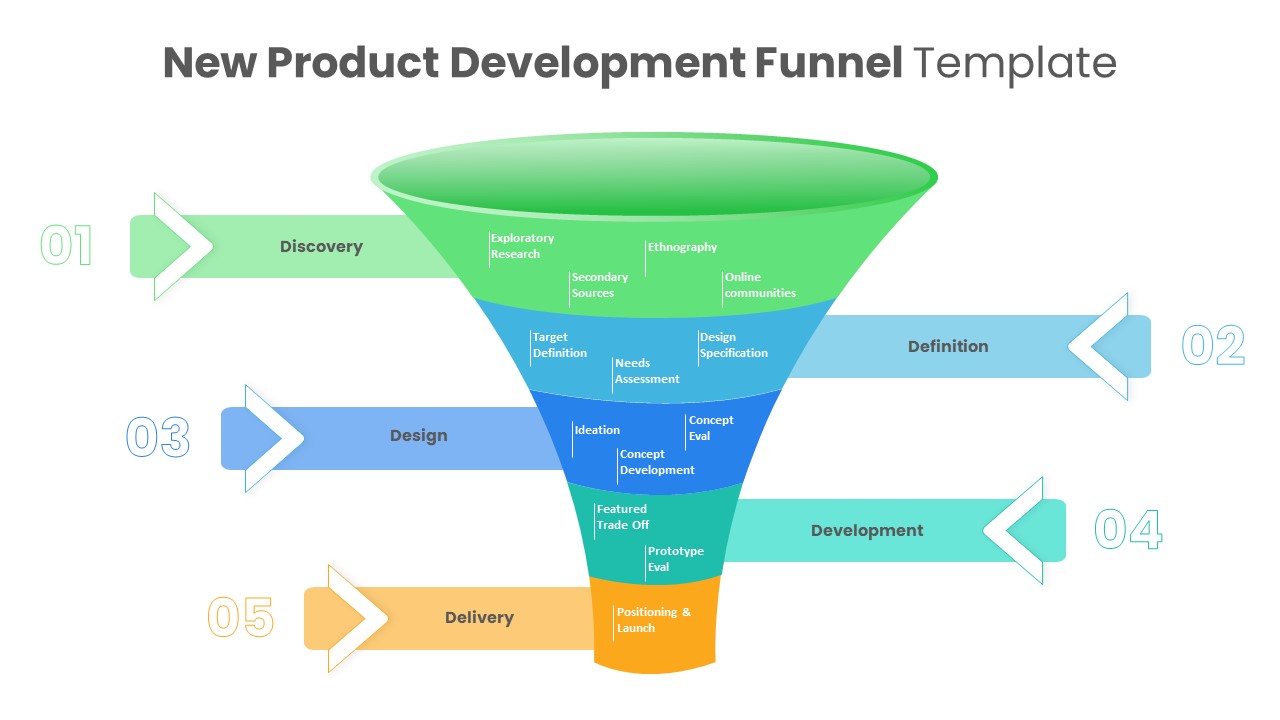
New Product Development Funnel Diagram Template for PowerPoint & Google Slides
Funnel
Free Multi-Step Funnel Infographic Slide Pack Template for PowerPoint & Google Slides
Funnel
Free
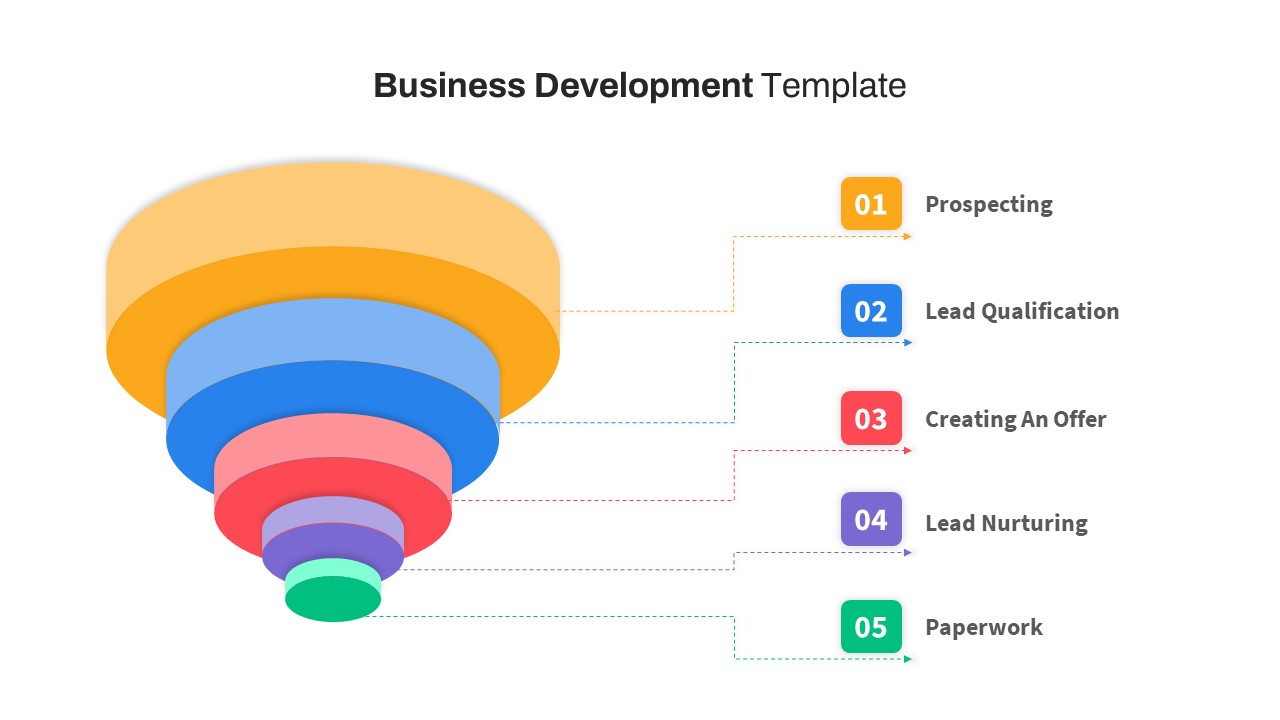
Free Business Development Funnel Diagram Template for PowerPoint & Google Slides
Marketing Funnel
Free
Inverted Sales Funnel Marketing Stages Template for PowerPoint & Google Slides
Marketing Funnel
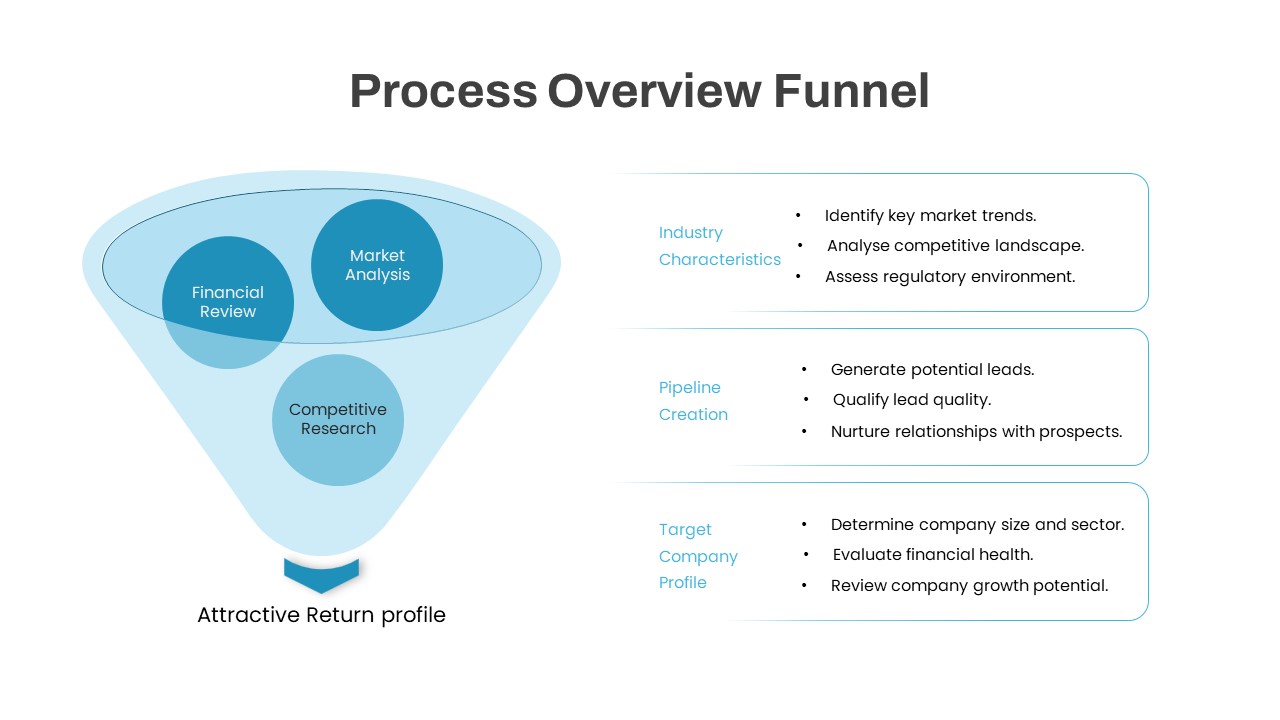
Process Overview Funnel Diagram Template for PowerPoint & Google Slides
Funnel
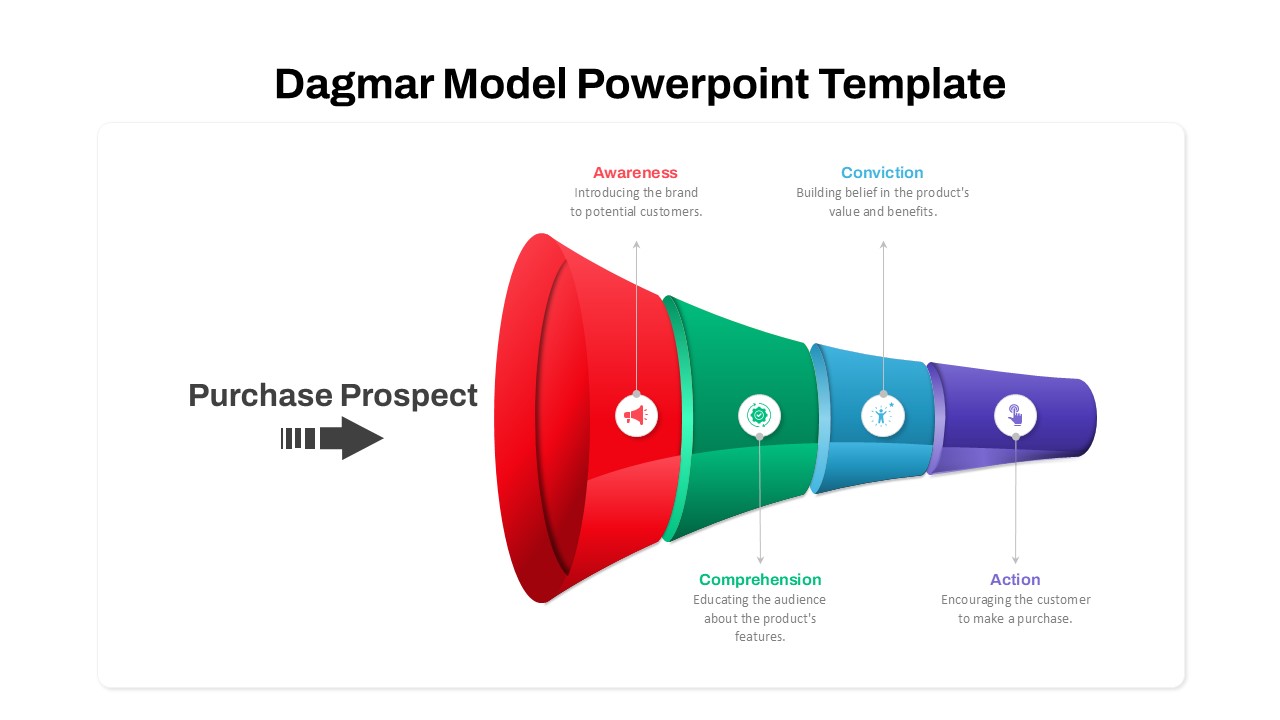
Dagmar Model Marketing Funnel Diagram Template for PowerPoint & Google Slides
Funnel
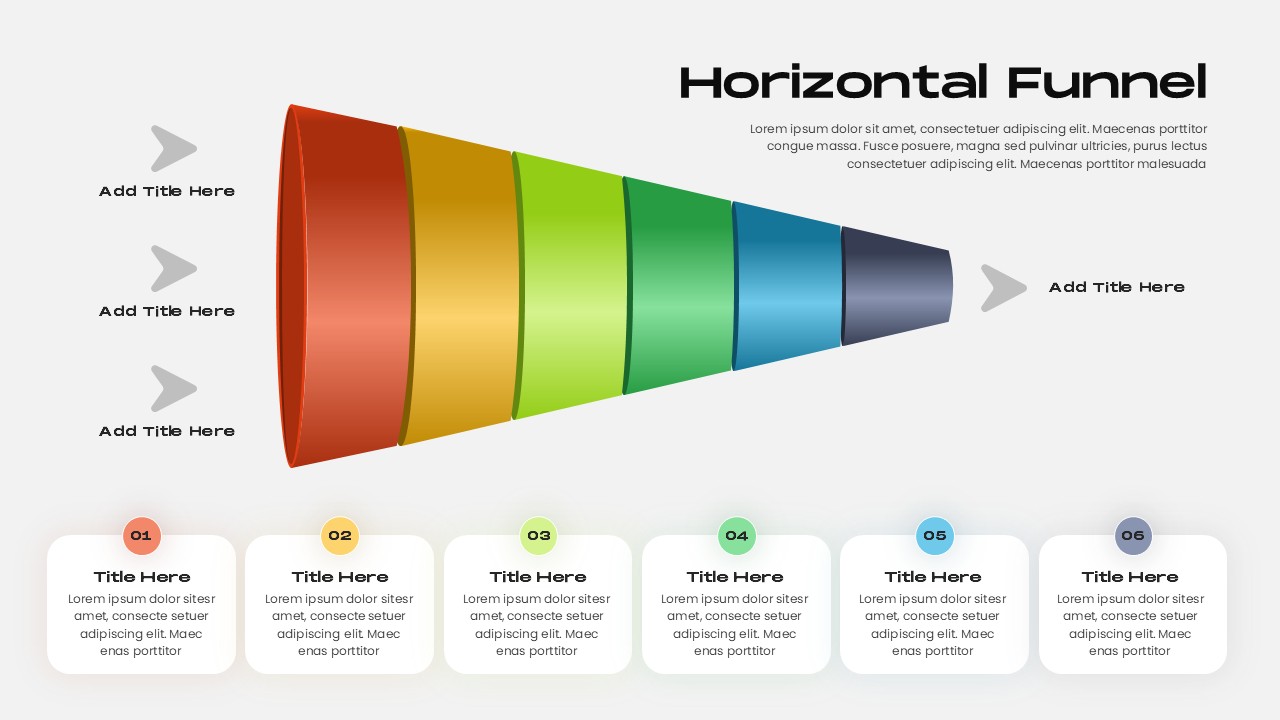
Horizontal Funnel Diagram Process Template for PowerPoint & Google Slides
Funnel
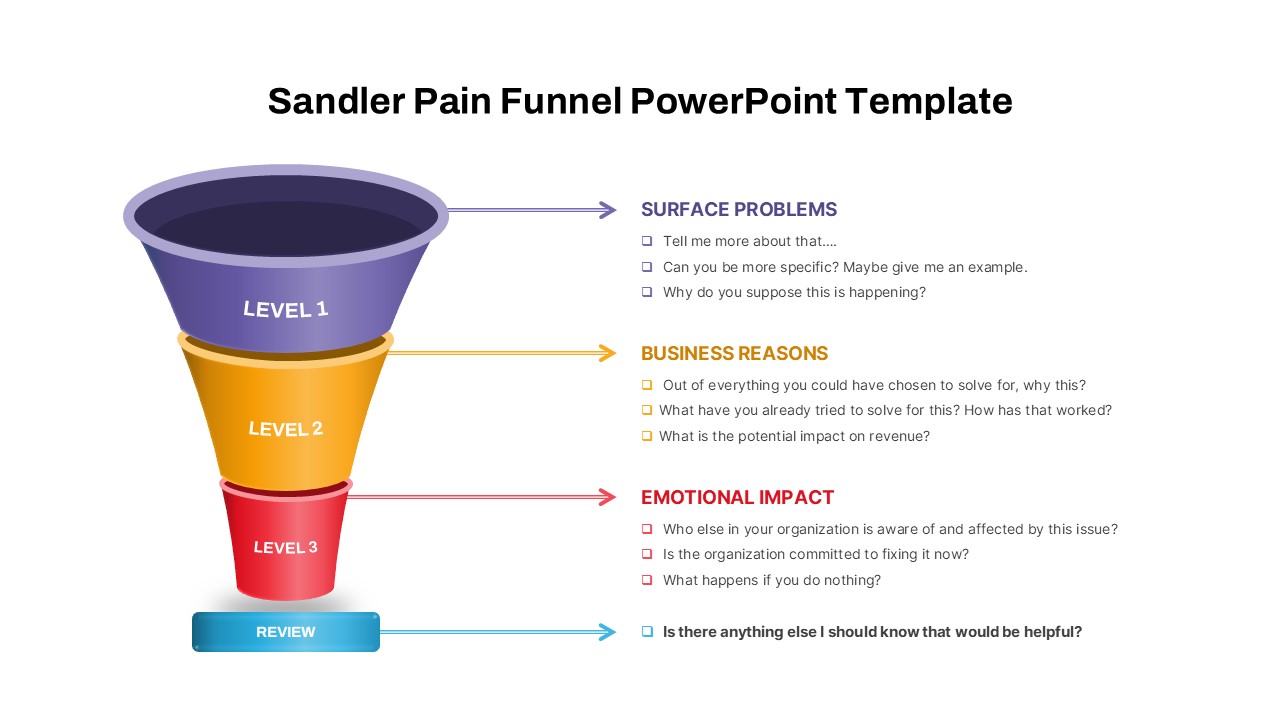
Sandler Pain Funnel Sales Qualification Template for PowerPoint & Google Slides
Funnel
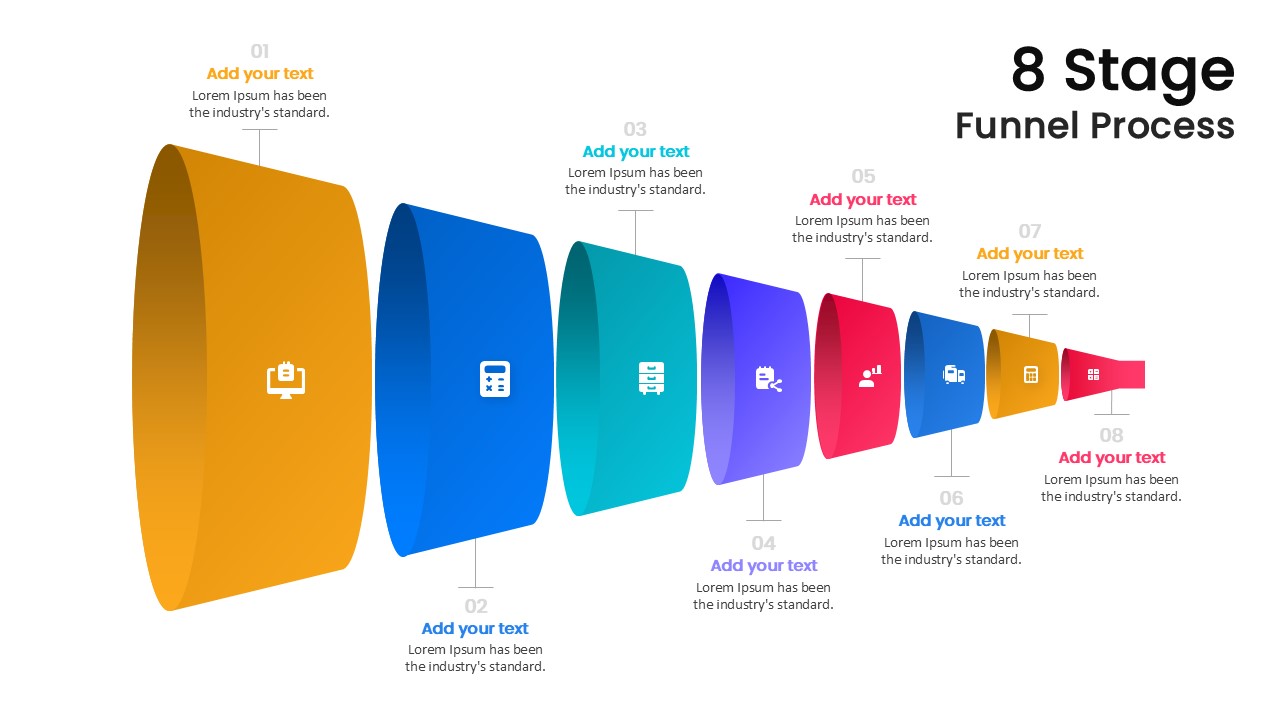
8 Stage Funnel Process template for PowerPoint & Google Slides
Funnel
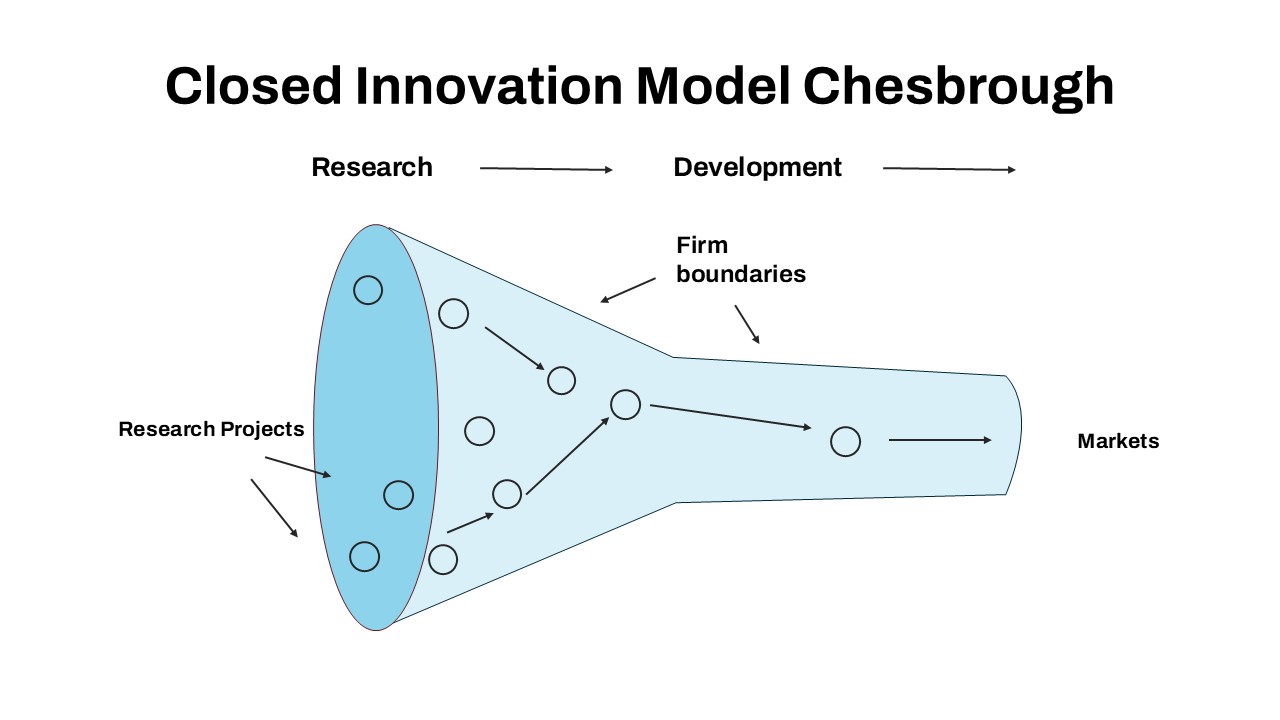
Closed Innovation Model Funnel Diagram Template for PowerPoint & Google Slides
Funnel
Modern 8-Stage Funnel Process Diagram Template for PowerPoint & Google Slides
Funnel
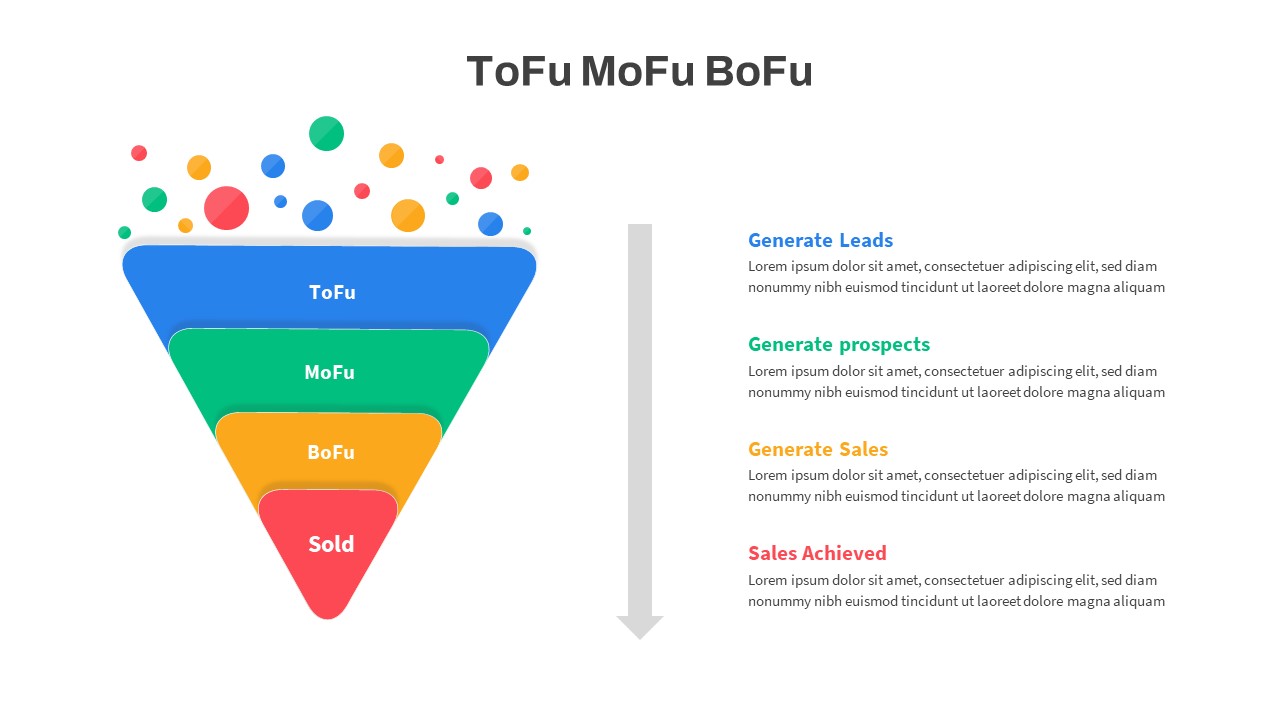
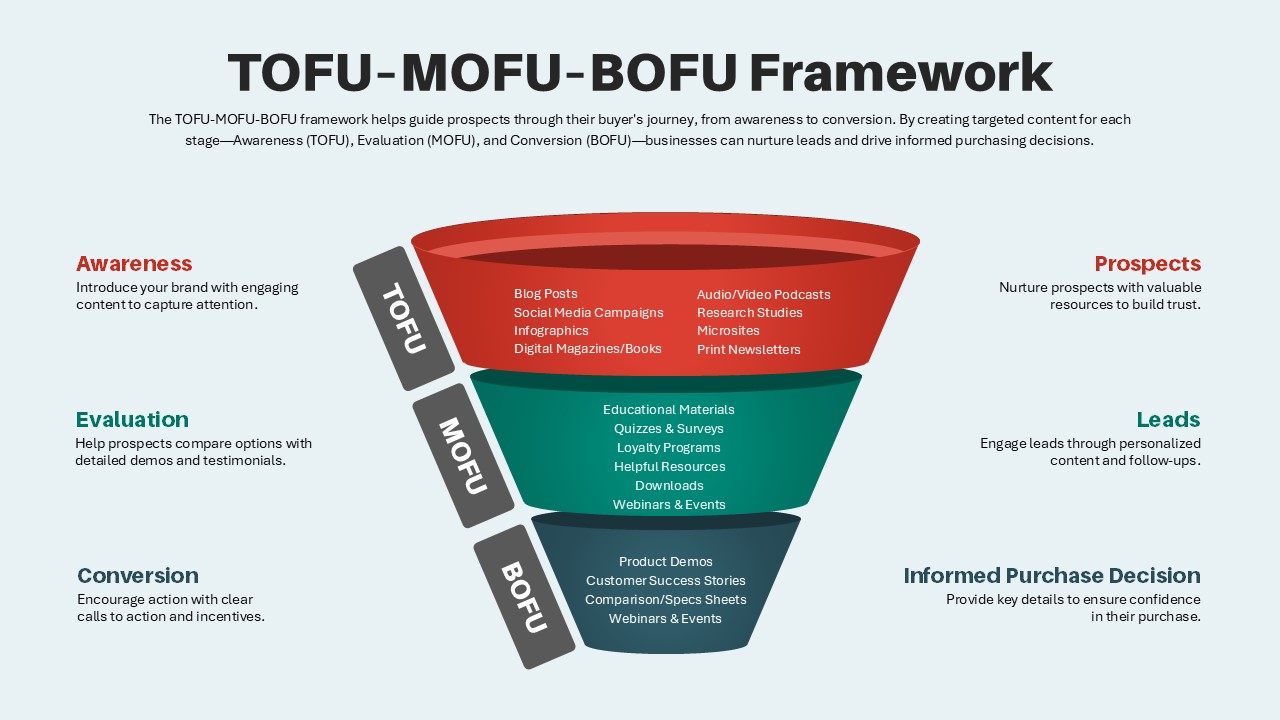
TOFU-MOFU-BOFU Marketing Funnel Template for PowerPoint & Google Slides
Funnel
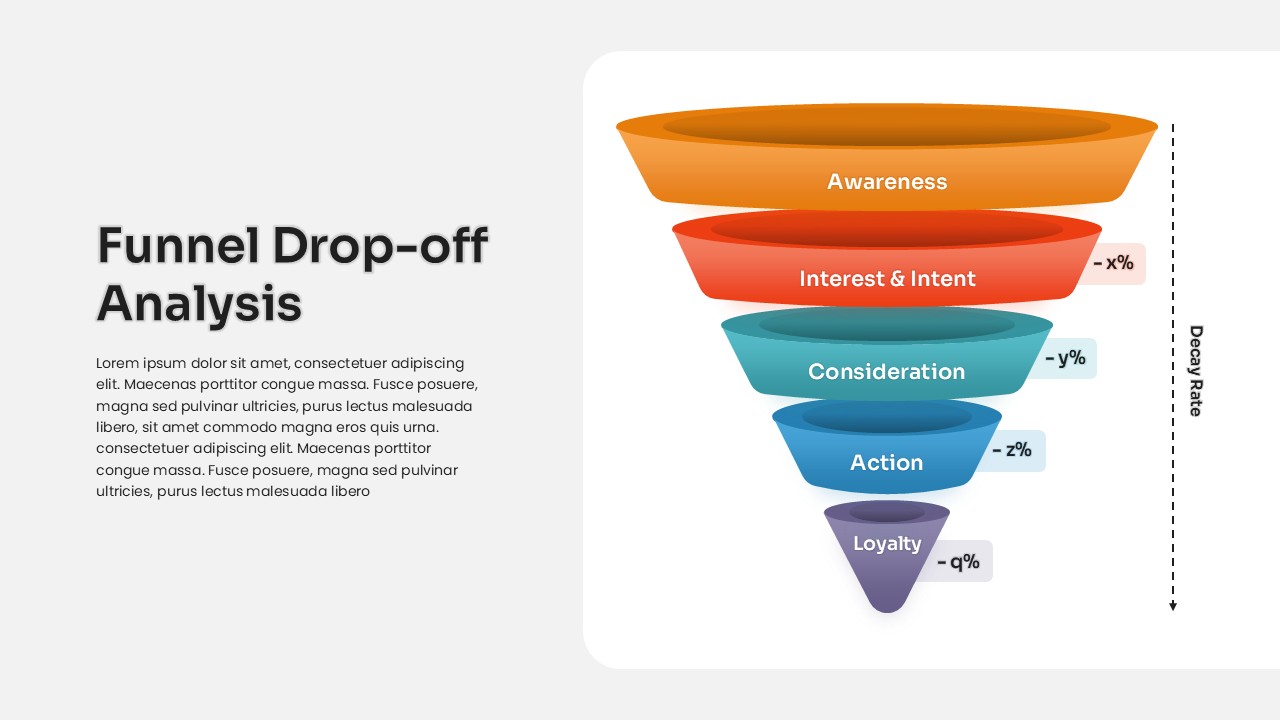
Funnel Drop-off Analysis template for PowerPoint & Google Slides
Business
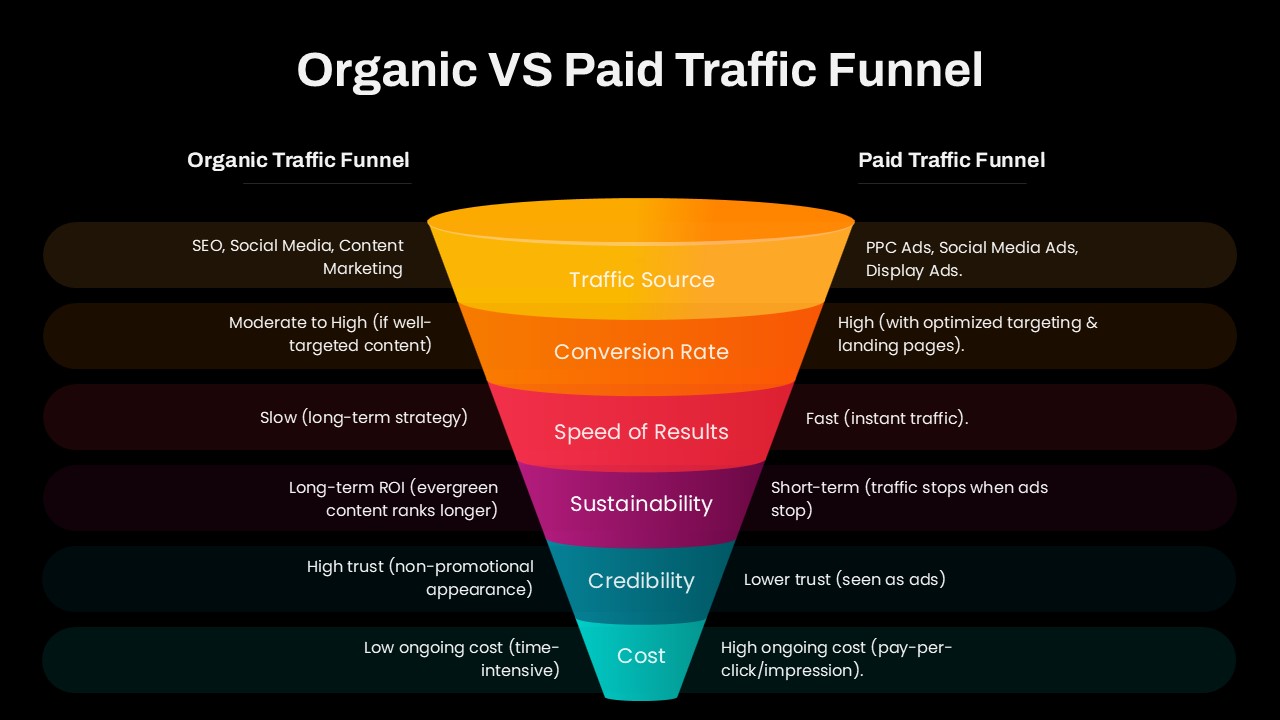
Organic vs Paid Traffic Funnel Template for PowerPoint & Google Slides
Marketing Funnel
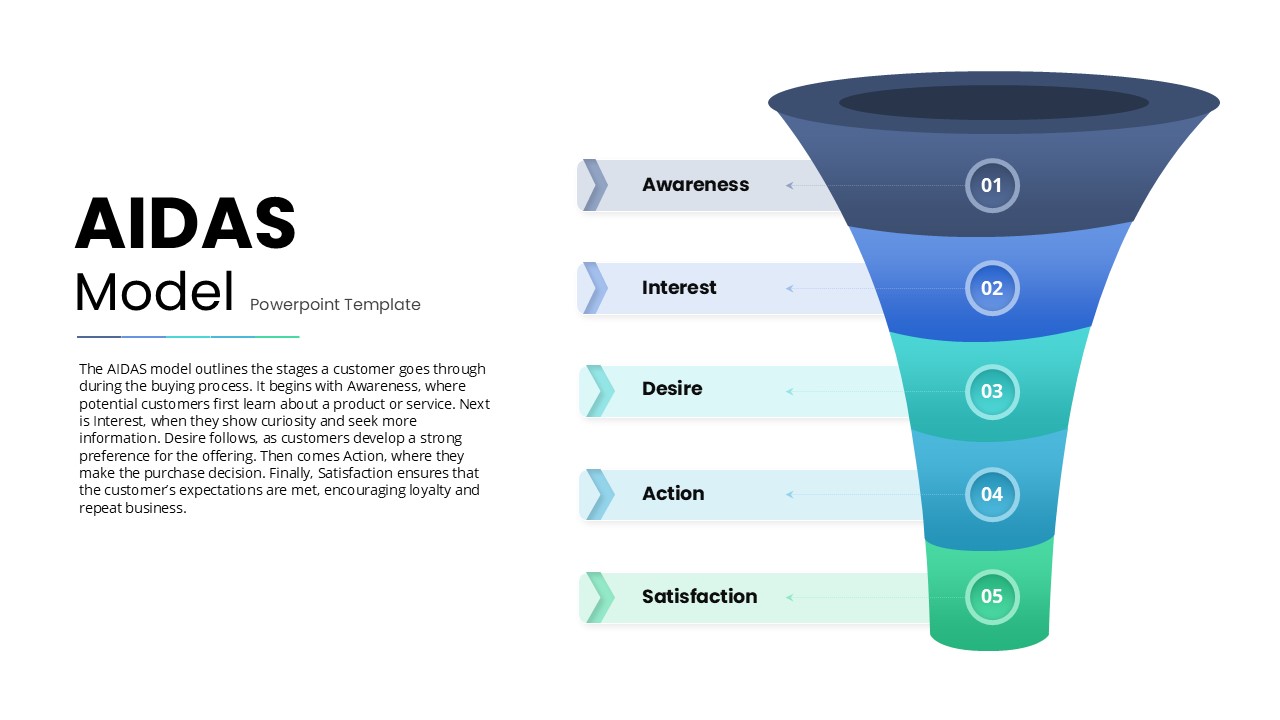
AIDAS Customer Journey Funnel Diagram Template for PowerPoint & Google Slides
Marketing Funnel
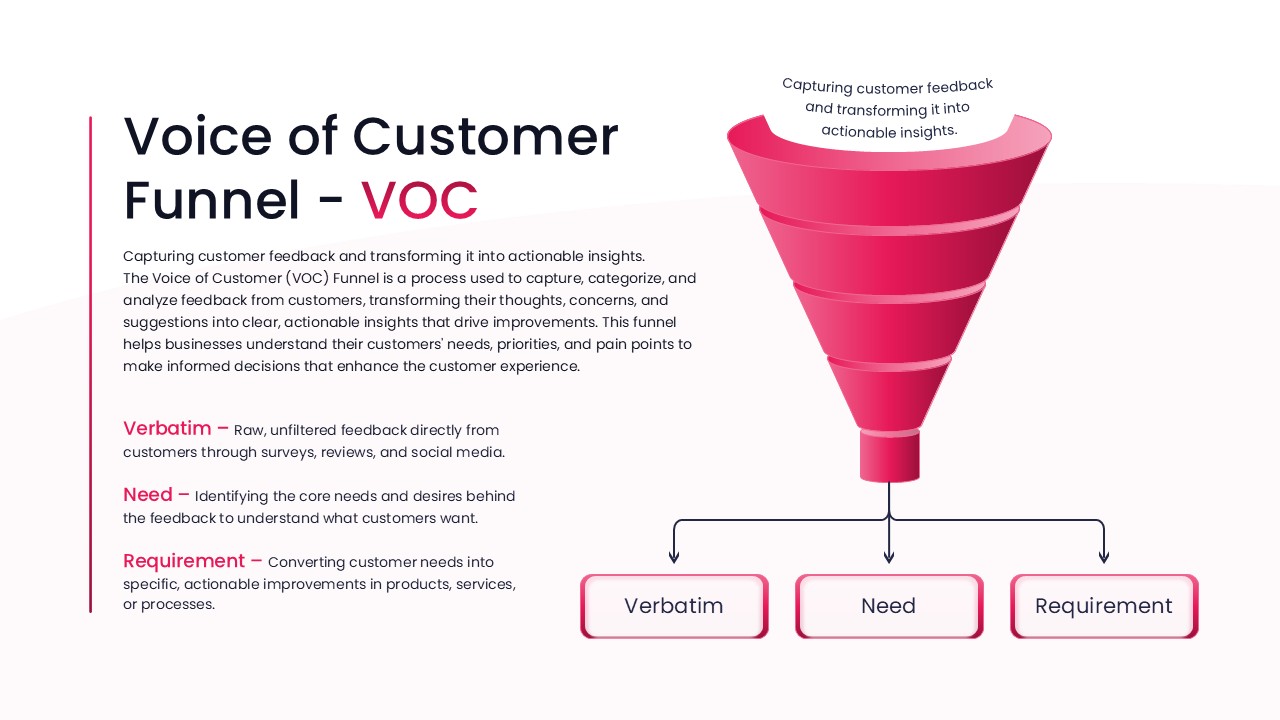
Voice of Customer Funnel (VOC) template for PowerPoint & Google Slides
Marketing
Funnel and Flywheel Thinking Comparison template for PowerPoint & Google Slides
Infographics
Project Management Funnel Template for PowerPoint & Google Slides
Funnel
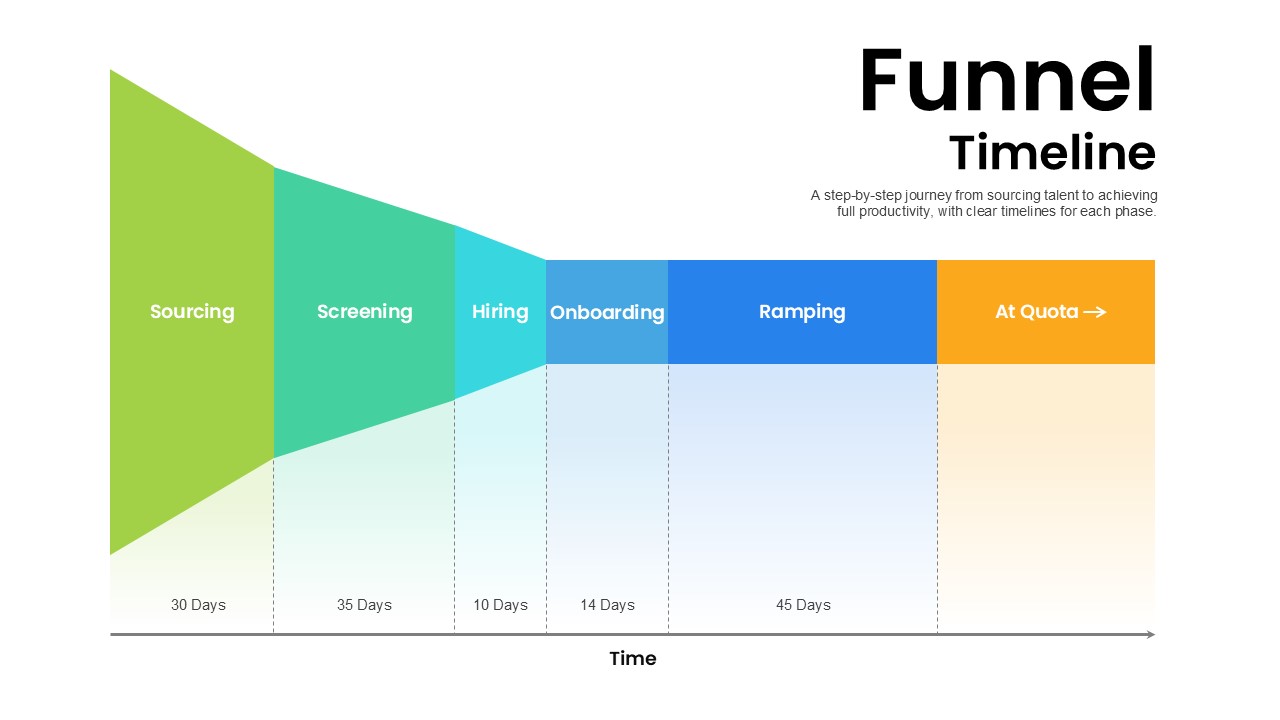
Hiring Funnel Timeline with Six Phases Template for PowerPoint & Google Slides
Recruitment
Five-Step Modern Funnel Diagram Template for PowerPoint & Google Slides
Funnel
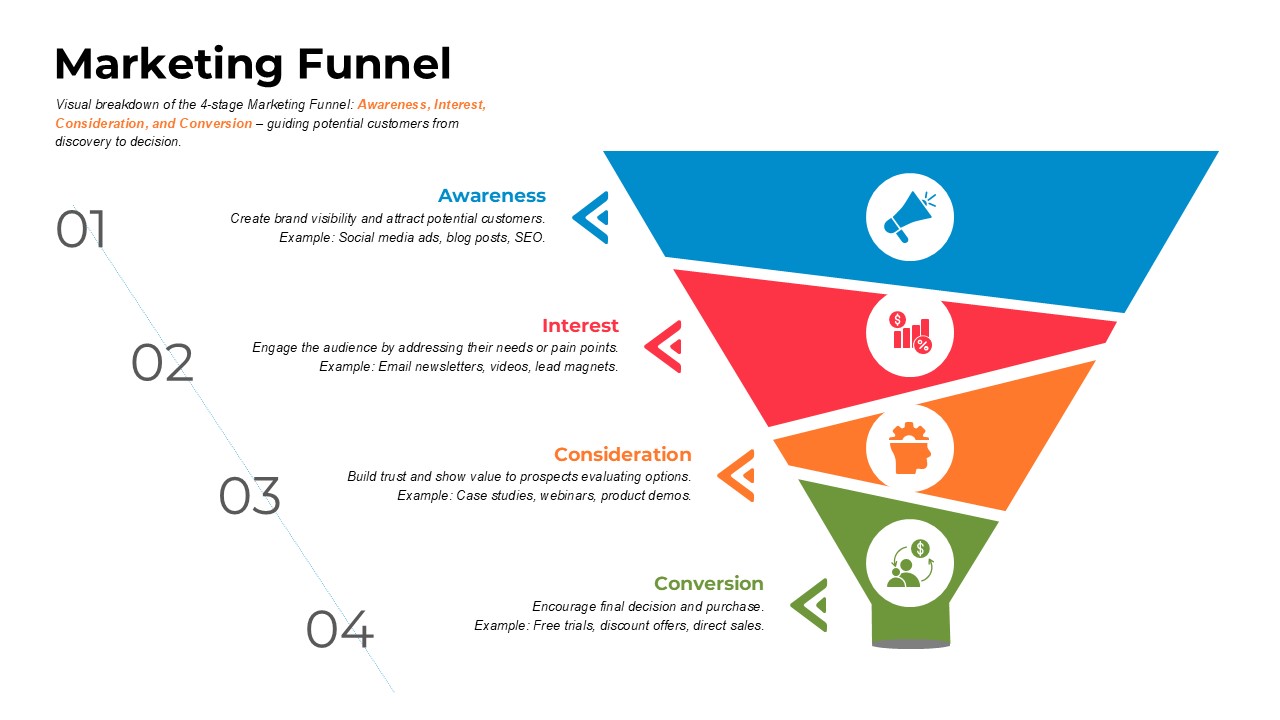
Four-Stage Marketing Funnel Template for PowerPoint & Google Slides
Marketing Funnel
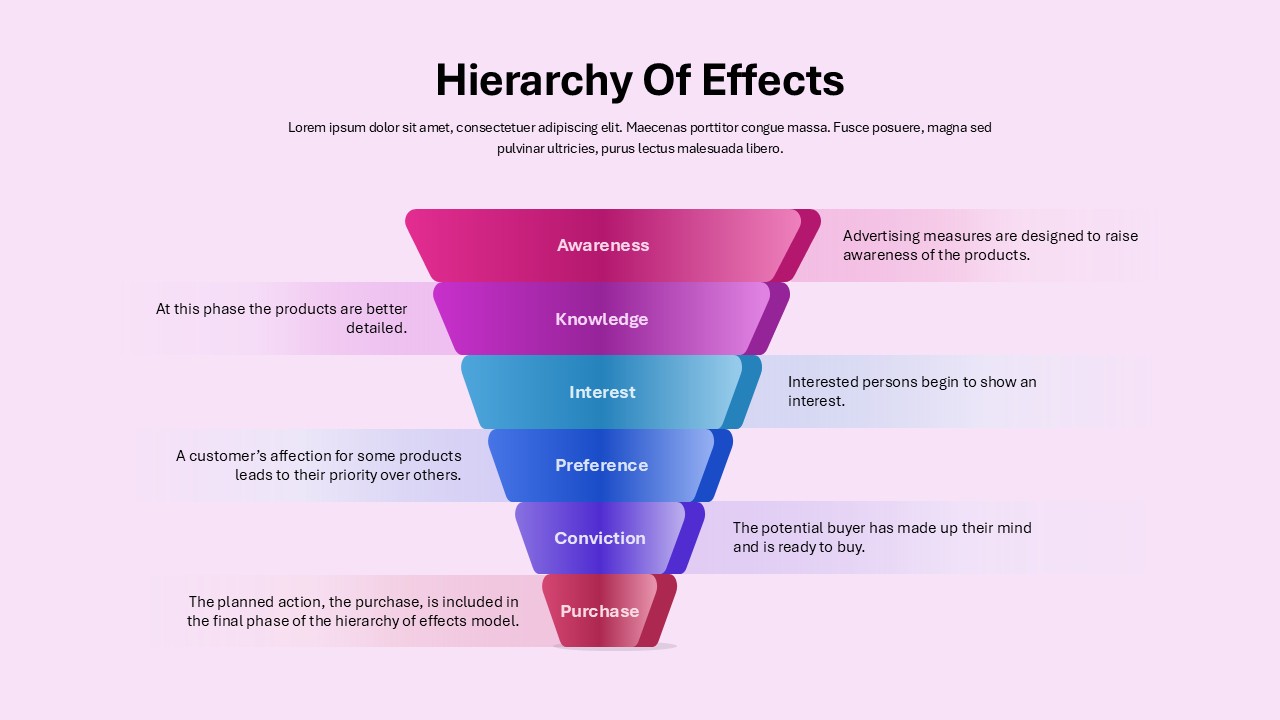
Marketing Funnel Hierarchy of Effects Template for PowerPoint & Google Slides
Marketing Funnel
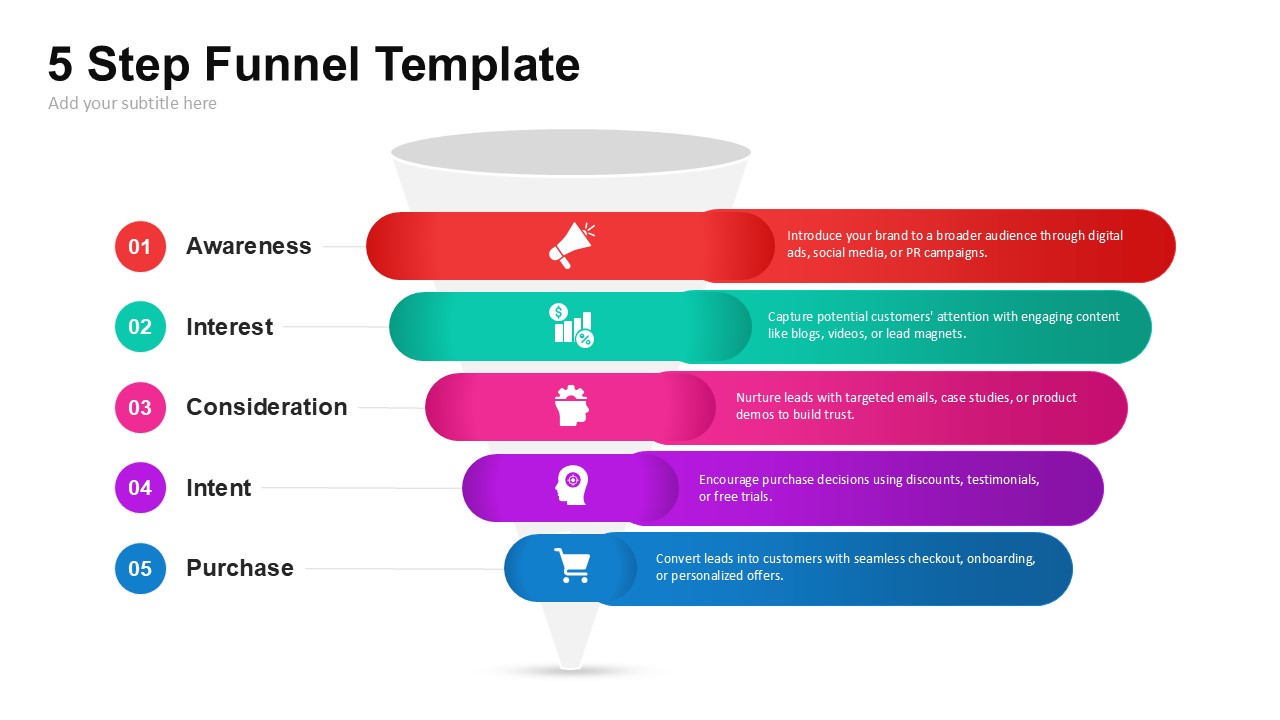
5-Step Marketing Funnel Template for PowerPoint & Google Slides
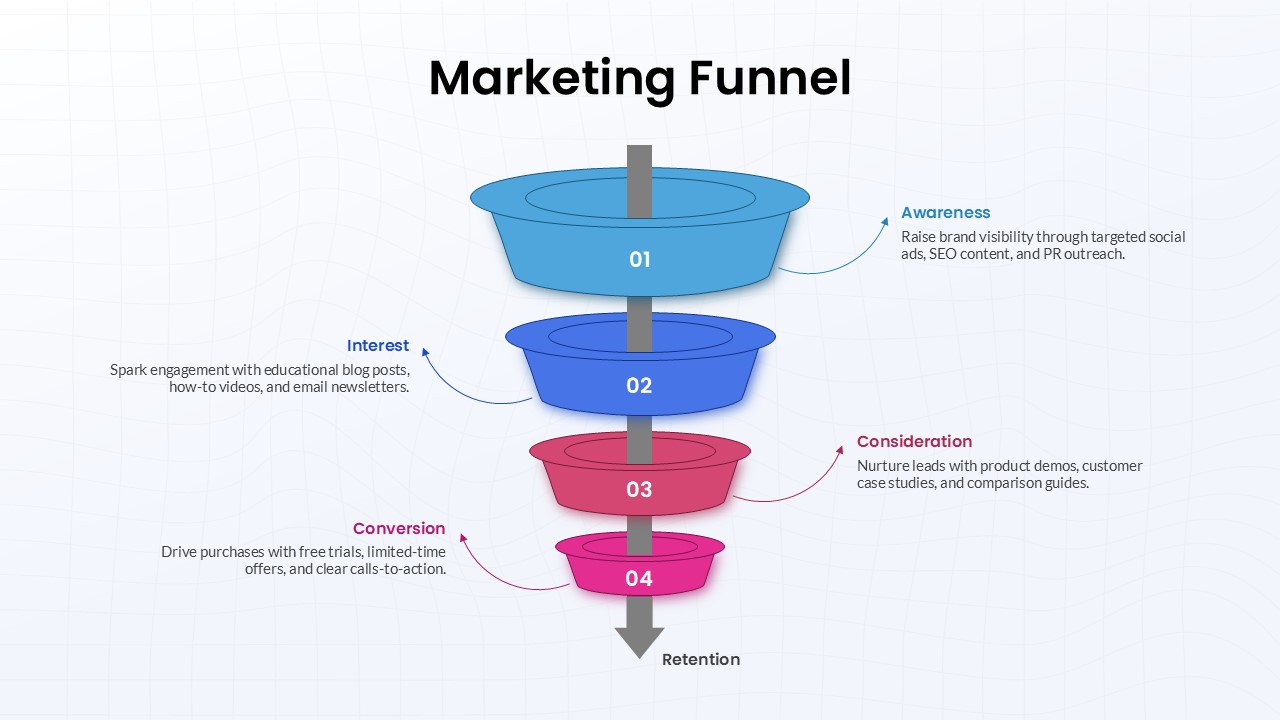
Marketing Funnel
Four-Stage Marketing Funnel Diagram Template for PowerPoint & Google Slides
Marketing Funnel
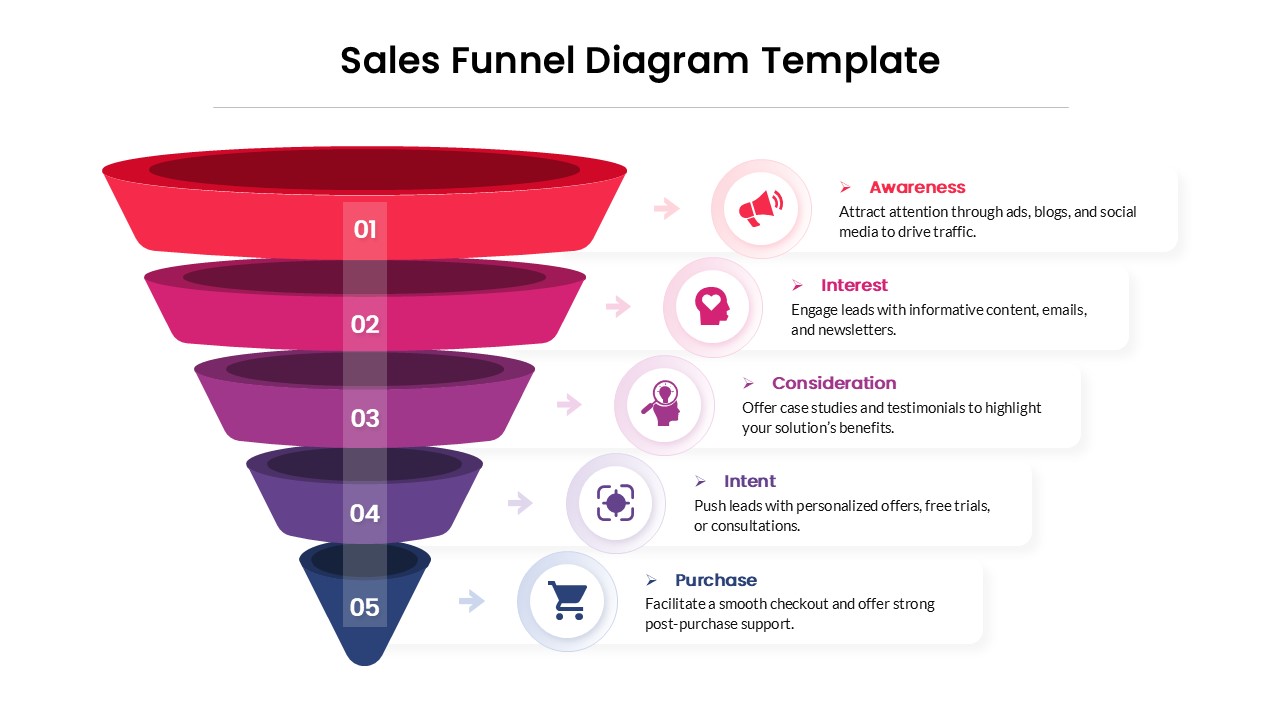
5 Stage Sales Funnel Diagram Template for PowerPoint & Google Slides
Funnel
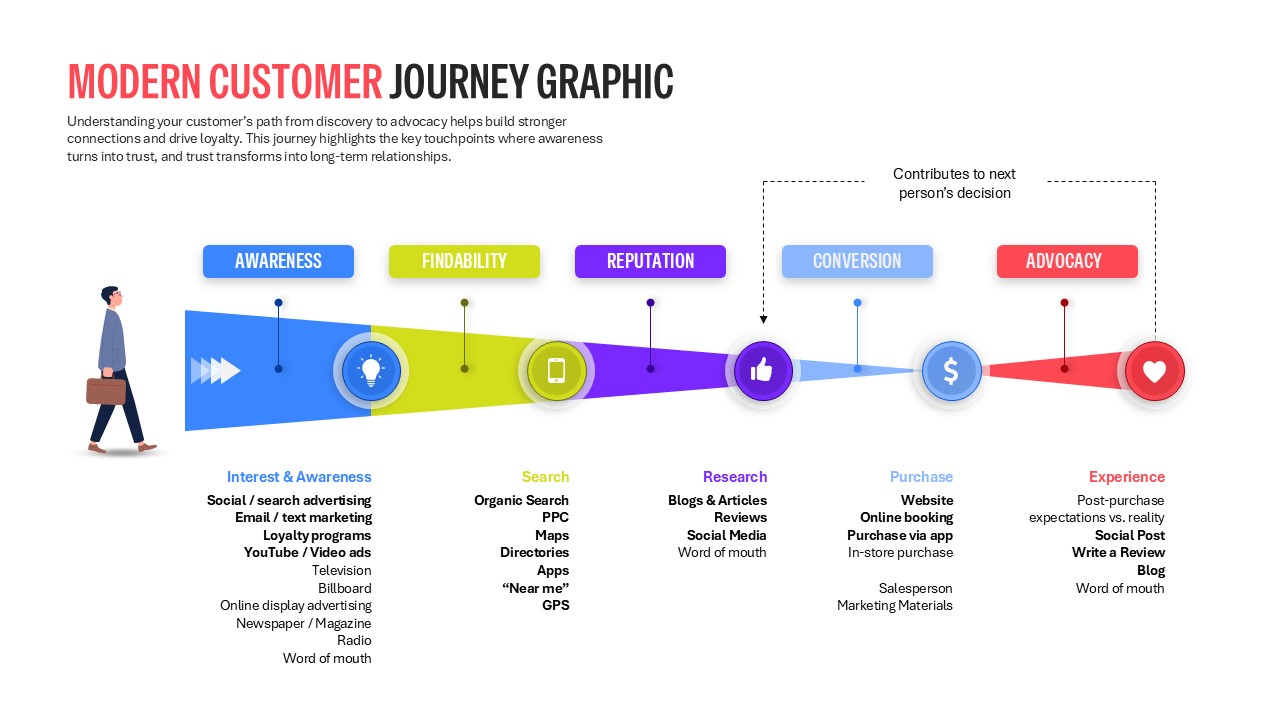
Modern Customer Journey Graphic Funnel Template for PowerPoint & Google Slides
Customer Journey