Past, Present & Future Venn Diagram Template for PowerPoint & Google Slides

Description
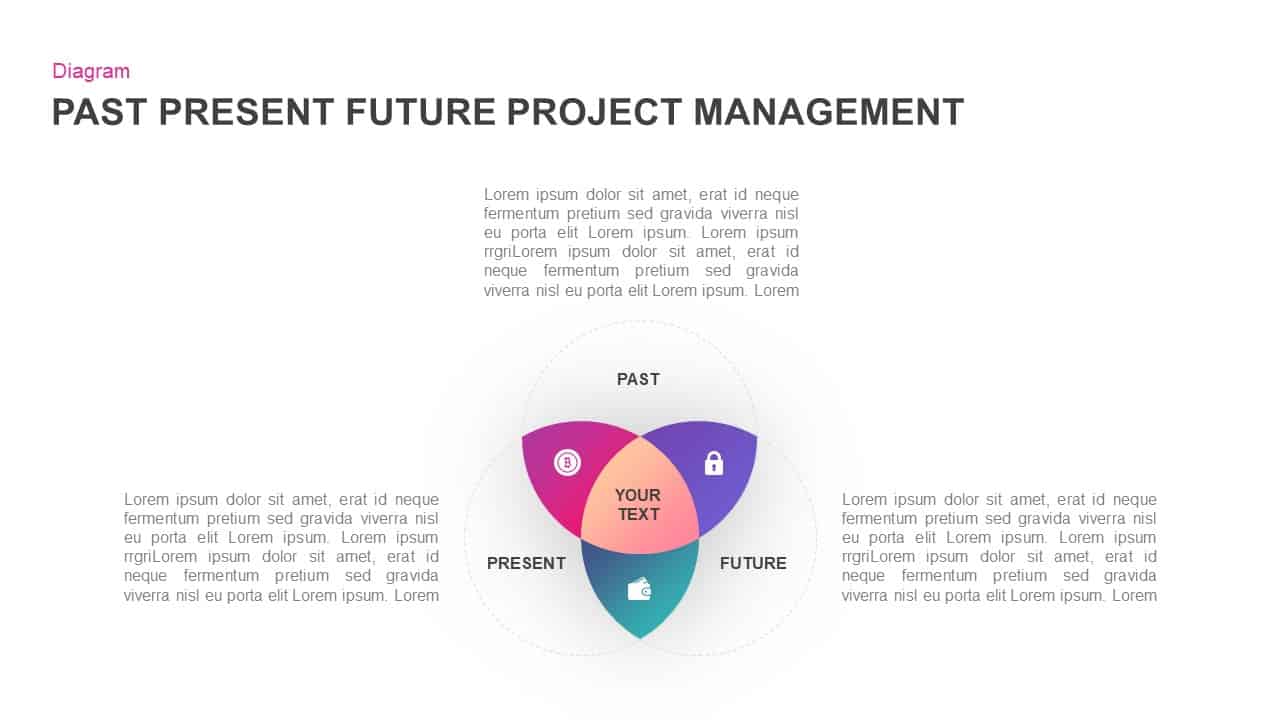
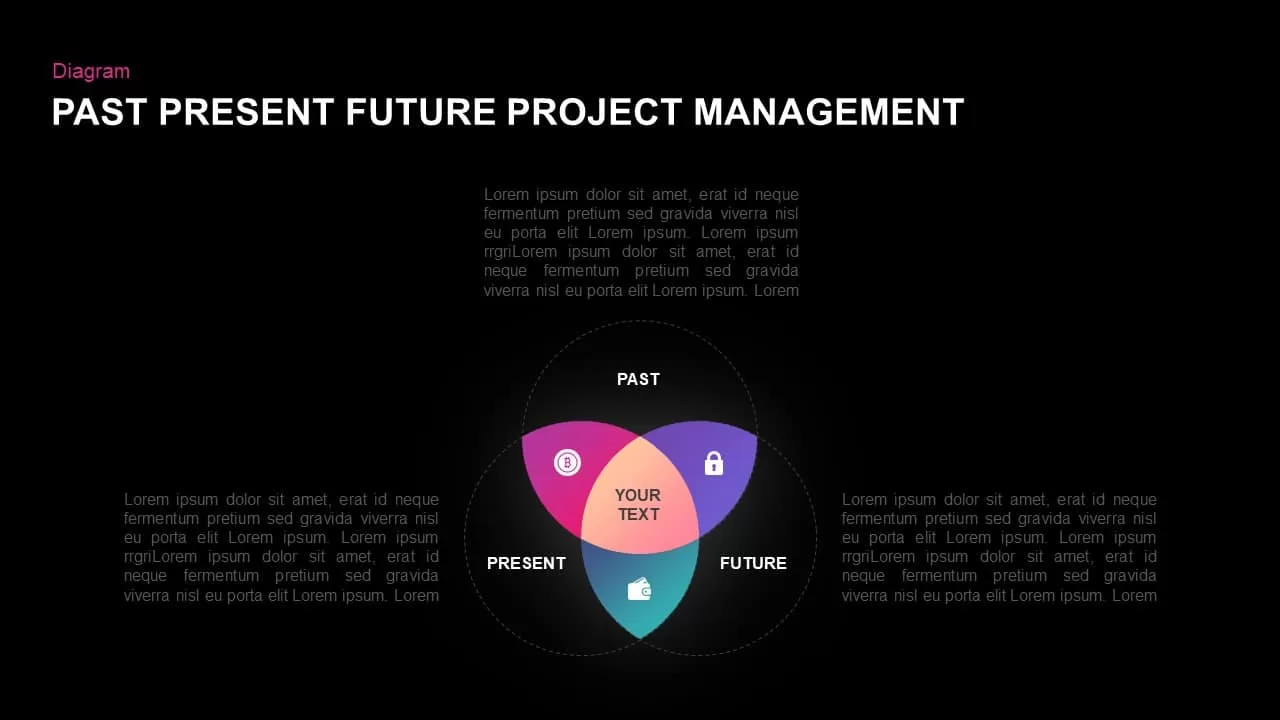
This slide features a three-set Venn diagram that visualizes the relationships between past, present, and future elements in a project management context. Three gradient-filled petals—magenta for past, purple for future, and cyan for present—overlap to form a central core where combined insights reside. Each petal includes an icon and label, while dashed circular outlines reinforce each time horizon. Clean typography, ample white space, and subtle drop shadows give the layout a modern, professional look. Fully editable vector shapes and master-slide integration let you swap icons, relabel segments, adjust gradient hues, or reposition elements in seconds without disturbing alignment. Whether you’re conducting retrospective analyses, real-time performance reviews, or future planning sessions, this infographic slide makes it easy to compare temporal dimensions, highlight interdependencies, and guide stakeholder discussions with clarity and visual appeal.
Who is it for
Ideal for project managers, business analysts, strategy consultants, and operations teams who need to map historical data, current metrics, and future forecasts side by side. Trainers, educators, and workshop facilitators can also leverage this slide to teach scenario planning, timeline integration, or change-management frameworks.
Other Uses
Beyond project management, repurpose this diagram for risk assessments (past issues vs present controls vs future threats), product roadmaps (legacy features, current releases, upcoming innovations), or stakeholder alignment exercises. Simply relabel each petal and swap icons to tailor the slide to any three-way comparison.
Login to download this file

Item ID
SB01349
Related Templates

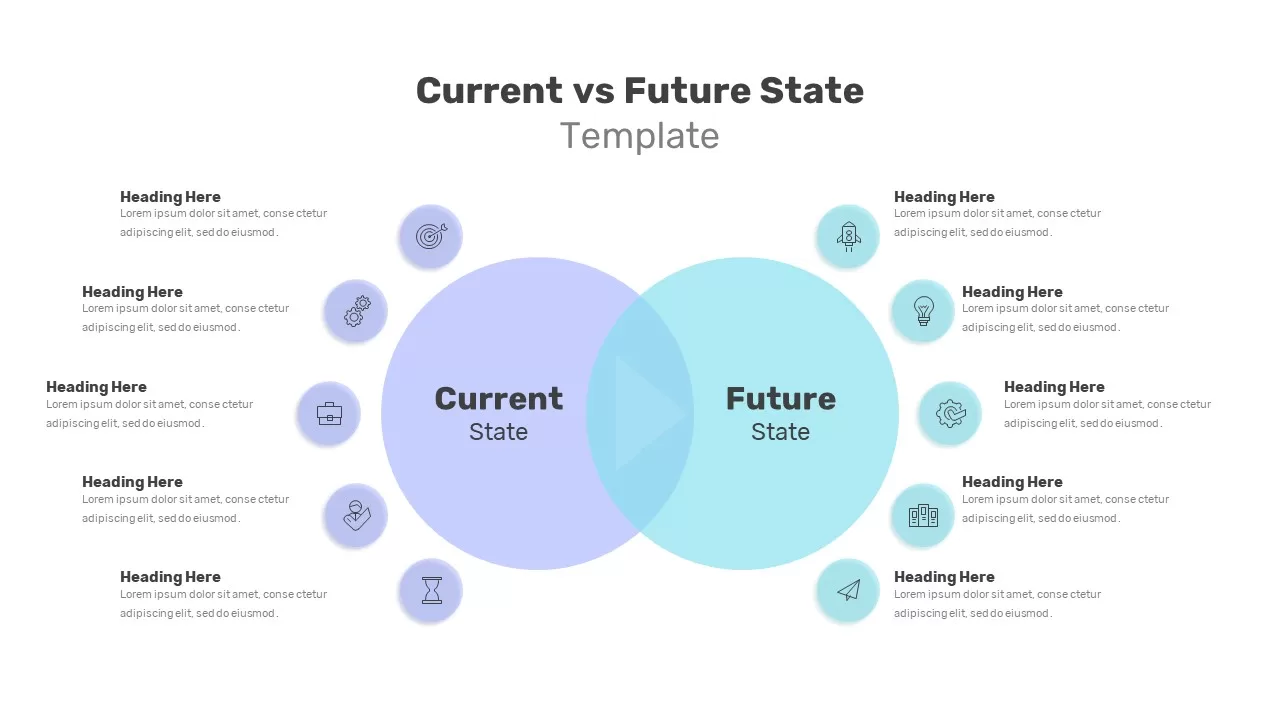
Current vs Future State Venn Diagram Template for PowerPoint & Google Slides
Comparison
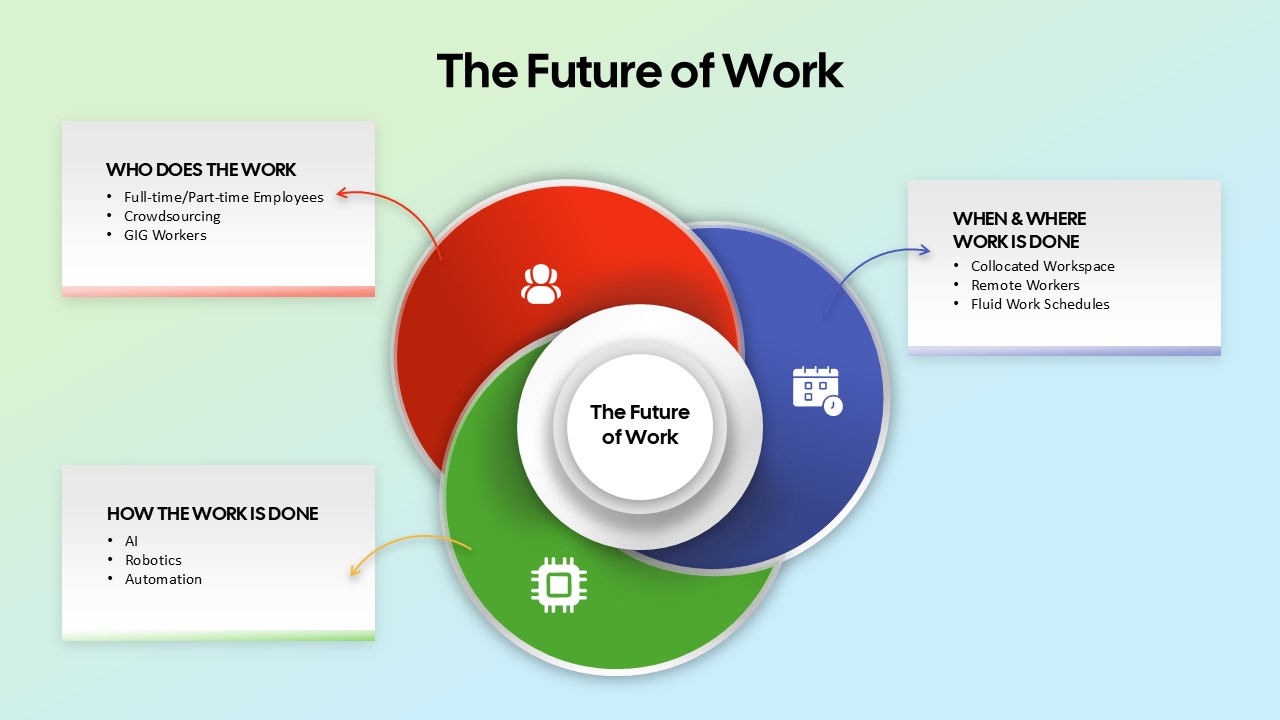
The Future of Work Venn Diagram Template for PowerPoint & Google Slides
Circular

Four-Circle Venn Process Diagram template for PowerPoint & Google Slides
Process
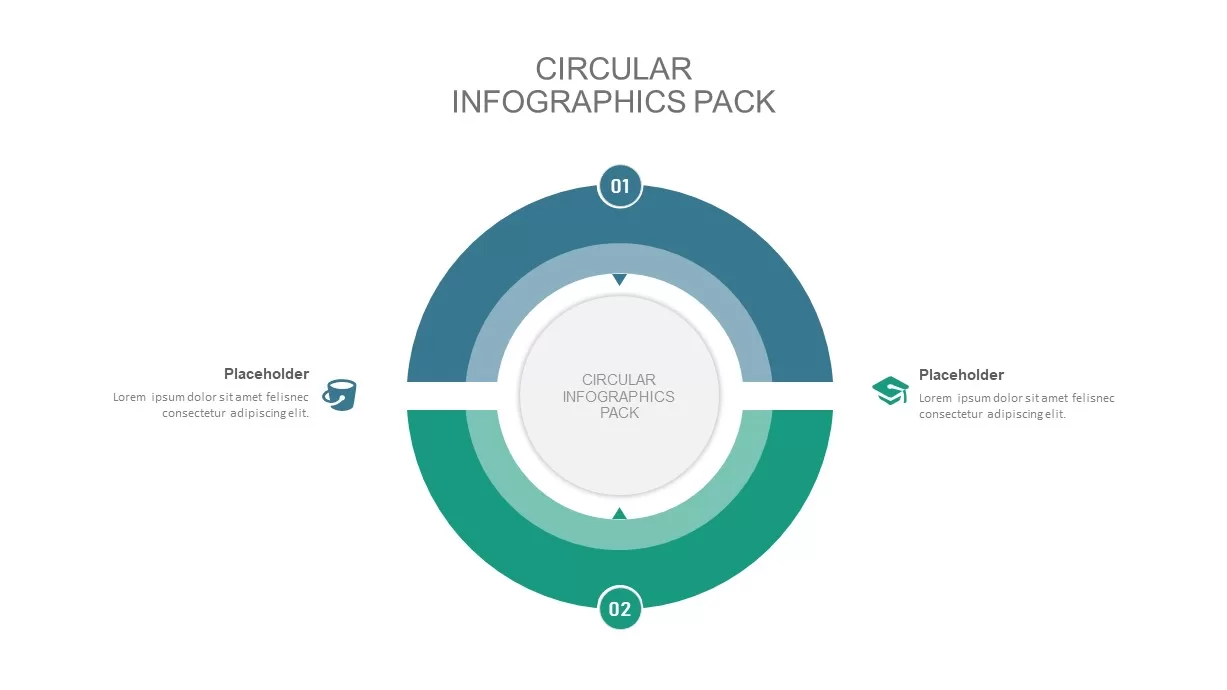
Venn Diagram Infographics Pack Template for PowerPoint & Google Slides
Circular
Creative Three-Circle Venn Diagram Template for PowerPoint & Google Slides
Comparison
Colorful Venn Diagram Infographics Template for PowerPoint & Google Slides
Circular
Modern Gear Venn Diagram Infographic Template for PowerPoint & Google Slides
Comparison
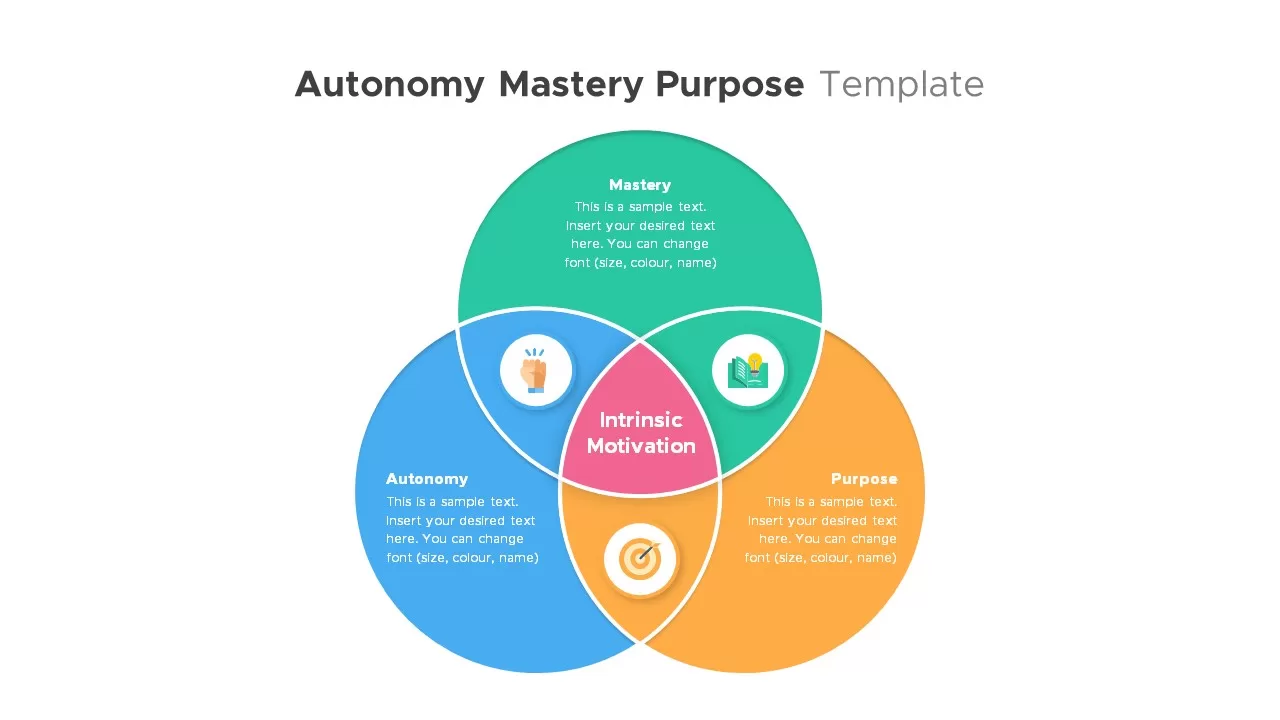
Autonomy, Mastery & Purpose Venn Diagram Template for PowerPoint & Google Slides
Circular
Free Simple Venn Diagram Overview template for PowerPoint & Google Slides
Comparison Chart
Free
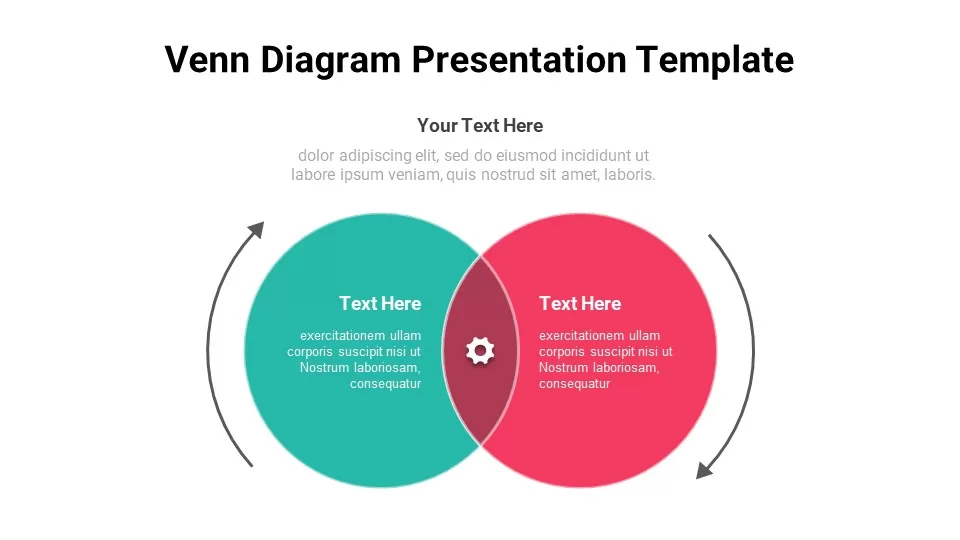
Free Venn Diagram template for PowerPoint & Google Slides
Charts
Free
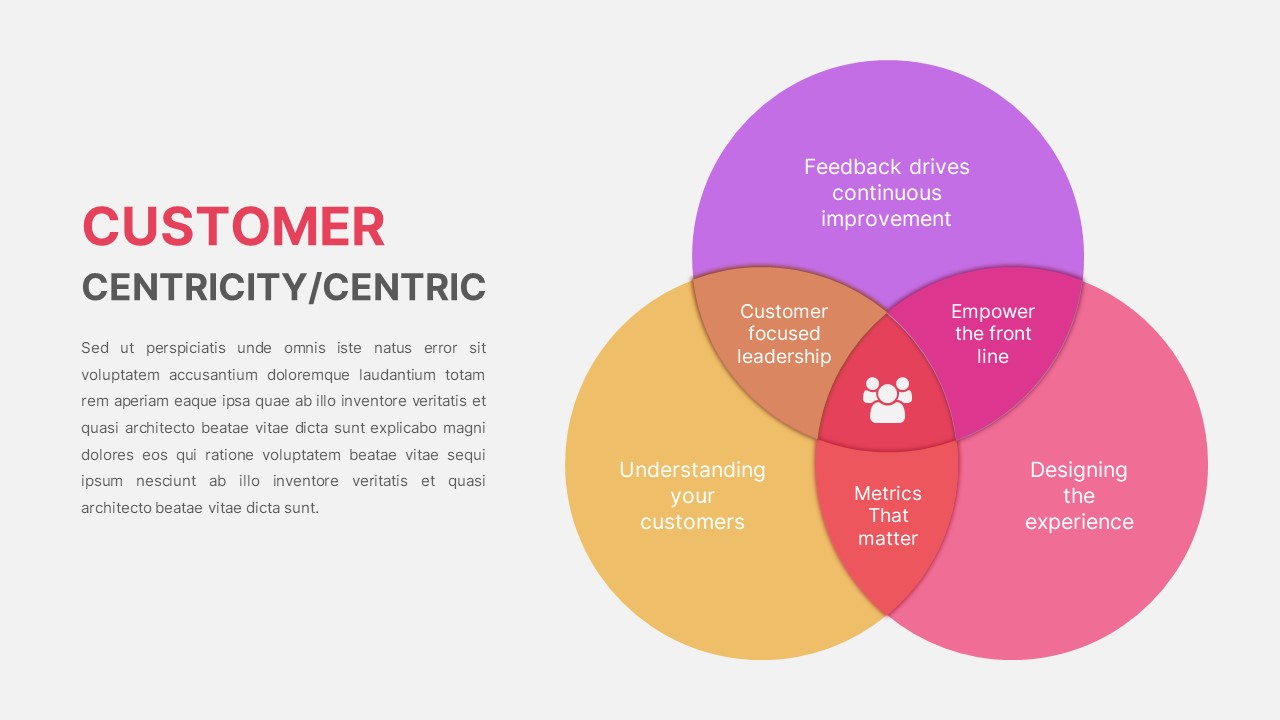
Customer Centricity Venn Diagram template for PowerPoint & Google Slides
Infographics
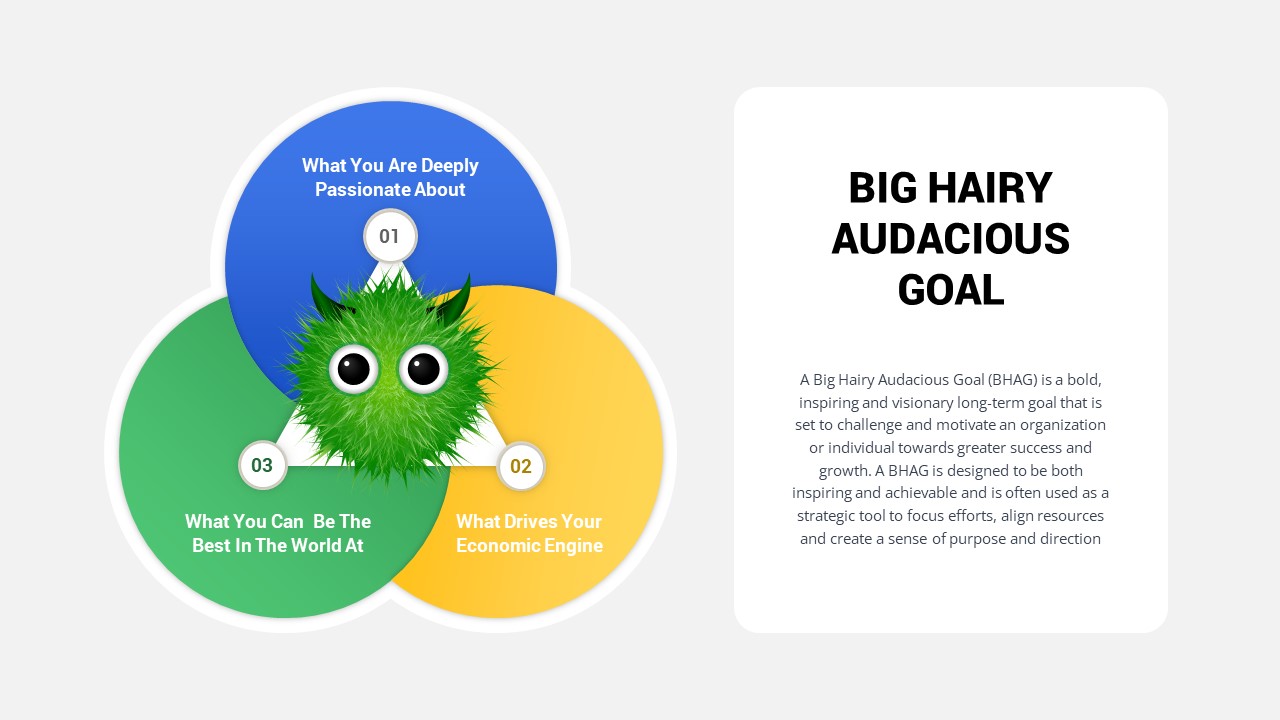
Big Hairy Audacious Goal Venn Diagram Template for PowerPoint & Google Slides
Circular
Five Circle Venn Diagram for Template for PowerPoint & Google Slides
Circular
8 Circle Venn Diagram Infographic Design Template for PowerPoint & Google Slides
Circular
Professional 6 Circle Venn Diagram Template for PowerPoint & Google Slides
Circular
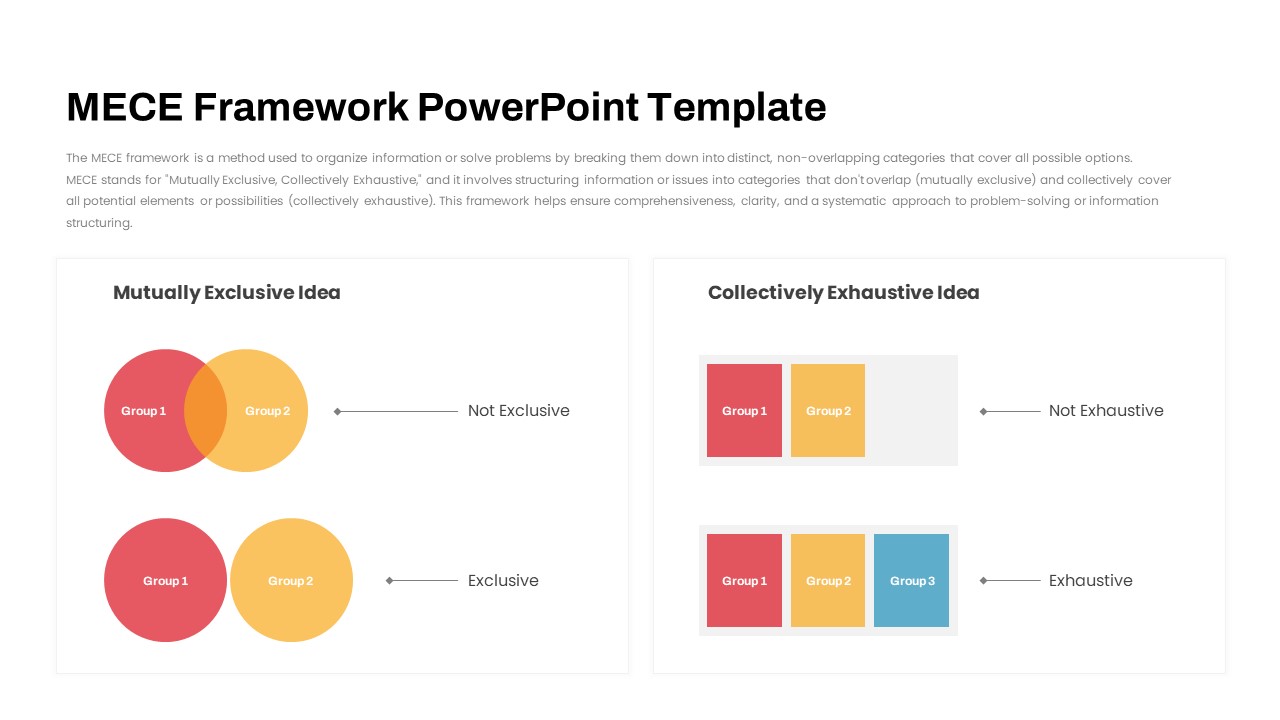
MECE Framework Venn & Block Diagram Template for PowerPoint & Google Slides
Comparison
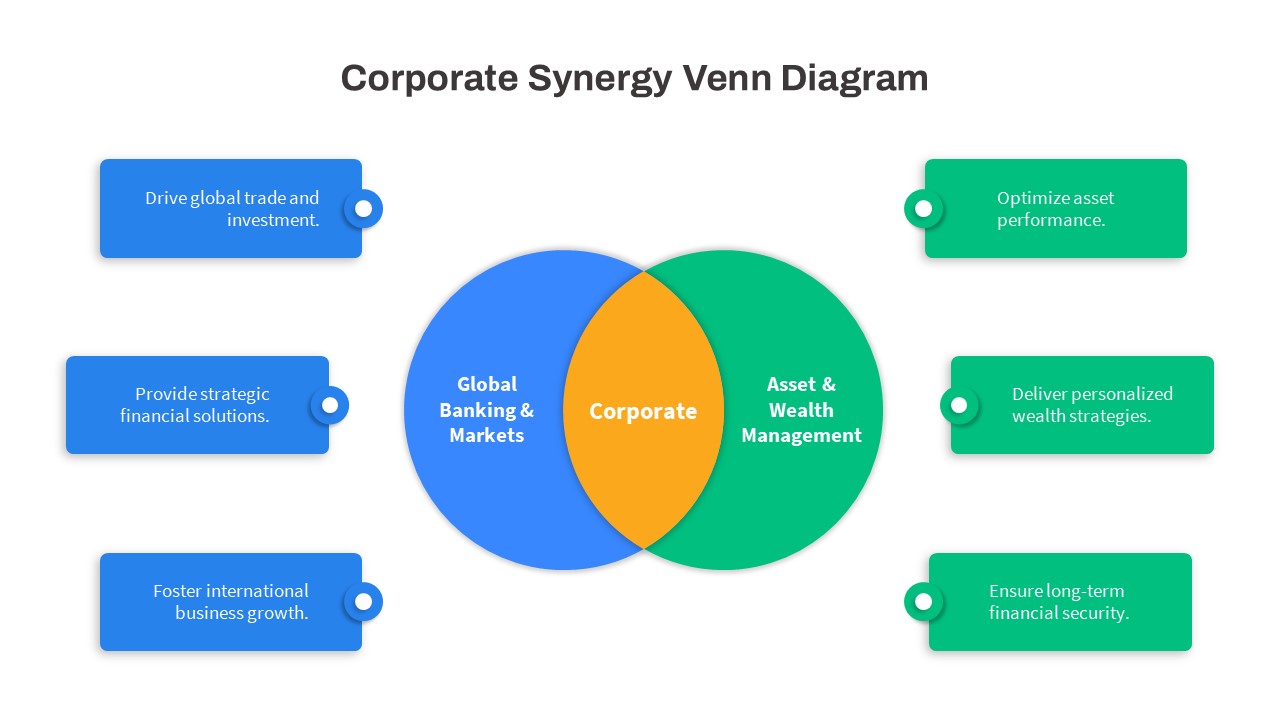
Corporate Synergy Venn Diagram Template for PowerPoint & Google Slides
Comparison
Salience Model Venn Diagram Infographic Template for PowerPoint & Google Slides
Circular
Modern Growth Hacking Venn Diagram Template for PowerPoint & Google Slides
Circular
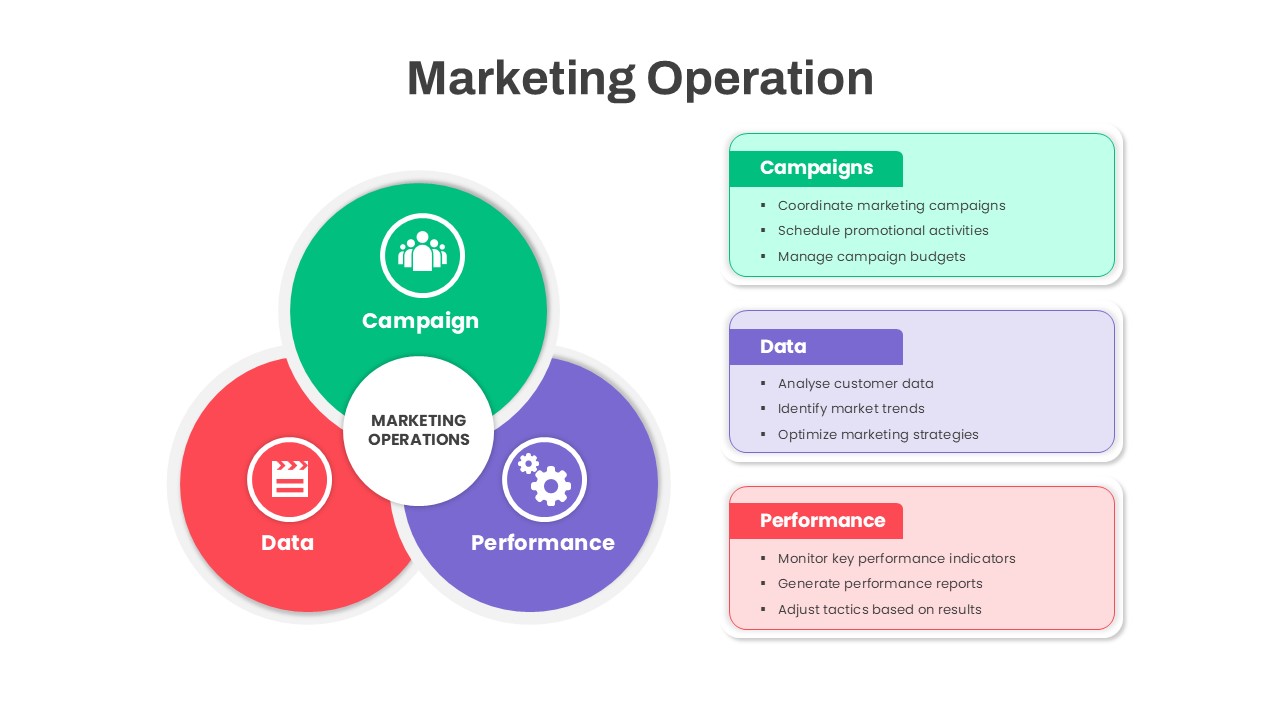
Marketing Operations Venn Diagram Template for PowerPoint & Google Slides
Circular
3Ps Triple Bottom Line Venn Diagram Template for PowerPoint & Google Slides
Circular
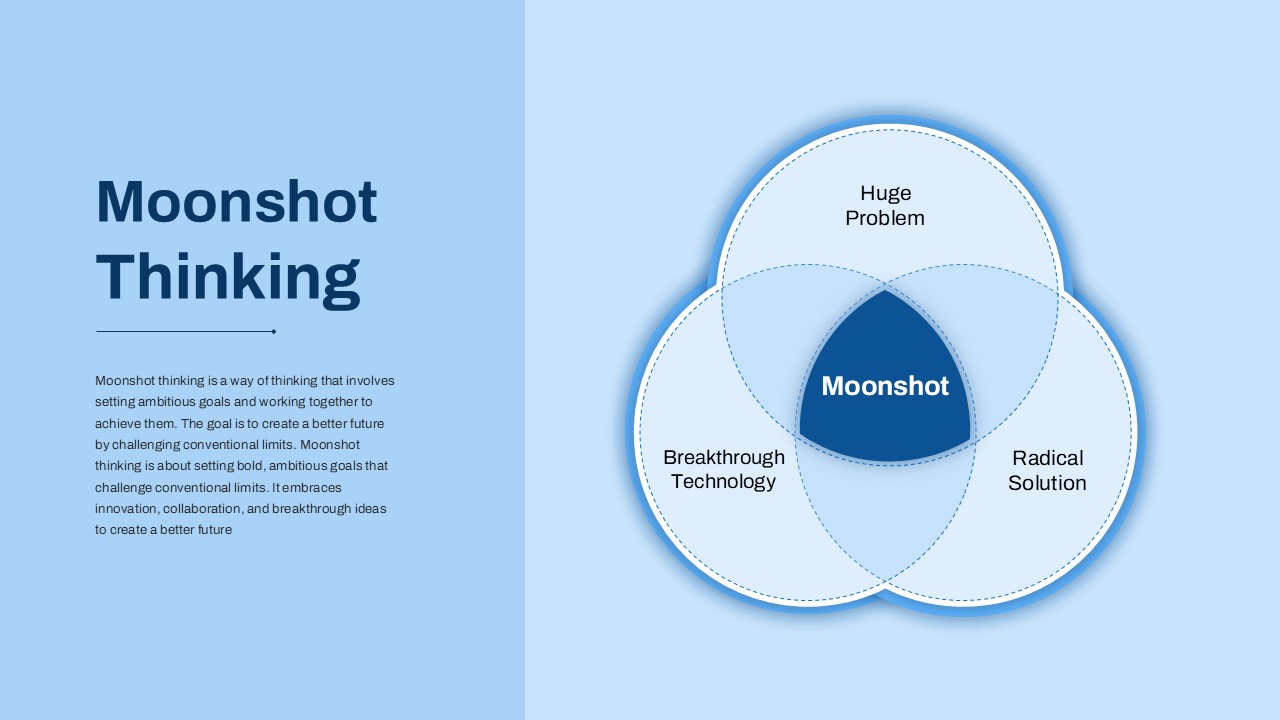
Bold Moonshot Thinking Venn Diagram Template for PowerPoint & Google Slides
Circular
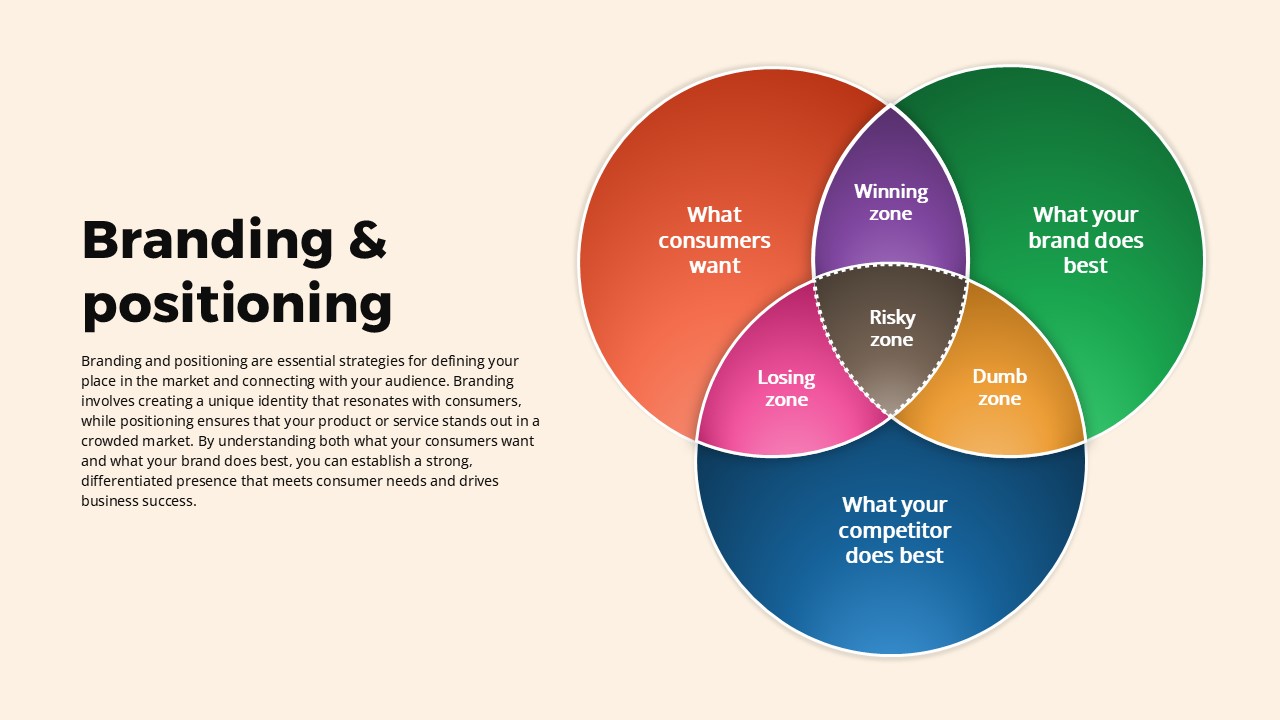
Branding and Positioning Venn Diagram Template for PowerPoint & Google Slides
Comparison
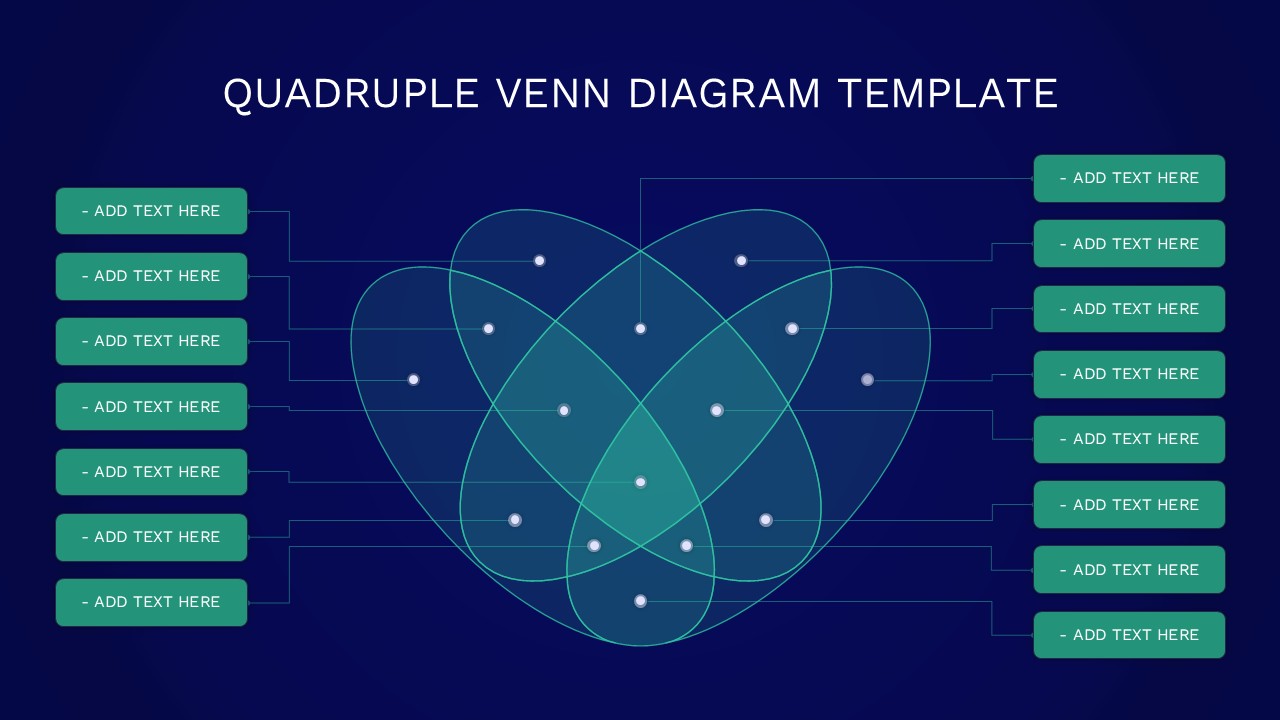
Quadruple Venn Diagram Template for PowerPoint & Google Slides
Circular
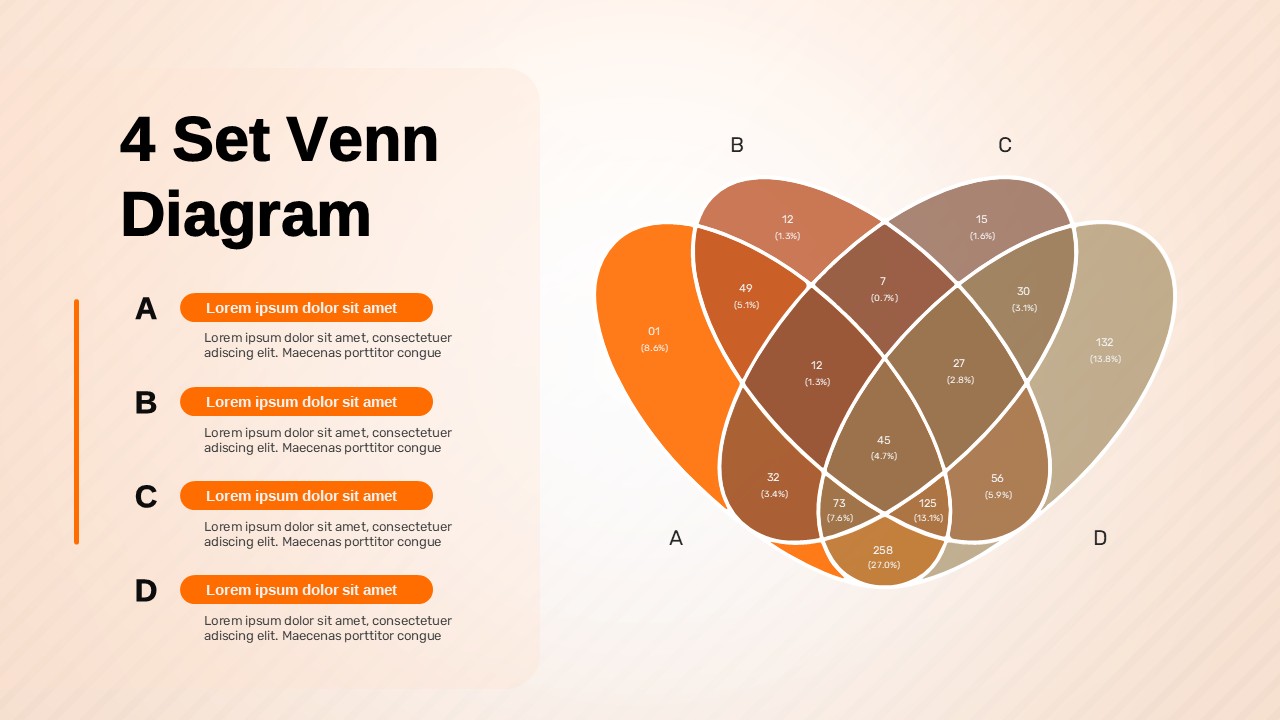
4 Set Venn Diagram Comparison Template for PowerPoint & Google Slides
Comparison
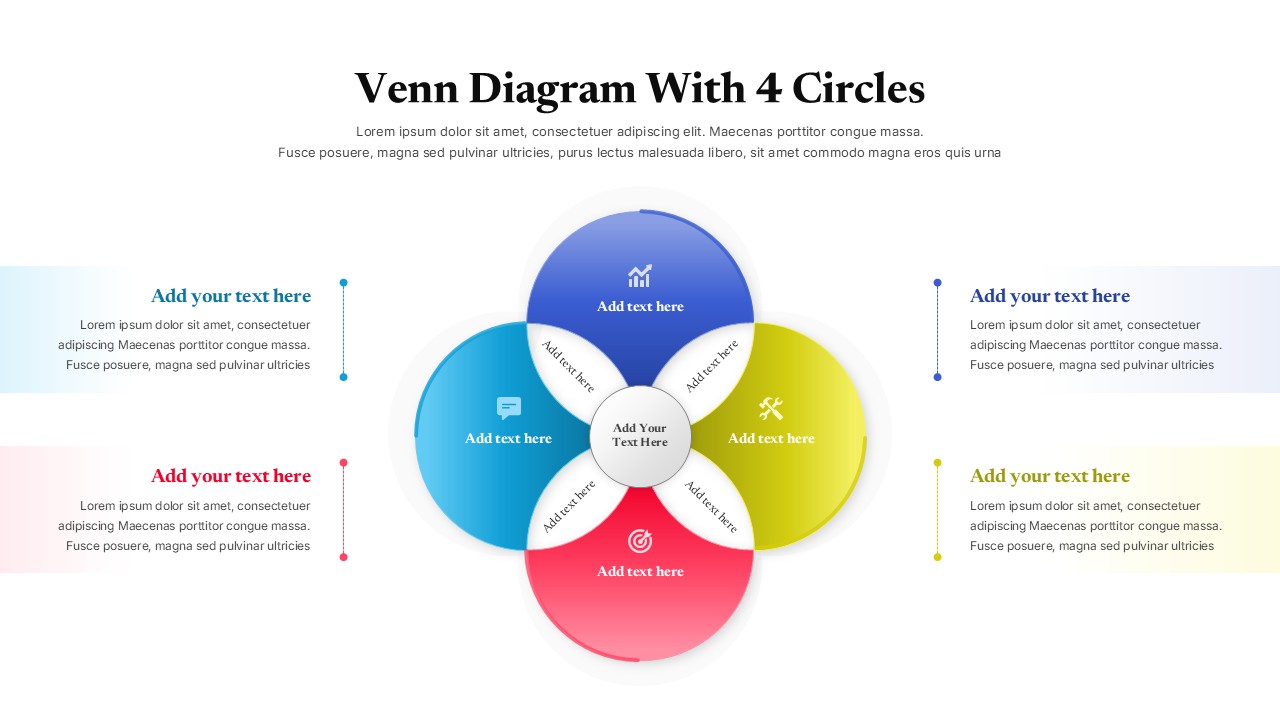
Colorful Venn Diagram with 4 Circle for PowerPoint & Google Slides
Circular
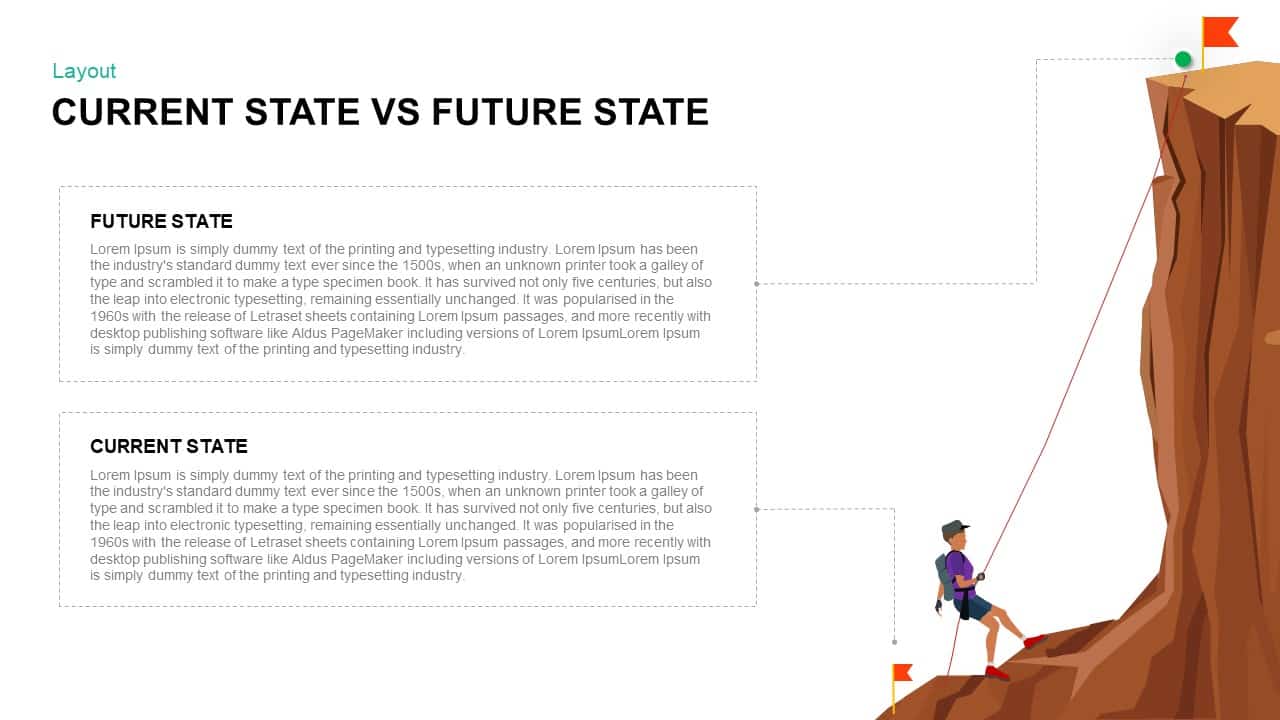
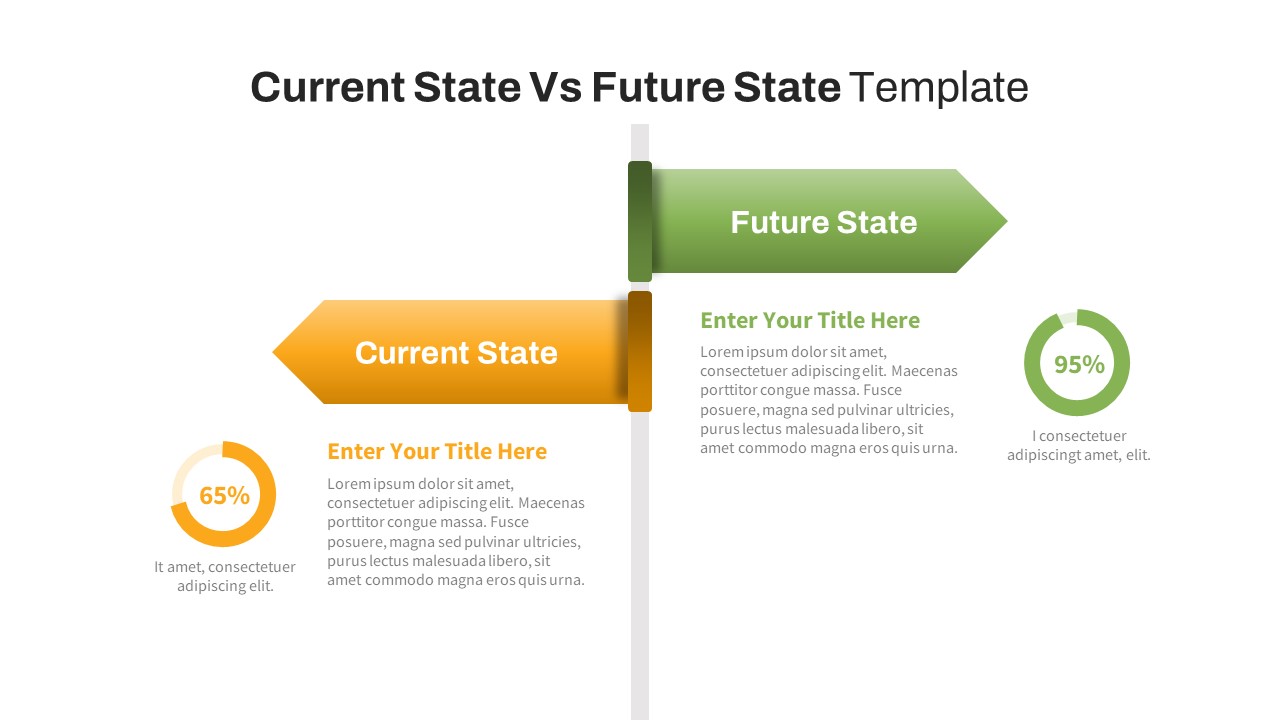
Modern Current vs Future State Template for PowerPoint & Google Slides
Comparison
Current vs Future State Comparison Slide Template for PowerPoint & Google Slides
Comparison Chart
Current vs Future State Comparison Slide Template for PowerPoint & Google Slides
Comparison Chart
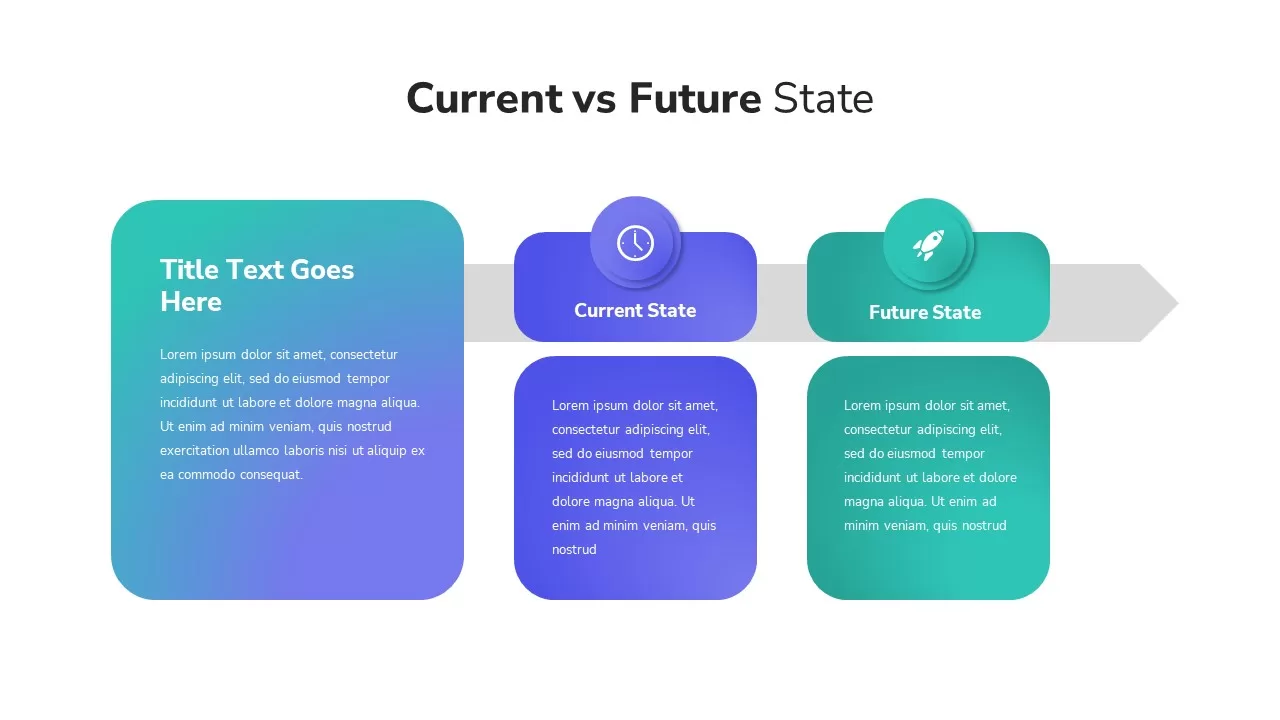
Current vs Future State Comparison Template for PowerPoint & Google Slides
Comparison Chart
Current vs Future State Analysis template for PowerPoint & Google Slides
Comparison
Current vs Future State Gap Analysis template for PowerPoint & Google Slides
Comparison
Diagonal Future Timeline Template for PowerPoint & Google Slides
Timeline
Current vs Future Process Flow Template for PowerPoint & Google Slides
Comparison
Free Current State vs Future State Template for PowerPoint & Google Slides
Business Strategy
Free
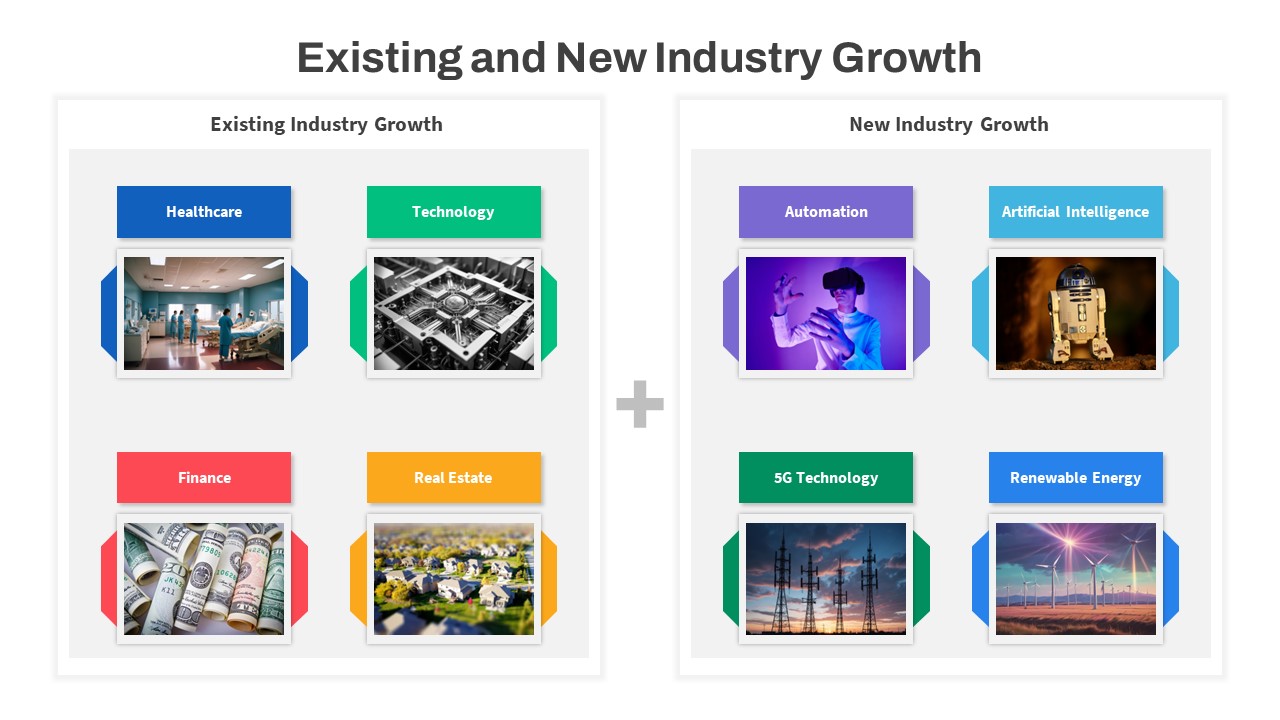
Current and Future Industry Innovations Template for PowerPoint & Google Slides
Comparison
AI & Future of Work Gradient Cover Slide Template for PowerPoint & Google Slides
AI
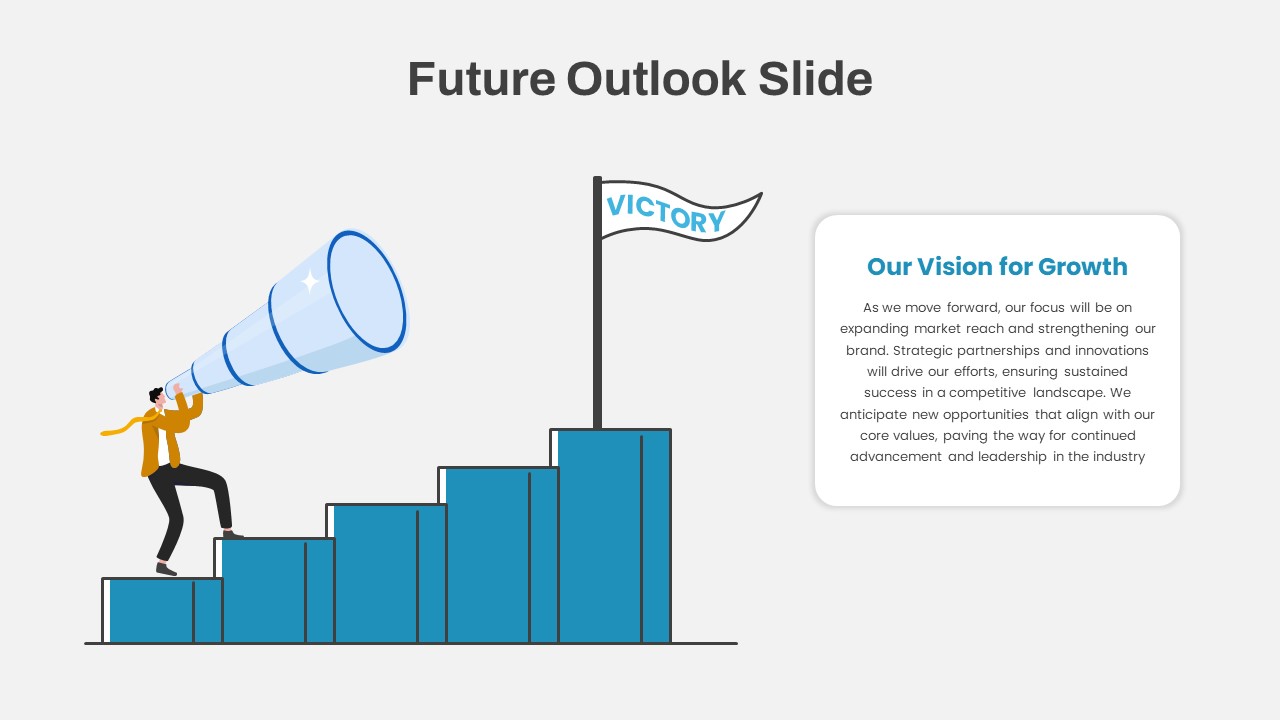
Future Outlook and Growth Strategy Slide Template for PowerPoint & Google Slides
Infographics
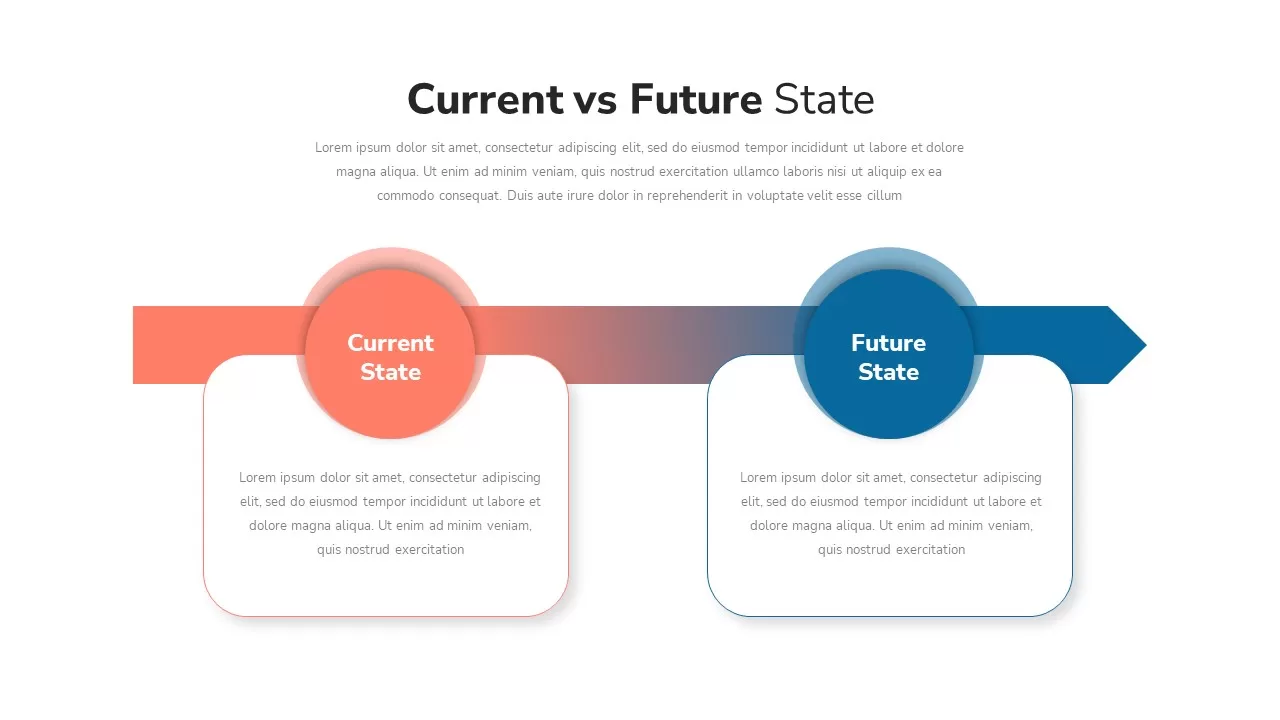
Current VS Future State PowerPoint Presentation Template
Comparison Chart
Snake Diagram Pack of 8 Slides template for PowerPoint & Google Slides
Process
Gear Process Diagram PowerPoint Template for PowerPoint & Google Slides
Process
Sales Process Workflow Funnel Diagram PowerPoint Template for PowerPoint & Google Slides
Funnel
Puzzle Diagram PowerPoint Template for PowerPoint & Google Slides
Process
Transportation Logistics PowerPoint Diagram template for PowerPoint & Google Slides
Process
Emoji Scale PowerPoint Diagram for PowerPoint & Google Slides
Infographics
4 Step Problem Solving PowerPoint Diagram for PowerPoint & Google Slides
Process
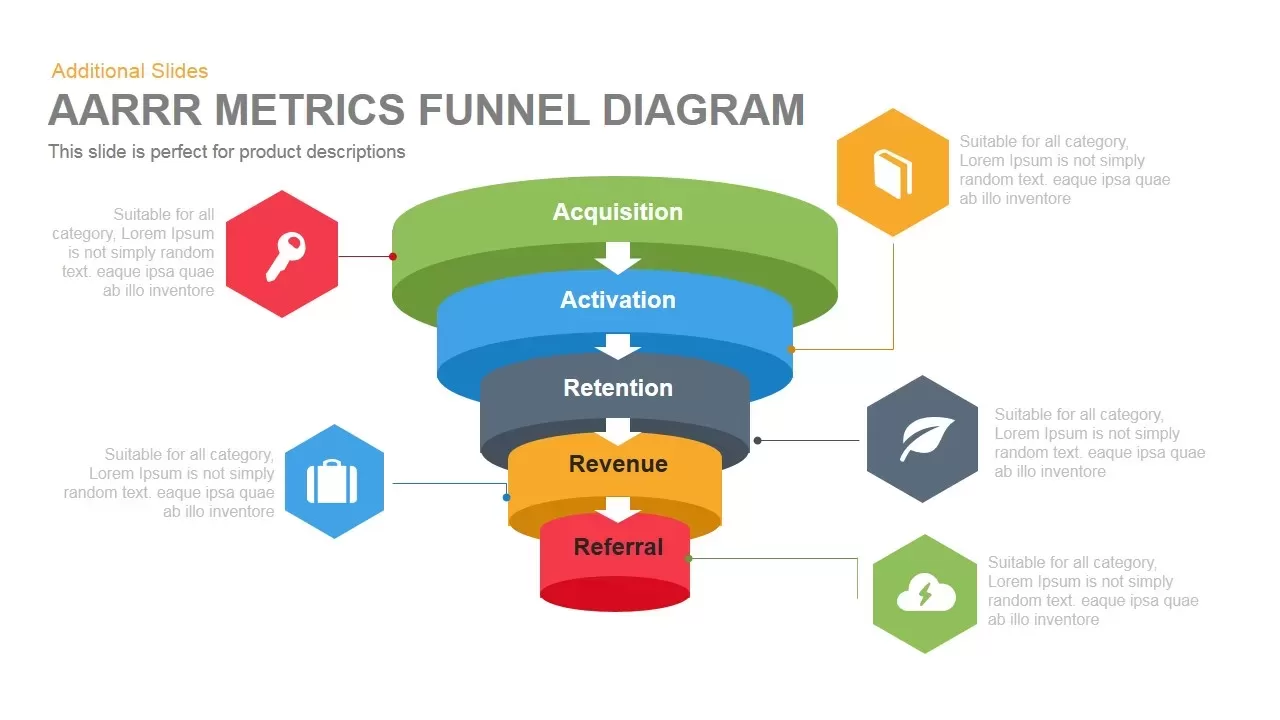
AARRR Funnel Diagram template for PowerPoint & Google Slides
Funnel
Circular Flow Diagram Template for PowerPoint & Google Slides
Infographics
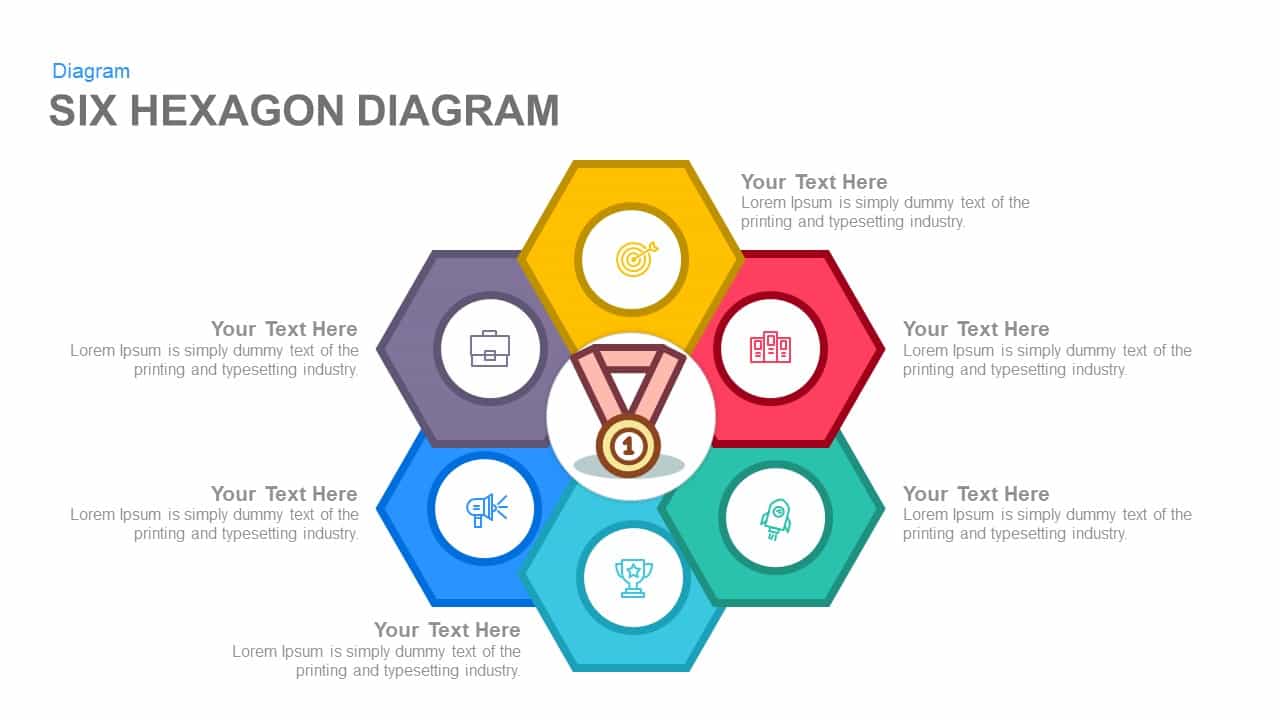
Six Hexagon Stages Process Flow Diagram Template for PowerPoint & Google Slides
Process
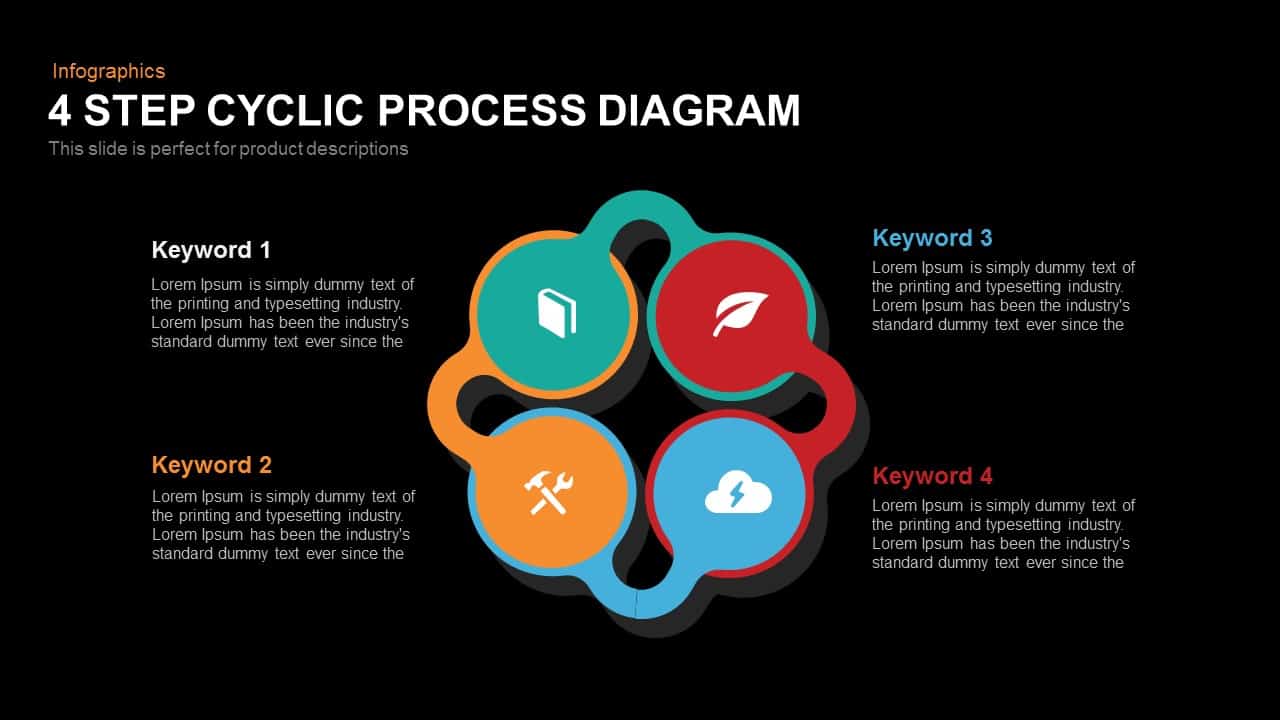
Modern 4-Step Cyclic Process Diagram Template for PowerPoint & Google Slides
Circular
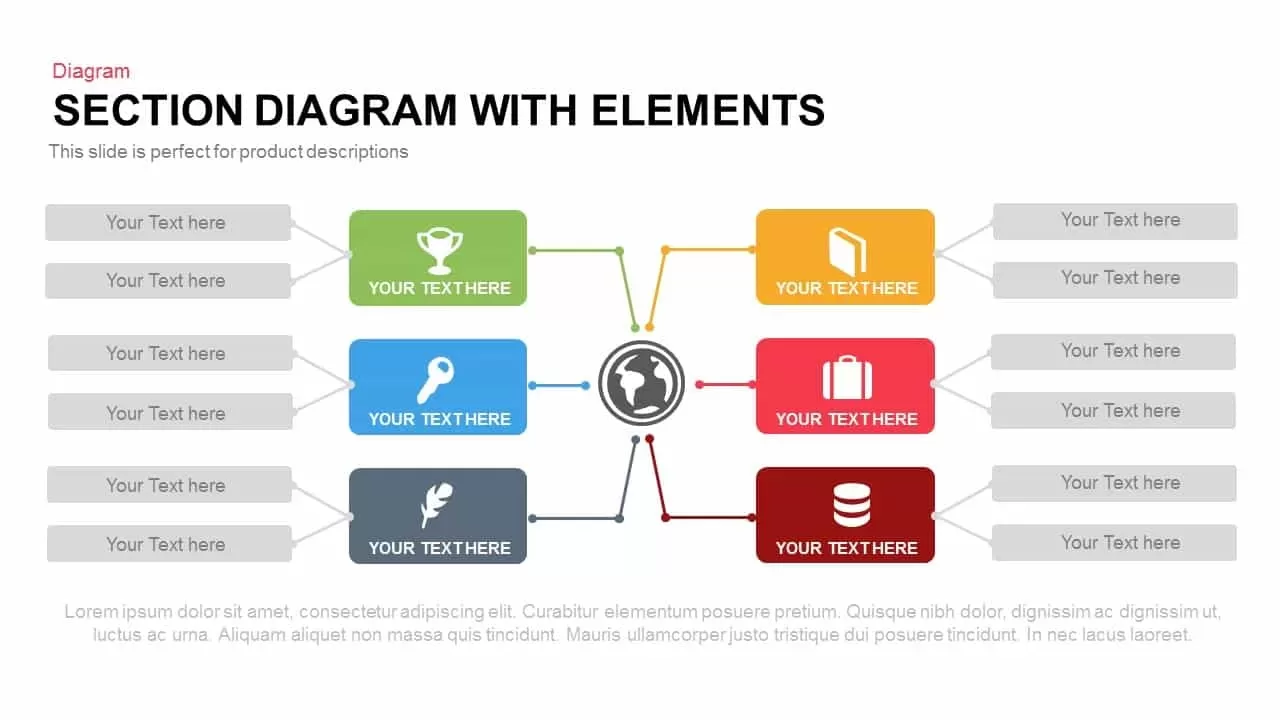
Section Diagram Elements Infographic Template for PowerPoint & Google Slides
Process
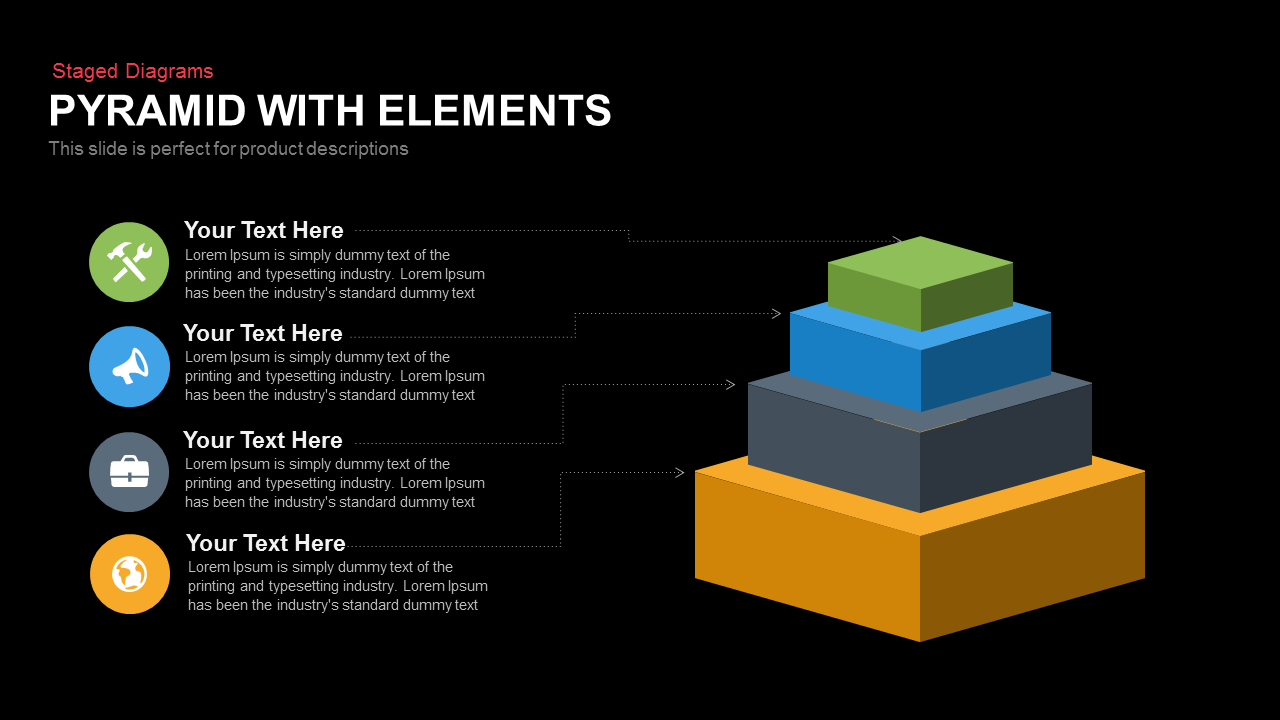
4-Step 3D Pyramid Diagram with Callouts template for PowerPoint & Google Slides
Pyramid

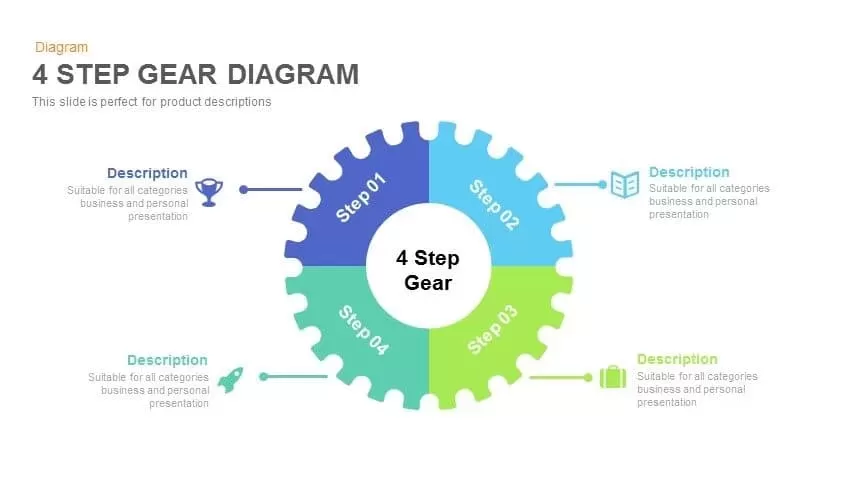
4 Step Gear Diagram Template for PowerPoint & Google Slides
Process
Pie Segment Diagram Four-Step Process Template for PowerPoint & Google Slides
Pie/Donut
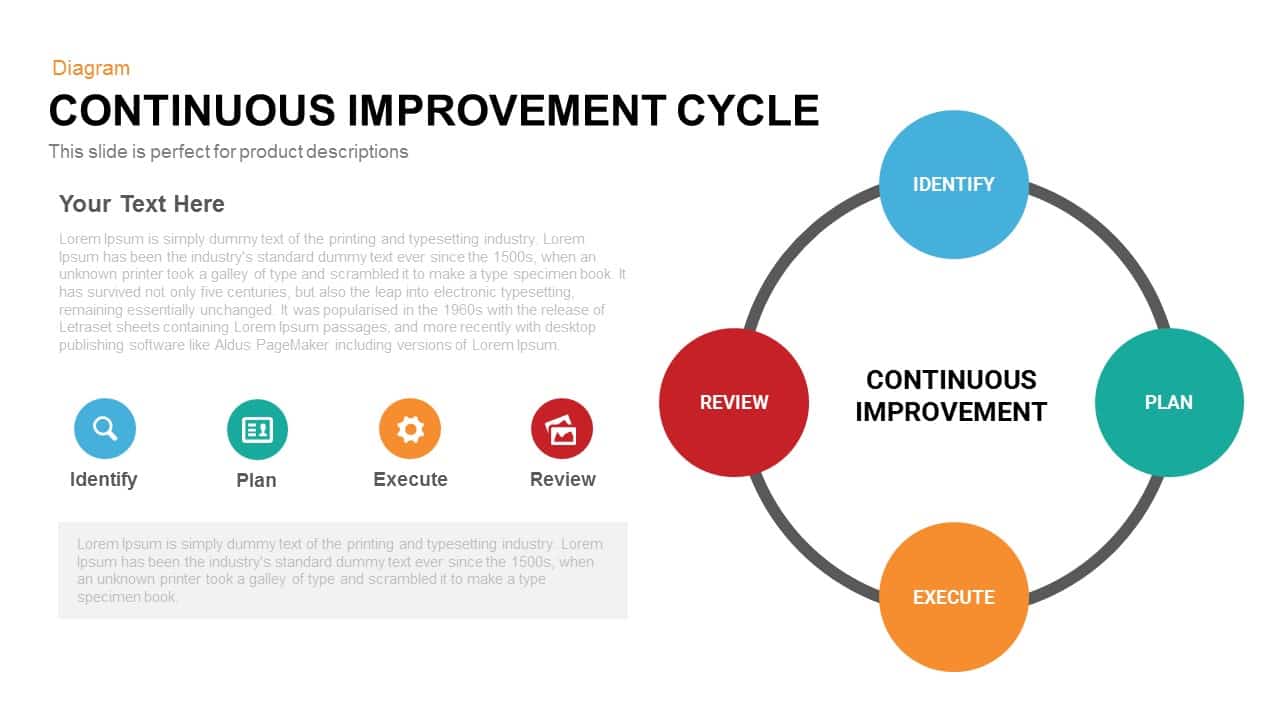
Continuous Improvement Cycle Diagram Template for PowerPoint & Google Slides
Circular
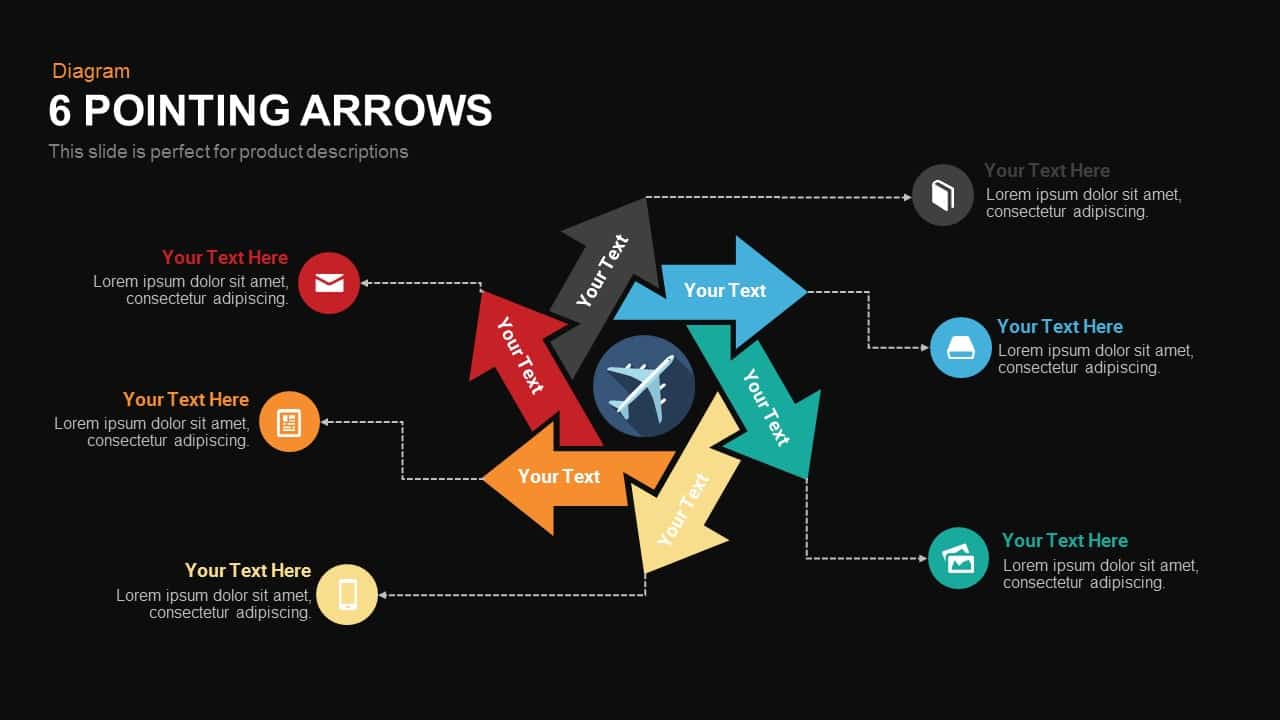
Six Pointing Arrow Process Diagram Template for PowerPoint & Google Slides
Arrow
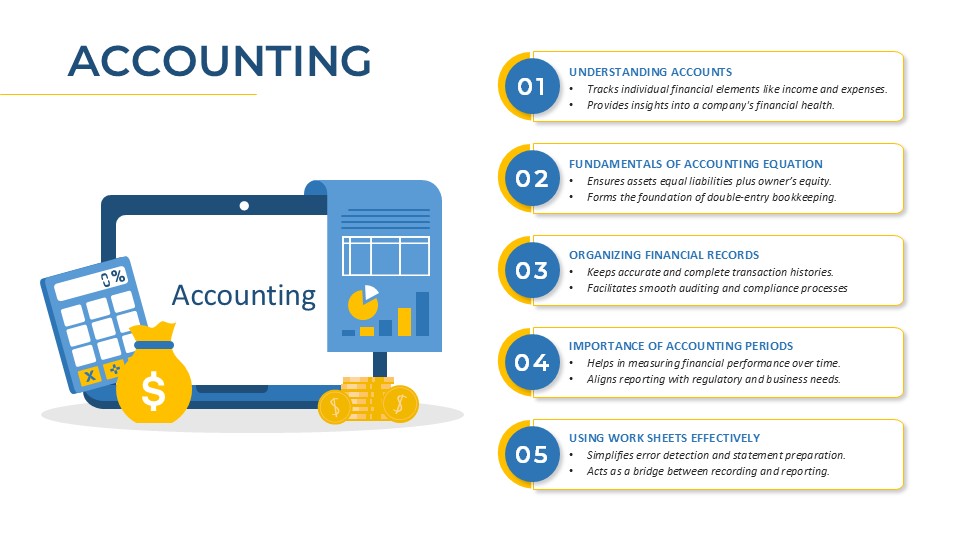
Accounting Process Metaphor Diagram Template for PowerPoint & Google Slides
Accounting
Five-Section Arrow Signpost Diagram Template for PowerPoint & Google Slides
Arrow
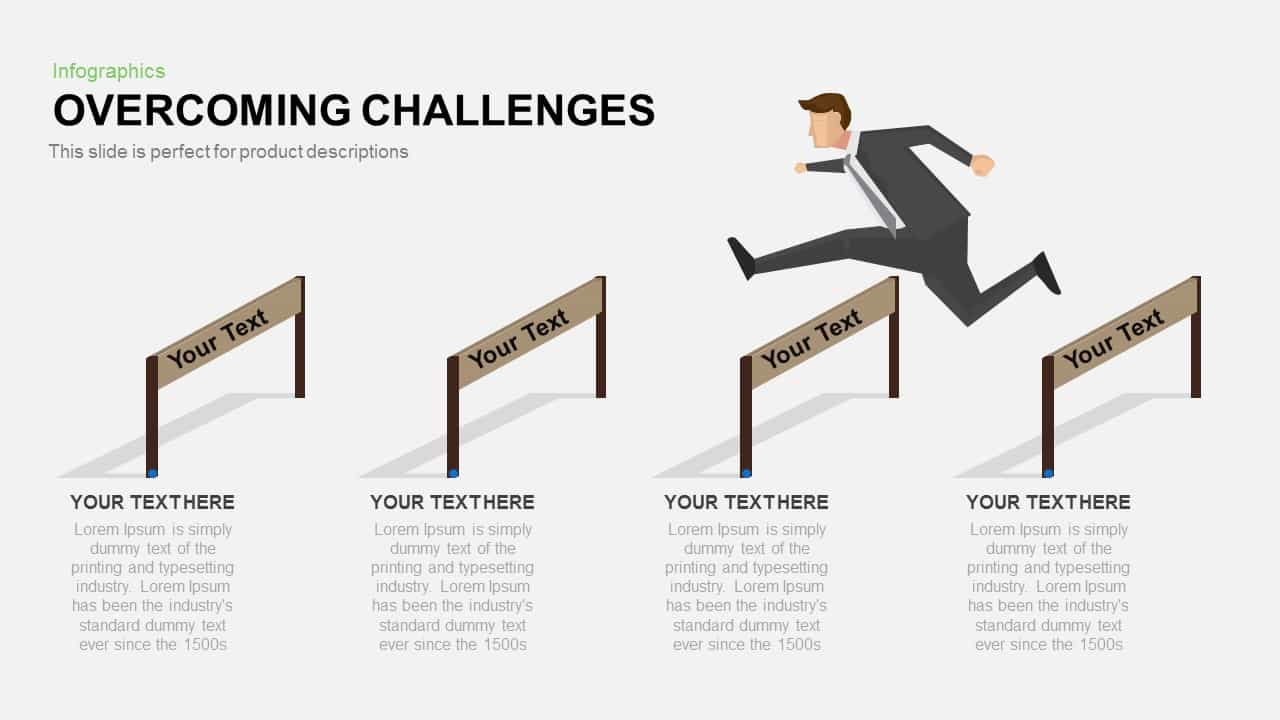
Overcoming Challenges Hurdle Diagram Template for PowerPoint & Google Slides
Process
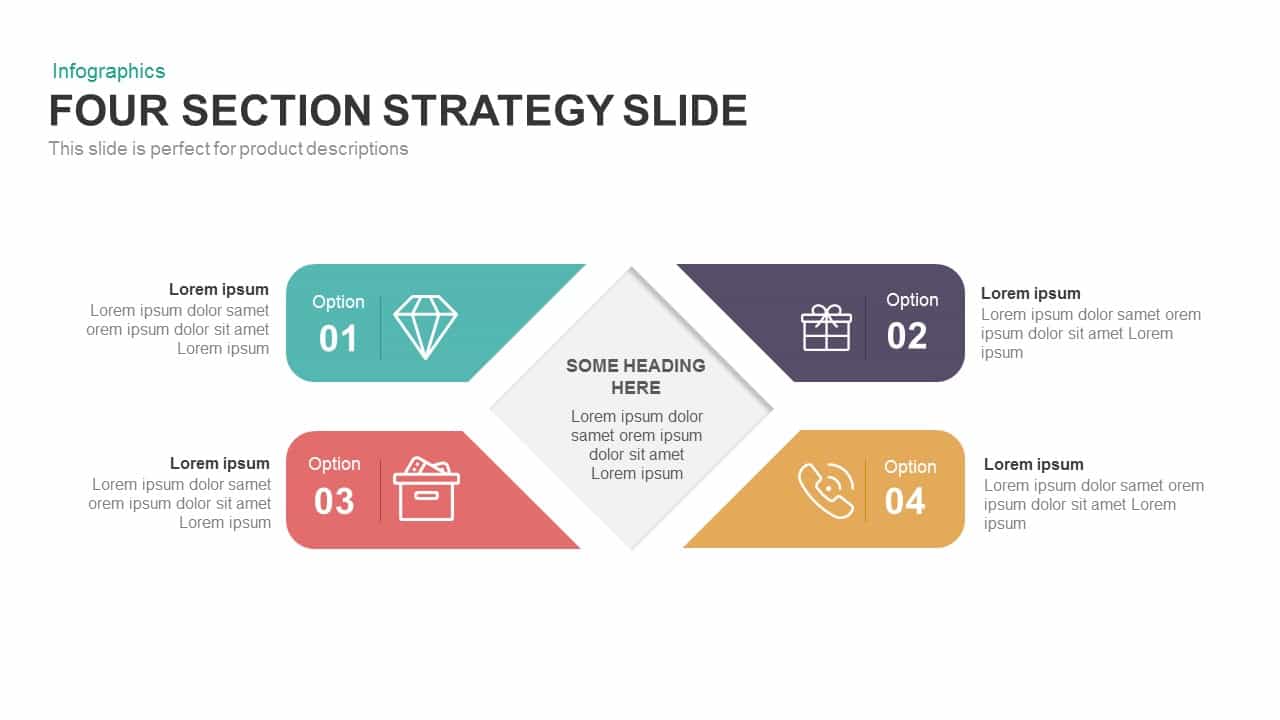
Four-Section Strategy Diagram Slide Template for PowerPoint & Google Slides
Business Strategy
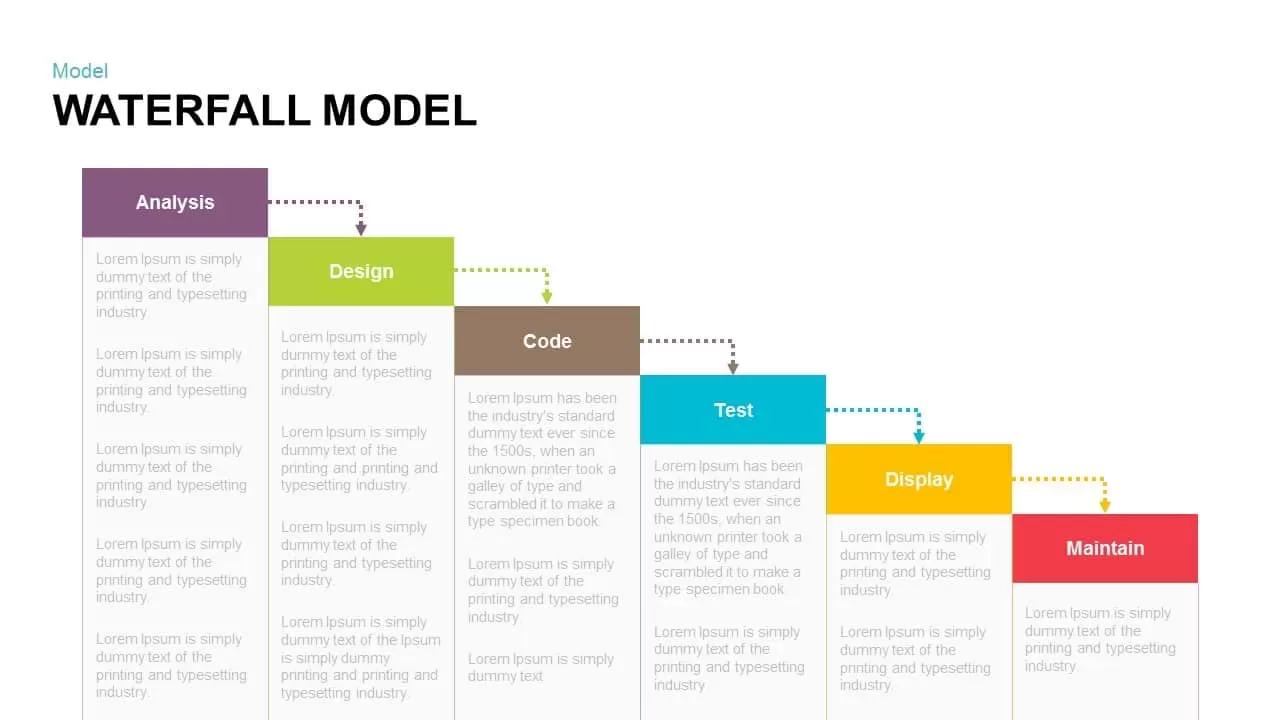
Waterfall Model Diagram Template for PowerPoint & Google Slides
Information Technology
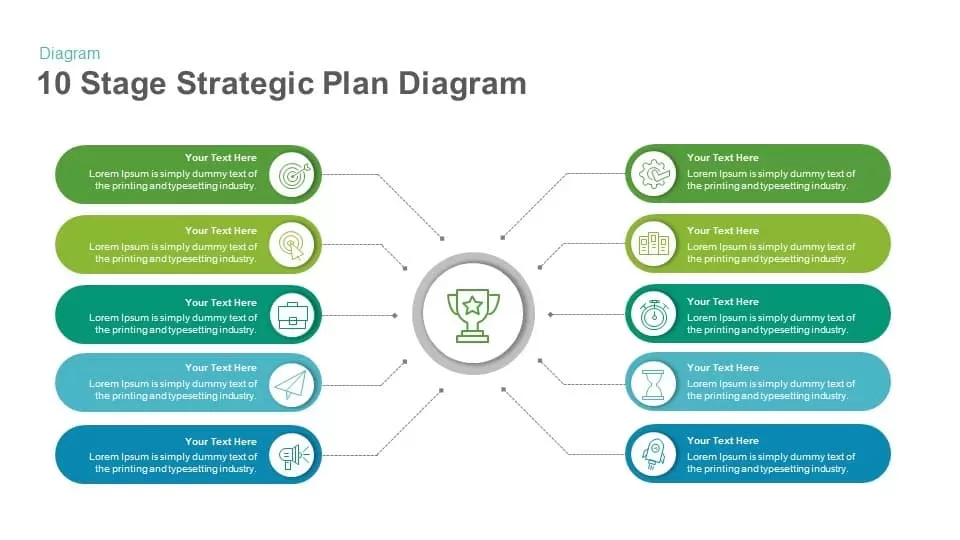
10 Stage Strategic Plan Diagram template for PowerPoint & Google Slides
Process

Elegant Process Support Arrow Diagram Template for PowerPoint & Google Slides
Arrow
Six Hexagon Hub-and-Spoke Diagram Template for PowerPoint & Google Slides
Process
Eight-Stage Radial Process Flow Diagram Template for PowerPoint & Google Slides
Process
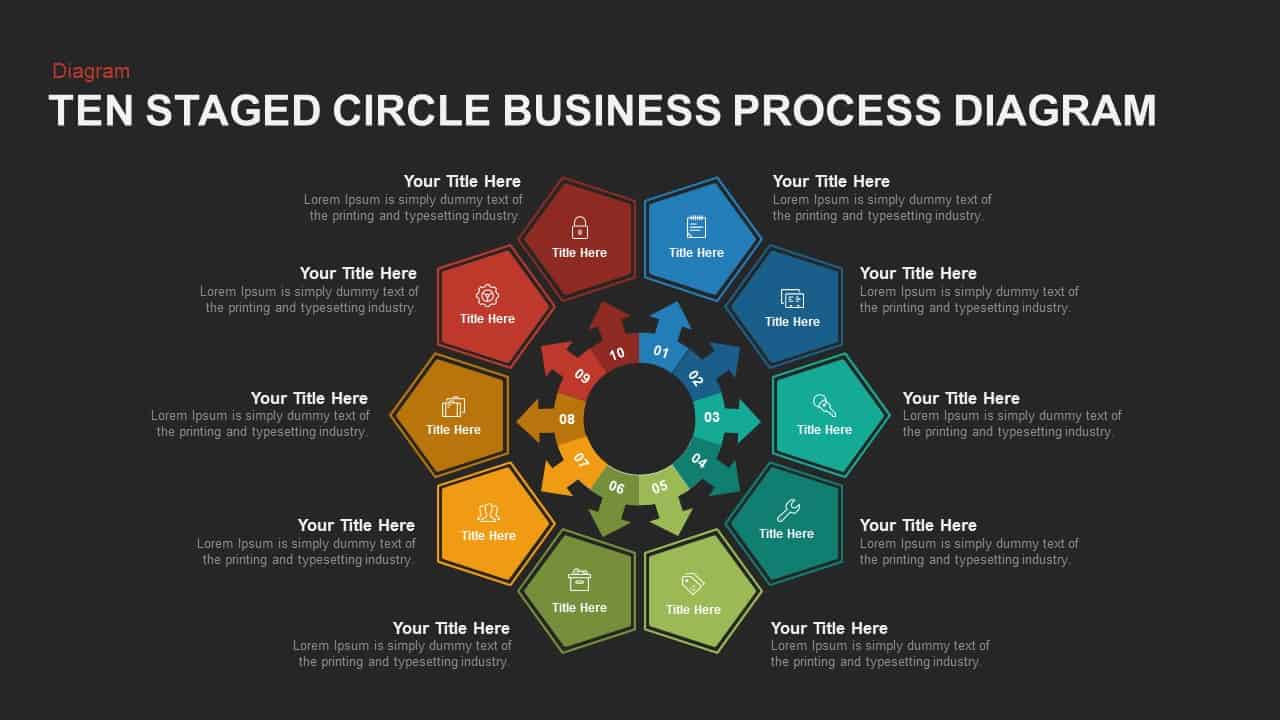
Ten-Stage Business Process Diagram Template for PowerPoint & Google Slides
Process
Free Six-Stage Arrow Process Diagram Template for PowerPoint & Google Slides
Process
Free
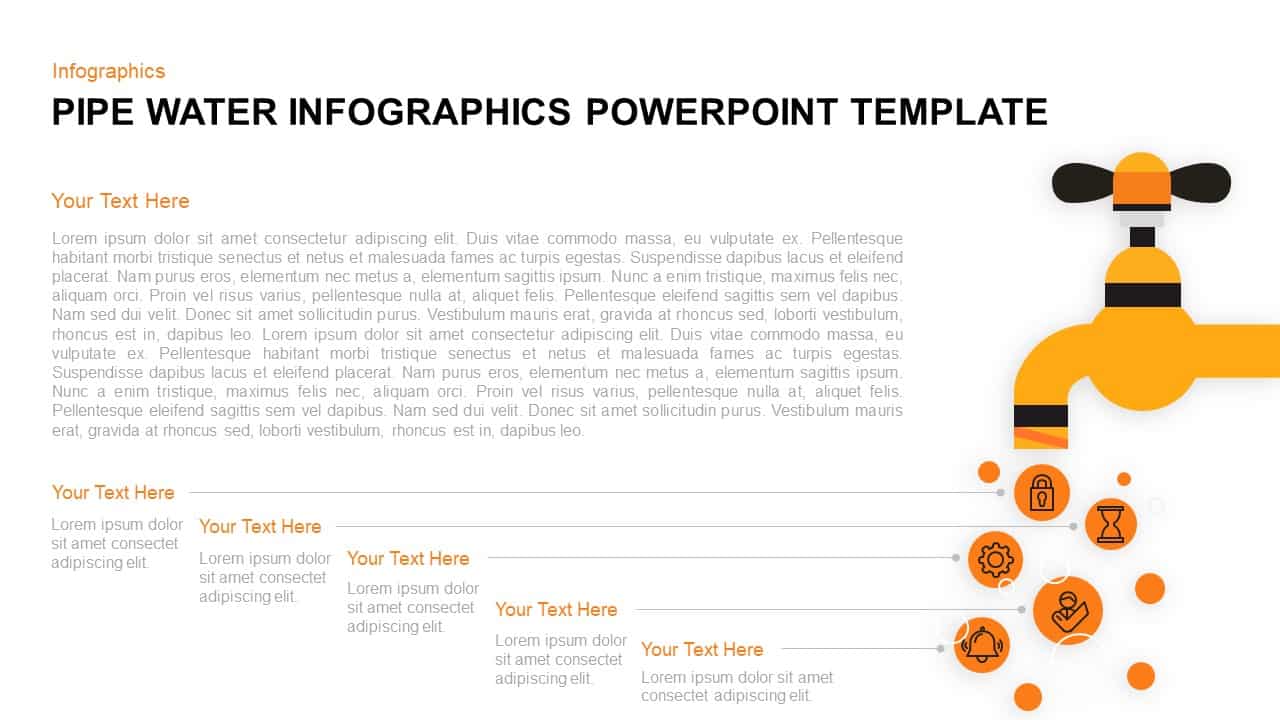
Pipe Water Infographics Flow Diagram Template for PowerPoint & Google Slides
Process
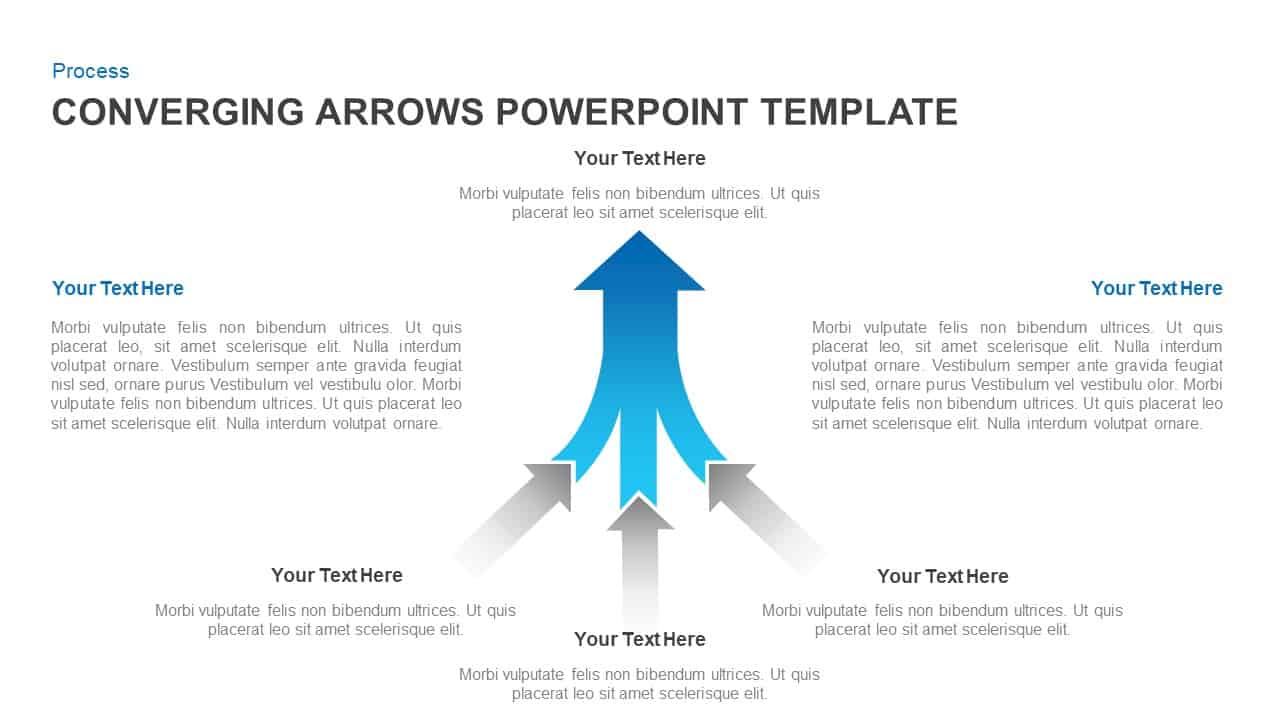
Converging Arrows Process Diagram Template for PowerPoint & Google Slides
Arrow
Value Chain Circular Process Diagram Template for PowerPoint & Google Slides
Business Models
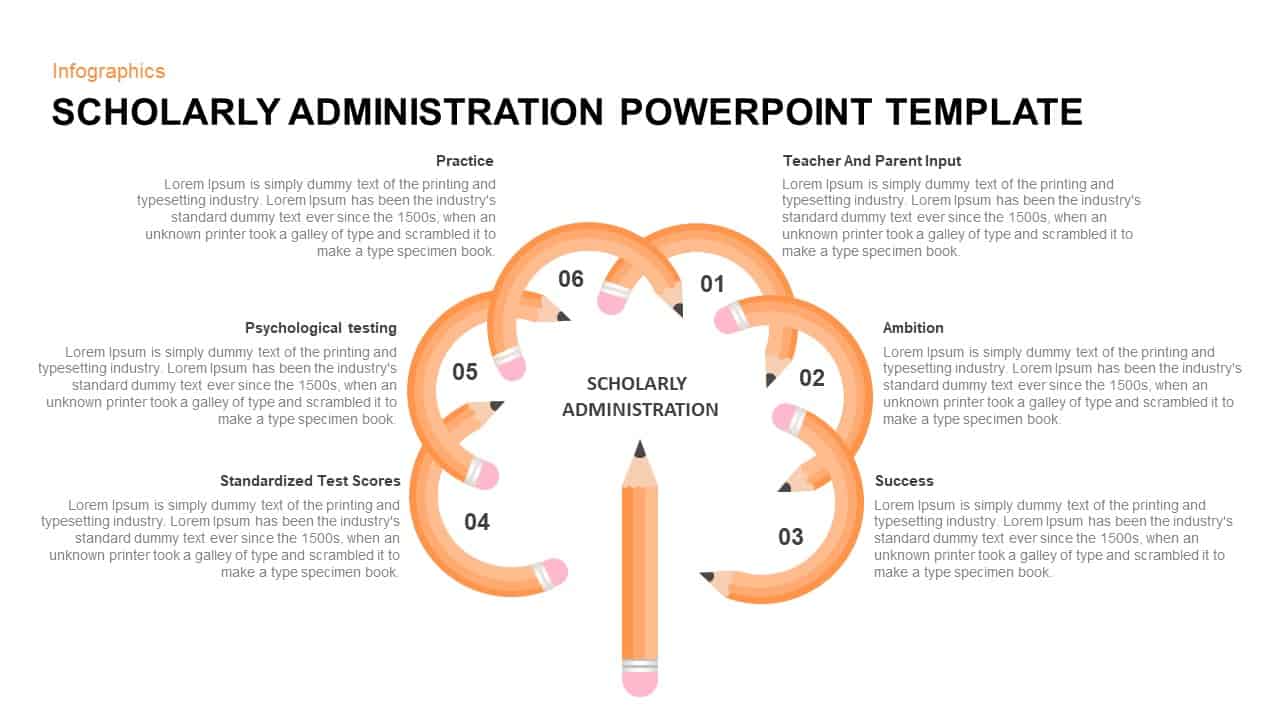
Scholarly Administration Loop Diagram Template for PowerPoint & Google Slides
Process
3D Block Arrow Infographic Diagram Template for PowerPoint & Google Slides
Arrow
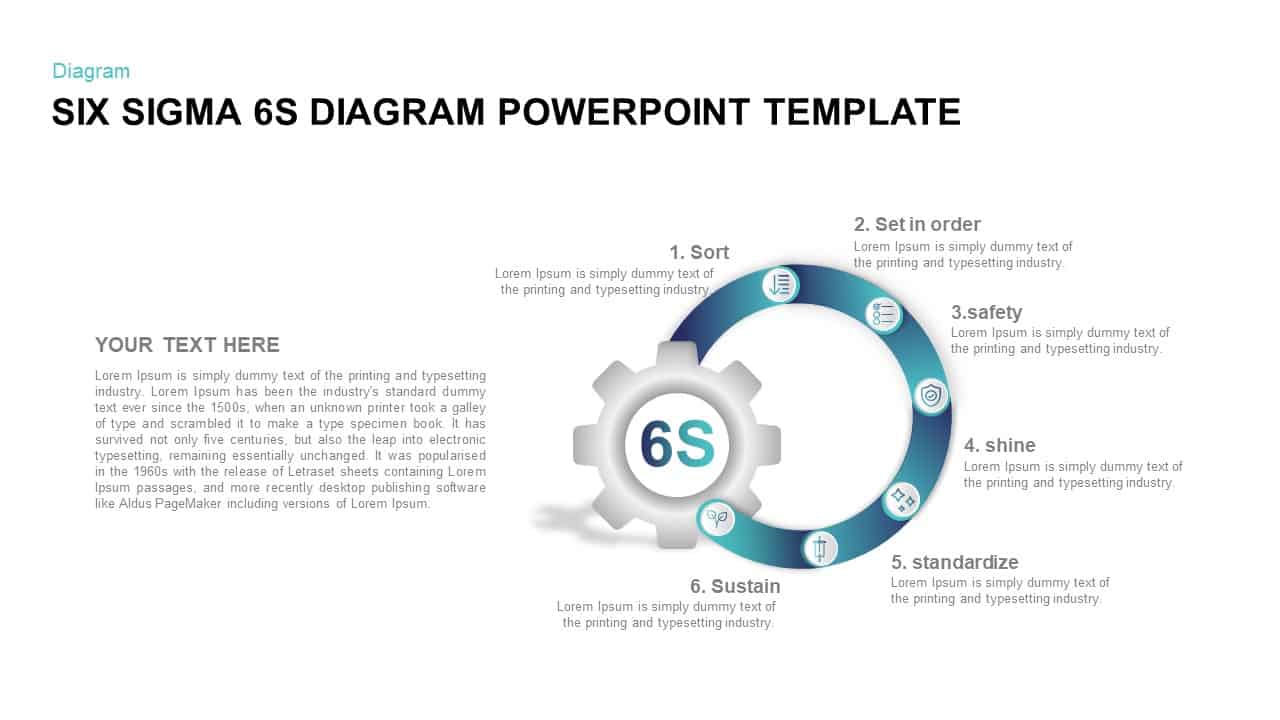
Six Sigma 6S Process Diagram Template for PowerPoint & Google Slides
Process

2-8 Step Circular Diagram Template for PowerPoint & Google Slides
Infographics
4-Step Circular PDCA Cycle Diagram Template for PowerPoint & Google Slides
Process
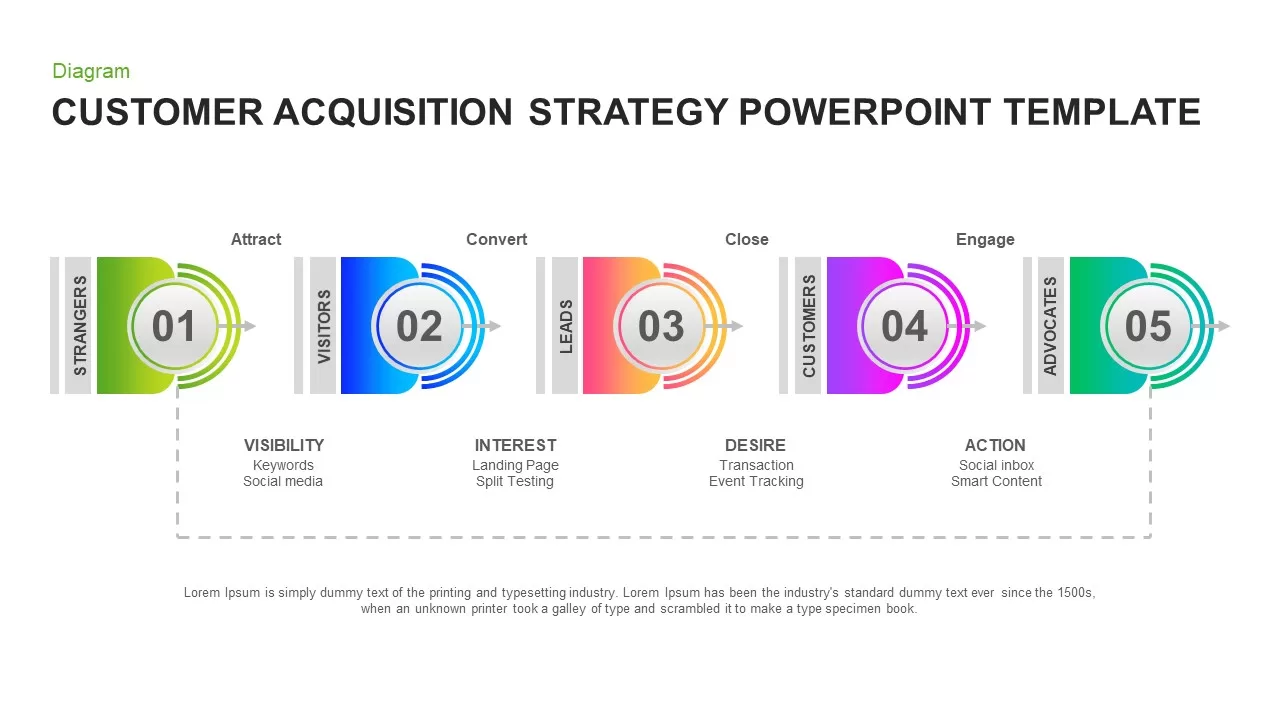
Customer Acquisition Strategy Diagram Template for PowerPoint & Google Slides
Customer Journey
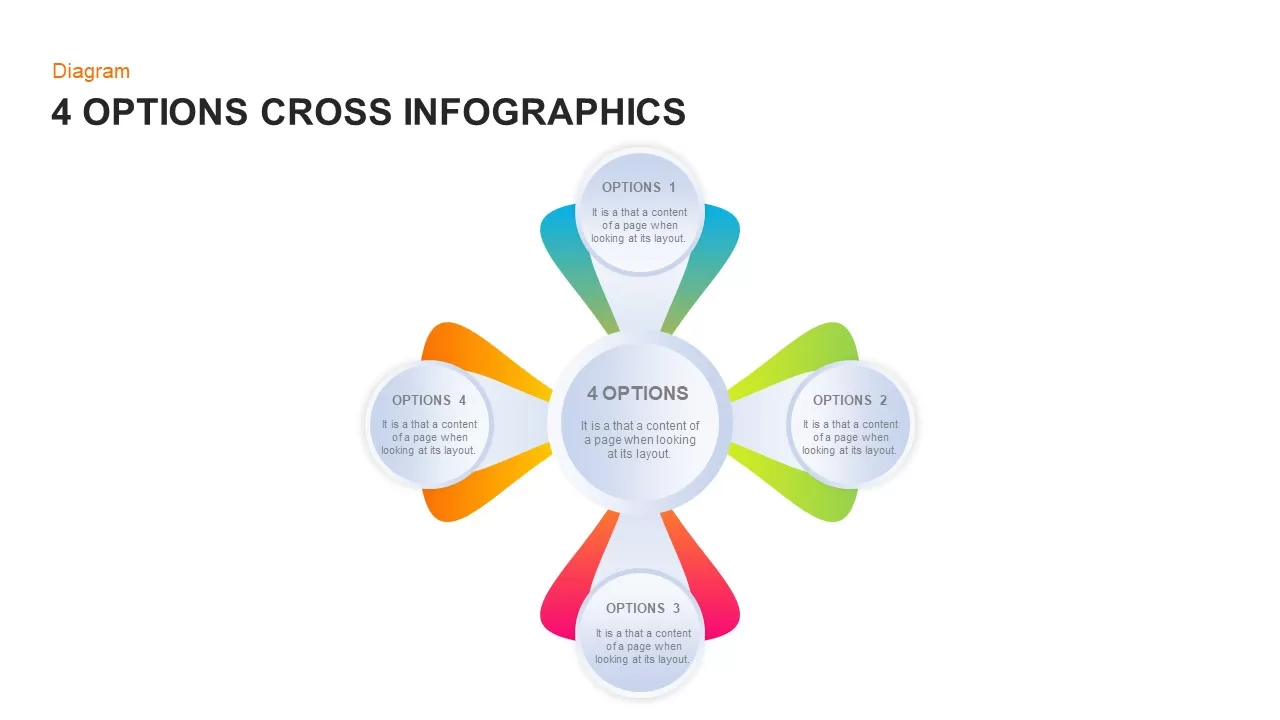
Four-Option Cross Infographic Diagram Template for PowerPoint & Google Slides
Comparison
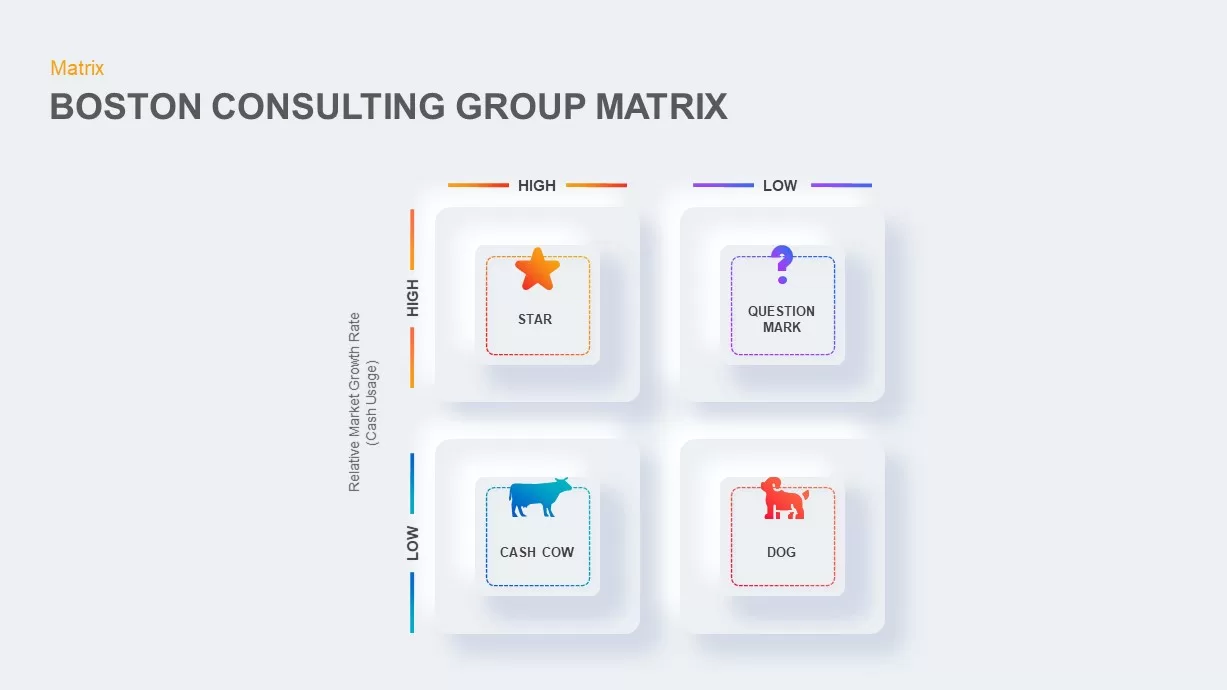
Boston Consulting Group Matrix Diagram Template for PowerPoint & Google Slides
BCG
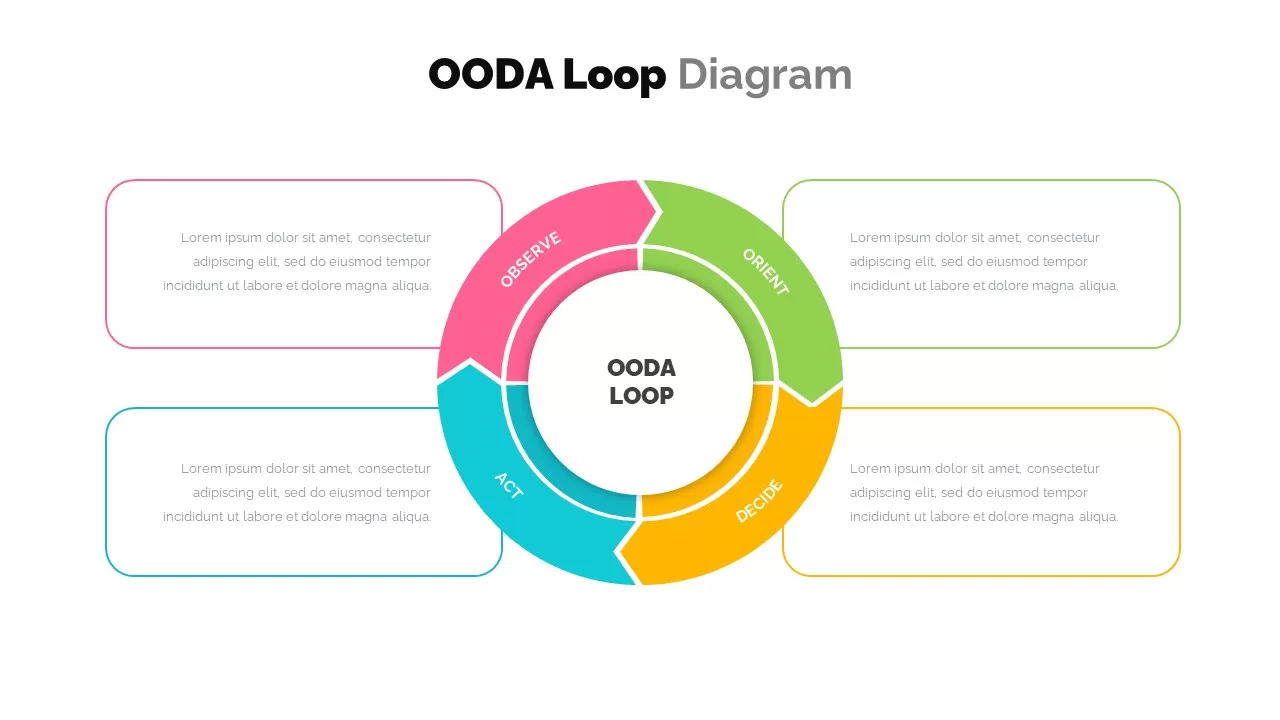
OODA Loop Diagram template for PowerPoint & Google Slides
Business
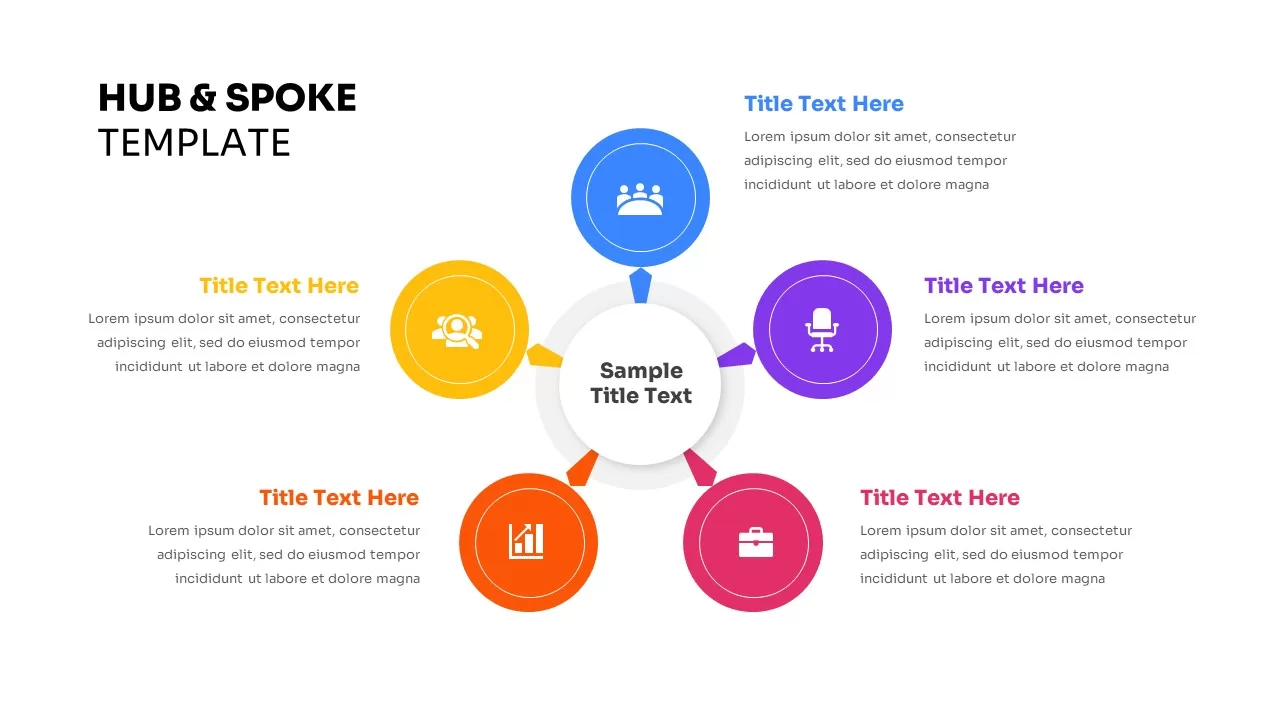
Five-Node Hub and Spoke Diagram Template for PowerPoint & Google Slides
Business Strategy
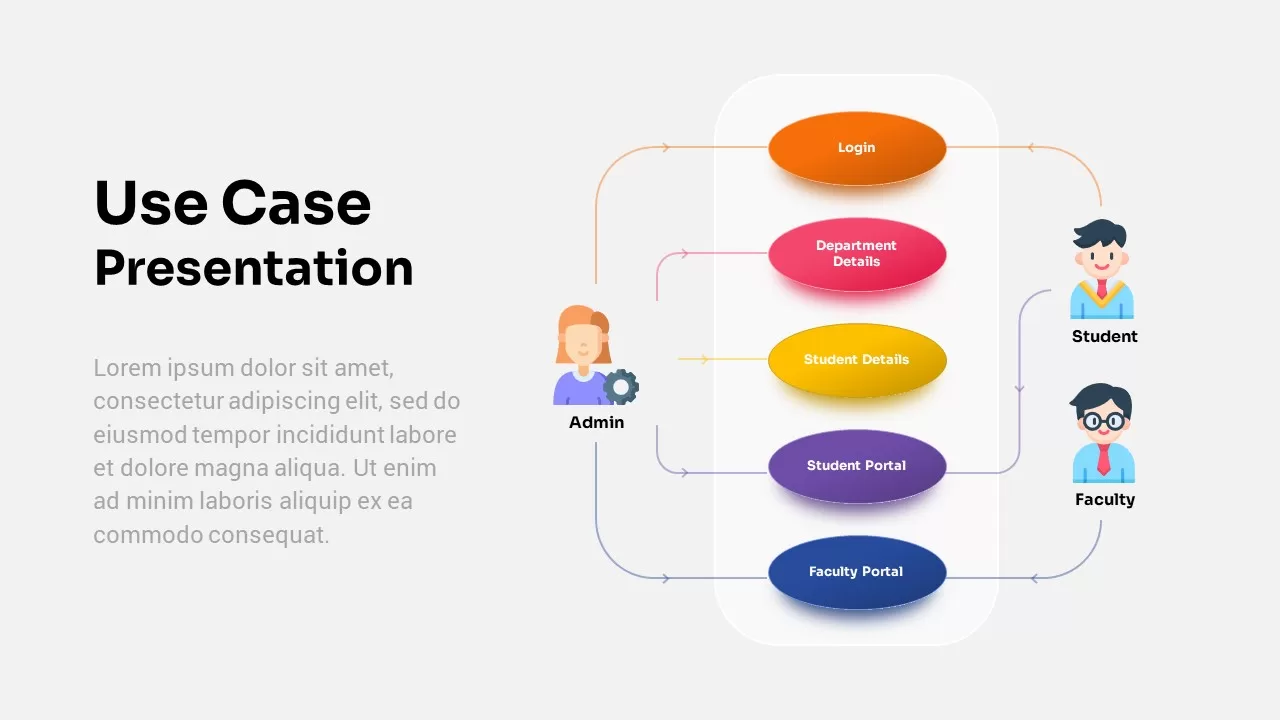
Educational System Use Case Diagram Template for PowerPoint & Google Slides
Software Development
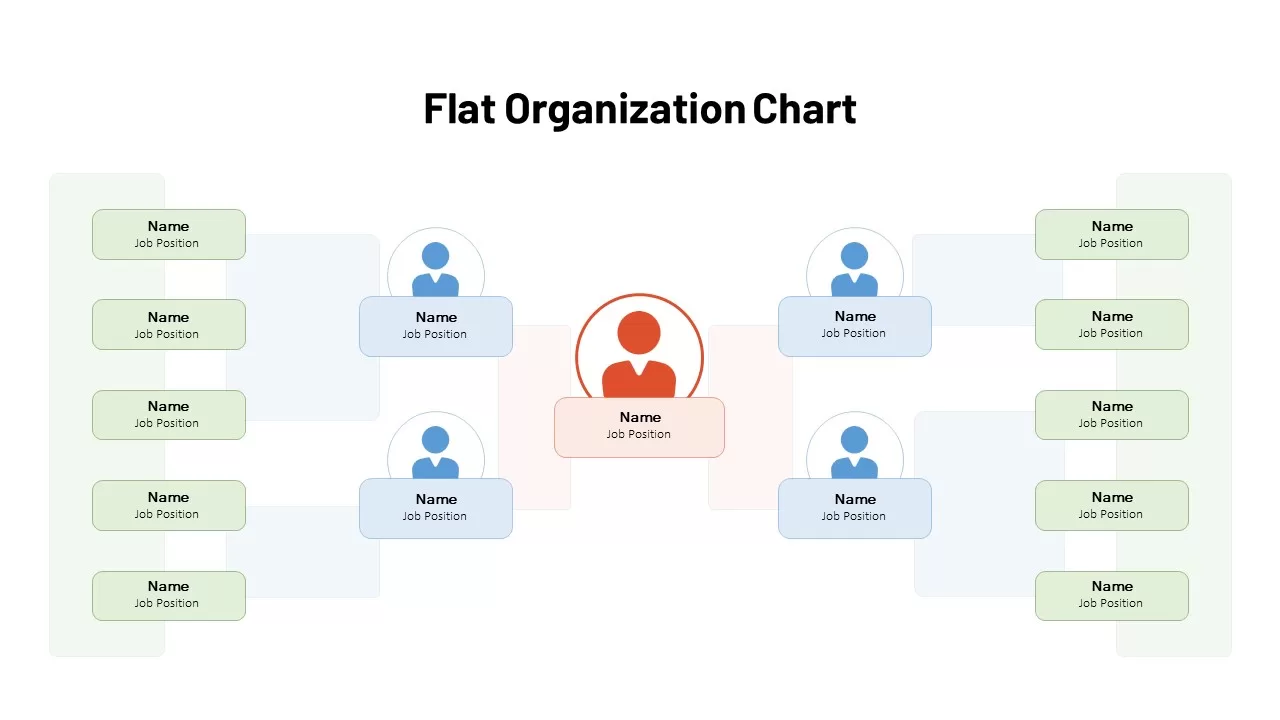
Flat Organization Chart Diagram Template for PowerPoint & Google Slides
Org Chart
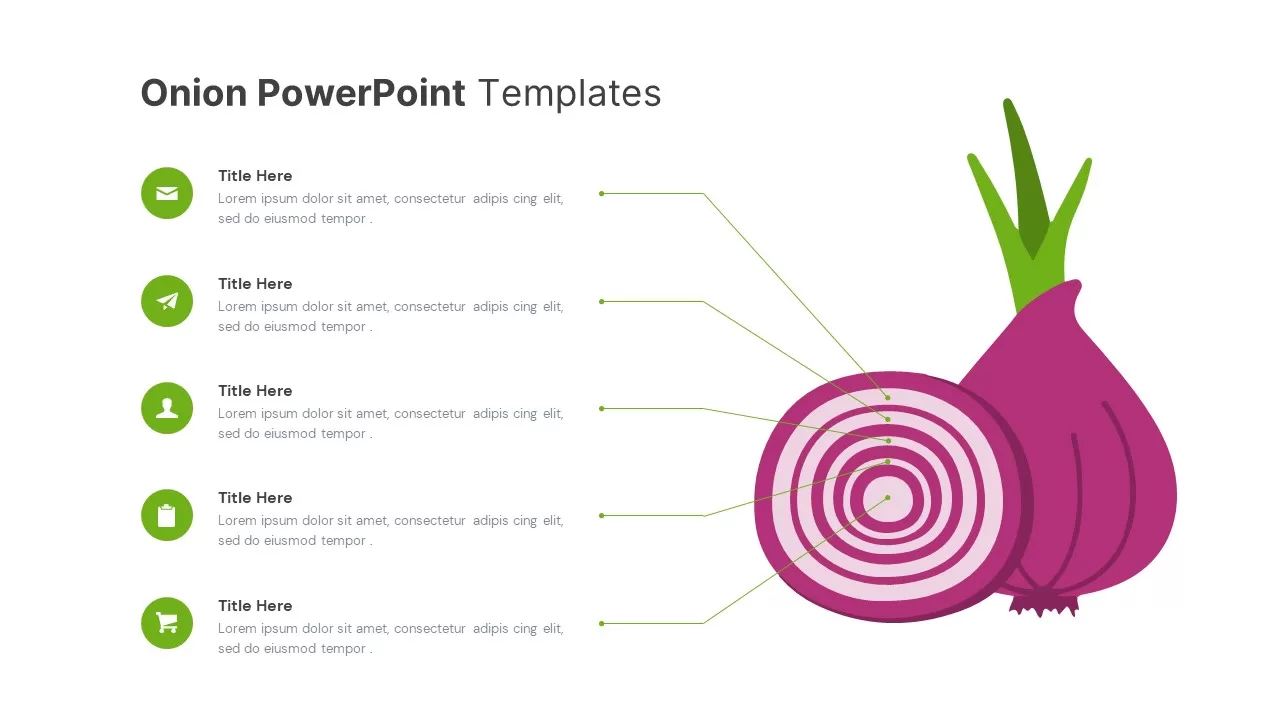
Onion Diagram Callout Template for PowerPoint & Google Slides
Process
Three-Stage S Curve Growth Diagram Template for PowerPoint & Google Slides
Process
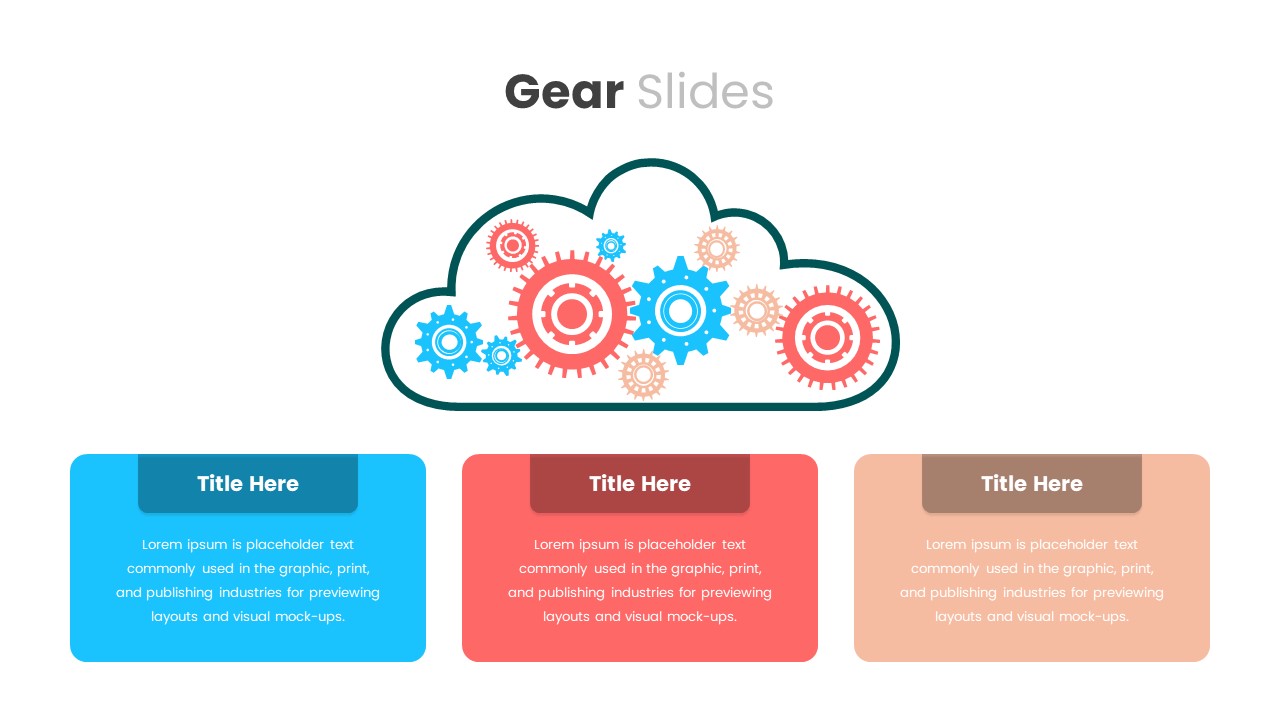
Cloud Gear Automation Diagram Template for PowerPoint & Google Slides
Cloud Computing
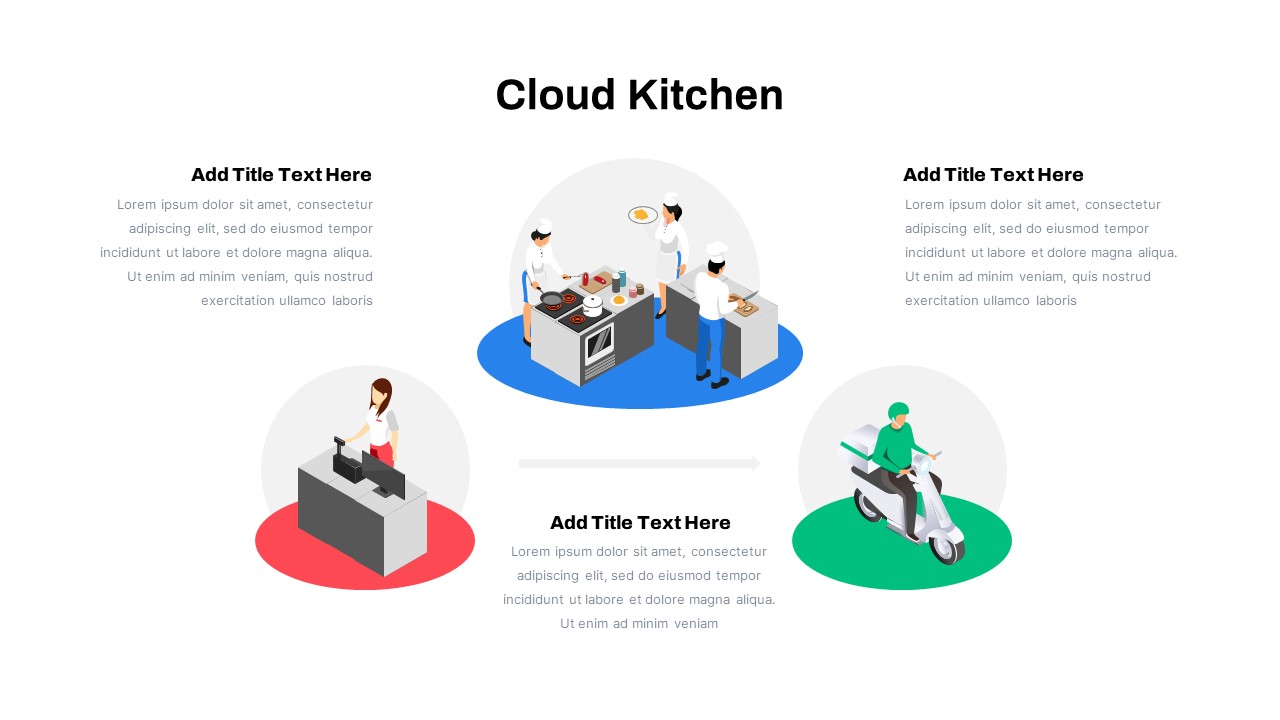
Cloud Kitchen Business Process Diagram Template for PowerPoint & Google Slides
Process
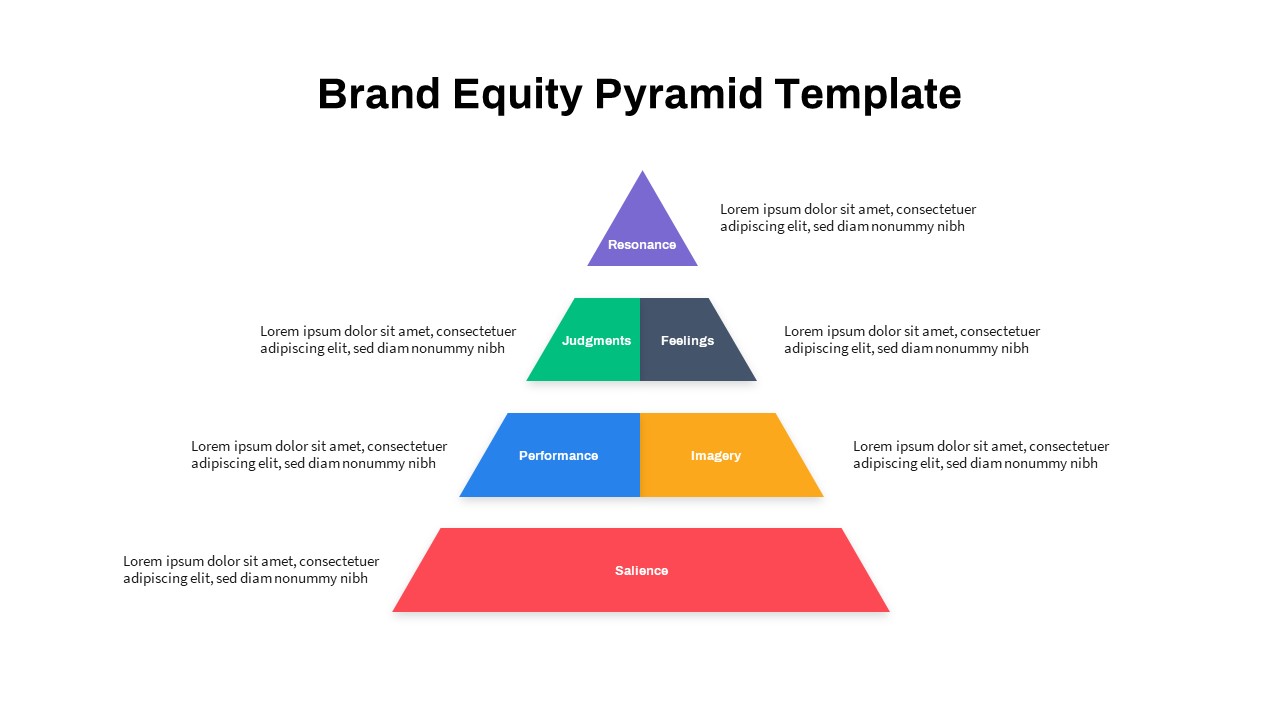
Strategic Brand Equity Pyramid Diagram Template for PowerPoint & Google Slides
Pyramid
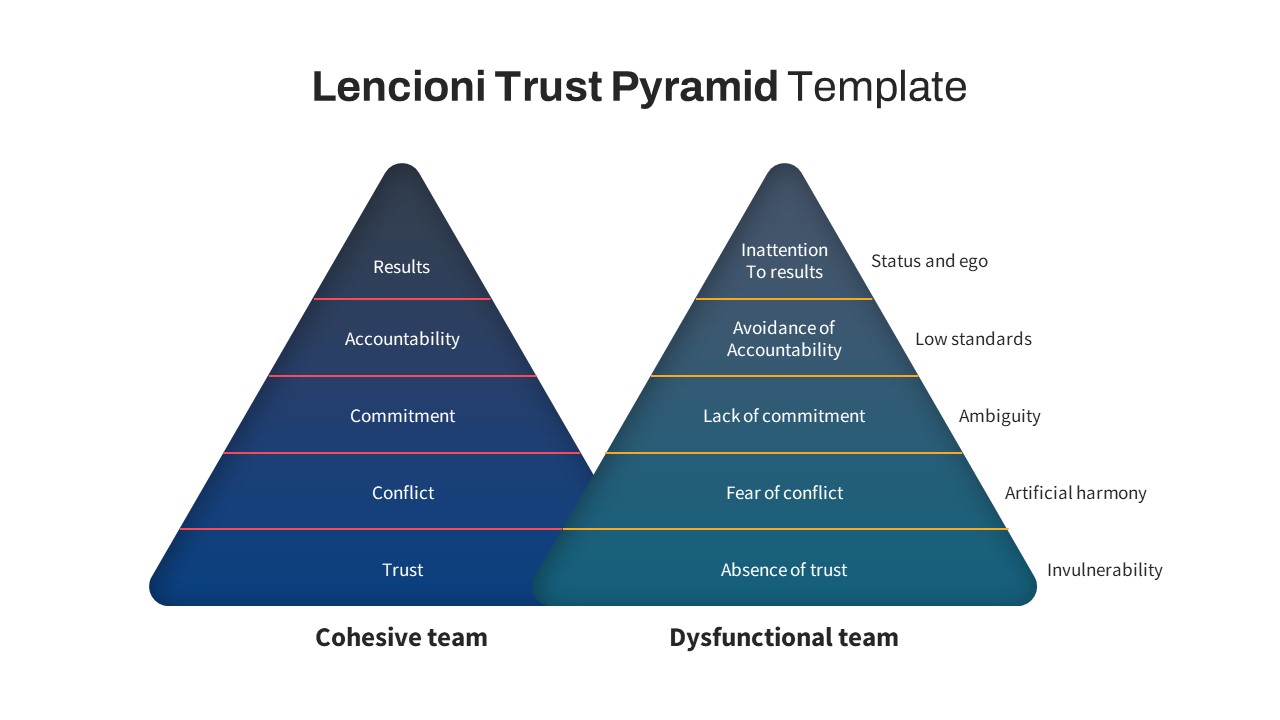
Lencioni Trust Pyramid Diagram Template for PowerPoint & Google Slides
Pyramid
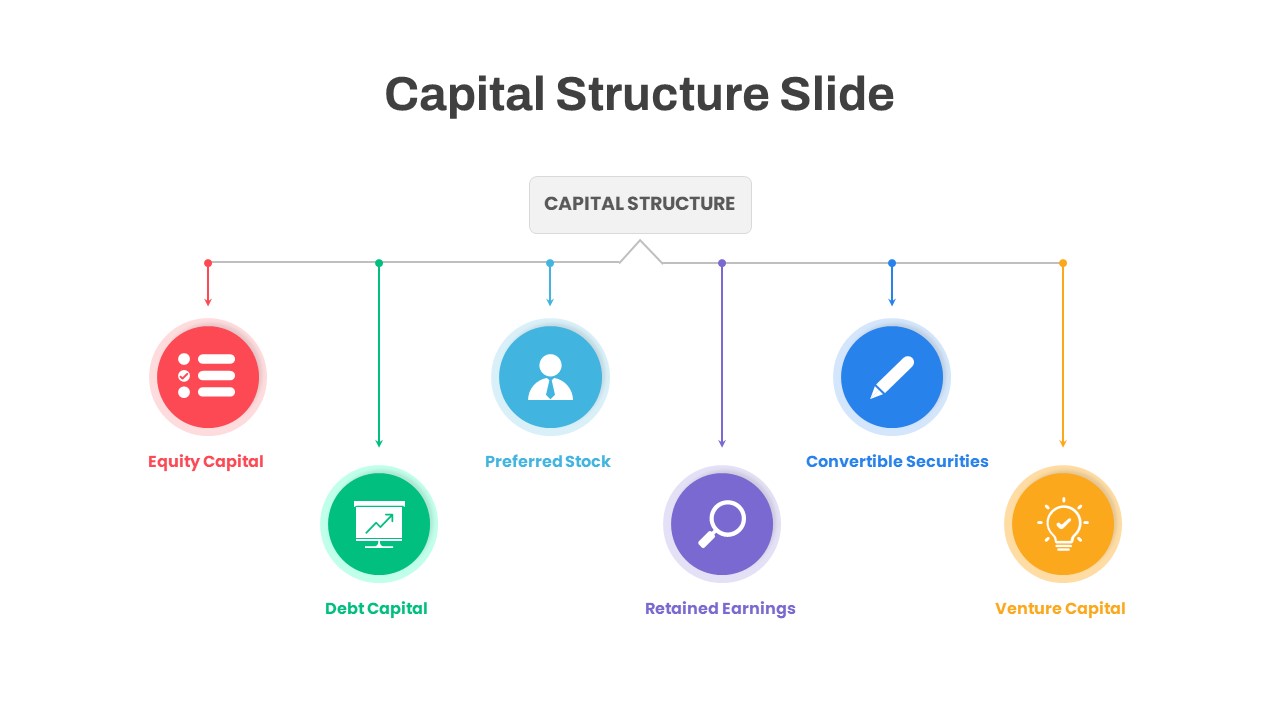
Capital Structure Hub & Spoke Diagram Template for PowerPoint & Google Slides
Process
Data Lake Hub-and-Spoke Diagram Template for PowerPoint & Google Slides
Cloud Computing
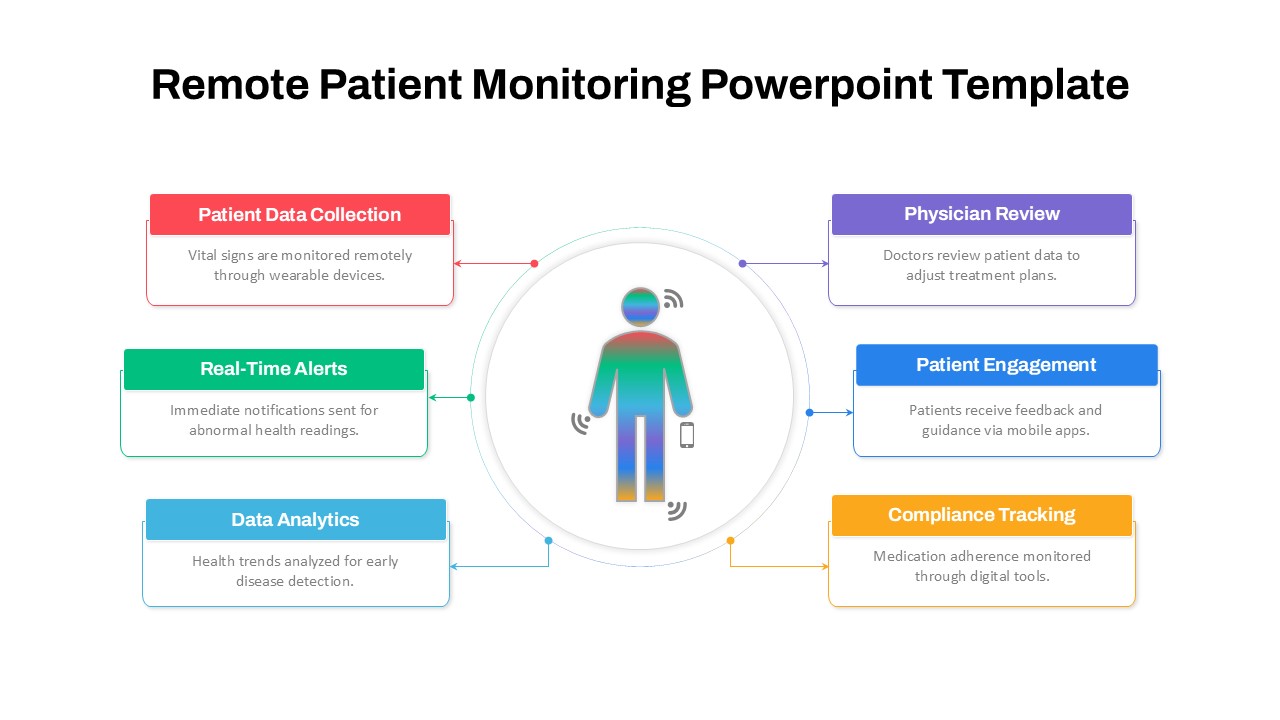
Remote Patient Monitoring Diagram Template for PowerPoint & Google Slides
Health
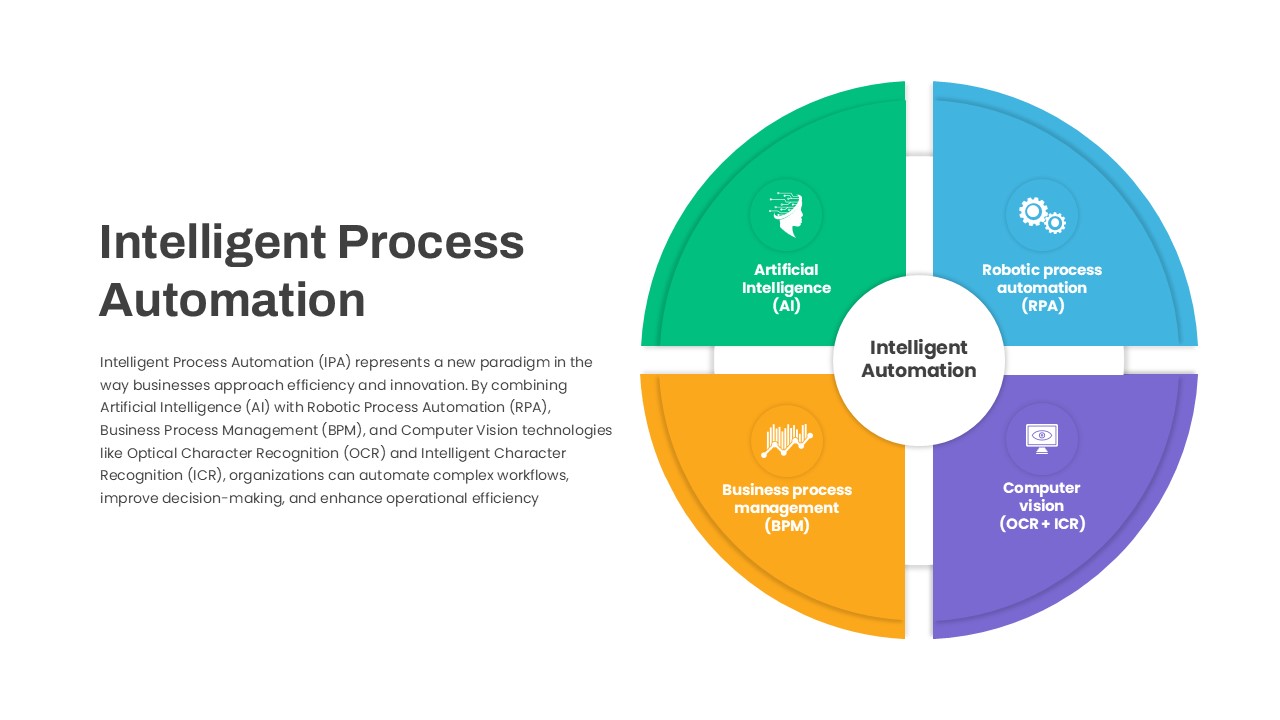
Intelligent Process Automation Diagram Template for PowerPoint & Google Slides
Circular
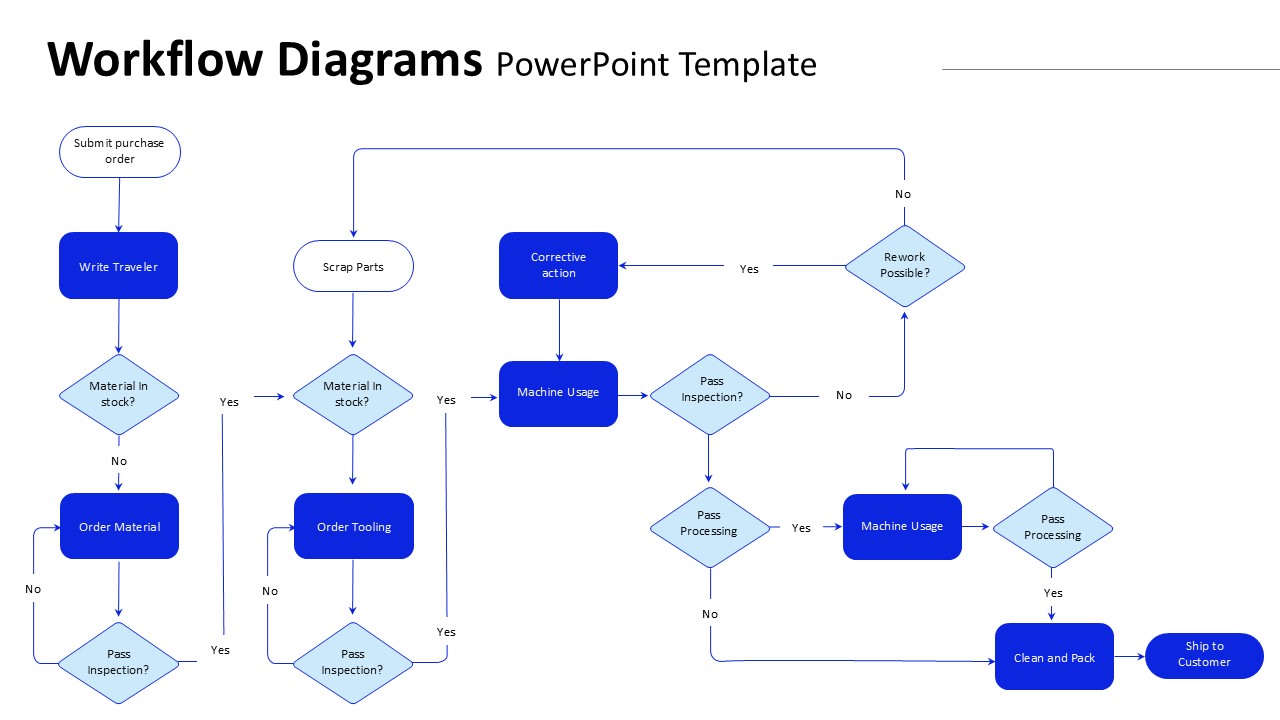
Manufacturing Workflow Diagram Template for PowerPoint & Google Slides
Flow Charts
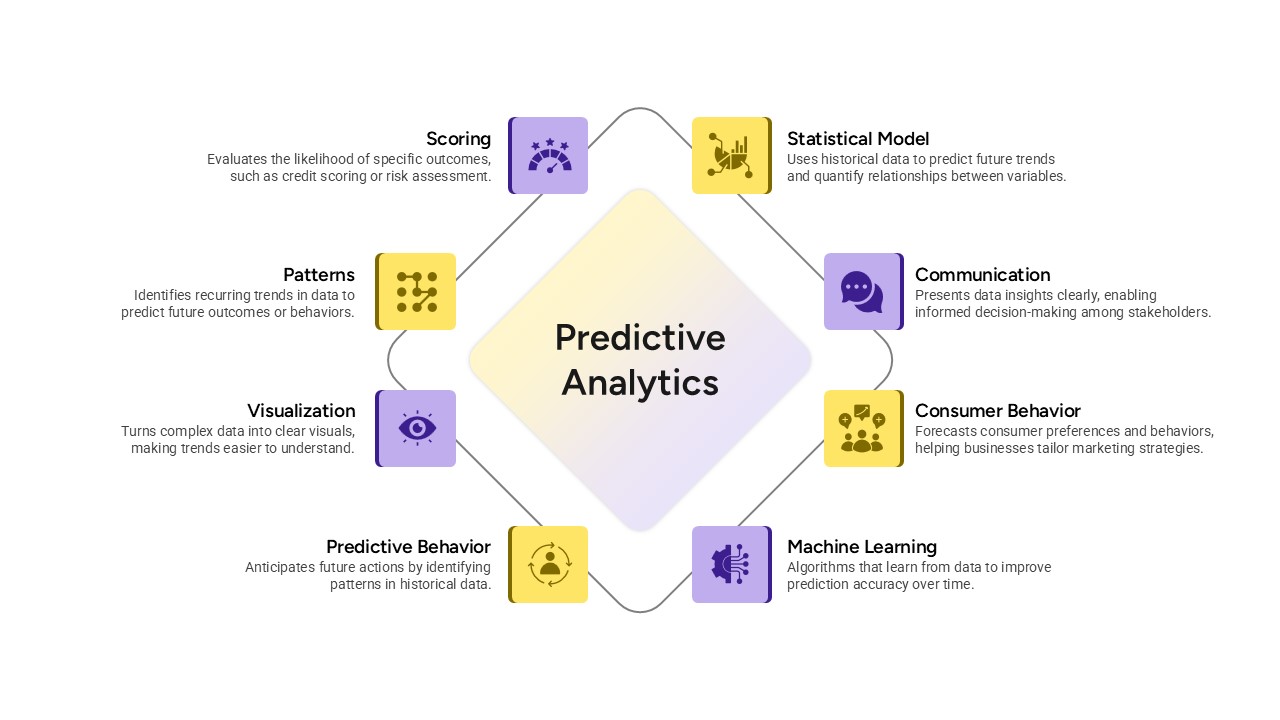
Predictive Analytics Diagram Template for PowerPoint & Google Slides
Process
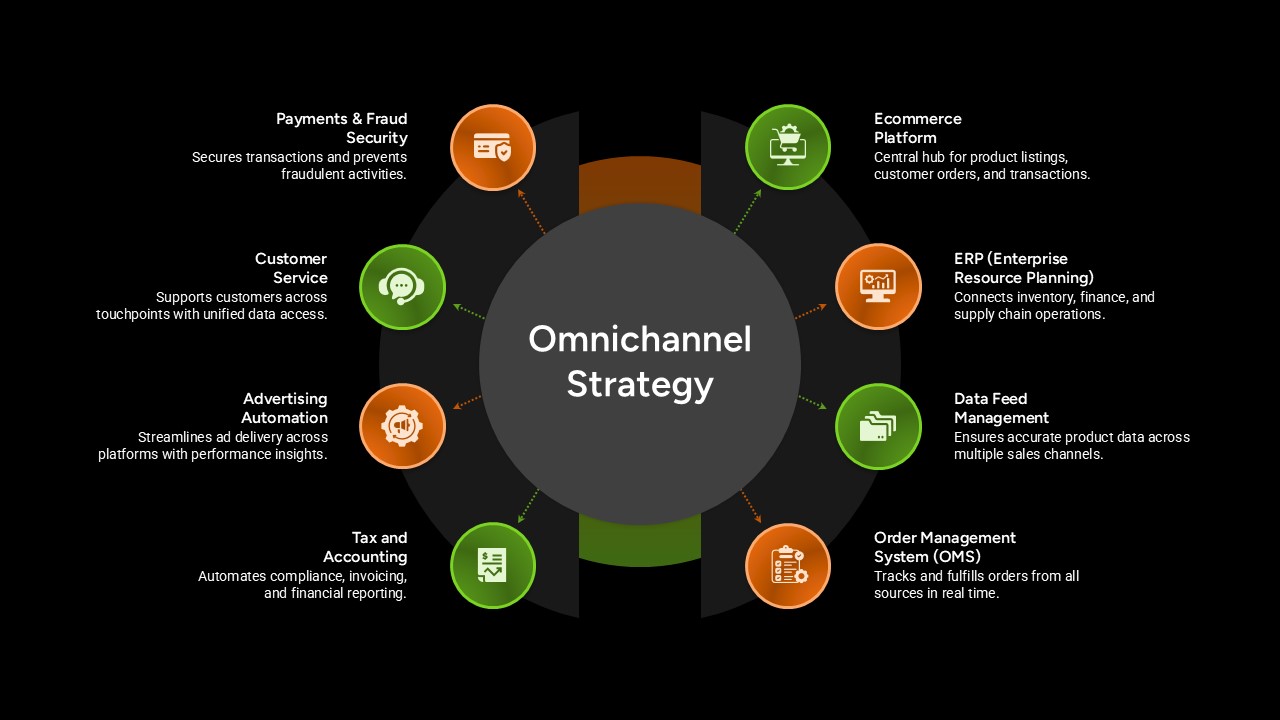
Omnichannel Strategy Circular Diagram Template for PowerPoint & Google Slides
Digital Marketing
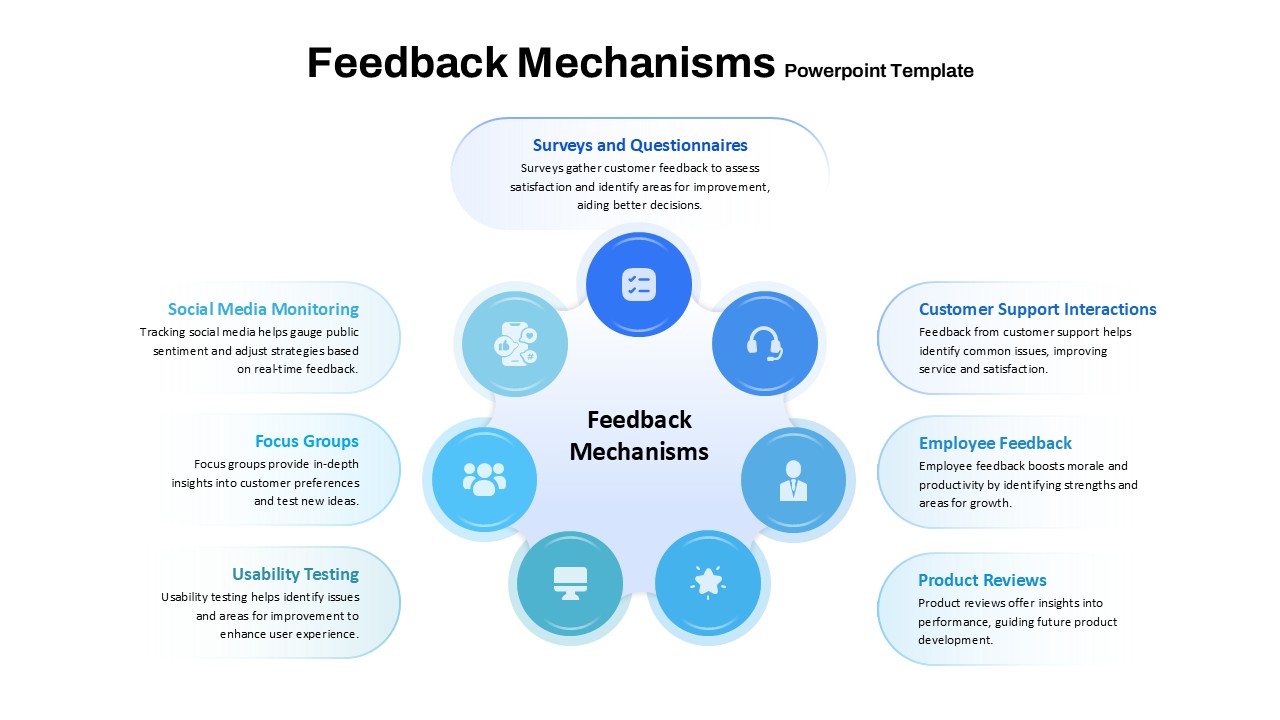
Feedback Mechanisms Circular Diagram Template for PowerPoint & Google Slides
Circular
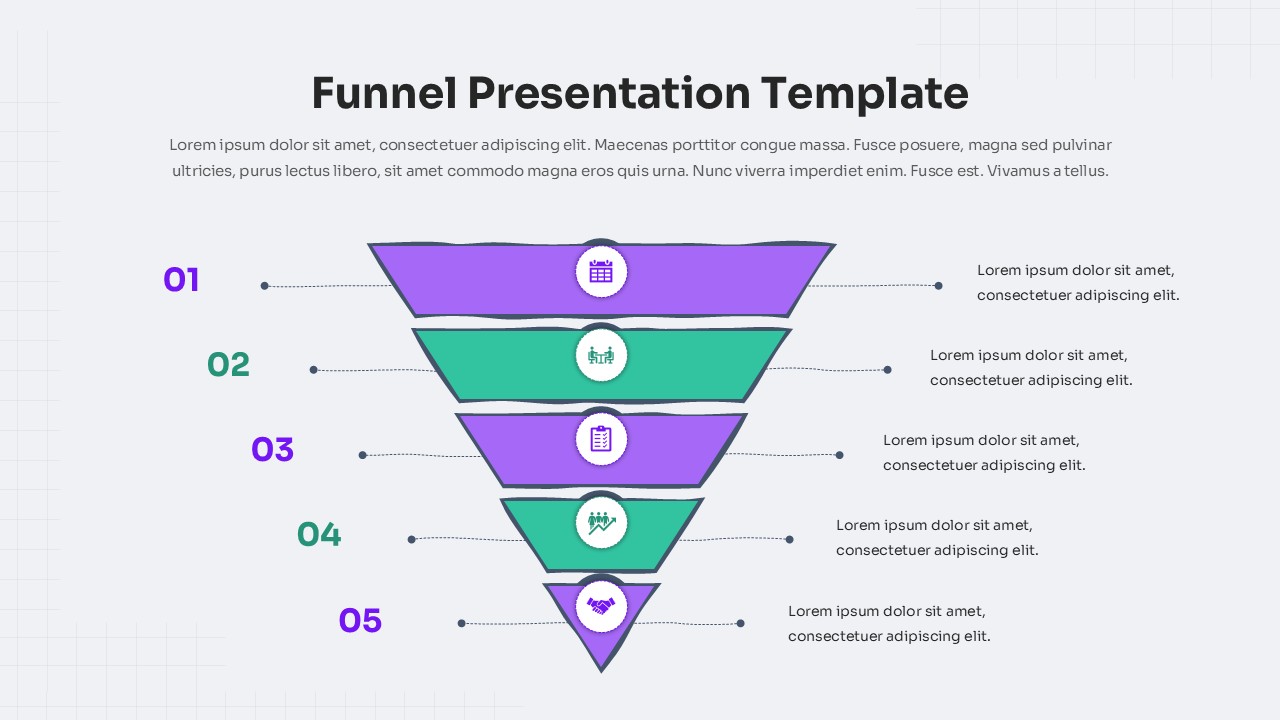
Five-Step Modern Funnel Diagram Template for PowerPoint & Google Slides
Funnel
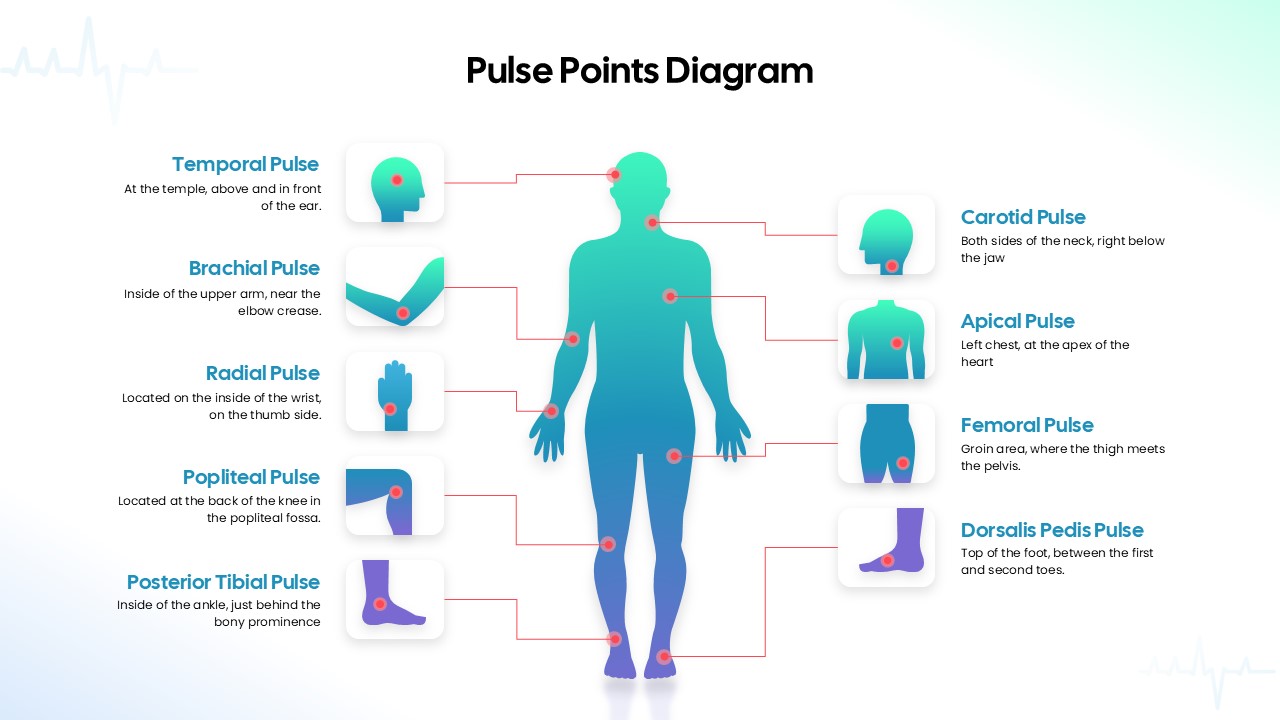
Human Body Pulse Points Diagram Template for PowerPoint & Google Slides
Medical
Operating Channels Comparison Diagram Template for PowerPoint & Google Slides
Business Models
Data-Driven Sales Strategy Diagram Template for PowerPoint & Google Slides
Marketing