North America Map Infographic Slide Template for PowerPoint & Google Slides


Description
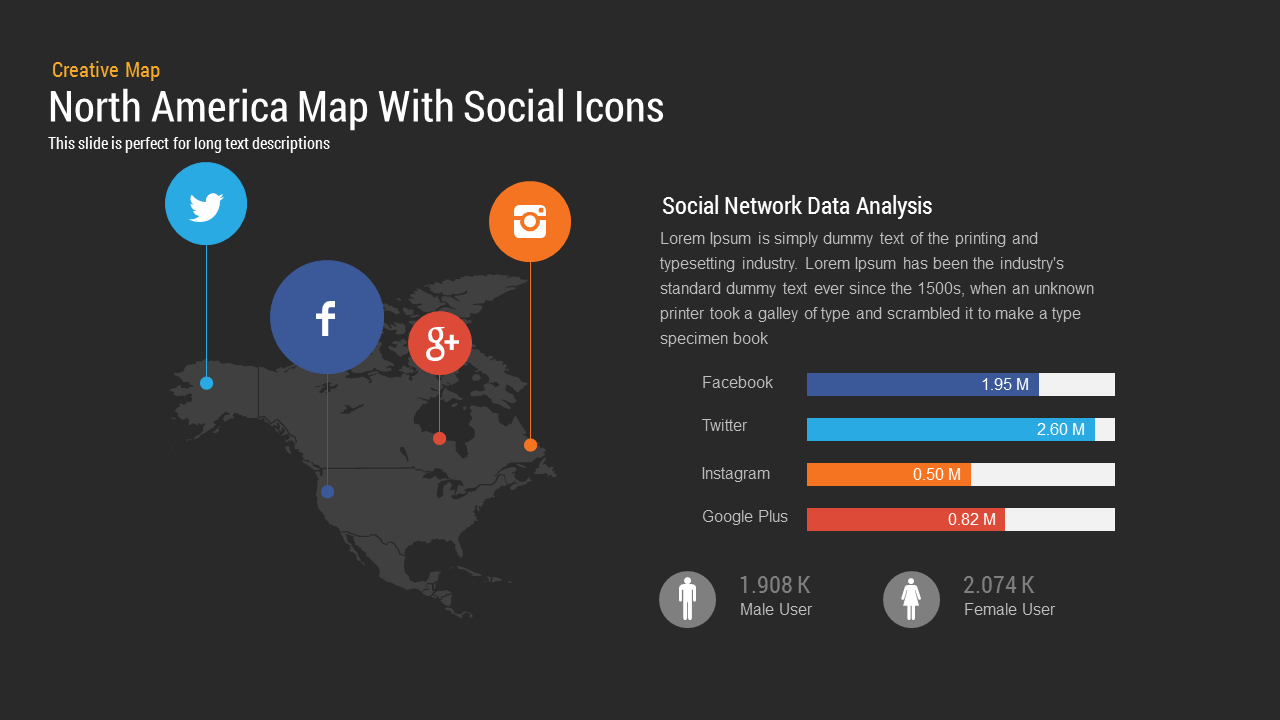
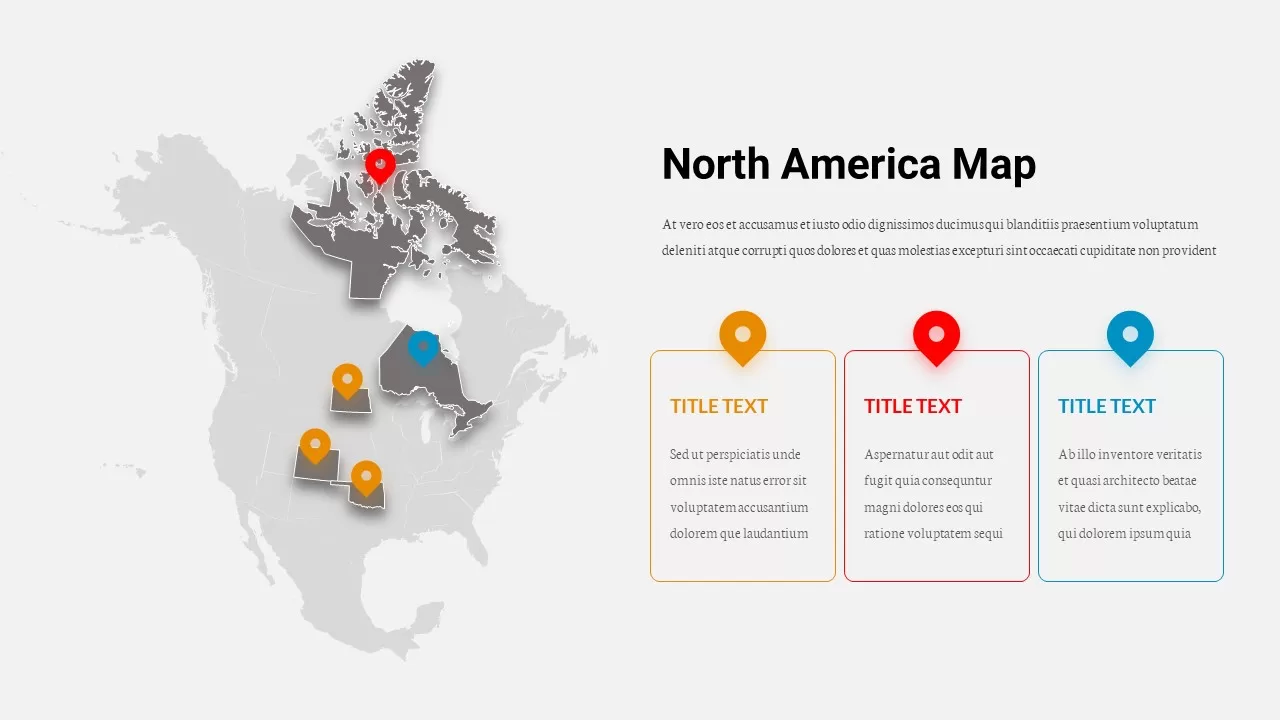
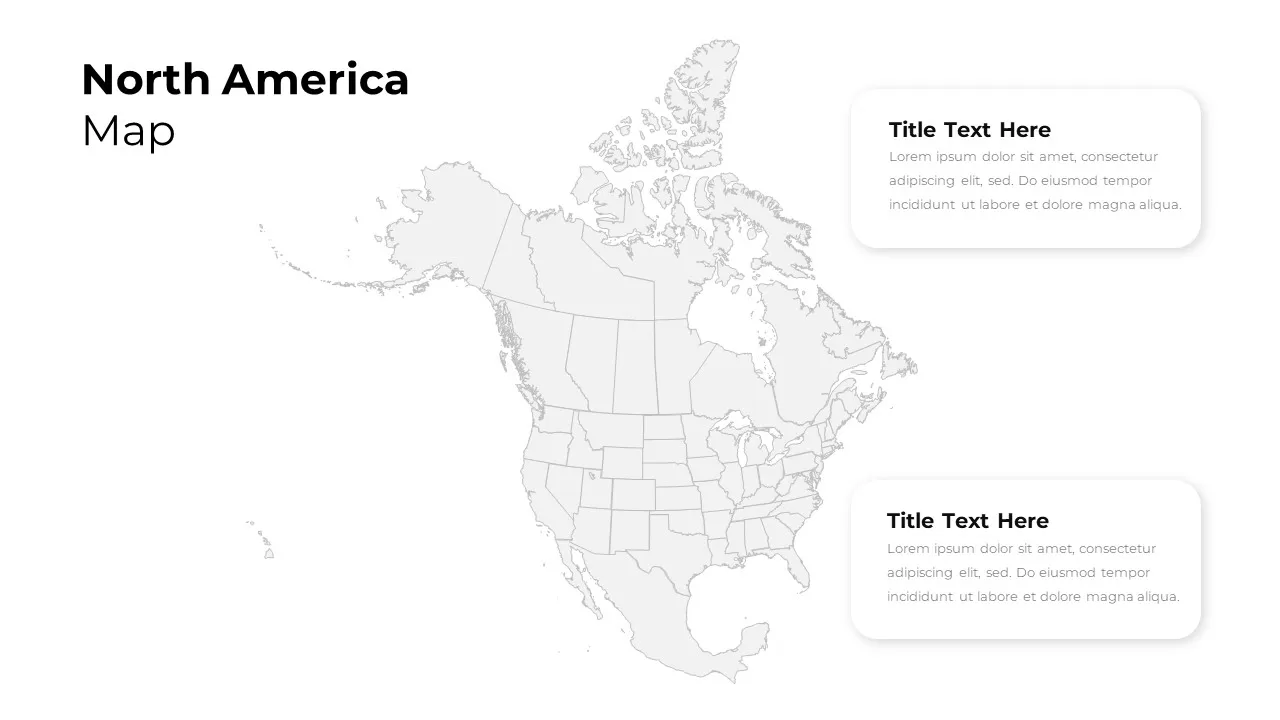
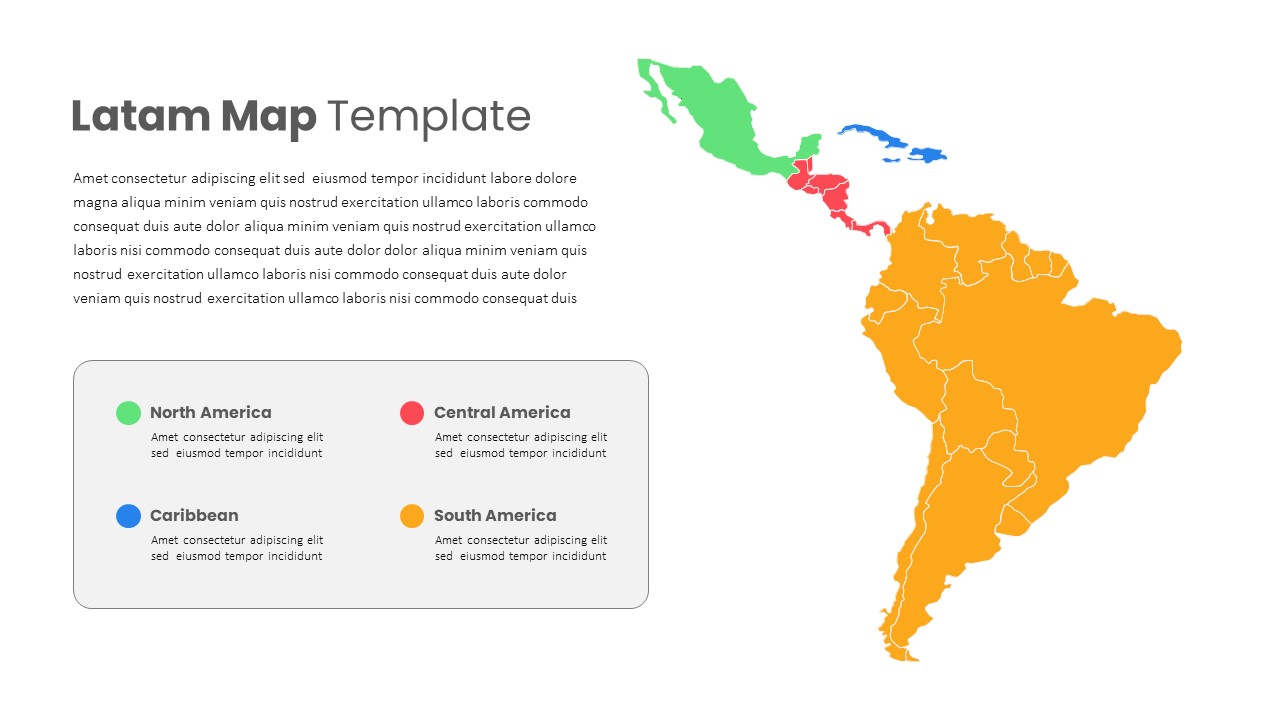
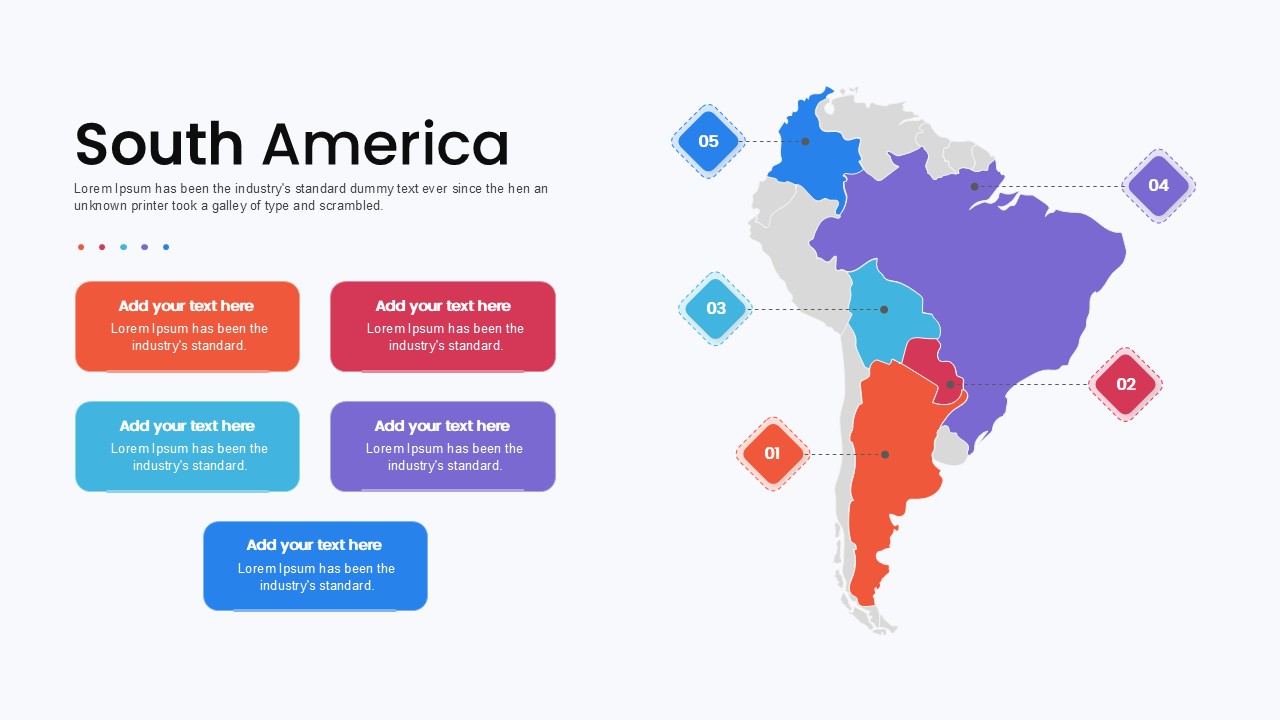
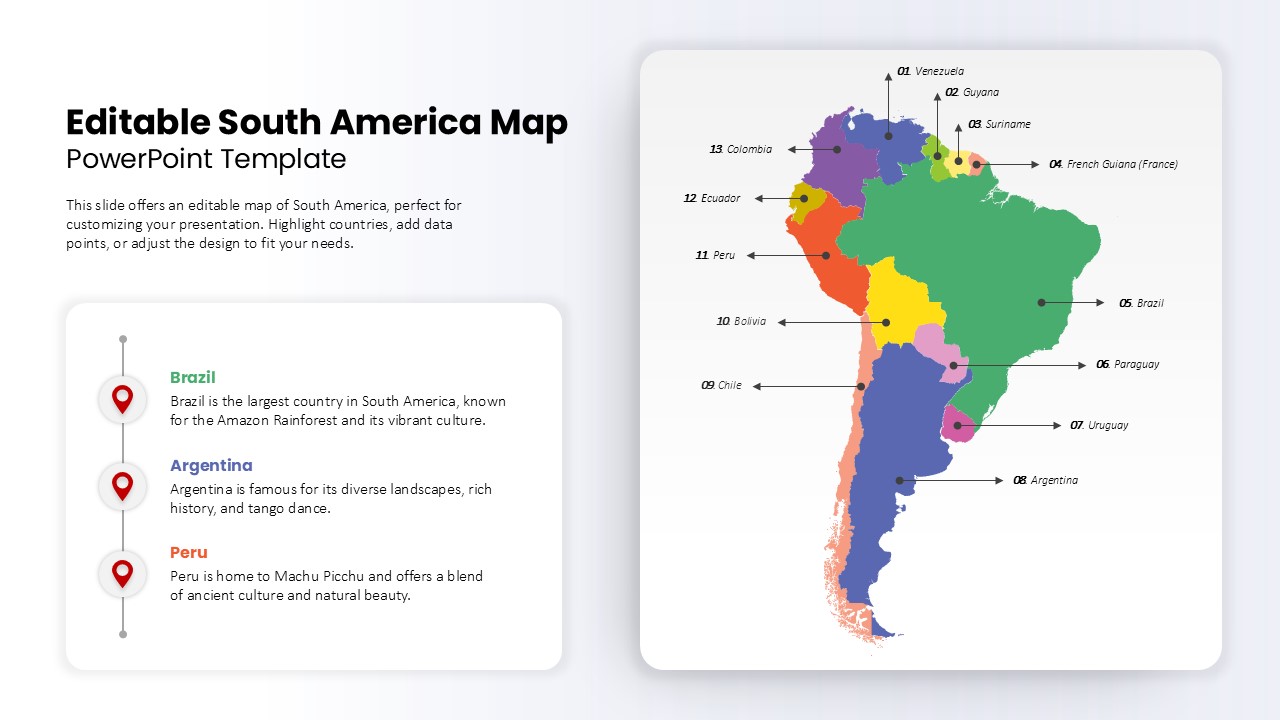
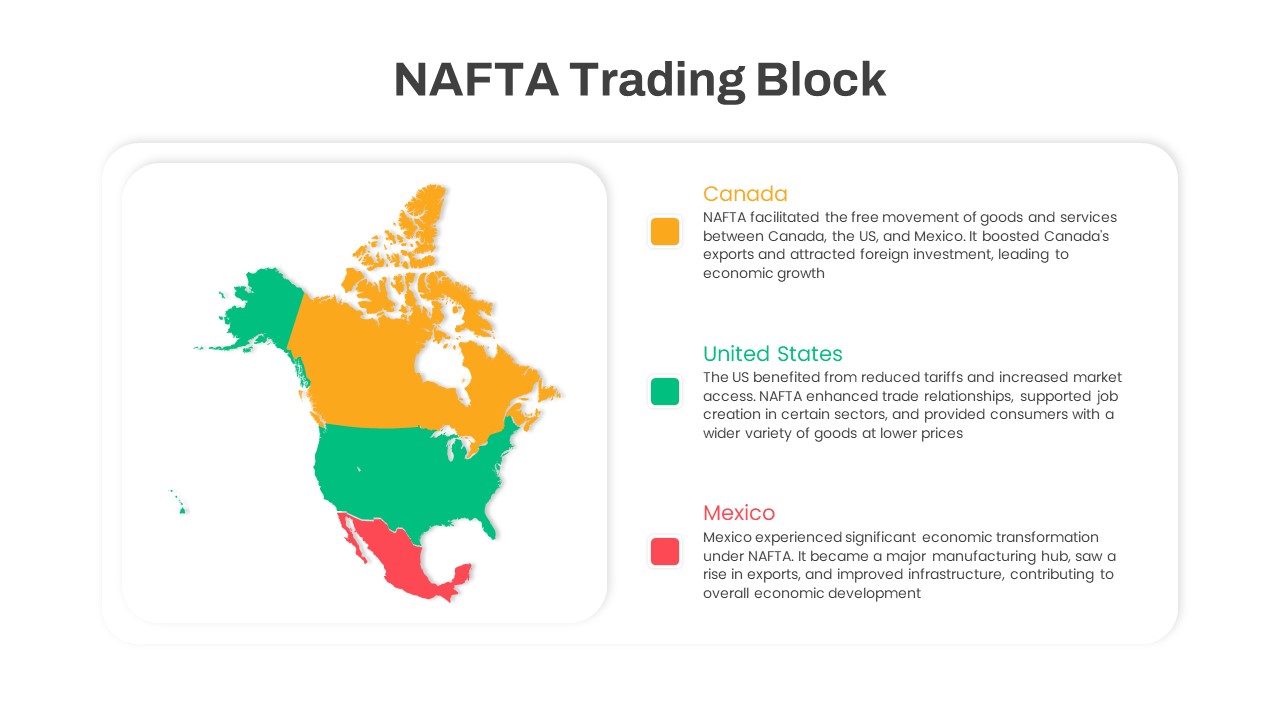
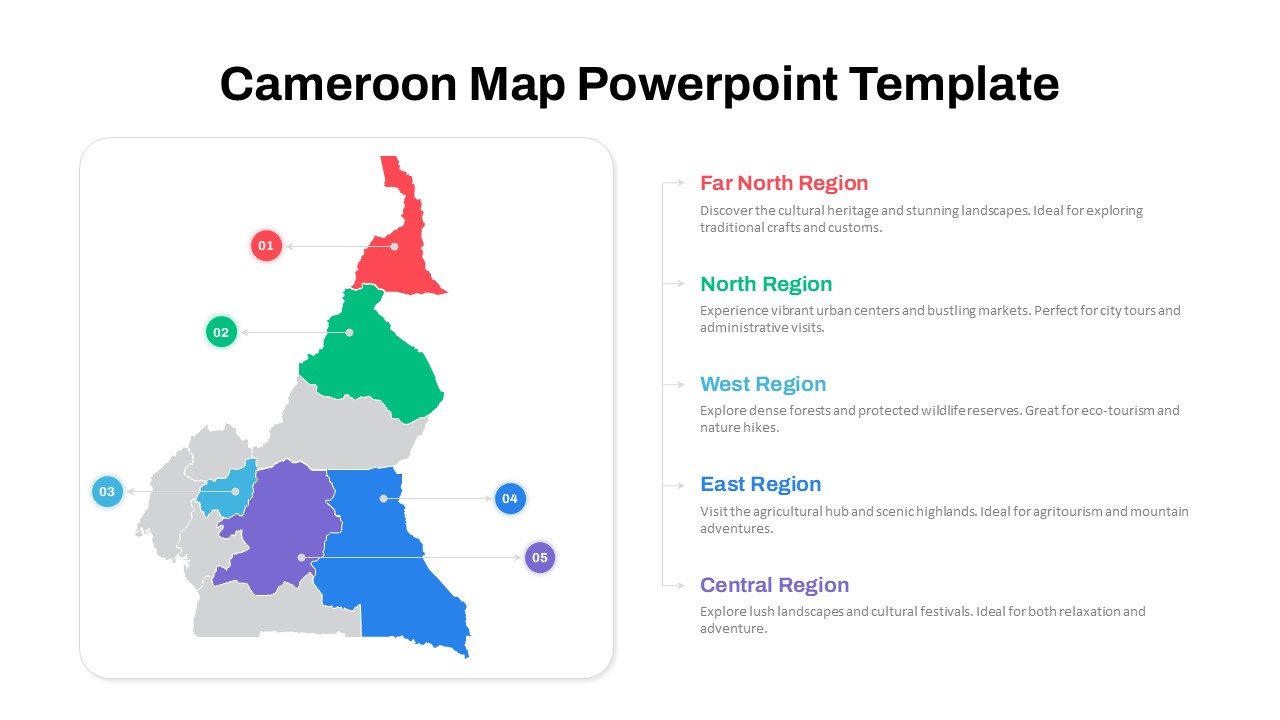
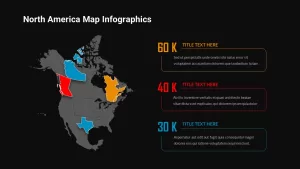
Enhance your presentations with this North America Map Infographic Slide for PowerPoint & Google Slides, designed to visually highlight key regional data with clarity and precision. Featuring a clean, professional layout, this template includes a detailed vector map of North America with highlighted regions in distinctive colors, each linked clearly to customizable textual annotations. Numbers and titles in bold, vivid colors facilitate rapid comprehension, making complex geographical or statistical information easily digestible for your audience.
This infographic map template effectively demonstrates regional performance, population statistics, market share, or distribution data through clearly marked Canadian provinces and U.S. states. Each annotation box is color-coded to match highlighted areas on the map, seamlessly guiding viewers from geographic visualization to contextual understanding. With easy-to-edit placeholders, updating numbers, descriptions, or colors to align with your specific needs is effortless, enhancing your workflow efficiency.
Who is it for
Ideal for market analysts, educators, business strategists, sales managers, and researchers who frequently present geographical data, demographic insights, or strategic planning details across North America. Consultants and marketers can leverage this slide for regional analysis and data-driven decision-making.
Other Uses
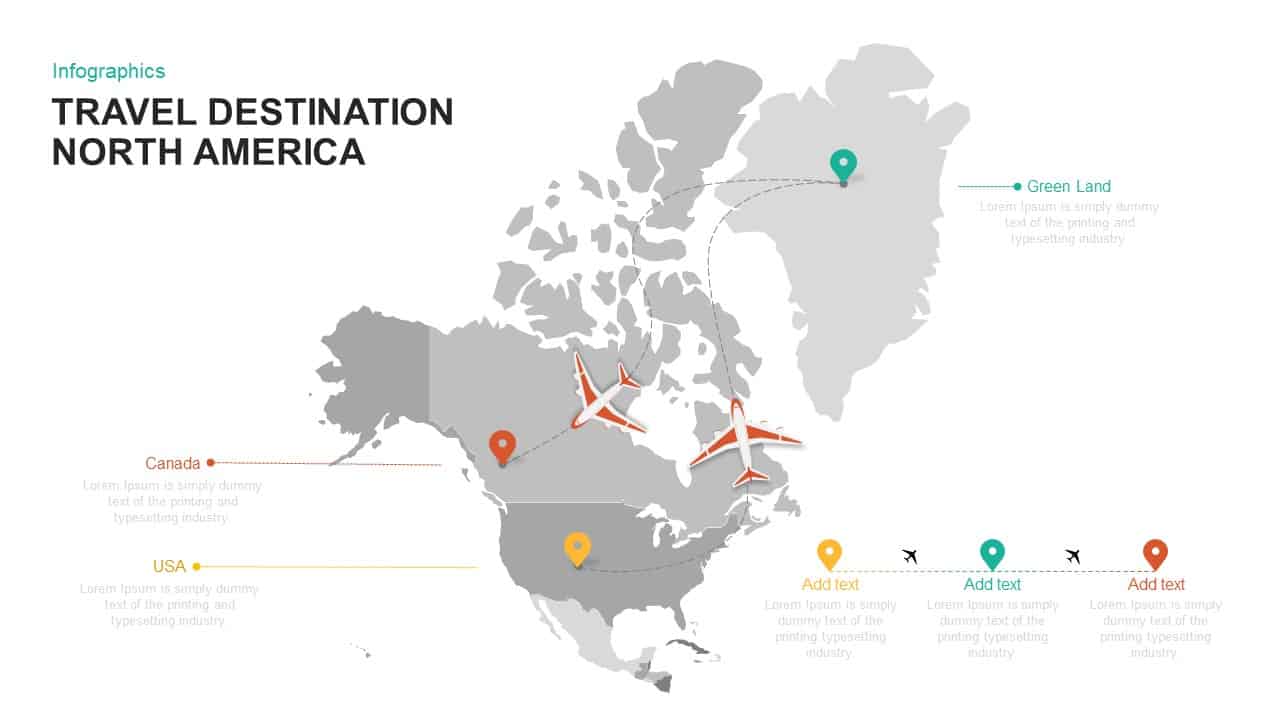
Besides regional or market-focused presentations, repurpose this map infographic for educational purposes, public health briefings, logistics planning, or socio-economic analyses. The slide can effectively illustrate election results, consumer behavior statistics, or comparative regional studies, making it versatile for diverse analytical contexts.
Login to download this file

Item ID
SB02668
Related Templates

North America Percentage Map Infographic Template for PowerPoint & Google Slides
World Maps
North America Map template for PowerPoint & Google Slides
World Maps
North America Location Pin Map Overview Template for PowerPoint & Google Slides
World Maps
North America Regional Map Overview Template for PowerPoint & Google Slides
World Maps
North America Data Map Callouts Template for PowerPoint & Google Slides
World Maps
North America Travel Destinations Template for PowerPoint & Google Slides
World Maps

North Korea Map with Provinces Infographic Pack Template for PowerPoint & Google Slides
Maps
Latin America Regional Map Breakdown Template for PowerPoint & Google Slides
World Maps
South America Map template for PowerPoint & Google Slides
Maps
Editable South America Map Diagram Template for PowerPoint & Google Slides
Maps
North Star template for PowerPoint & Google Slides
Business
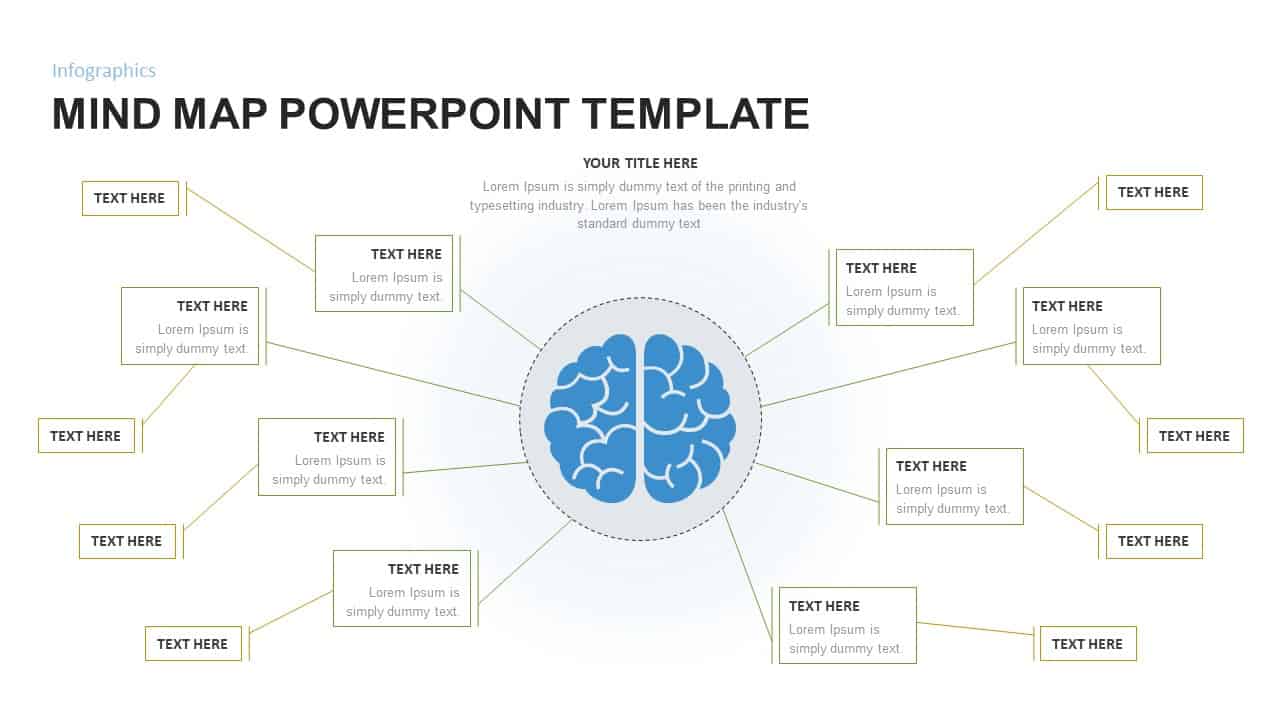
Mind Map Infographic Slide Template for PowerPoint & Google Slides
Mind Maps
Editable Ireland Map Infographic Slide Template for PowerPoint & Google Slides
World Maps
Free
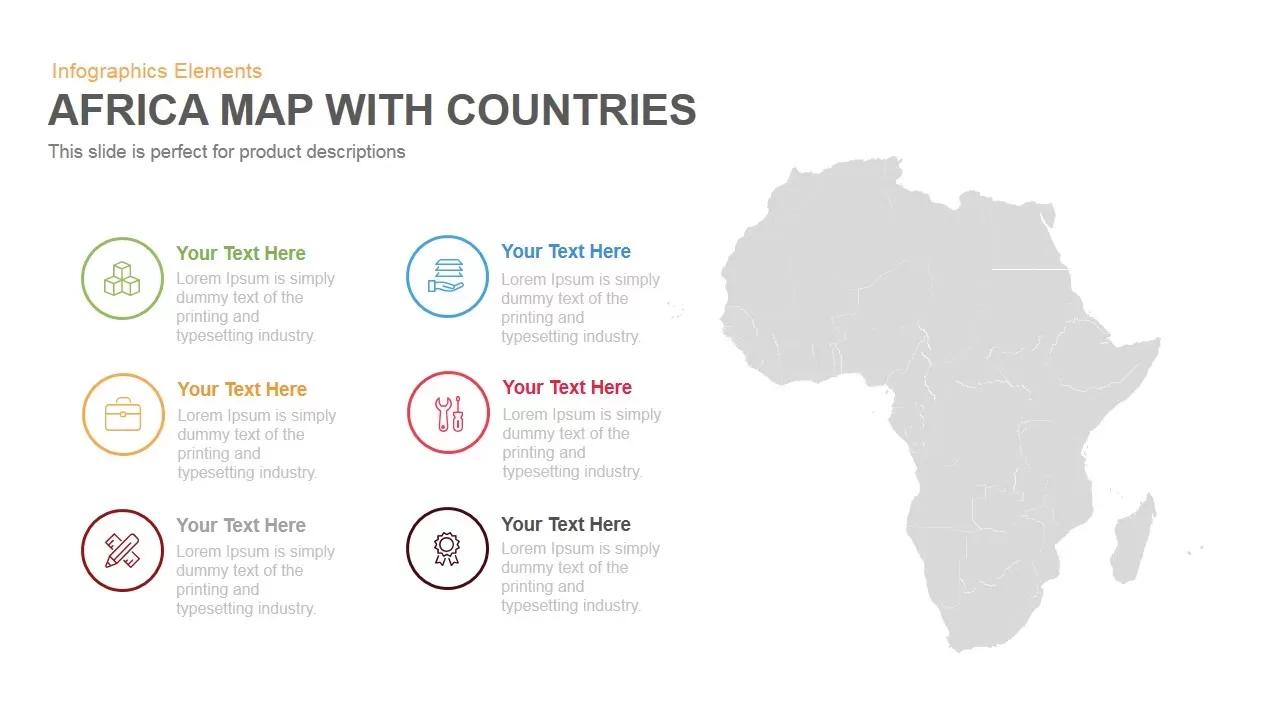
Africa Country Map Infographic Template for PowerPoint & Google Slides
World Maps
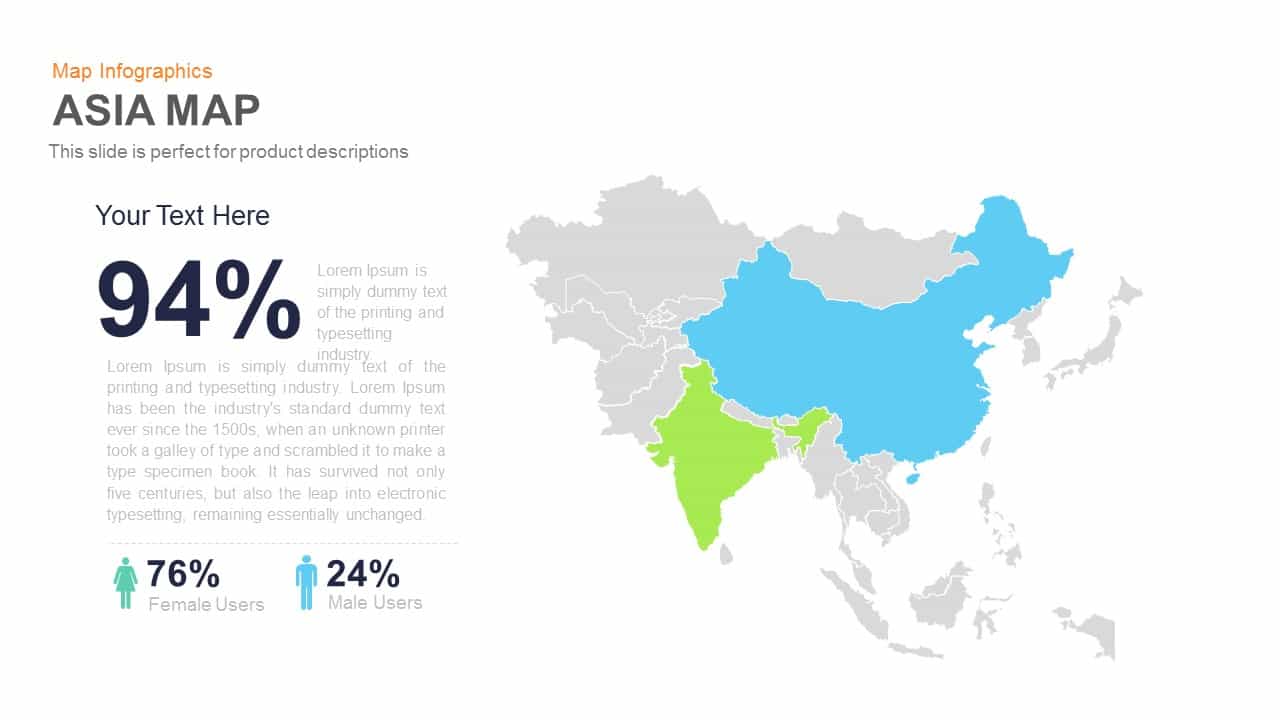
Asia Map Infographic with Demographics template for PowerPoint & Google Slides
World Maps
Curved Road Map Timeline Infographic Template for PowerPoint & Google Slides
Roadmap
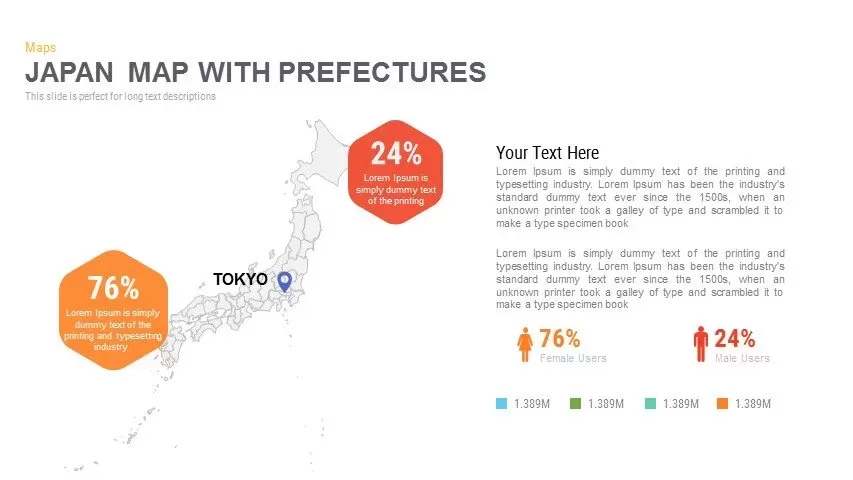
Japan Province Map Infographic Template for PowerPoint & Google Slides
Maps
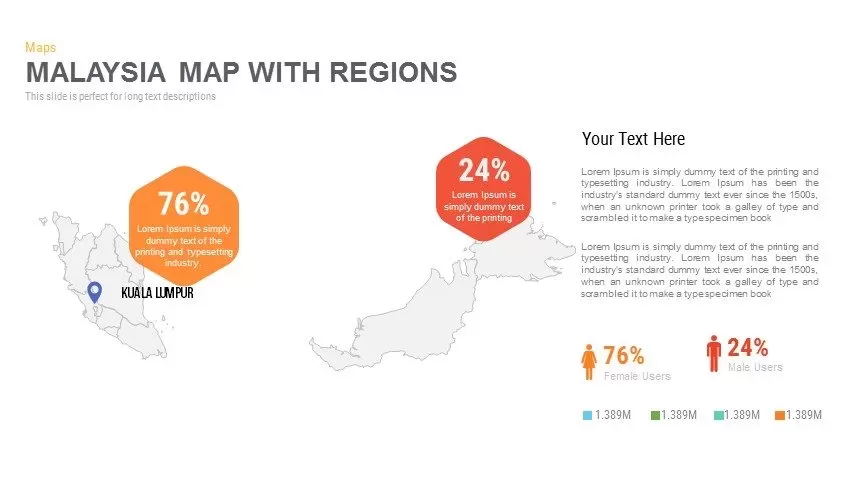
Malaysia Regional Map Infographic Template for PowerPoint & Google Slides
Maps
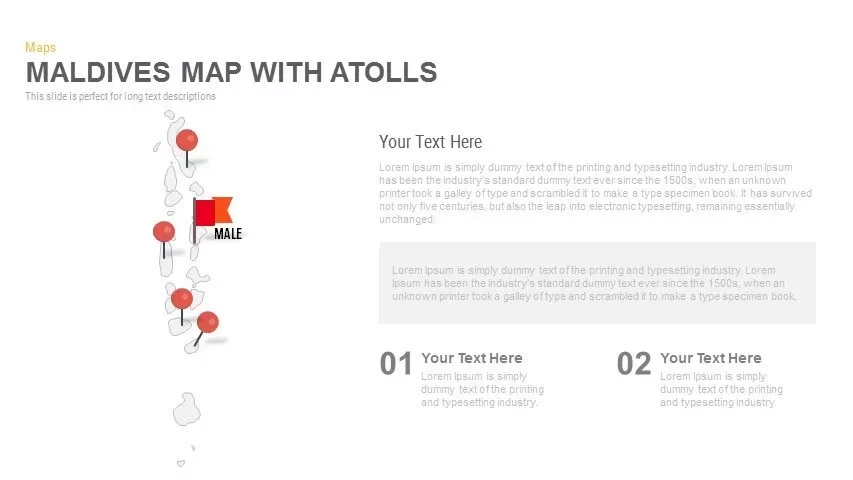
Maldives Map Infographic Template for PowerPoint & Google Slides
Maps
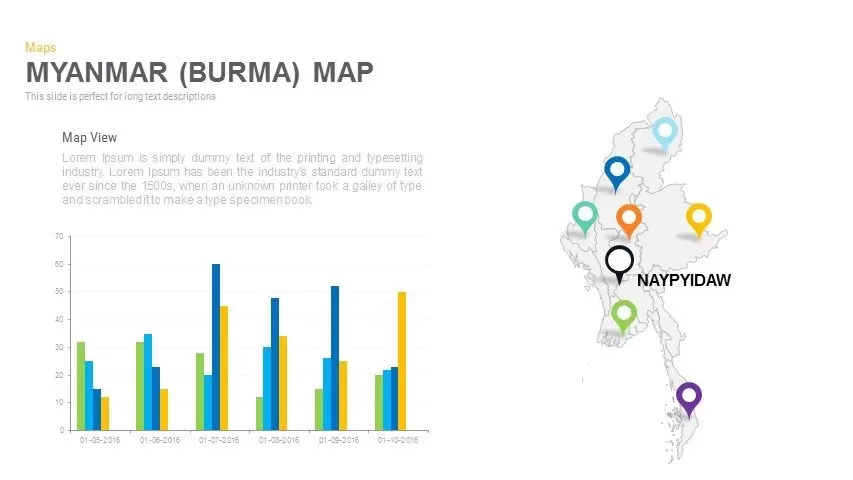
Myanmar (Burma) Provincial Map Infographic Template for PowerPoint & Google Slides
Maps
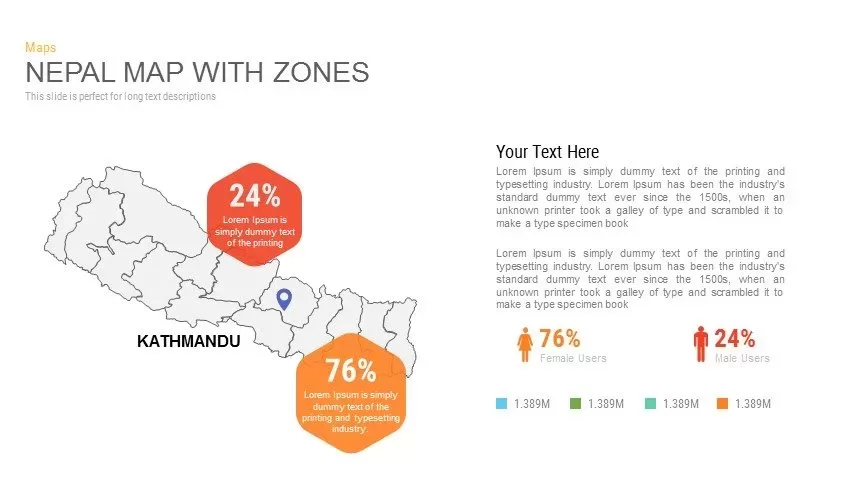
Nepal Map with Zones Infographic Template for PowerPoint & Google Slides
Maps
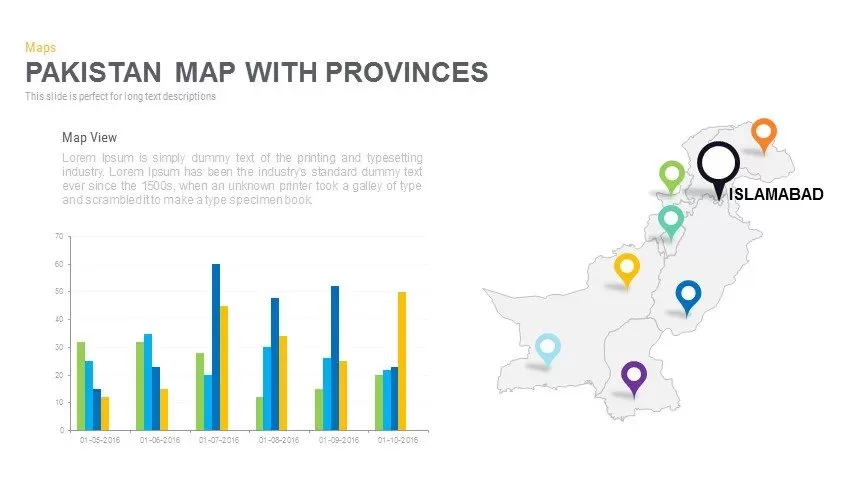
Pakistan Provinces Map Infographic Pack Template for PowerPoint & Google Slides
Maps
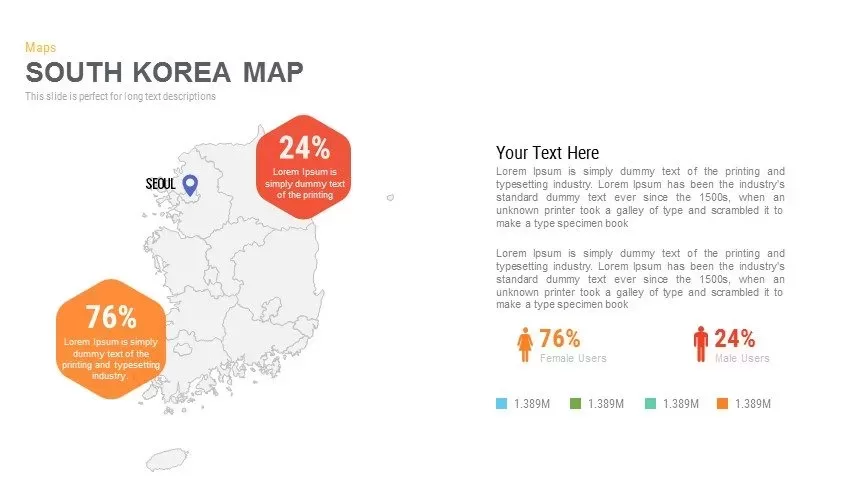
Infographic South Korea Map Template for PowerPoint & Google Slides
Maps
Sri Lanka Map Infographic Pack Template for PowerPoint & Google Slides
Maps
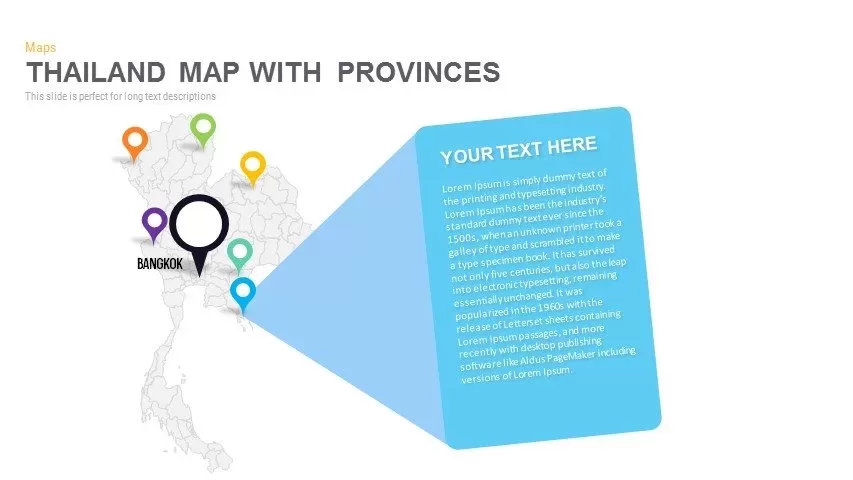
Thailand Provinces Map Infographic Pack Template for PowerPoint & Google Slides
Maps
Vietnam Provinces Map Infographic Pack Template for PowerPoint & Google Slides
Maps
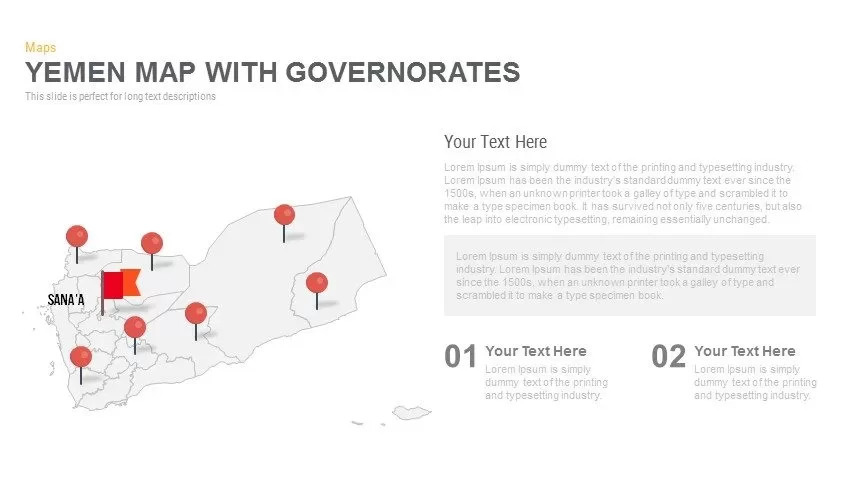
Yemen Governorates Infographic Map Template for PowerPoint & Google Slides
Maps

Multi-Cluster Mind Map Infographic Template for PowerPoint & Google Slides
Mind Maps
Colorful Mind Map Infographic Template with Icons for PowerPoint & Google Slides
Mind Maps
Colorful Mind Map Infographic Template for PowerPoint & Google Slides
Mind Maps

Modern World Map Callout Infographic Template for PowerPoint & Google Slides
World Maps
Eight-Node Mind Map Infographic Diagram Template for PowerPoint & Google Slides
Mind Maps
Six-Stage Road Map Infographic Timeline Template for PowerPoint & Google Slides
Roadmap
Versatile Mind Map Infographic Template for PowerPoint & Google Slides
Mind Maps
Structured Mind Map Infographic Diagram Template for PowerPoint & Google Slides
Mind Maps
Dual Topic Mind Map Infographic Template for PowerPoint & Google Slides
Mind Maps
Tri-Cluster Mind Map Infographic Template for PowerPoint & Google Slides
Mind Maps
Fully Editable World Map Infographic Template for PowerPoint & Google Slides
World Maps
Editable World Map Callout Infographic Template for PowerPoint & Google Slides
World Maps
Editable World Map Callout Infographic Template for PowerPoint & Google Slides
World Maps
Editable Africa Map Infographic Data Template for PowerPoint & Google Slides
World Maps
European Union Map Infographic Template for PowerPoint & Google Slides
World Maps
Syria Regional Data Map Infographic Template for PowerPoint & Google Slides
World Maps
NAFTA Trading Block Map Infographic Template for PowerPoint & Google Slides
World Maps
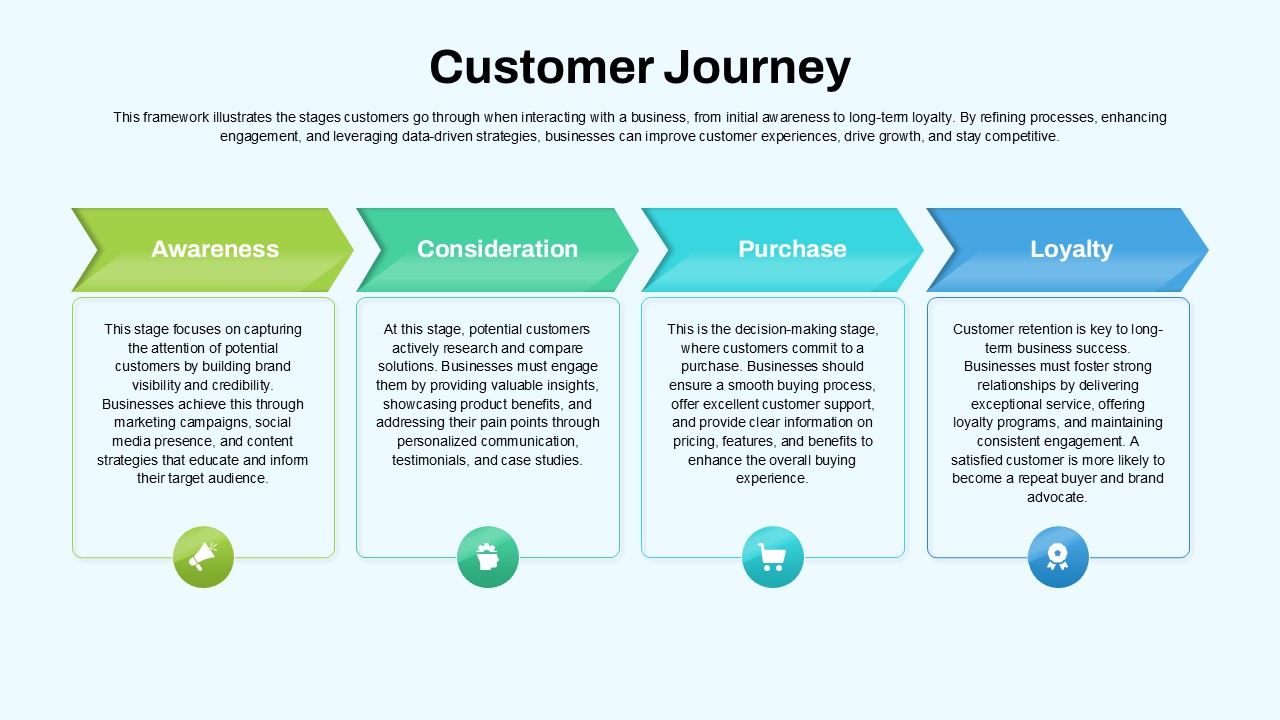
Customer Journey Process Map Infographic Template for PowerPoint & Google Slides
Customer Journey
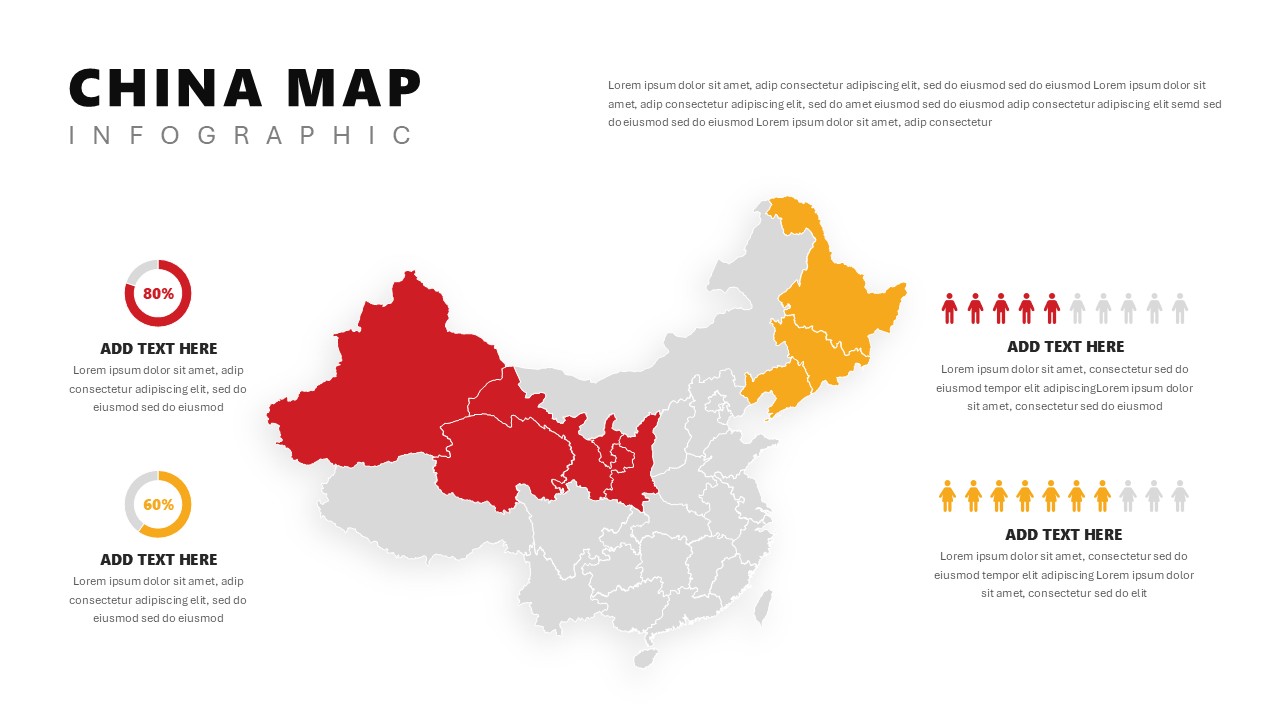
China Map Infographic Regional Stats Template for PowerPoint & Google Slides
World Maps
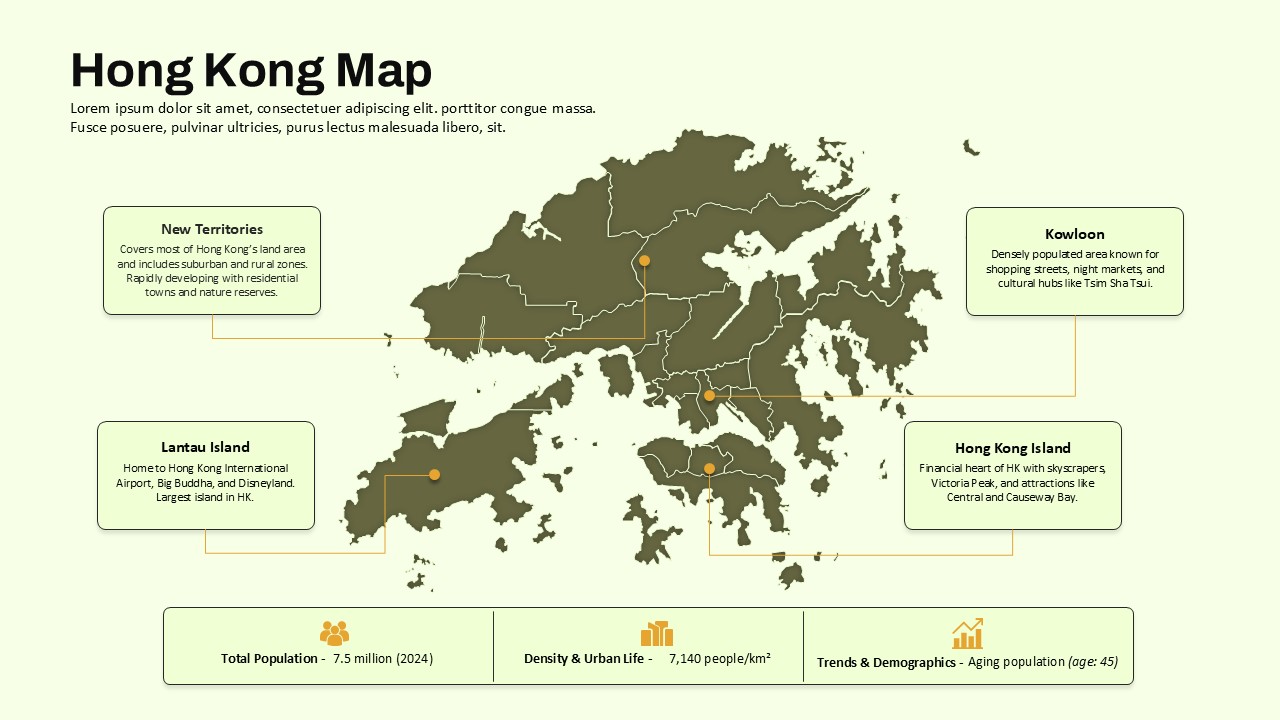
Hong Kong Geographic Map Infographic Template for PowerPoint & Google Slides
World Maps

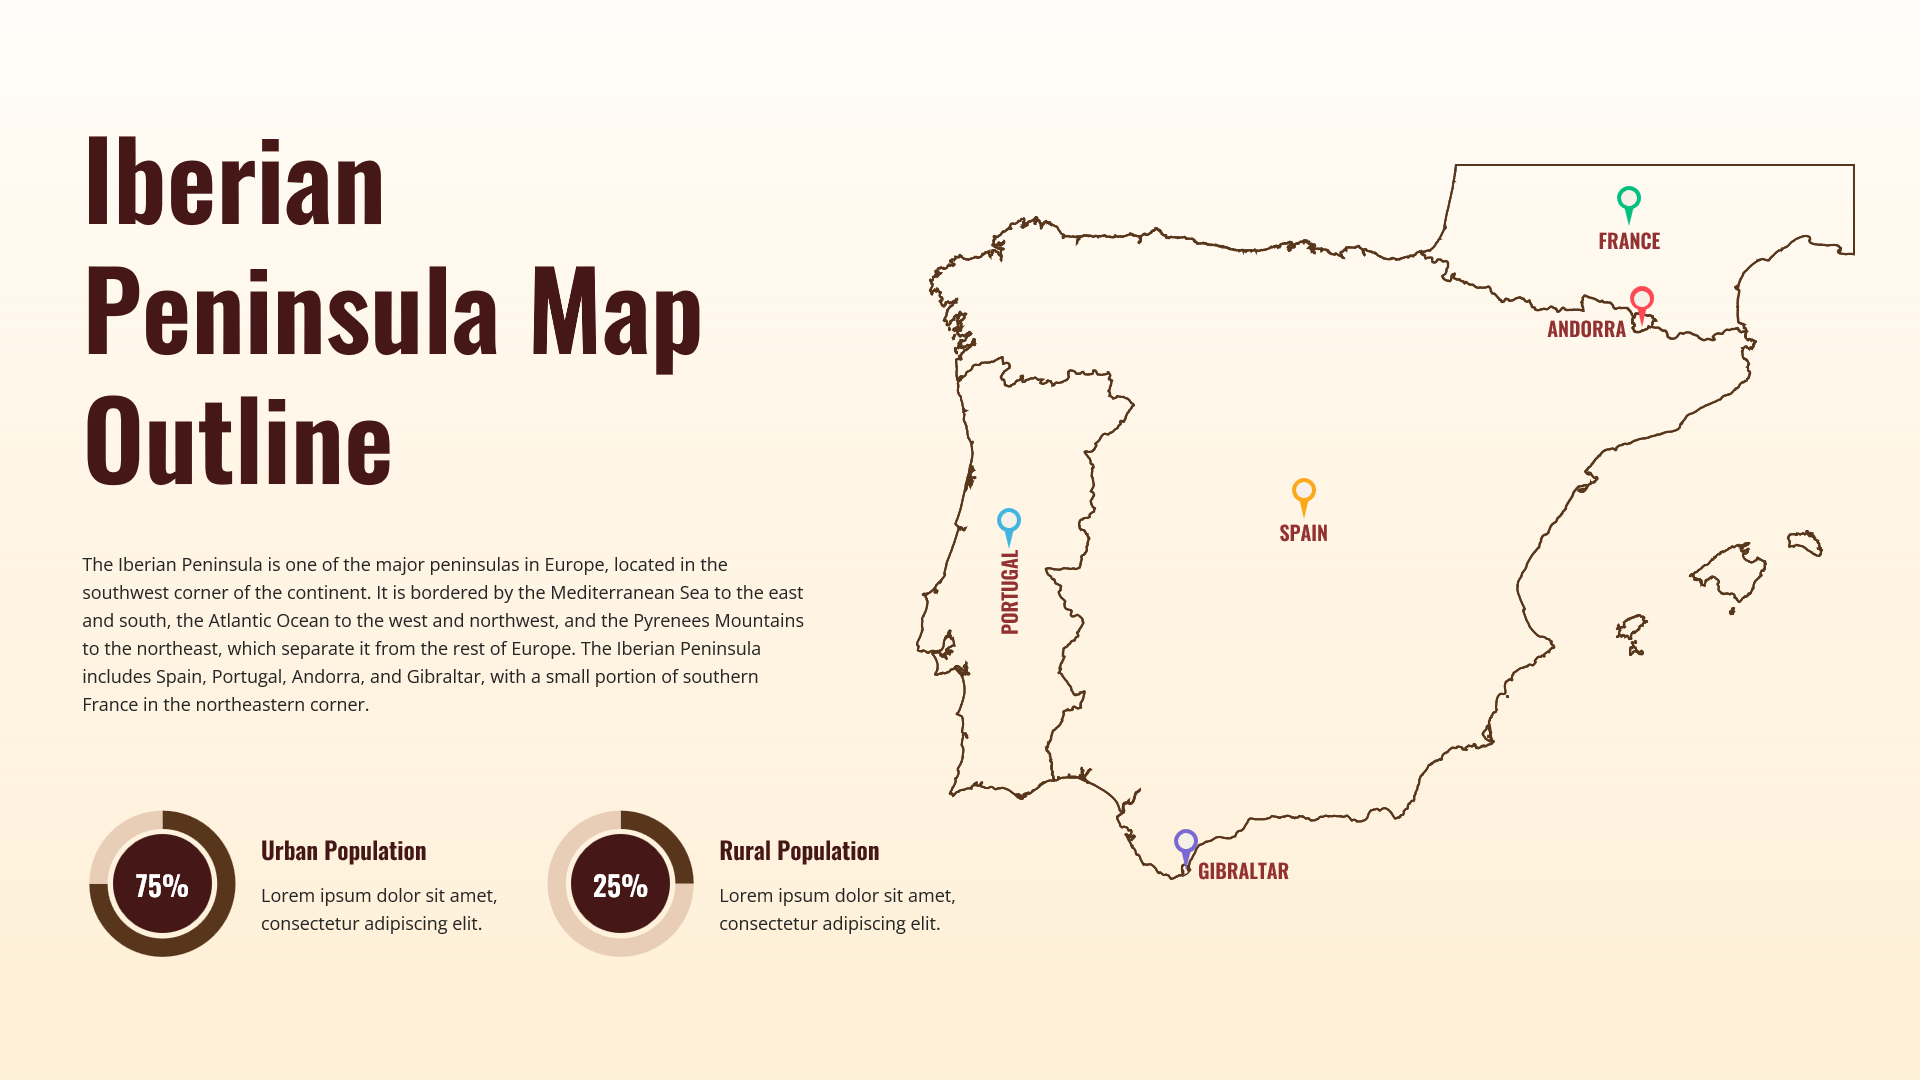
Iberian Peninsula Map Outline Infographic Template for PowerPoint & Google Slides
World Maps
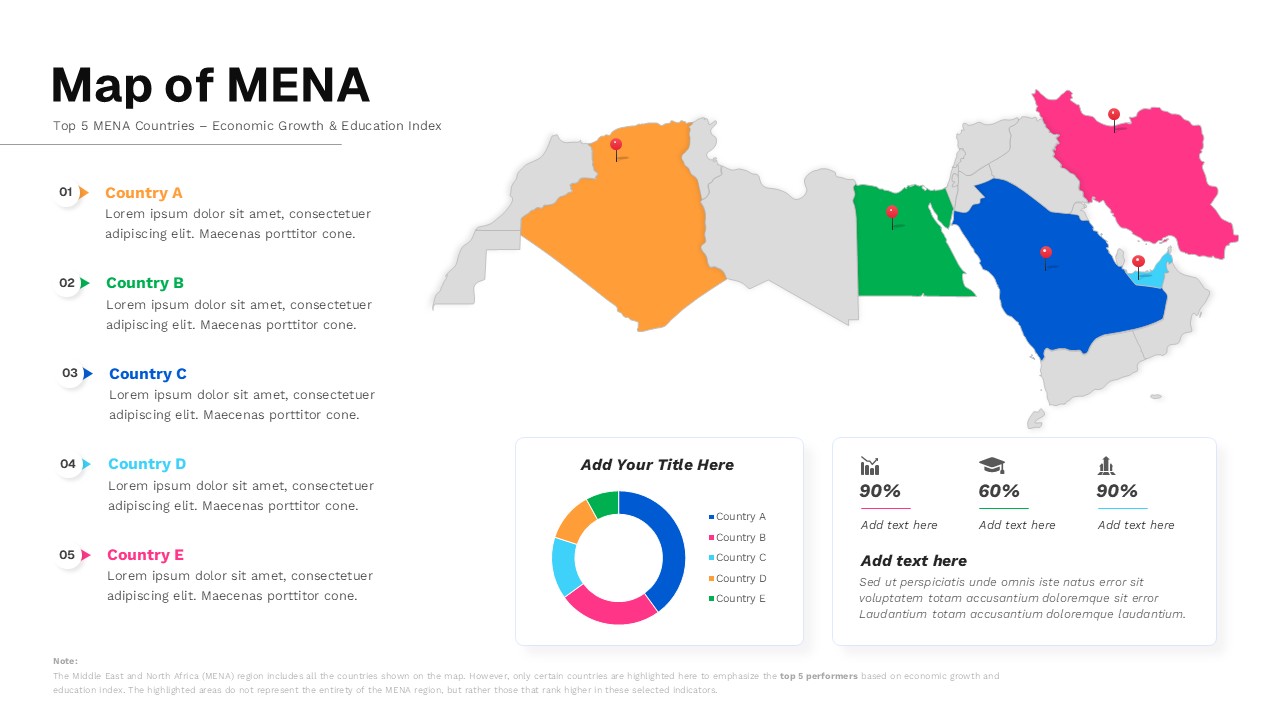
Map of MENA Infographic Template for PowerPoint & Google Slides
World Maps
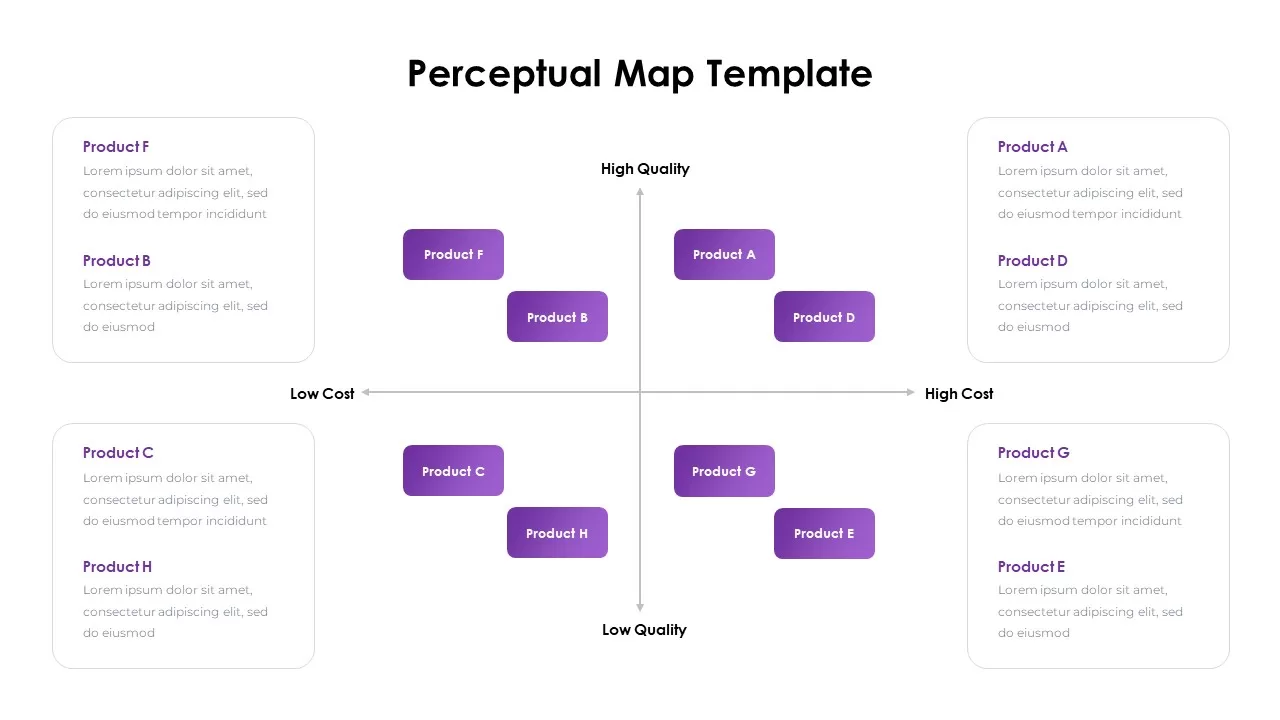
Perceptual Map infographic for PowerPoint & Google Slides
Competitor Analysis
Interactive US Population Data Map Slide Template for PowerPoint & Google Slides
World Maps
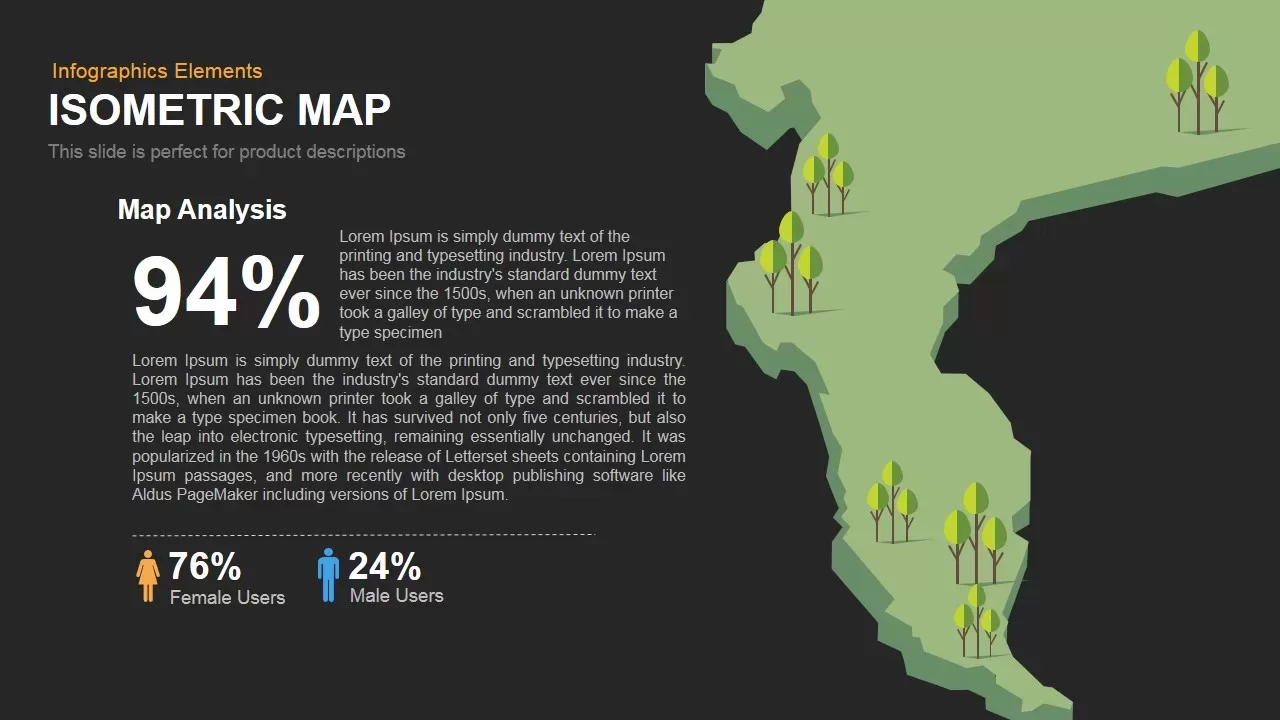
Isometric Map Analysis Slide Template for PowerPoint & Google Slides
World Maps
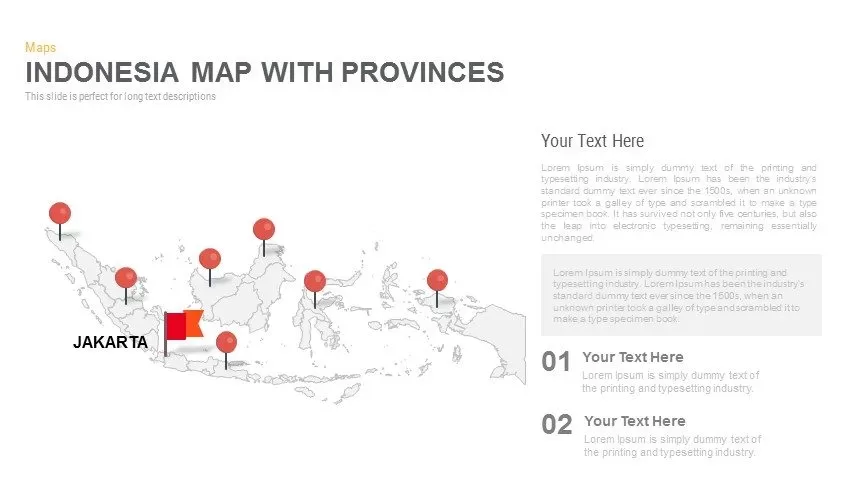
Indonesia Province Map Callout Slide Template for PowerPoint & Google Slides
Maps
Angola Provinces Map Slide Pack Template for PowerPoint & Google Slides
World Maps
Angola Map with Provinces Slide Pack Template for PowerPoint & Google Slides
World Maps
Burkina Faso Map with Regions Slide Pack Template for PowerPoint & Google Slides
World Maps
Cameroon Map with Regions Slide Pack Template for PowerPoint & Google Slides
World Maps
Chad Map with Regions Slide Pack Template for PowerPoint & Google Slides
World Maps
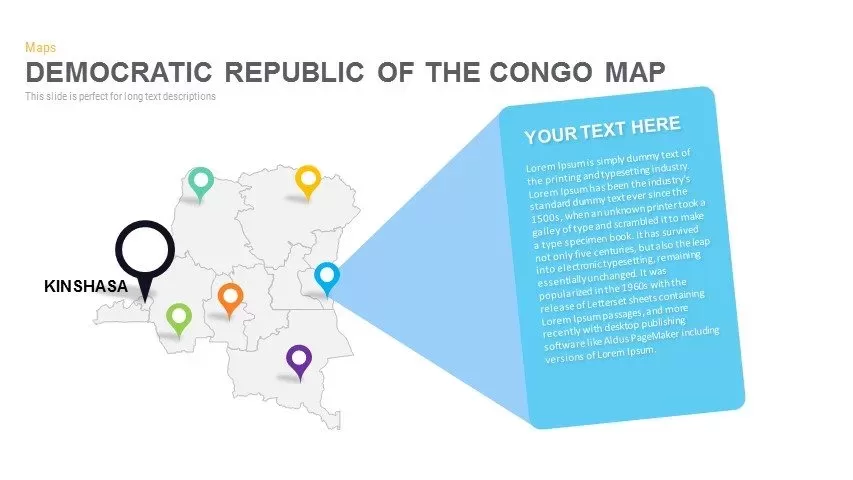
DR Congo Prefecture Map Slide Pack Template for PowerPoint & Google Slides
World Maps
Egypt Regional Map Slide Pack Template for PowerPoint & Google Slides
World Maps
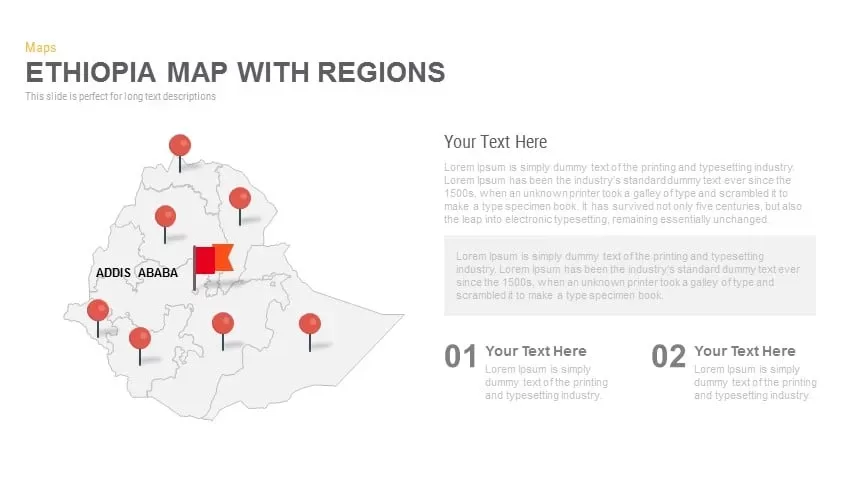
Ethiopia Map with Regions Slide Pack Template for PowerPoint & Google Slides
World Maps
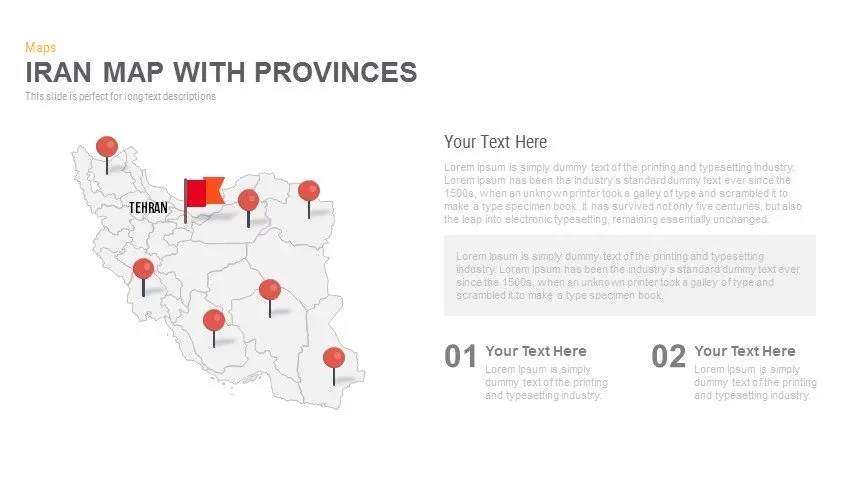
Iran Map with Provinces Slide Pack Template for PowerPoint & Google Slides
World Maps
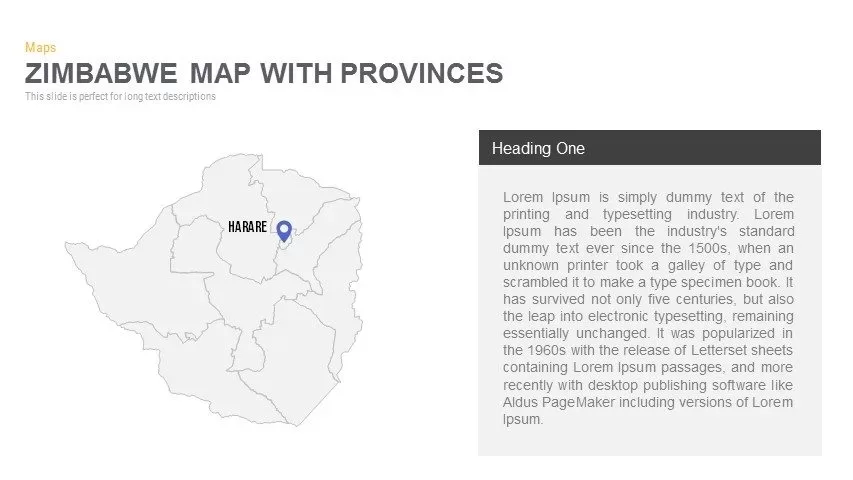
Zimbabwe Map with Provinces Slide Pack Template for PowerPoint & Google Slides
World Maps
Colorful Multi-Branch Mind Map Slide Template for PowerPoint & Google Slides
Mind Maps
Numbered Cameroon Regional Map Slide Template for PowerPoint & Google Slides
World Maps
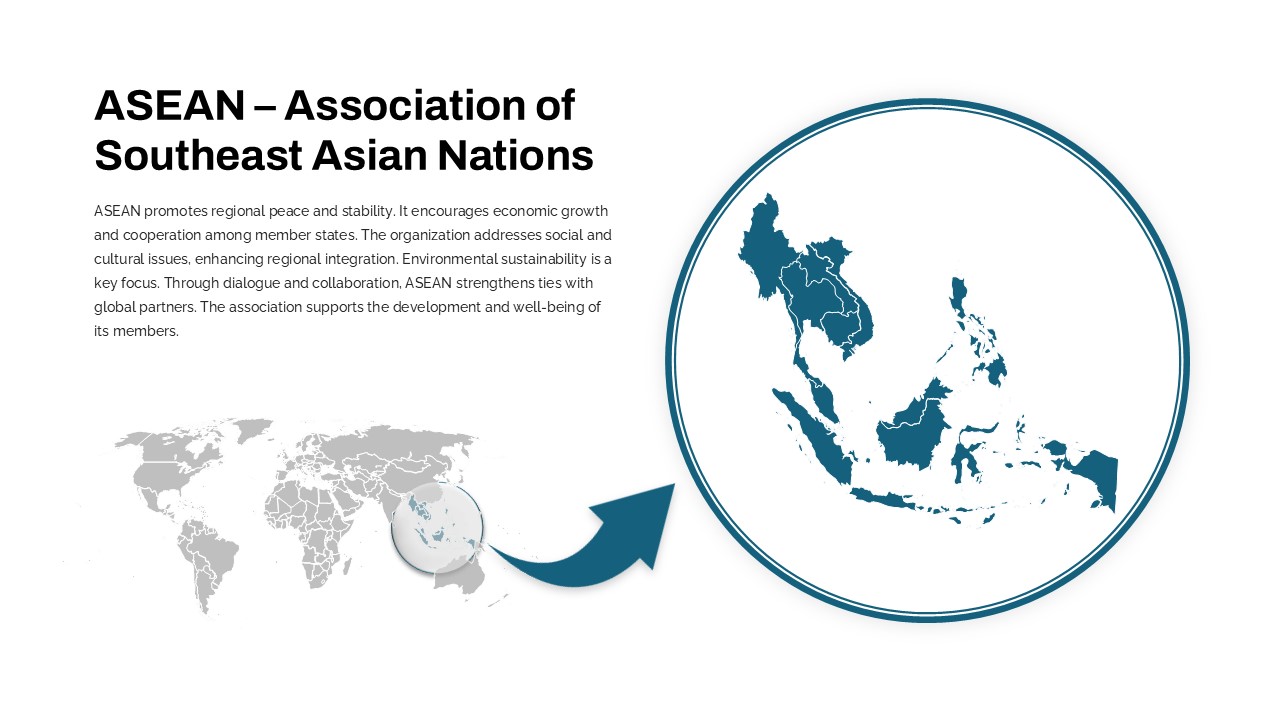
Professional ASEAN Region Zoom Map Slide Template for PowerPoint & Google Slides
World Maps
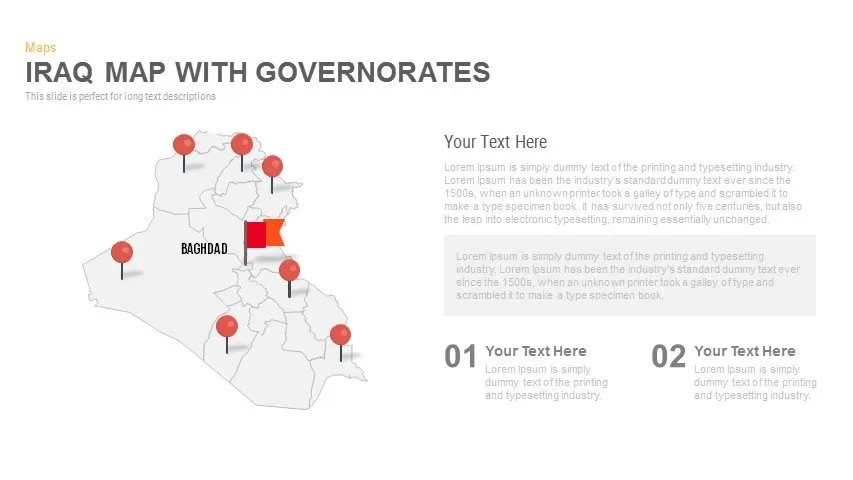
Interactive Iraq Map with Governorates Slide Pack for PowerPoint & Google Slides
World Maps
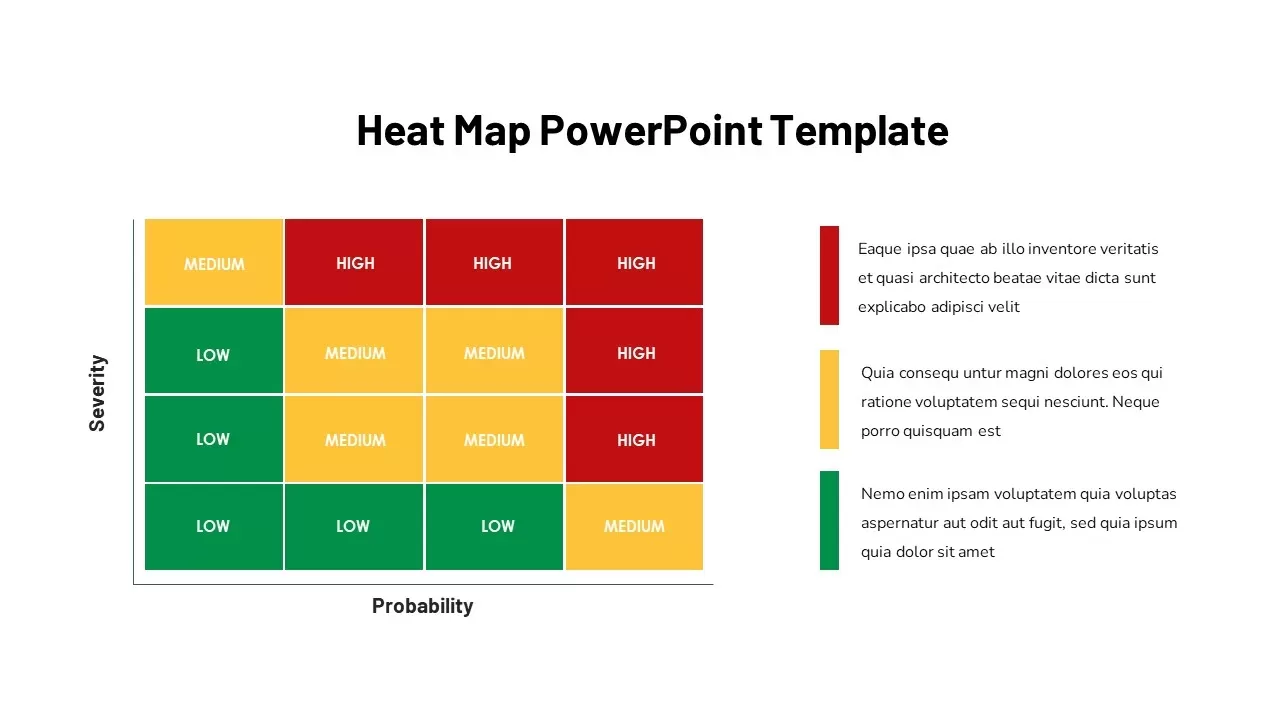
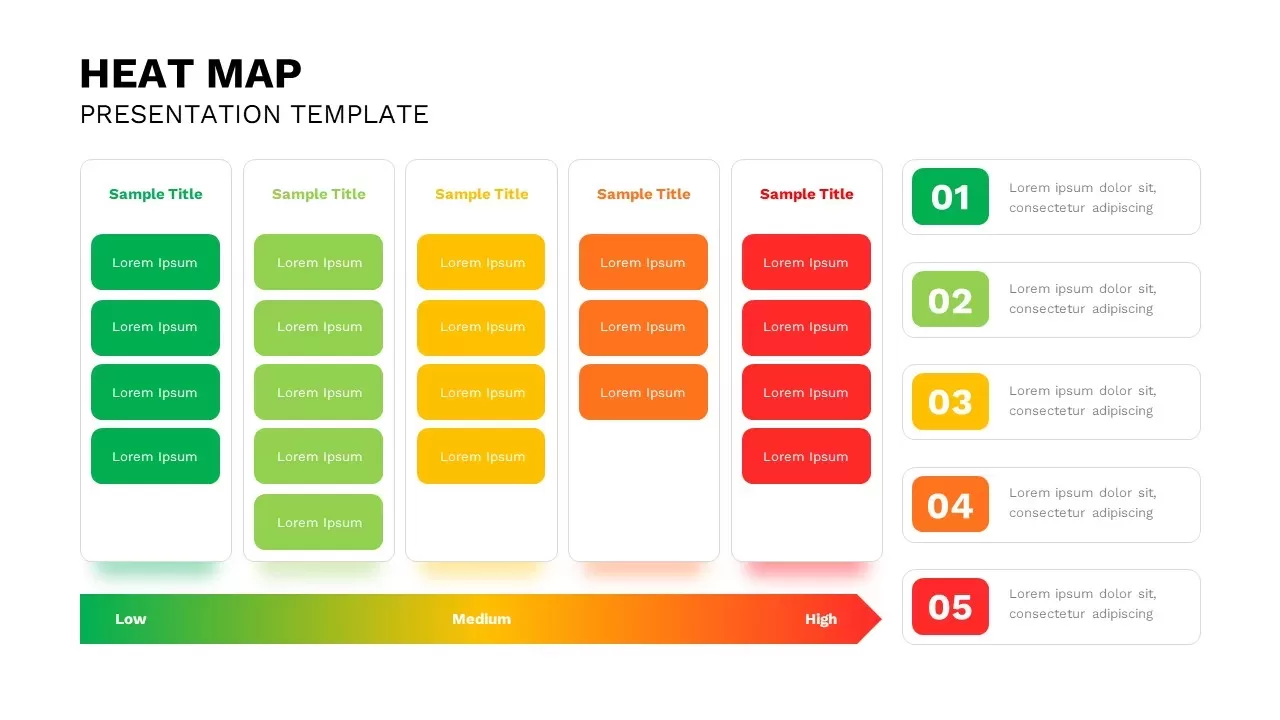
Heat Map Slide for PowerPoint & Google Slides
Maps
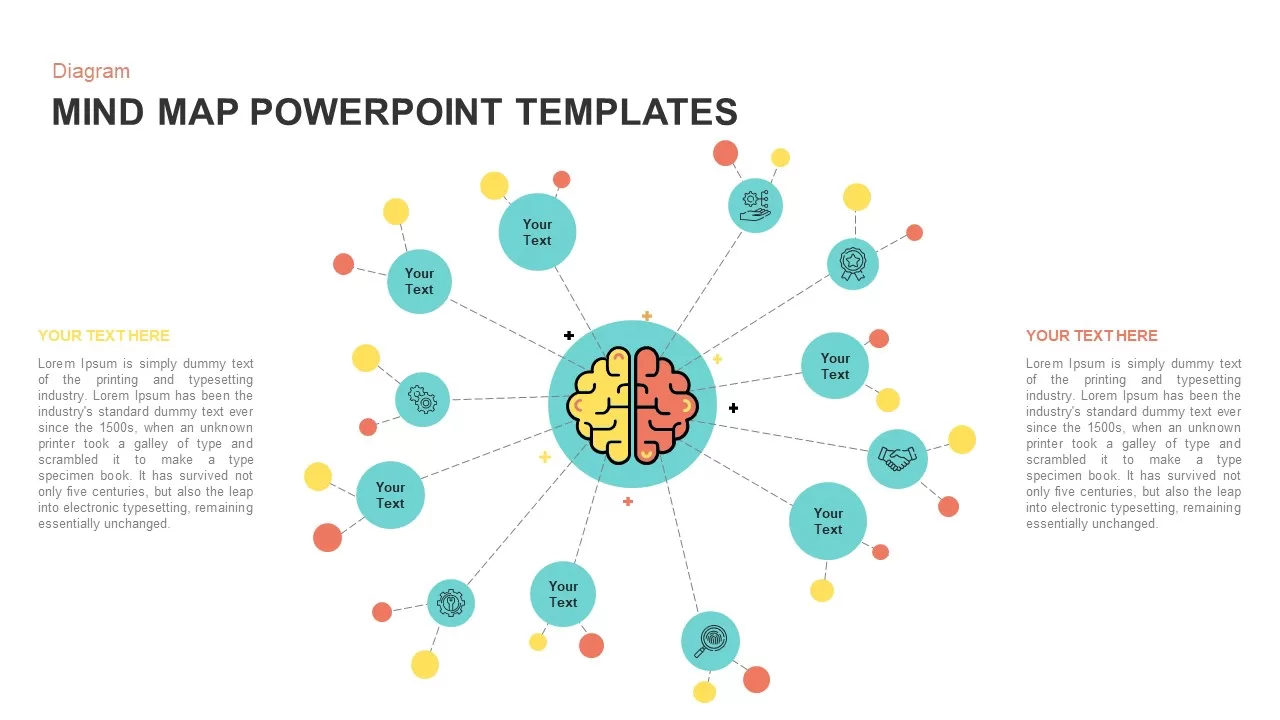
Mind Map PowerPoint template for PowerPoint & Google Slides
Mind Maps
Editable Colombia Map PowerPoint Template for PowerPoint & Google Slides
Business Models
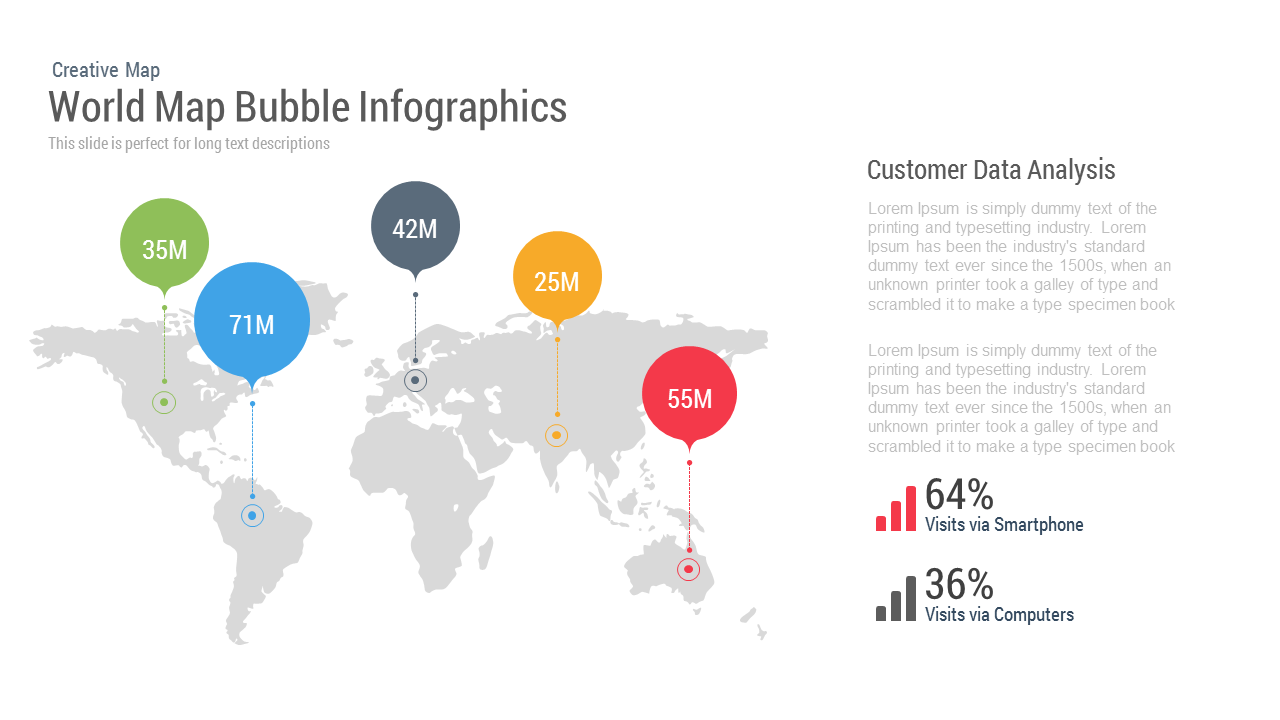
World Map Bubble template for PowerPoint & Google Slides
World Maps

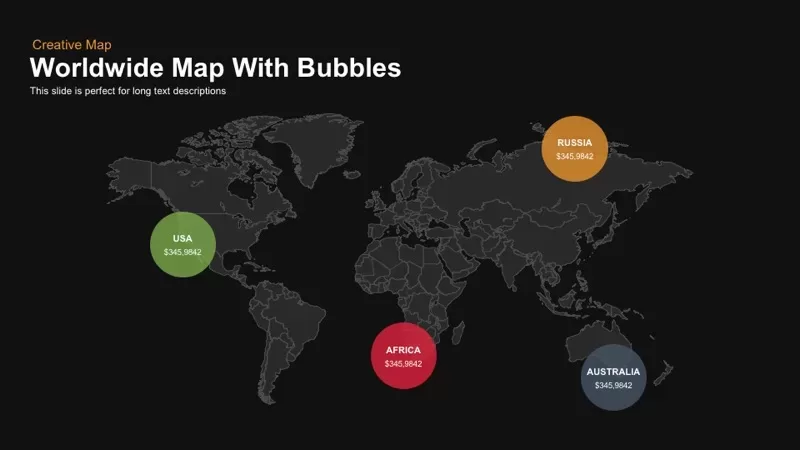
Worldwide Map with Bubbles template for PowerPoint & Google Slides
World Maps
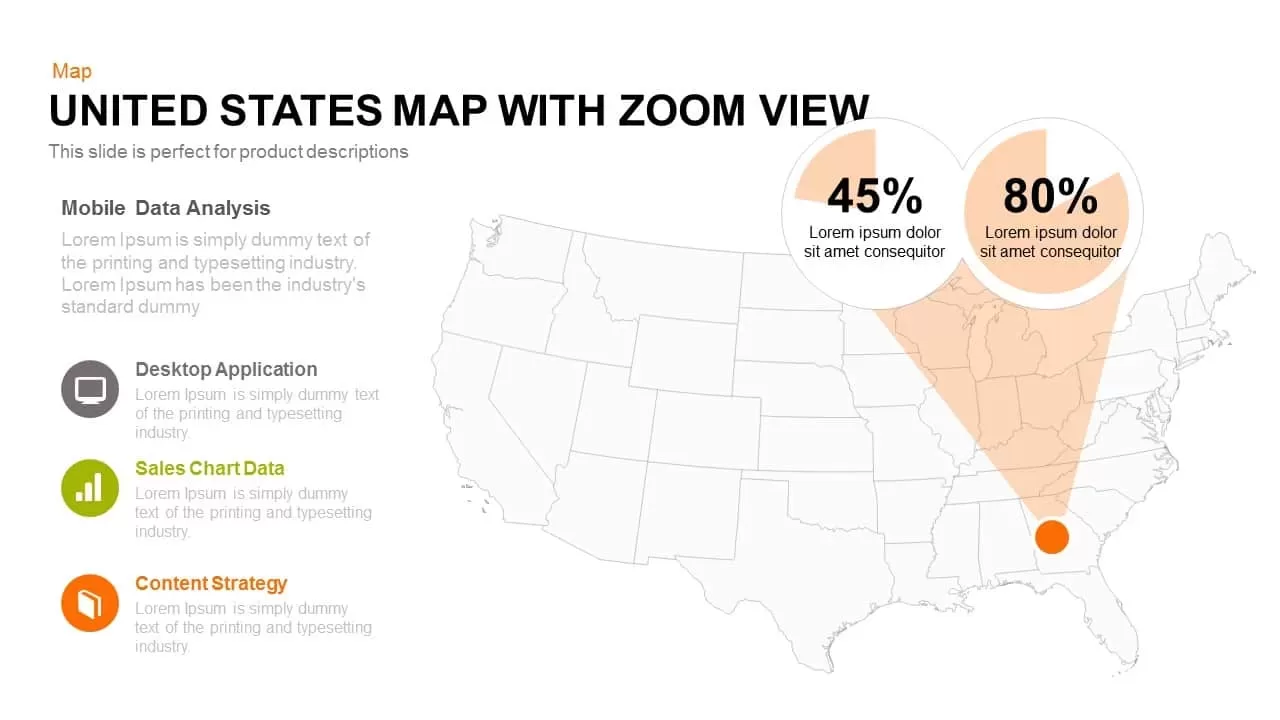
United States Map with Zoom View template for PowerPoint & Google Slides
World Maps
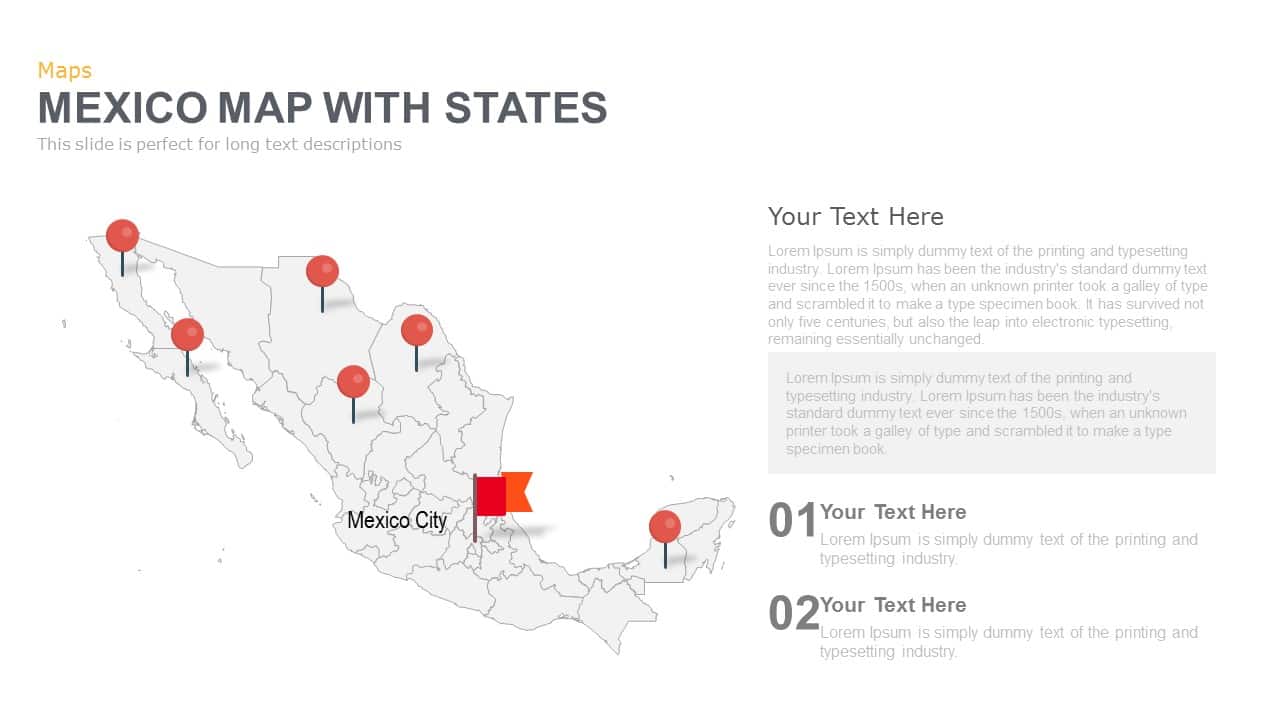
Mexico Map With States Template for PowerPoint & Google Slides
World Maps
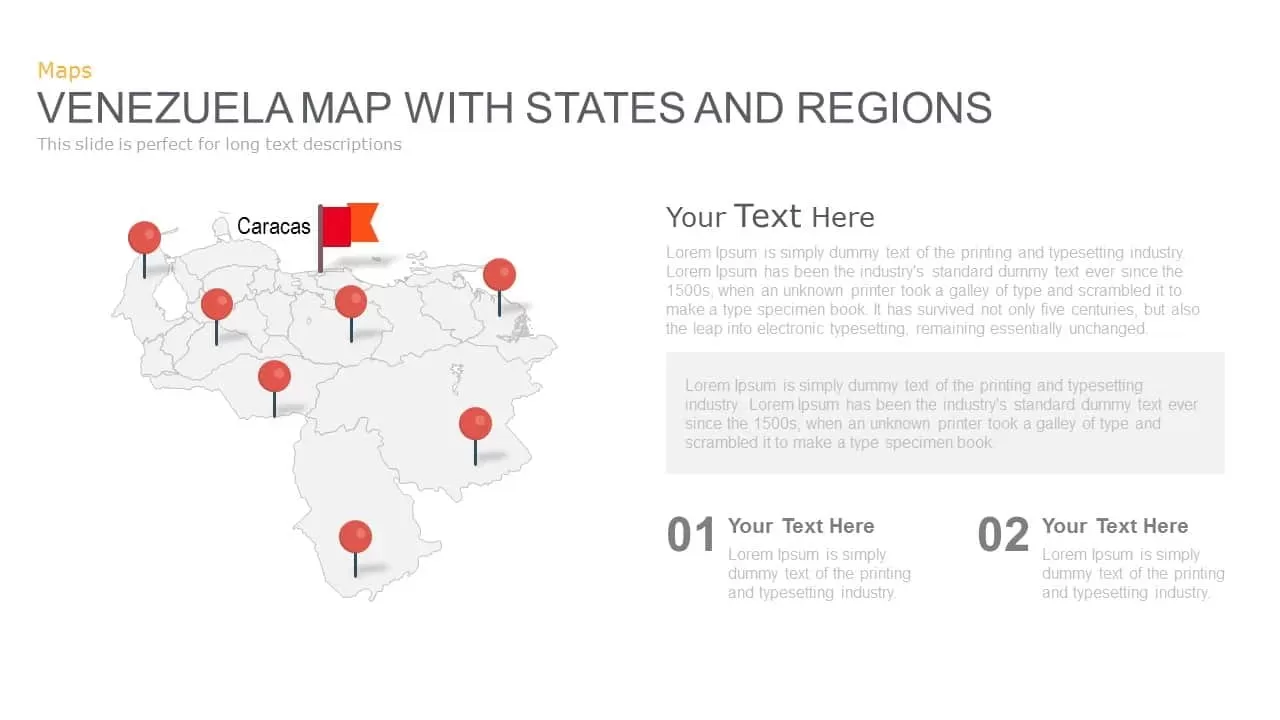
Venezuela Map with States and Regions Template for PowerPoint & Google Slides
World Maps
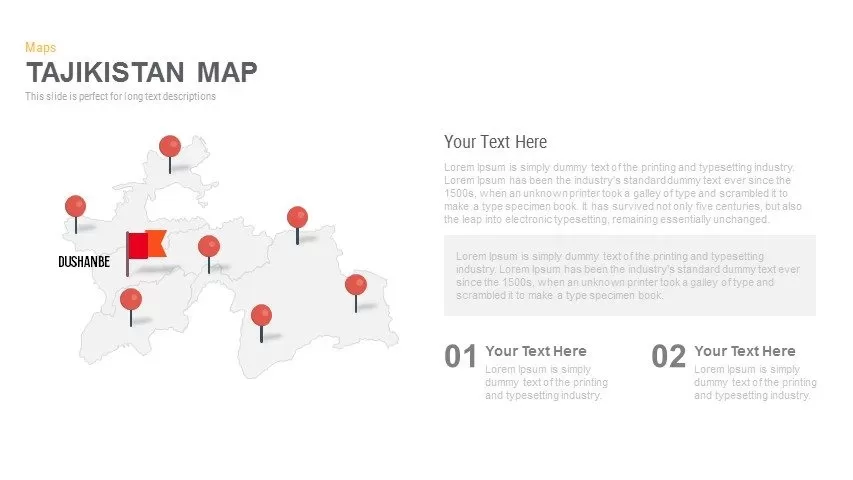
Editable Tajikistan Provinces Map Pack Template for PowerPoint & Google Slides
Maps
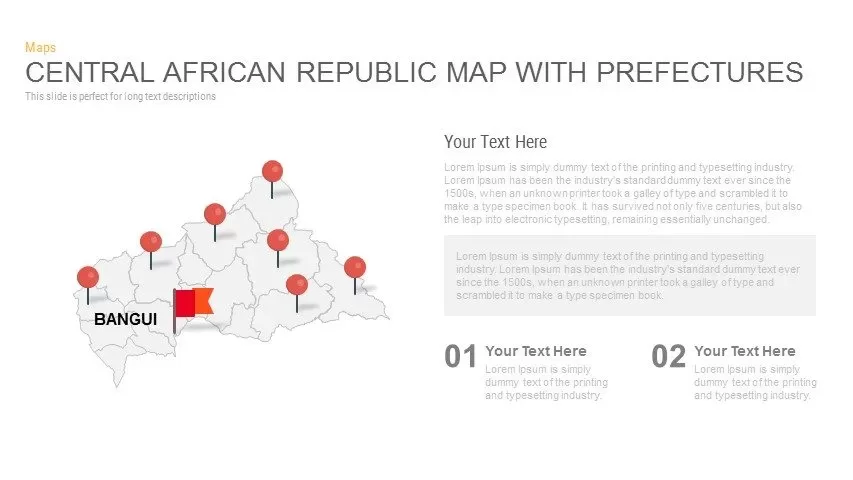
Central African Republic Prefectures Map Template for PowerPoint & Google Slides
World Maps

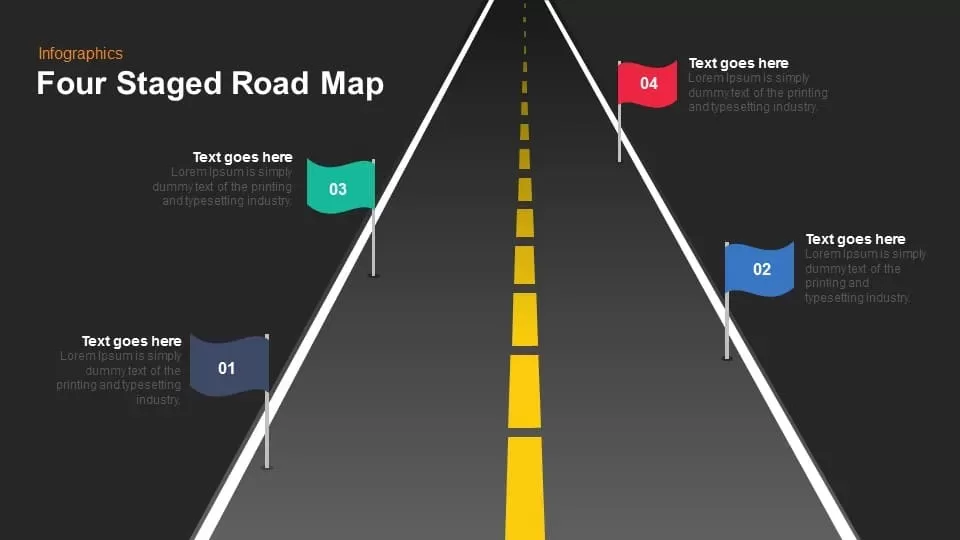
Four Staged Road Map template for PowerPoint & Google Slides
Roadmap

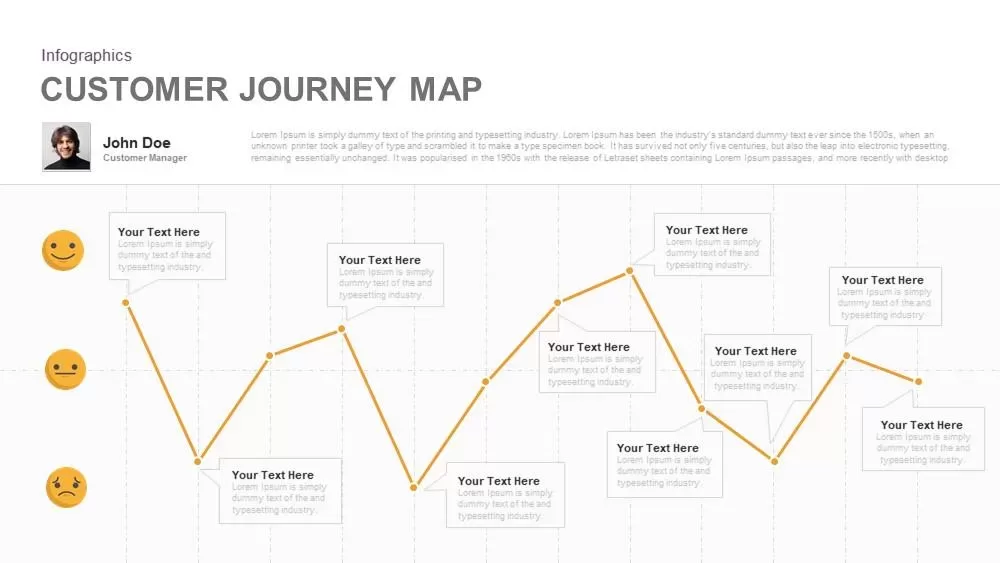
Emotional Customer Journey Map Template for PowerPoint & Google Slides
Customer Journey
Mind Map Diagram Template for PowerPoint & Google Slides
Mind Maps
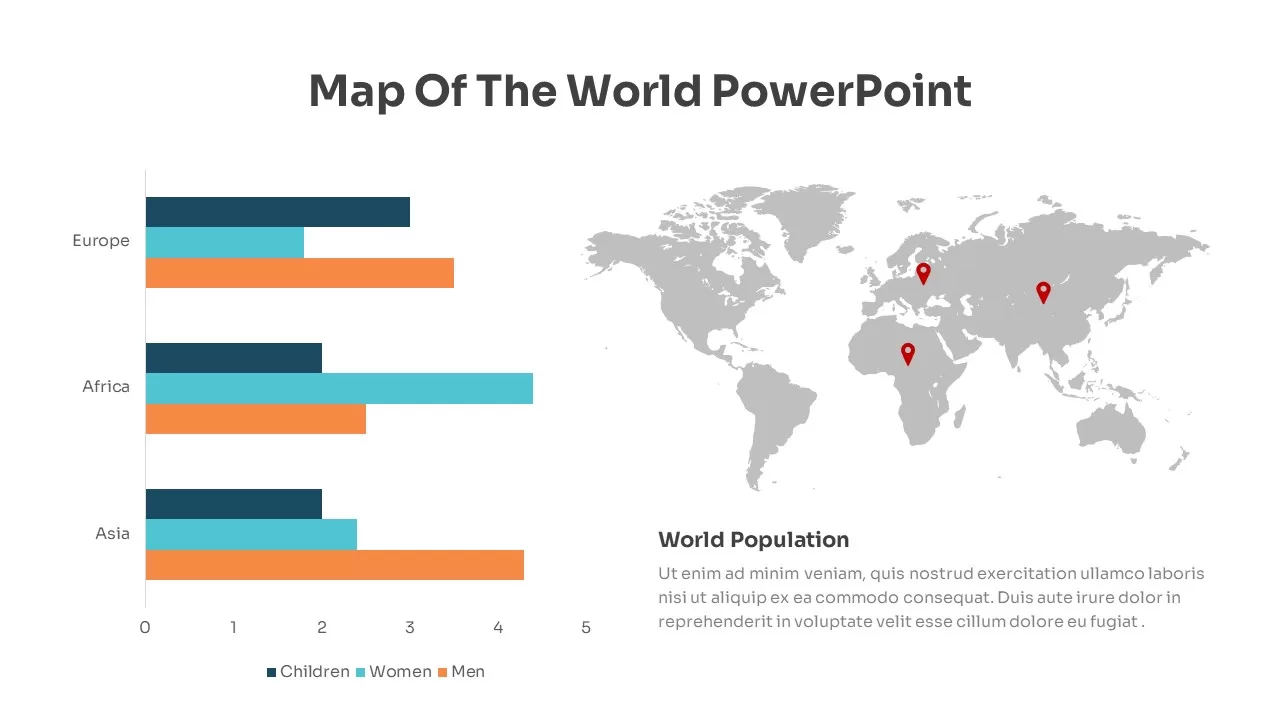
Global Population Demographics & Map Template for PowerPoint & Google Slides
Bar/Column
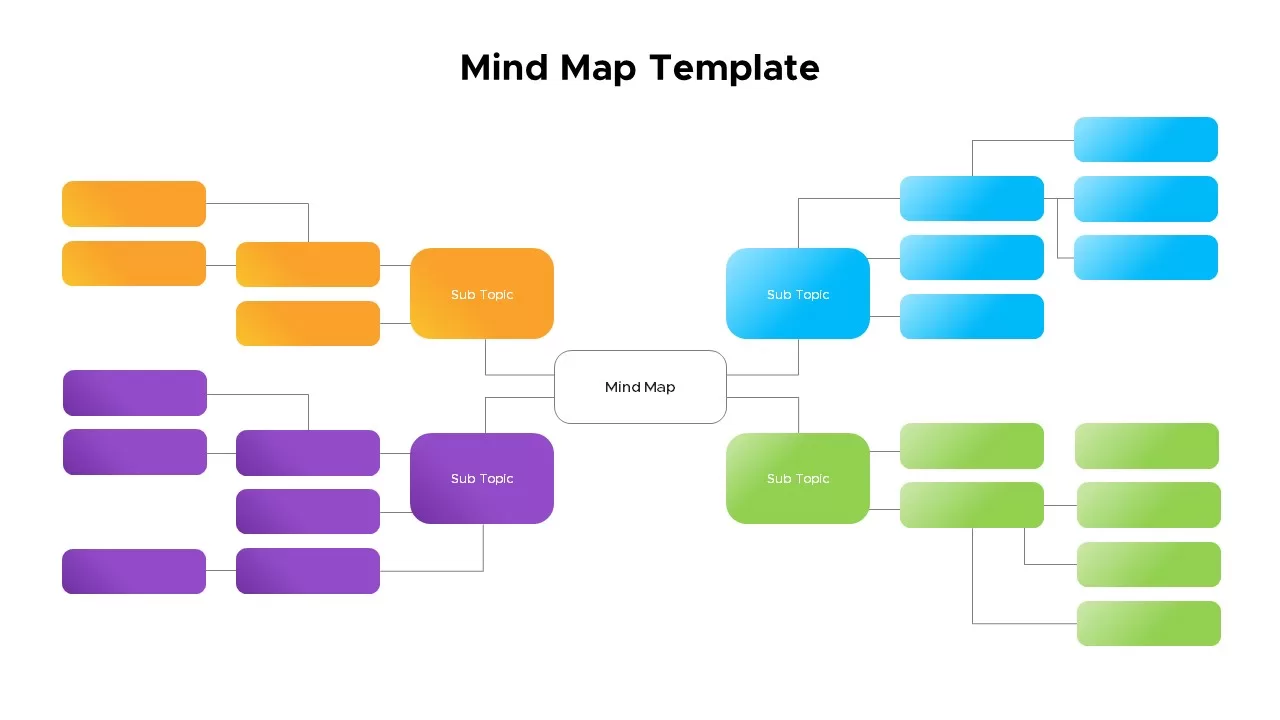
Mind Map Template for PowerPoint & Google Slides
Mind Maps
Colorful Mind Map Template for PowerPoint & Google Slides
Mind Maps
Circular Mind Map Template for PowerPoint & Google Slides
Mind Maps
Mind Map Template for PowerPoint & Google Slides
Mind Maps
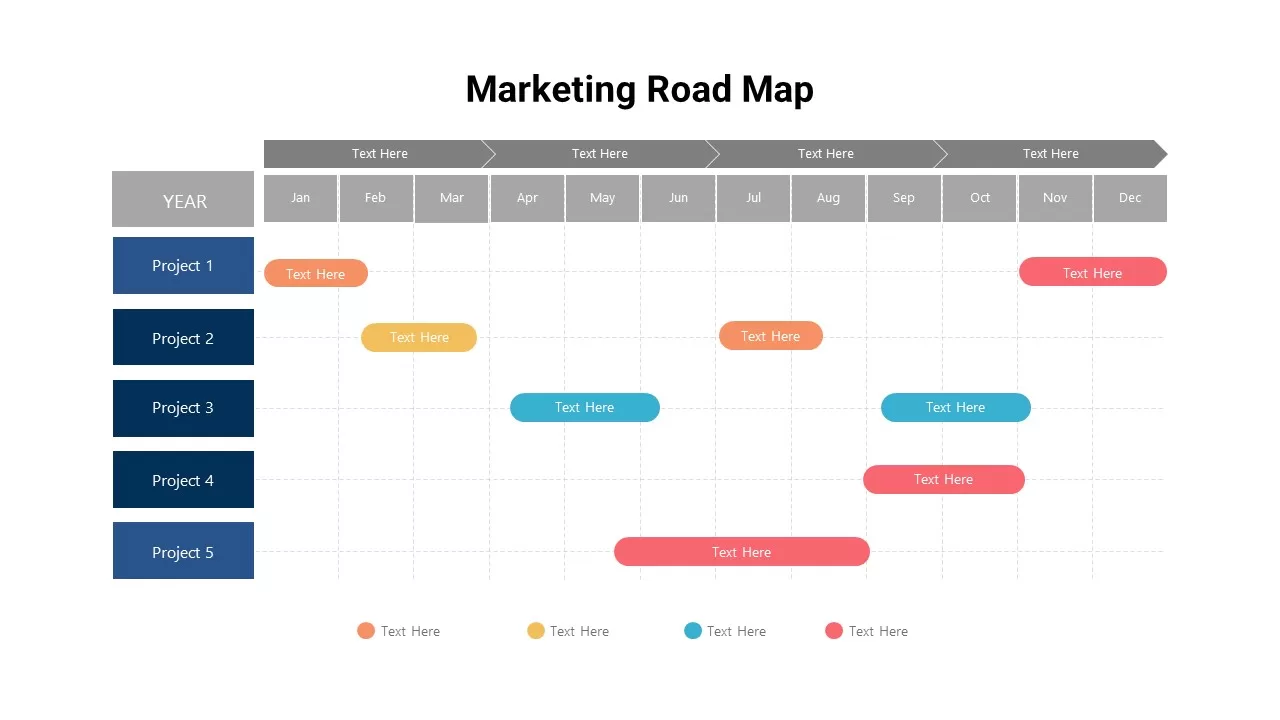
Detailed Marketing Road Map Timeline Template for PowerPoint & Google Slides
Timeline
Marketing Projects Road Map Timeline Template for PowerPoint & Google Slides
Roadmap
Heat Map Analysis Template for PowerPoint & Google Slides
Risk Management
Interactive Heat Map Template for PowerPoint & Google Slides
Bar/Column
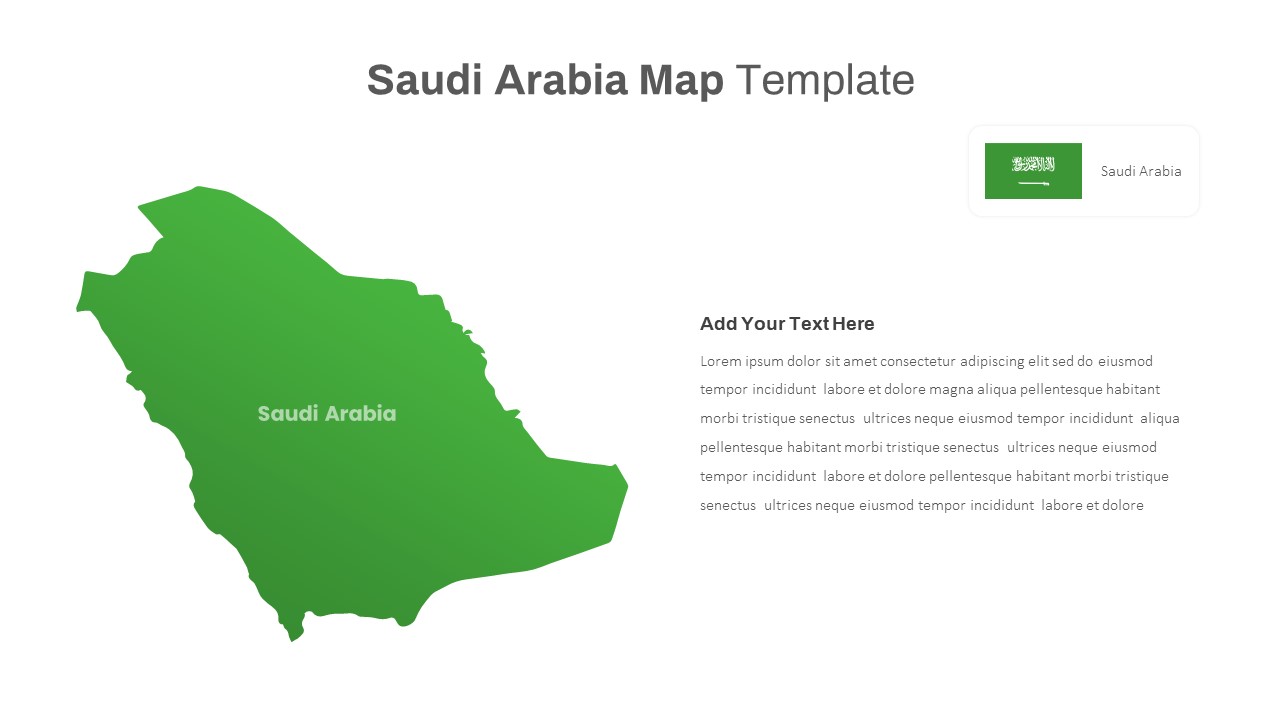
Free Editable Saudi Arabia Map Template for PowerPoint & Google Slides
World Maps
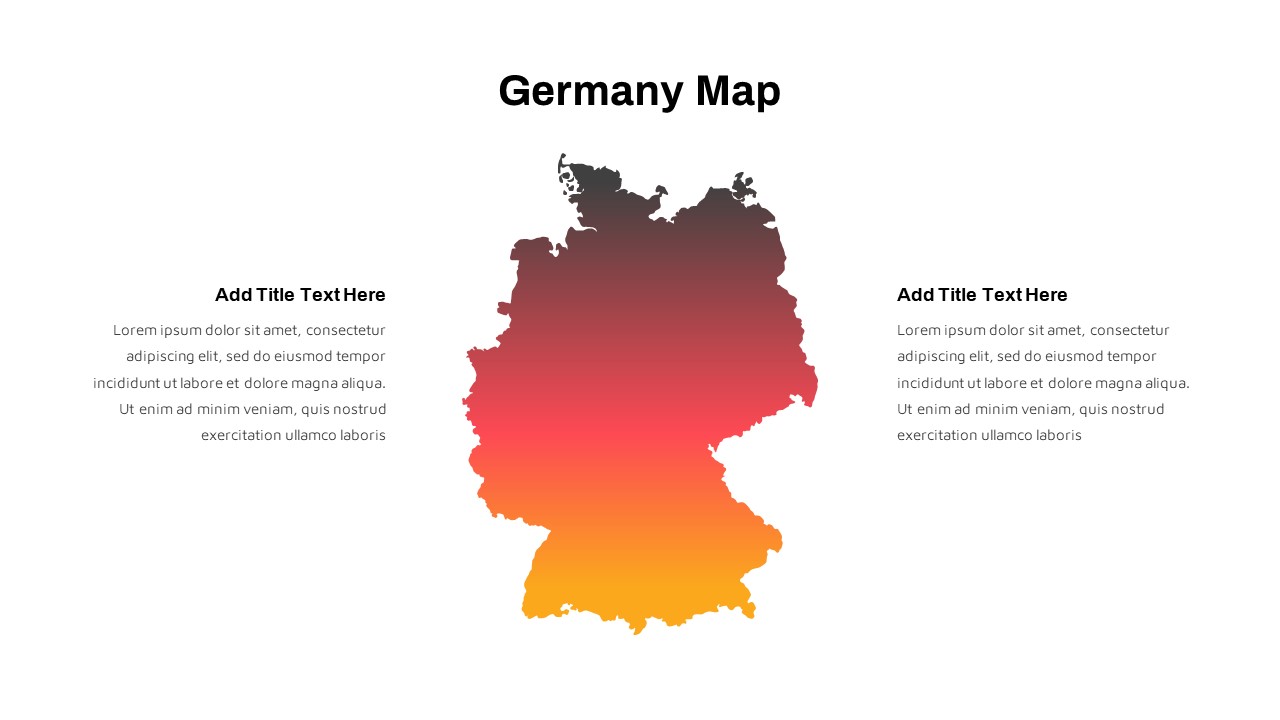
Germany Map with Regional Callouts Template for PowerPoint & Google Slides
World Maps
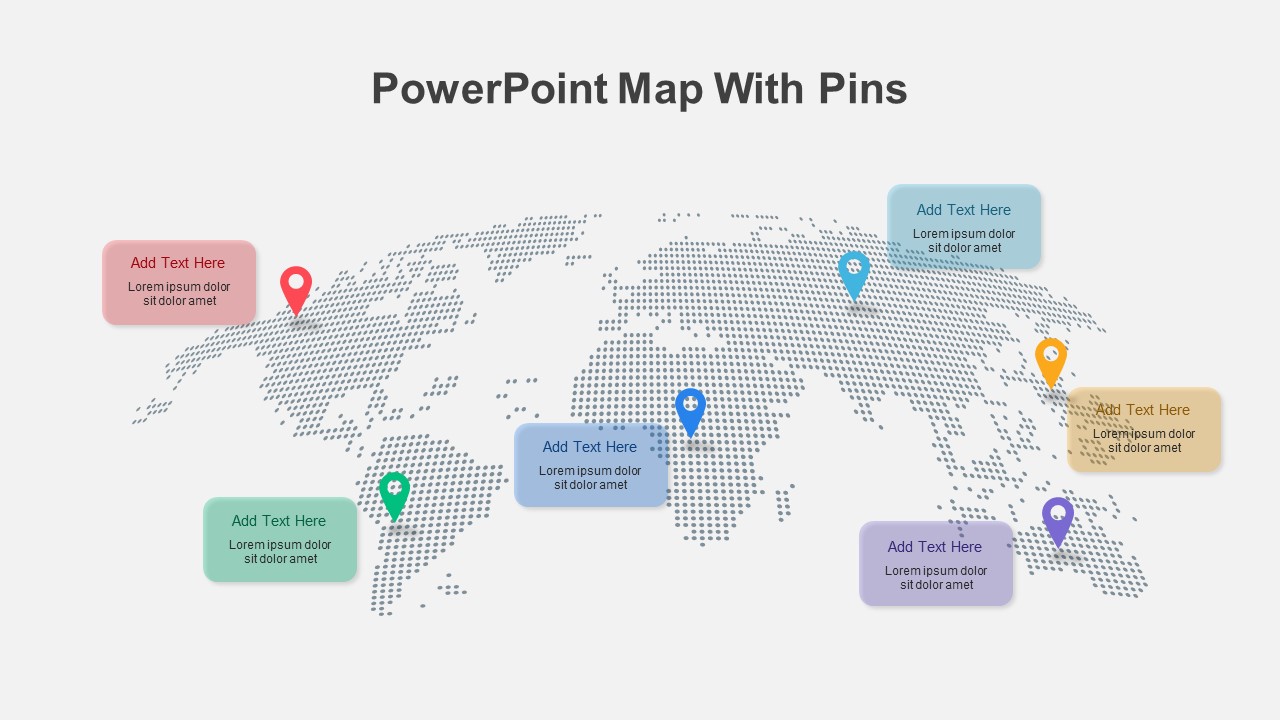
Colorful World Map with Location Pins Template for PowerPoint & Google Slides
World Maps
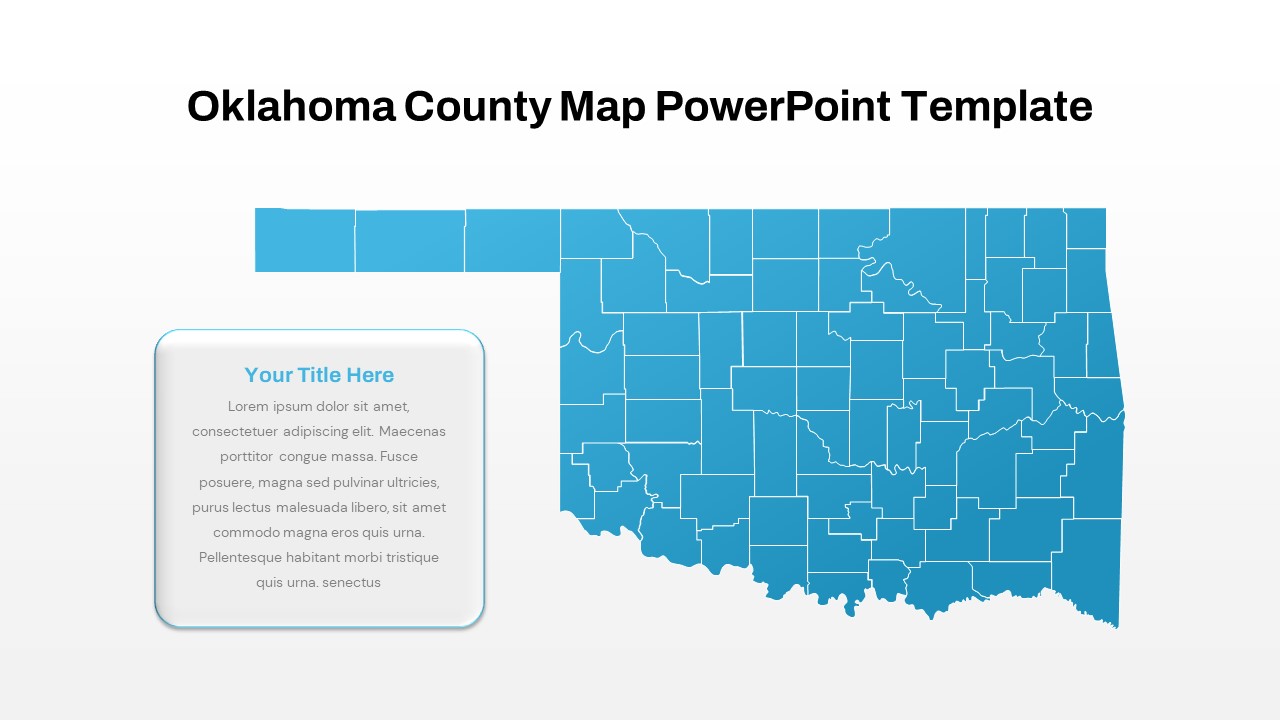
Interactive Oklahoma County Map Template for PowerPoint & Google Slides
World Maps
Kentucky County Map Visualization Template for PowerPoint & Google Slides
World Maps
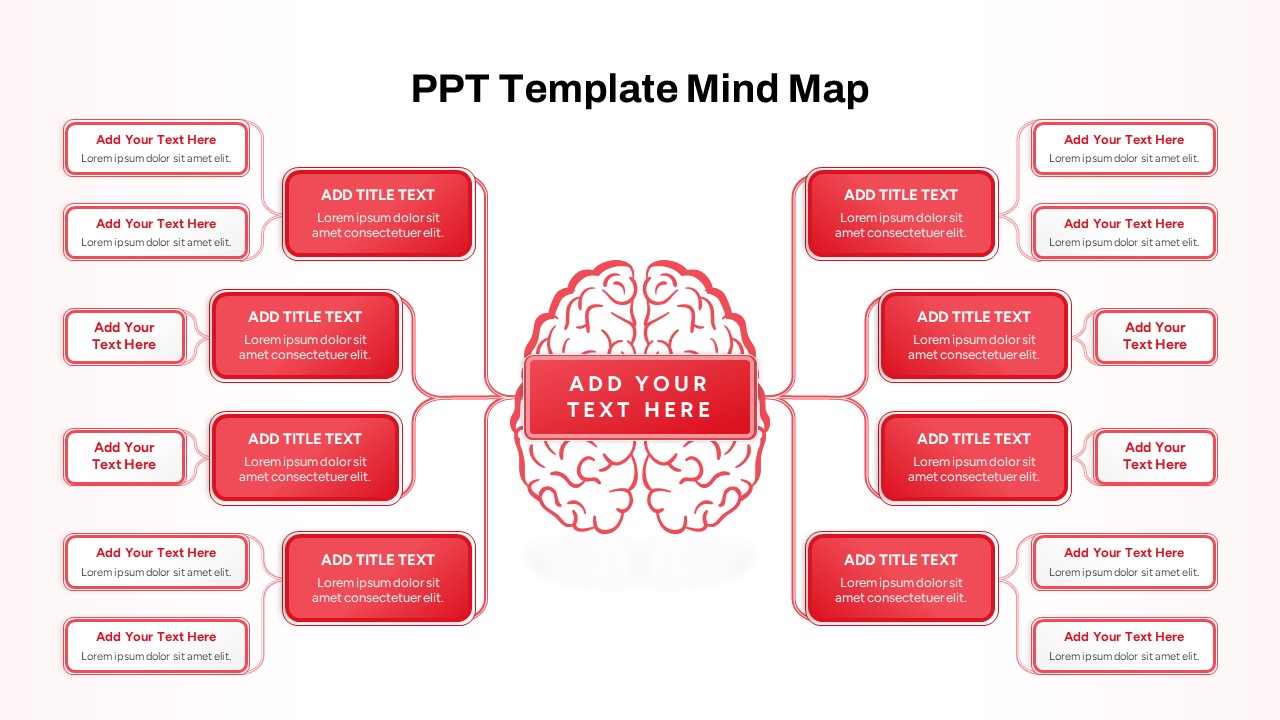
Red Brain Mind Map Diagram Template for PowerPoint & Google Slides
Mind Maps
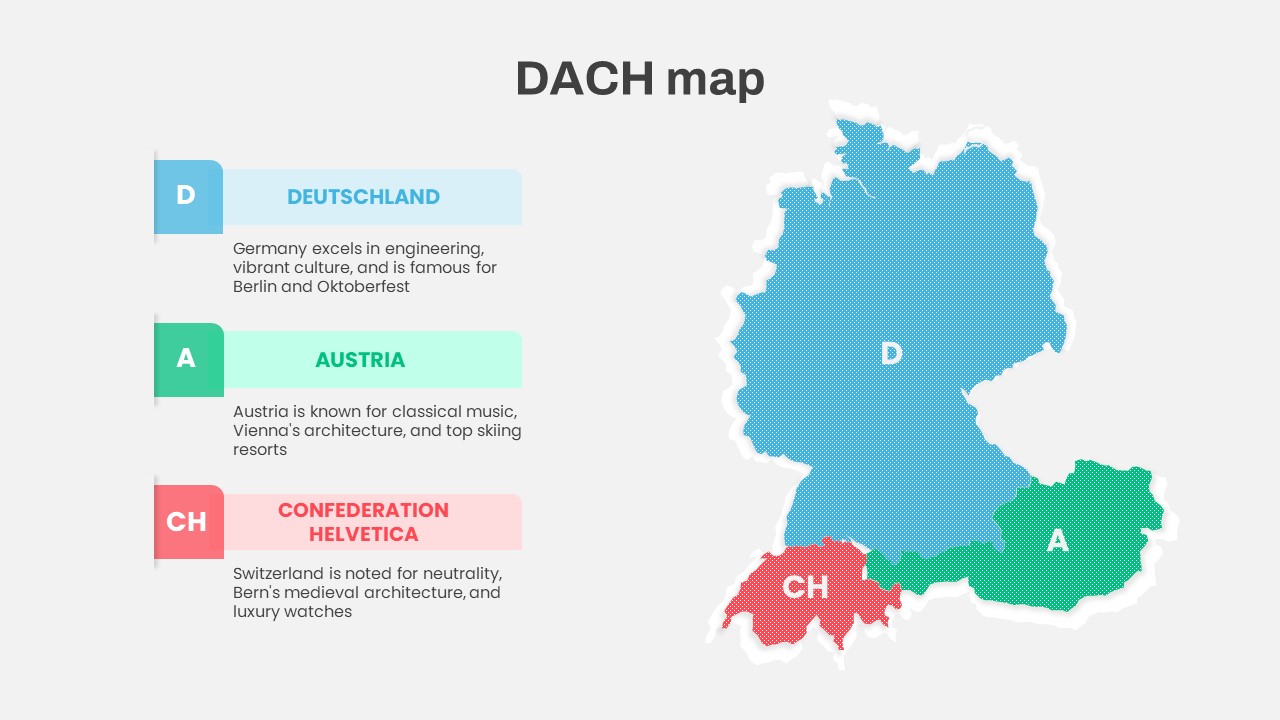
DACH Region Map with Country Highlights Template for PowerPoint & Google Slides
Maps
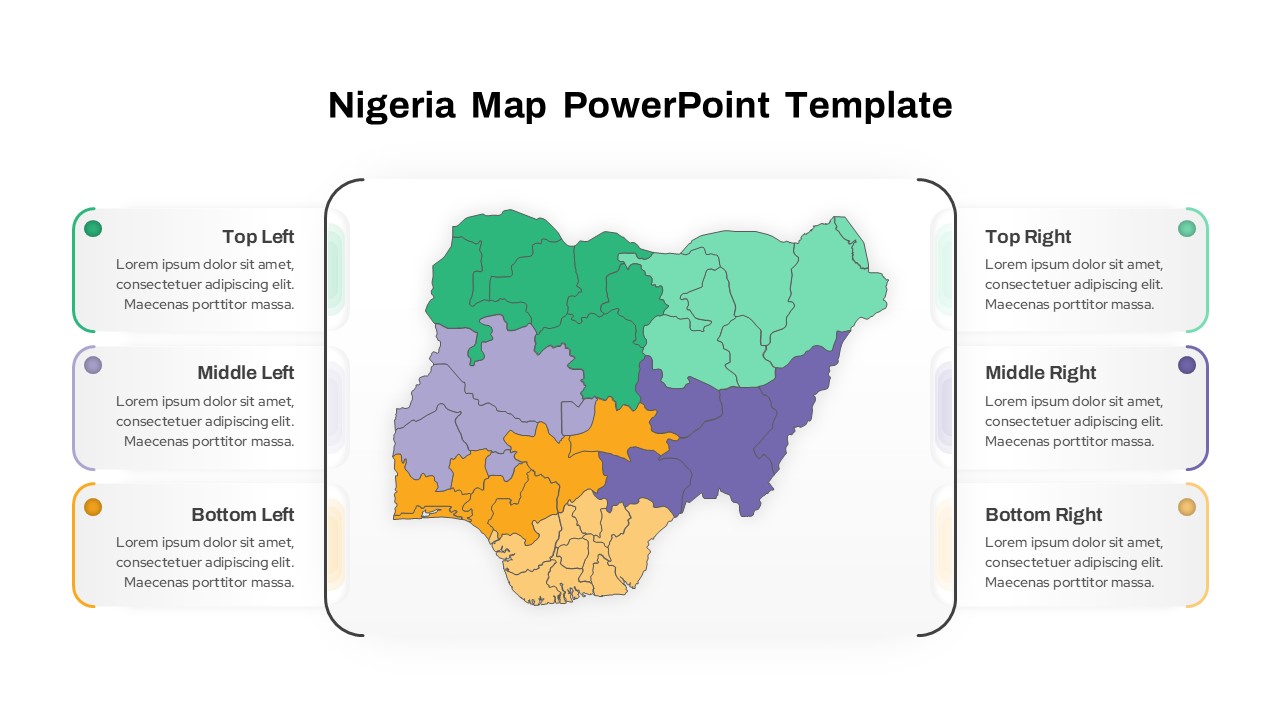
Nigeria Regional Callout Map Diagram Template for PowerPoint & Google Slides
Maps
AI and Data Ecosystem Map Template for PowerPoint & Google Slides
AI
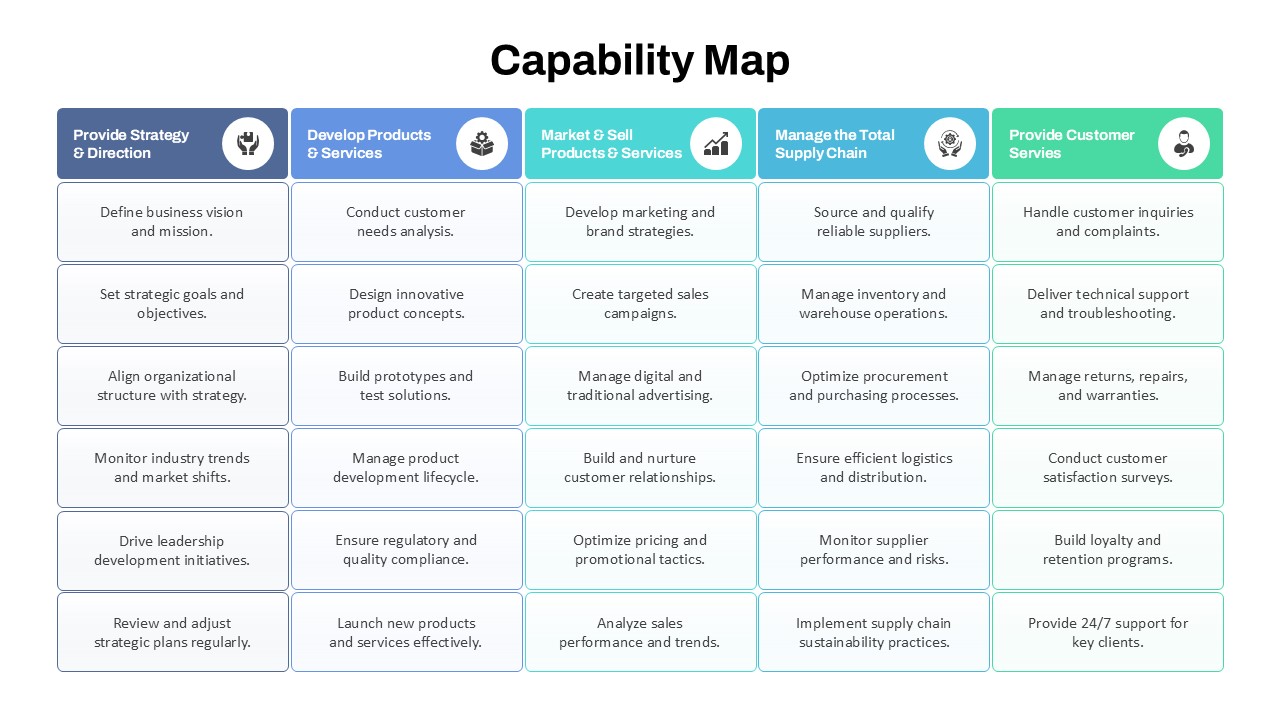
Capability Map Overview Template for PowerPoint & Google Slides
Business Strategy
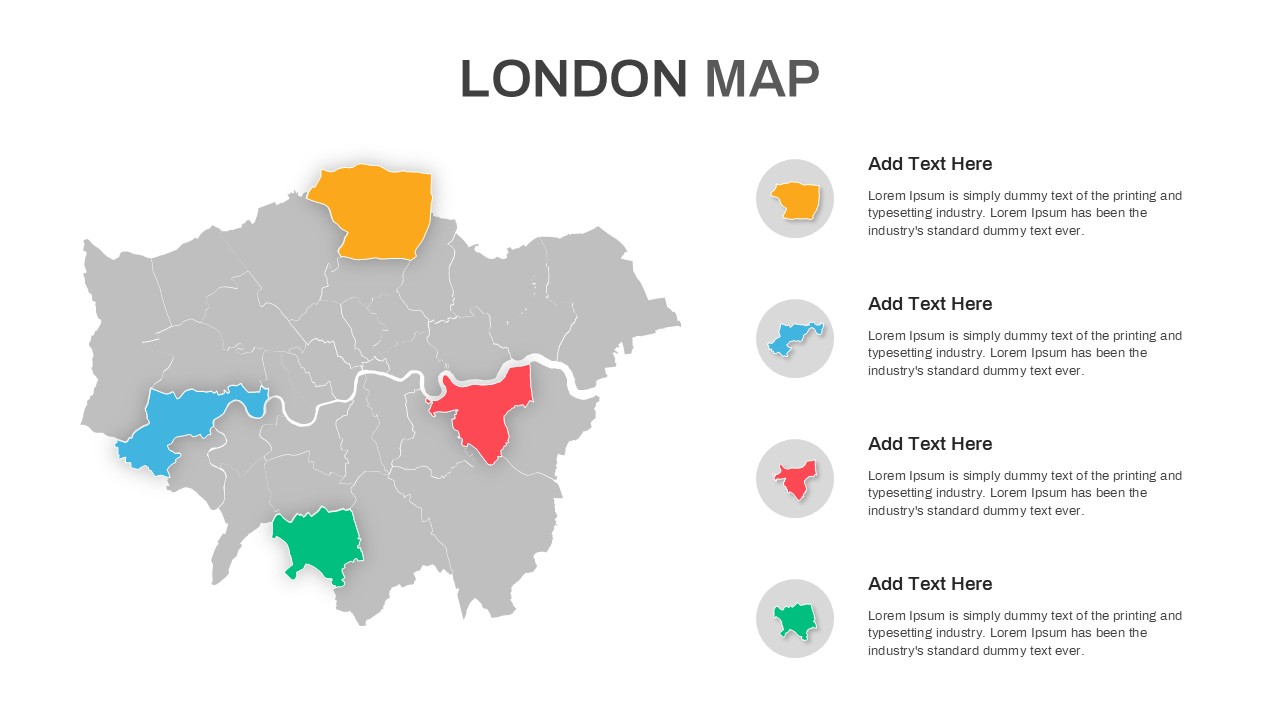
London Map with Highlighted Boroughs Template for PowerPoint & Google Slides
World Maps