North America Data Map Callouts Template for PowerPoint & Google Slides


Description
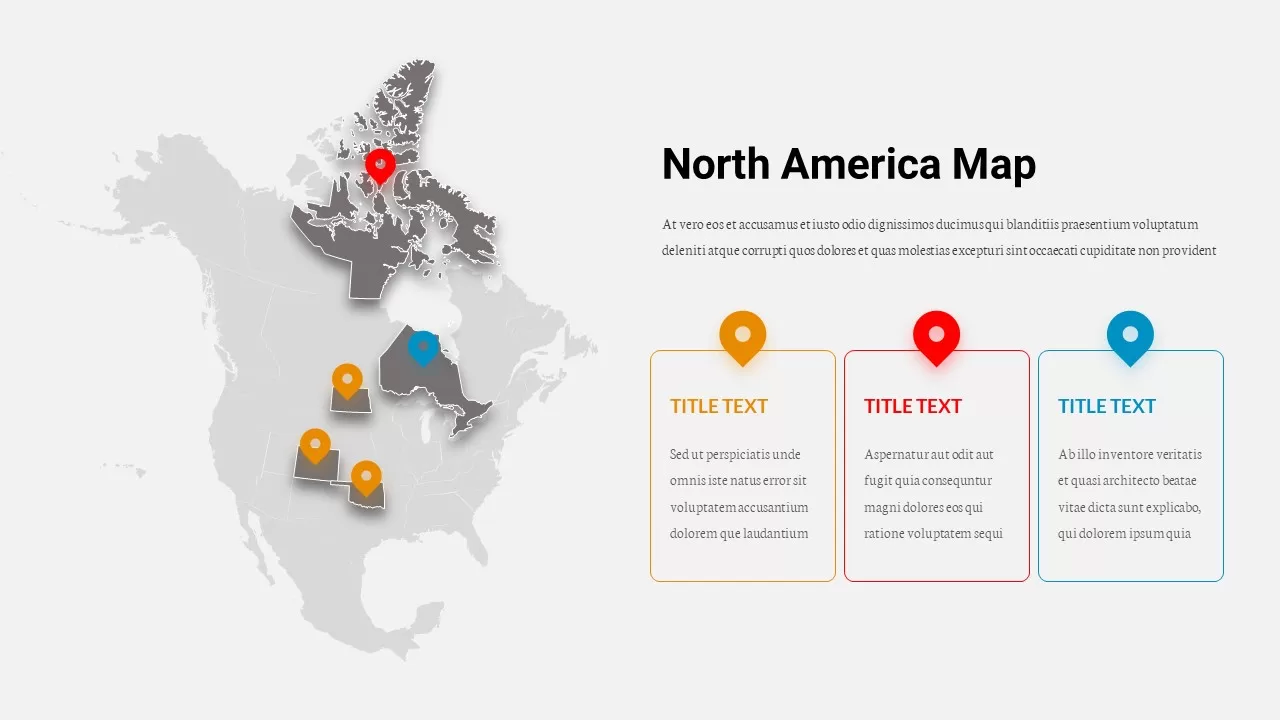
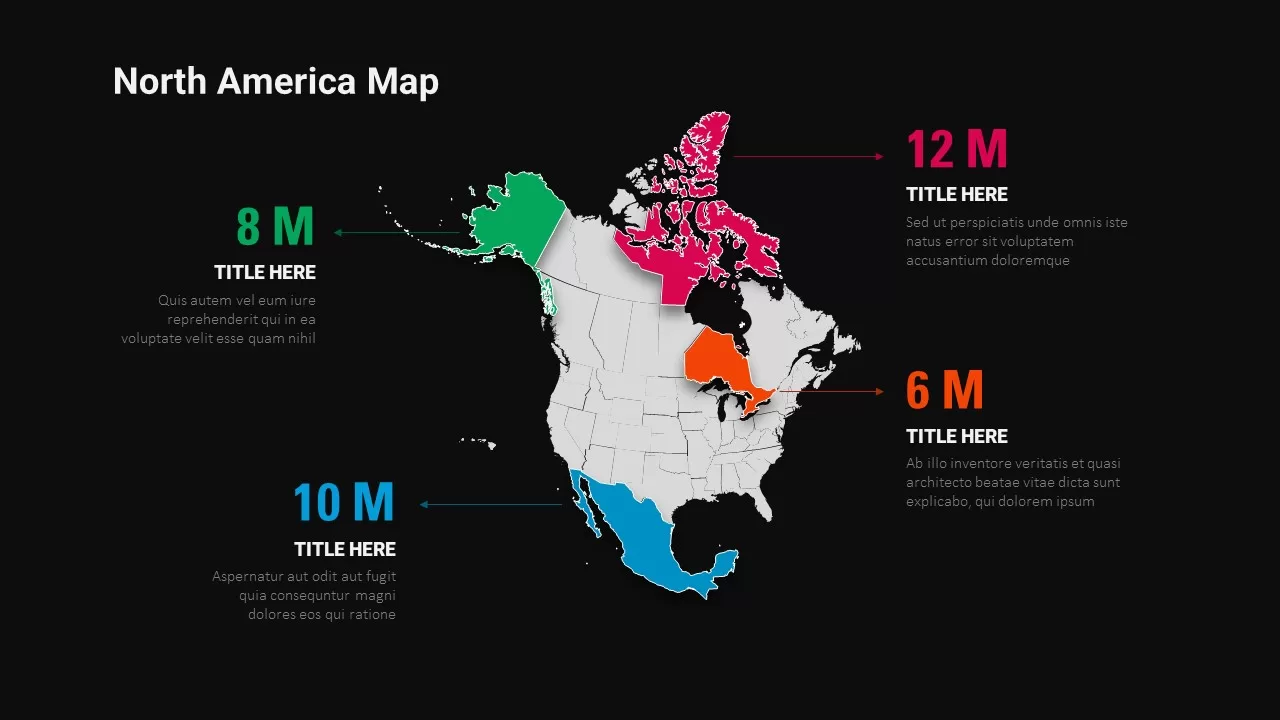
Leverage this dynamic North America map infographic slide to present regional metrics, demographic data, or performance indicators across distinct geographic areas. The design features a grayscale base map of North America with four highlighted regions—Alaska in green, Mexico in blue, Eastern Canada in orange, and the Canadian mainland in magenta—each accented by directional arrows linking to editable callout boxes. Each callout box accommodates a bold numeric headline and secondary text, allowing users to display sales figures, population counts, growth percentages, or other key statistics. The modern flat aesthetic, complemented by crisp typography and clean line arrows, ensures that audience attention is drawn to the data highlights without distraction. Master slide framework and intuitive placeholders let you adjust region colors, tweak arrow styles, update fonts, and replace placeholder text with your own insights in seconds, maintaining consistent alignment and spacing throughout your presentation.
Ideal for market analysis, sales performance reviews, supply chain visualizations, or academic presentations, this fully customizable template supports both PowerPoint and Google Slides formats with pixel-perfect clarity on any device. Additional slide variations include alternative layouts for single-region focus, side-by-side comparisons, and up to six callout configurations, enabling you to adapt the map to varied storytelling needs. Built-in guidelines ensure uniform placement of design elements, while layered objects facilitate quick toggling of map visibility layers. Add company logos, integrate color palettes to match brand guidelines, or insert custom icons for an enhanced look. With this North America Data Map infographic, you can accelerate the creation of professional reports, strategic proposals, and executive dashboards, driving clearer regional insights and more engaging presentations.
Who is it for
Market analysts, sales managers, regional planners, and business strategists will benefit from this map callouts slide when illustrating regional performance, demographic breakdowns, or territory-specific KPIs to stakeholders and executive teams.
Other Uses
Repurpose this layout for distribution network mapping, customer segmentation reports, supply chain overviews, demographic studies, or investment region analyses. The callout structure also supports highlighting facility locations, sales territories, risk zones, or market entry strategies.
Login to download this file

Item ID
SB02661
Related Templates

North America Map template for PowerPoint & Google Slides
World Maps
North America Percentage Map Infographic Template for PowerPoint & Google Slides
World Maps
North America Location Pin Map Overview Template for PowerPoint & Google Slides
World Maps
North America Map Infographic Slide Template for PowerPoint & Google Slides
World Maps
North America Regional Map Overview Template for PowerPoint & Google Slides
World Maps
North America Travel Destinations Template for PowerPoint & Google Slides
World Maps
Azerbaijan Map with Provinces & Callouts Template for PowerPoint & Google Slides
World Maps
Germany Map with Regional Callouts Template for PowerPoint & Google Slides
World Maps
4-Step 3D Pyramid Diagram with Callouts template for PowerPoint & Google Slides
Pyramid
Mobile Mockup with Social Callouts Template for PowerPoint & Google Slides
Software Development
Target Marketing Infographic Callouts Template for PowerPoint & Google Slides
Circular
Photo Personal SWOT Analysis Callouts Template for PowerPoint & Google Slides
SWOT
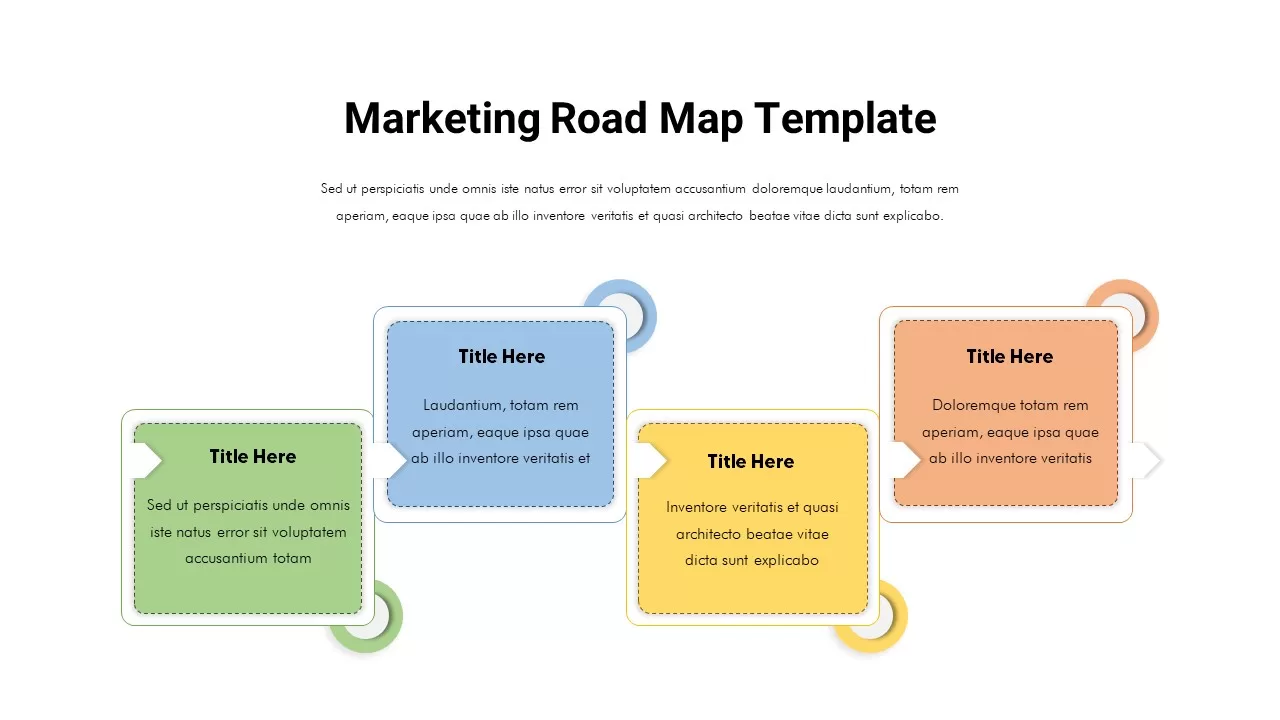
Marketing Roadmap with Four Callouts Template for PowerPoint & Google Slides
Roadmap
iPhone 14 Feature Callouts Mockup Slide Template for PowerPoint & Google Slides
Graphics

North Korea Map with Provinces Infographic Pack Template for PowerPoint & Google Slides
Maps
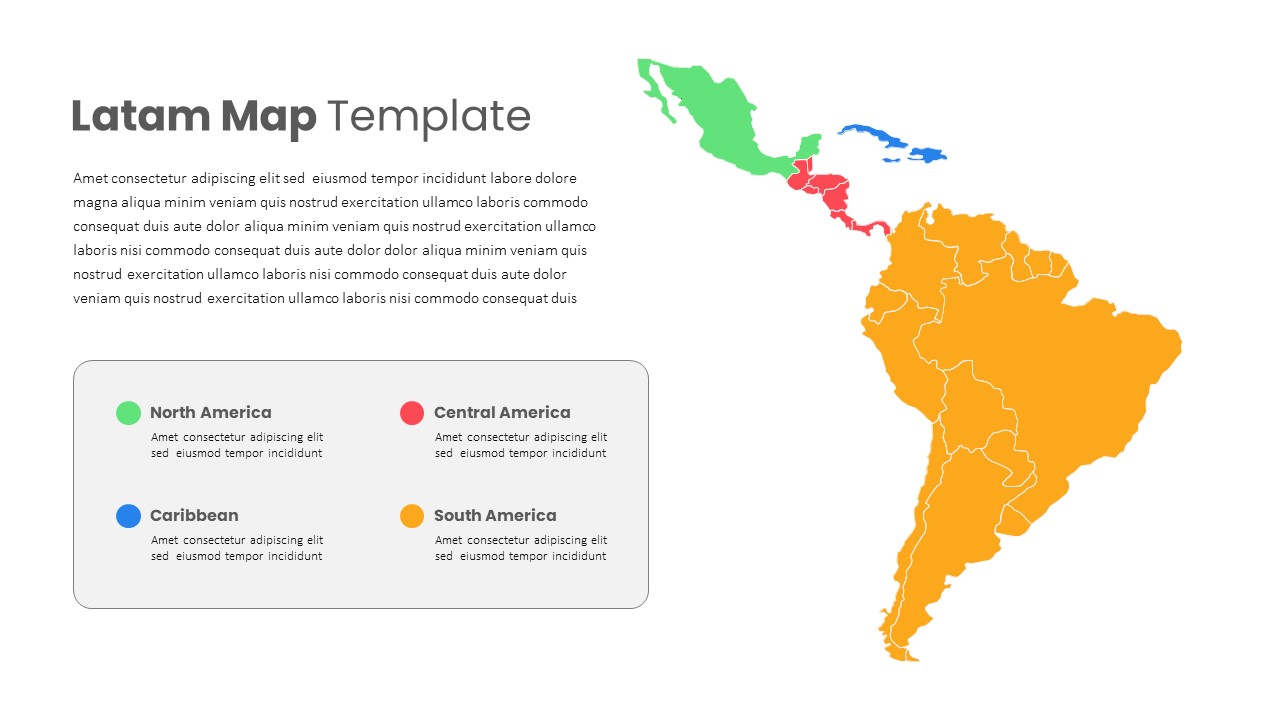
Latin America Regional Map Breakdown Template for PowerPoint & Google Slides
World Maps
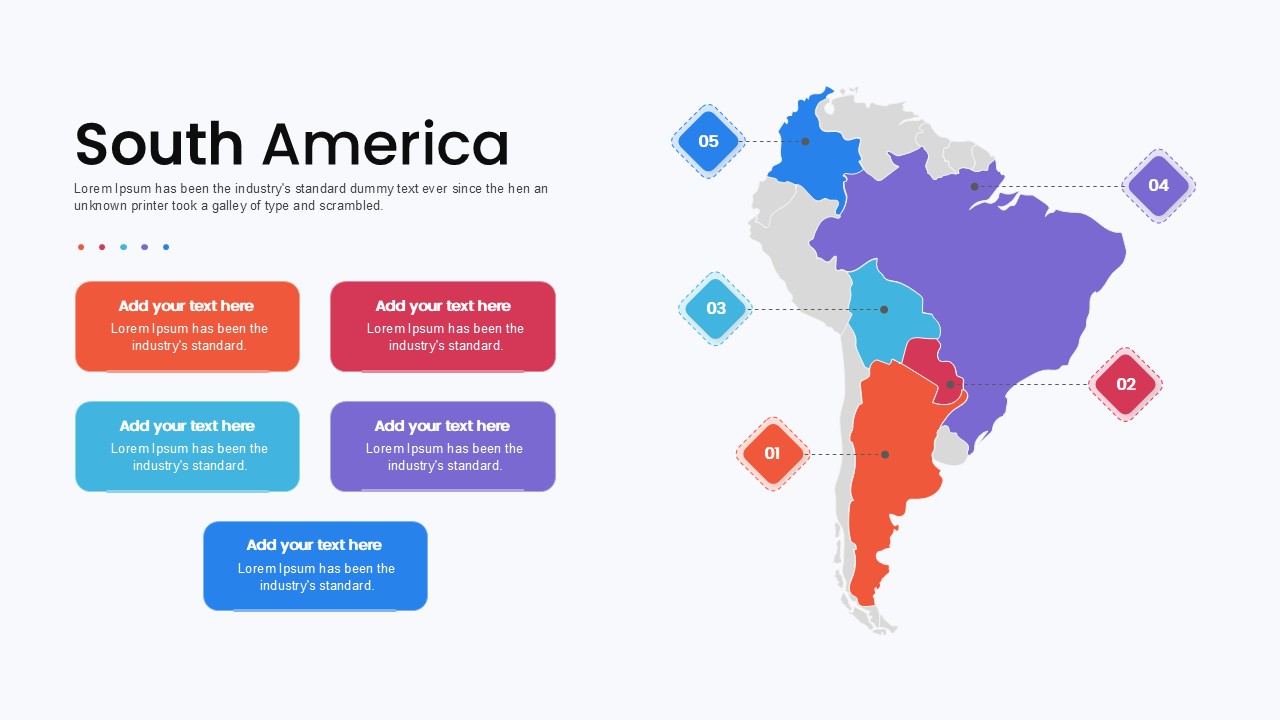
South America Map template for PowerPoint & Google Slides
Maps
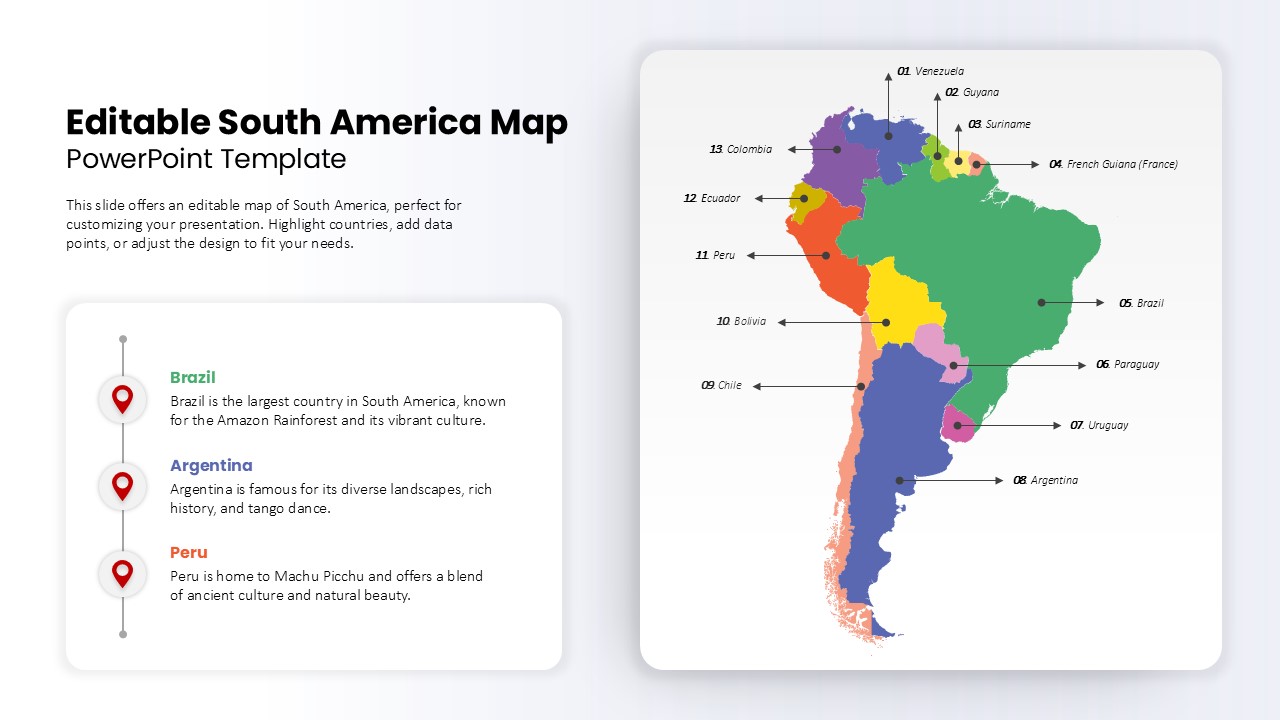
Editable South America Map Diagram Template for PowerPoint & Google Slides
Maps
North Star template for PowerPoint & Google Slides
Business
World Map Data template for PowerPoint & Google Slides
World Maps
Interactive US Population Data Map Slide Template for PowerPoint & Google Slides
World Maps
Editable Africa Map Infographic Data Template for PowerPoint & Google Slides
World Maps
UK Counties Map Data Visualization Template for PowerPoint & Google Slides
World Maps
Syria Regional Data Map Infographic Template for PowerPoint & Google Slides
World Maps
AI and Data Ecosystem Map Template for PowerPoint & Google Slides
AI
Data Science PowerPoint Presentation Template for PowerPoint & Google Slides
Pitch Deck
Data Center PowerPoint Template for PowerPoint & Google Slides
Information Technology

Creative data chart analytics template for PowerPoint & Google Slides
Charts
Mobile Data Analysis Chart template for PowerPoint & Google Slides
Charts
Circle Chart Data template for PowerPoint & Google Slides
Pie/Donut
Creative Data Analysis Bar Chart template for PowerPoint & Google Slides
Bar/Column

Smartphone Data User template for PowerPoint & Google Slides
Charts
3D Bar Chart Data Infographics Template for PowerPoint & Google Slides
Bar/Column
3D Stacked Infographic Layers Data Template for PowerPoint & Google Slides
Pyramid
Circle Graph Data Visualization Template for PowerPoint & Google Slides
Circular
Pencil Bar Chart Data Analysis Template for PowerPoint & Google Slides
Bar/Column
3D Cone Chart Data Visualization template for PowerPoint & Google Slides
Bar/Column
Creative Lab Beakers Data Infographic template for PowerPoint & Google Slides
Infographics
Dynamic Data Dashboard Infographic Template for PowerPoint & Google Slides
Bar/Column
Data Analytics Dashboard Design template for PowerPoint & Google Slides
Bar/Column
Gear Pie Diagram Data Visualization Template for PowerPoint & Google Slides
Pie/Donut
Data-Driven Marketing Cycle Diagram Template for PowerPoint & Google Slides
Customer Journey
Tornado Chart Data Comparison Slide Template for PowerPoint & Google Slides
Bar/Column
Bottle Data Percentage Infographic Template for PowerPoint & Google Slides
Infographics
Immigration Data Dashboard Template for PowerPoint & Google Slides
Bar/Column
Leaf Infographic Data Visualization Template for PowerPoint & Google Slides
Infographics
Mobile Infographics Data Visualization Template for PowerPoint & Google Slides
Infographics
Data Management and Analytics Diagram Template for PowerPoint & Google Slides
Circular
Data Migration Life Cycle Curved Diagram Template for PowerPoint & Google Slides
Process
Medical Infographics Data Visualization Template for PowerPoint & Google Slides
Health
DIKW Data to Wisdom Pyramid Model Template for PowerPoint & Google Slides
Pyramid
Data-driven GDP Growth Infographic Pack Template for PowerPoint & Google Slides
Infographics
KPI Dashboard Data Visualization Template for PowerPoint & Google Slides
Bar/Column
KPI Dashboard Data Overview Slide Template for PowerPoint & Google Slides
Bar/Column
Professional Heatmap Data Visualization Template for PowerPoint & Google Slides
Infographics
Donut Chart Data Breakdown template for PowerPoint & Google Slides
Pie/Donut

Modern Big Data Infographic Deck Template for PowerPoint & Google Slides
Decks
Waffle Chart Data Visualization Template for PowerPoint & Google Slides
Comparison Chart
Layered Data Governance Maturity Model Template for PowerPoint & Google Slides
Process
Free Stacked Column Chart Data Visualization Template for PowerPoint & Google Slides
Bar/Column
Free
Simple Bar Chart Data Visualization Template for PowerPoint & Google Slides
Bar/Column
XY Bubble Chart Data Visualization Template for PowerPoint & Google Slides
Comparison Chart
Simple Area Chart Data Trends Analysis Template for PowerPoint & Google Slides
Comparison Chart
Data Over Time Line Chart template for PowerPoint & Google Slides
Charts
Waterfall Chart Data Visualization Template for PowerPoint & Google Slides
Comparison Chart
Multipurpose Spline Chart Data Trend Template for PowerPoint & Google Slides
Bar/Column
Advanced Data Flow Diagram Pack Template for PowerPoint & Google Slides
Flow Charts
Interactive Jump Line Data Chart Template for PowerPoint & Google Slides
Comparison Chart
Segmented Scatter Chart Data Visualization Template for PowerPoint & Google Slides
Business Strategy
Free Big Data Network Visualization Template for PowerPoint & Google Slides
Circular
Free
Data Analysis Bar Chart with Insights Template for PowerPoint & Google Slides
Bar/Column
Free
Data Lake Hub-and-Spoke Diagram Template for PowerPoint & Google Slides
Cloud Computing
ETL Data Pipeline Workflow Diagram Template for PowerPoint & Google Slides
Process
Data Privacy template for PowerPoint & Google Slides
Information Technology
Data Protection Strategies template for PowerPoint & Google Slides
Information Technology
Comprehensive Data & AI Capability Model Template for PowerPoint & Google Slides
AI
Data Flywheel Strategy template for PowerPoint & Google Slides
Business
Data Privacy and Compliance in ML template for PowerPoint & Google Slides
Technology
Data-Driven AI in Insurance Infographic Template for PowerPoint & Google Slides
Circular
Data Studio Insights template for PowerPoint & Google Slides
Business Report
Data Protection & Encryption in the Cloud Overview template for PowerPoint & Google Slides
Cloud Computing
Customer Data Platform Workflow Diagram Template for PowerPoint & Google Slides
Information Technology
Data-Driven Marketing Lifecycle Diagram Template for PowerPoint & Google Slides
Process
Data-Driven Decision Making overview template for PowerPoint & Google Slides
Business
First Party Data Overview Template for PowerPoint & Google Slides
Business
Data Governance Roles Pyramid Diagram Template for PowerPoint & Google Slides
Pyramid
Business Data Table Template for PowerPoint & Google Slides
Table
Colorful Business Data Comparison Table Template for PowerPoint & Google Slides
Table
Six Column Data Table Template for PowerPoint & Google Slides
Table
Data Gap Analysis Template for PowerPoint & Google Slides
Business
Mobile User Data Analysis Infographic for PowerPoint & Google Slides
Process
Bar Data Chart Slide for PowerPoint & Google Slides
Bar/Column
Weekly Data Chart Slide for PowerPoint & Google Slides
Comparison Chart

3D Column Chart with Data Table for PowerPoint & Google Slides
Bar/Column

Cone Data Chart for PowerPoint & Google Slides
Charts
4 Business Data Infographics Diagram for PowerPoint & Google Slides
Process
Data-Driven Line Chart Diagram Template for PowerPoint
Comparison Chart
Clustered Column Chart Data Analysis Template for PowerPoint
Bar/Column
Free Data Analytics Dashboard Template for PowerPoint
Charts
Free
Mind Map PowerPoint template for PowerPoint & Google Slides
Mind Maps