Mastodon Metrics Infographic Dashboard Template for PowerPoint & Google Slides


Description
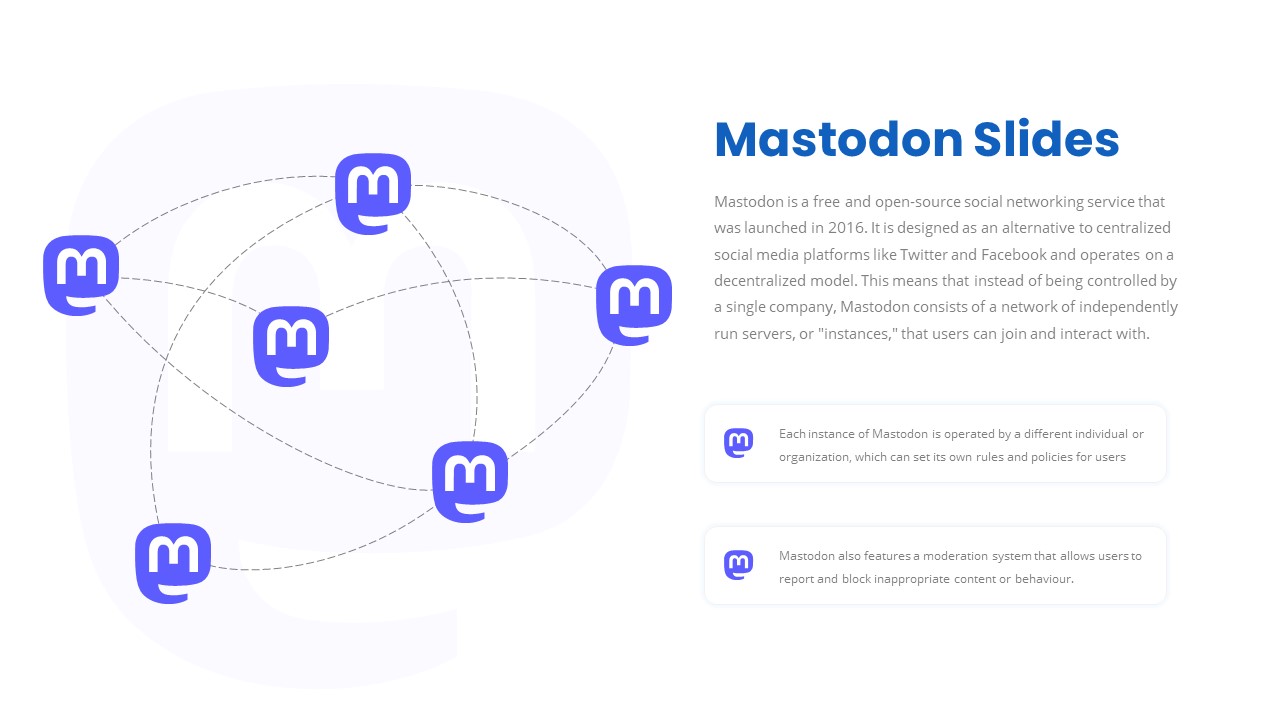
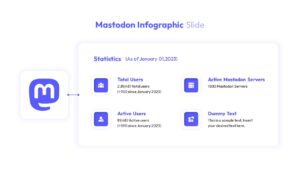
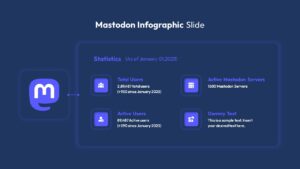
Download and customize this Mastodon infographic dashboard to present total and active user metrics, server counts, and engagement stats in a clean, visual format. The slide features a large Mastodon icon linked to four rounded‐corner statistic cards—Total Users, Active Users, Active Servers, and a customizable text block—each with an icon placeholder and editable data fields. The minimalist white background, crisp blue accents, and subtle drop shadows ensure readability, while master slides and alignment guides let you swap icons, update figures, or adjust layouts in seconds. Fully compatible with both PowerPoint and Google Slides, this template maintains design integrity across devices and simplifies your data presentation.
Who is it for
Social media managers, community organizers, and platform analysts will benefit from this infographic to report Mastodon performance metrics, benchmark growth trends, and support data-driven strategy discussions.
Other Uses
Repurpose this layout for any platform or product metrics—swap icons and labels to display user growth, website KPIs, sales figures, or operational statistics. Adapt cards for competitive benchmarks, quarterly reports, or investor updates.
Login to download this file

Item ID
SB03431
Related Templates

Project Status Dashboard with Metrics Template for PowerPoint & Google Slides
Project Status
DevOps KPI Dashboard Performance Metrics Template for PowerPoint & Google Slides
Software Development
Purchasing KPI Metrics Dashboard Template for PowerPoint & Google Slides
Business Report
Procurement KPI Dashboard & Metrics Template for PowerPoint & Google Slides
Business Report
Employee Performance Metrics Dashboard Template for PowerPoint & Google Slides
Employee Performance
Mastodon Template for PowerPoint & Google Slides
Business
Bubble Head Metrics Infographic Template for PowerPoint & Google Slides
Circular
Circle Segment Sales Metrics Infographic Template for PowerPoint & Google Slides
Circular
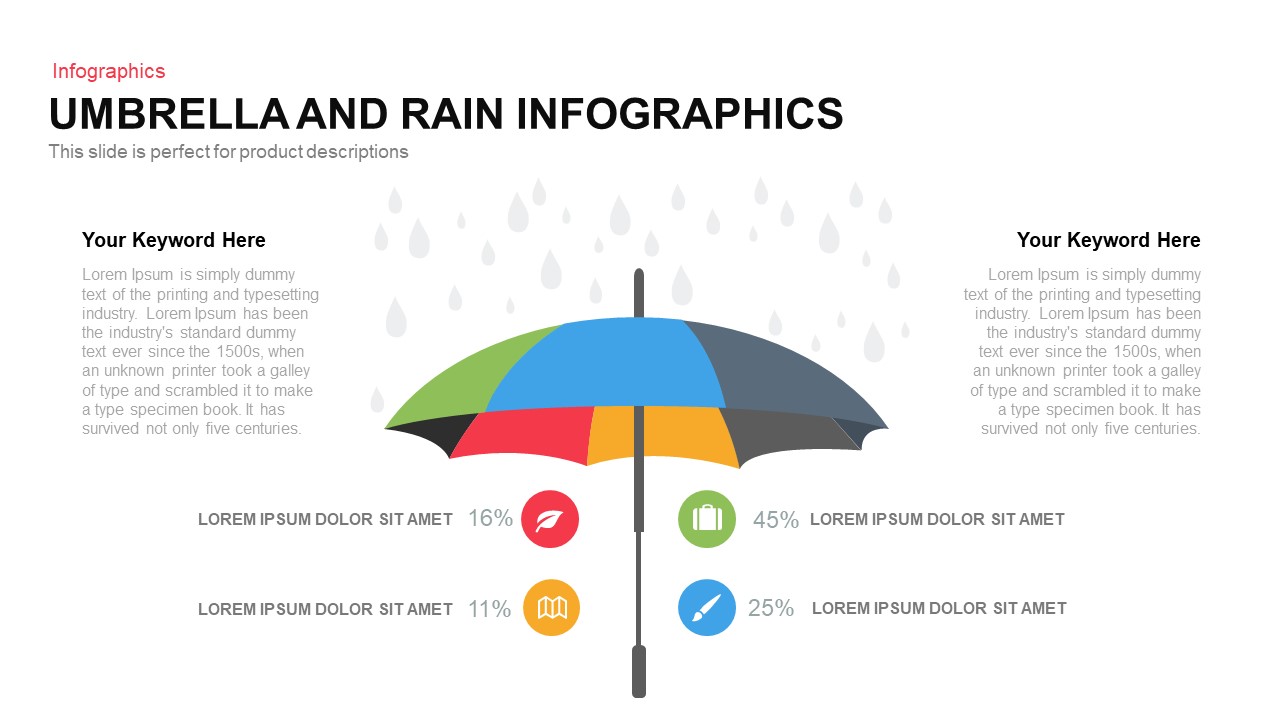
Umbrella and Rain Infographic Metrics Template for PowerPoint & Google Slides
Comparison
Colorful Block Infographic Metrics Slide Template for PowerPoint & Google Slides
Infographics
Statistics & Global Metrics Infographic Template for PowerPoint & Google Slides
Bar/Column
LinkedIn Metrics Infographic Slide Template for PowerPoint & Google Slides
Digital Marketing
Facebook Social Metrics Infographic Template for PowerPoint & Google Slides
Graphics
Instagram Infographic Metrics Slide Template for PowerPoint & Google Slides
Marketing
iPad App Mockup with Progress Metrics Template for PowerPoint & Google Slides
Bar/Column
Asia Map with KPI Metrics and Legend Template for PowerPoint & Google Slides
World Maps
Social Media Metrics template for PowerPoint & Google Slides
Comparison Chart
Mobile Usage Metrics template for PowerPoint & Google Slides
Comparison Chart

Scale Metaphor Metrics Comparison Template for PowerPoint & Google Slides
Charts
Comprehensive Recruitment Metrics Report Template for PowerPoint & Google Slides
Recruitment
Benchmarking Metrics Comparison Slide Template for PowerPoint & Google Slides
Pie/Donut
Circular Image Gallery & KPI Metrics Template for PowerPoint & Google Slides
Pie/Donut
Agriculture Infographics Slide with Progress Rings & Metrics Template for PowerPoint & Google Slides
Pie/Donut
Annual Recurring Revenue Metrics Template for PowerPoint & Google Slides
Bar/Column
Social Media Analysis Metrics Slide Deck Template for PowerPoint & Google Slides
Digital Marketing
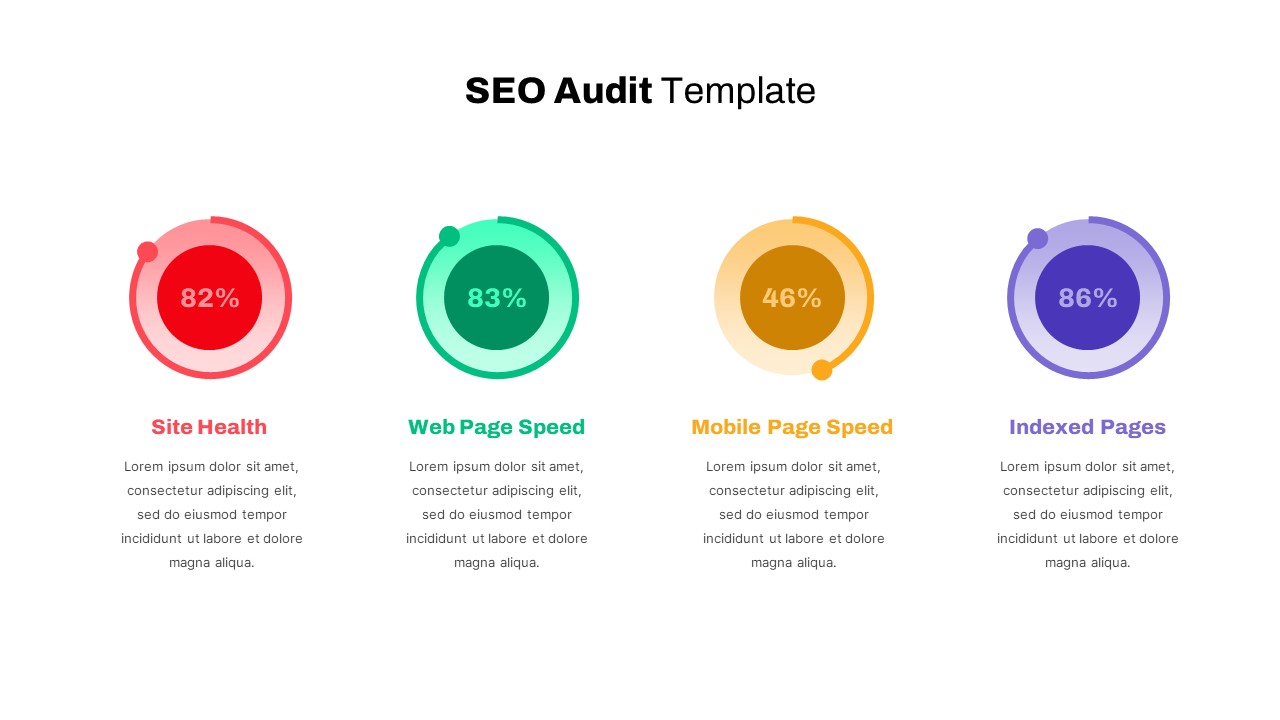
Detailed SEO Audit Metrics Overview Template for PowerPoint & Google Slides
Circular
Free Editable U.S. Map with Regional Metrics Template for PowerPoint & Google Slides
World Maps
Free
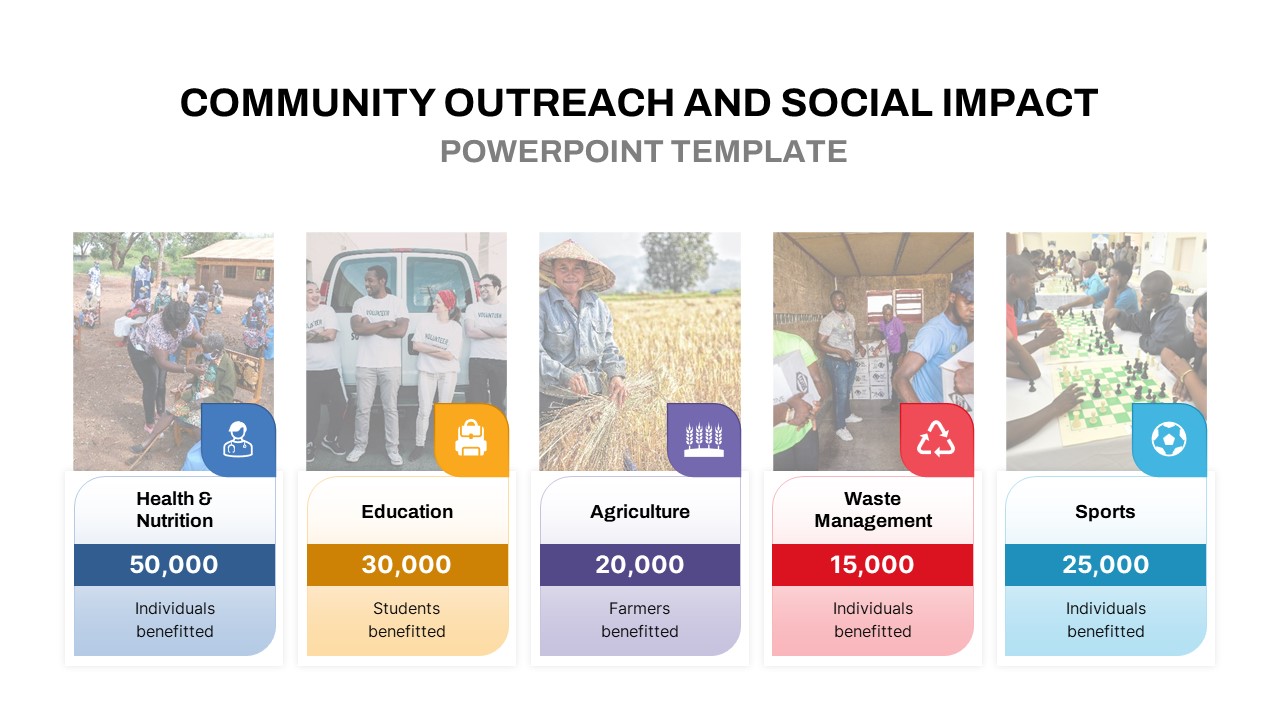
Community Outreach Impact Metrics Template for PowerPoint & Google Slides
Accomplishment
Financial Snapshot & Metrics Overview Template for PowerPoint & Google Slides
Finance
Market Validation Metrics Overview Template for PowerPoint & Google Slides
Business
Pirate Metrics AARRR Funnel Framework Template for PowerPoint & Google Slides
Funnel
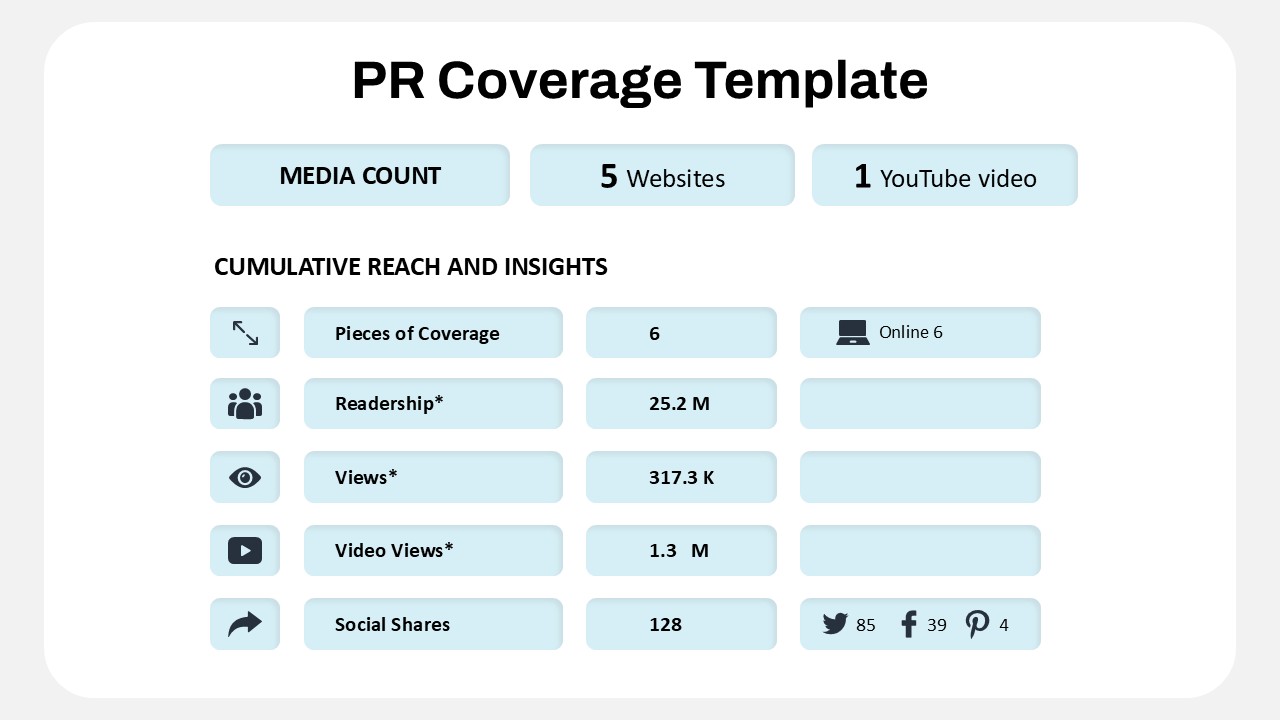
Public Relations Coverage Metrics Template for PowerPoint & Google Slides
Business Report
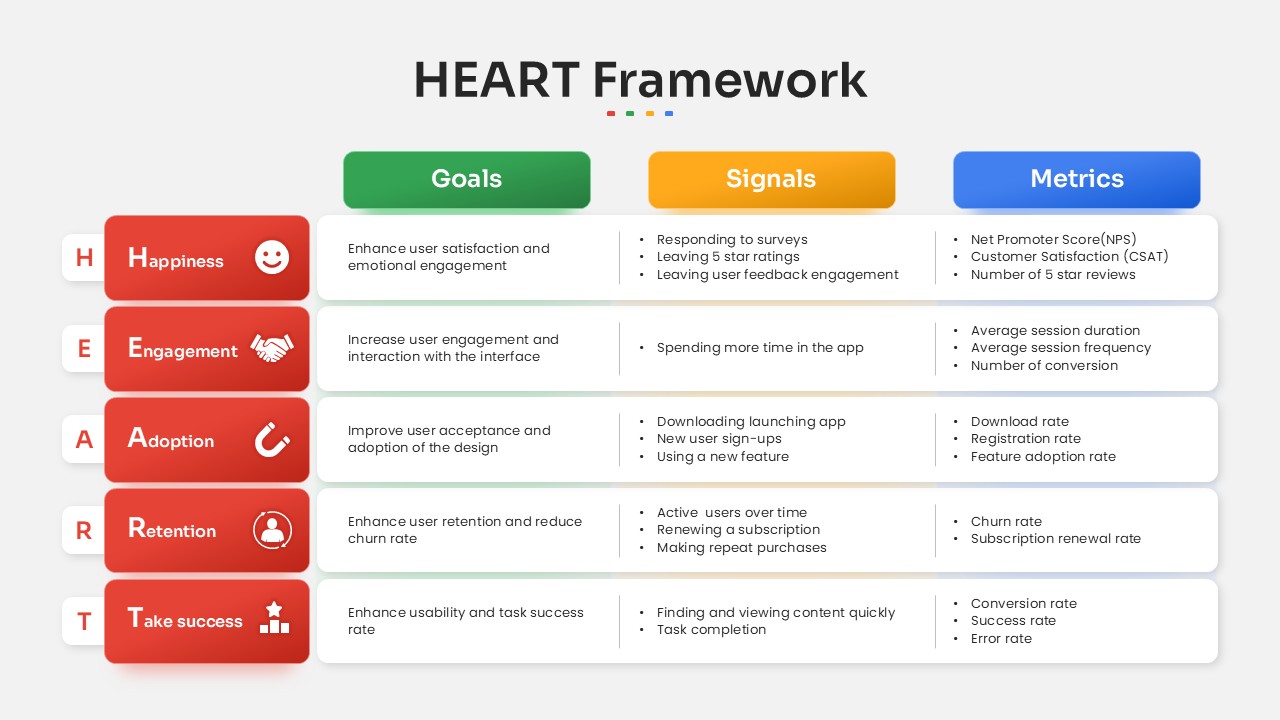
HEART Framework Goals, Signals & Metrics Template for PowerPoint & Google Slides
Process

Dynamic Data Dashboard Infographic Template for PowerPoint & Google Slides
Bar/Column
Professional Nurse Infographic Dashboard Template for PowerPoint & Google Slides
Nursing
Free Metro UI Dashboard Infographic Template for PowerPoint & Google Slides
Business Report
Free
Freight Logistics Dashboard Infographic Template for PowerPoint & Google Slides
Comparison Chart
Free Infographic Statistics Dashboard Slide for PowerPoint & Google Slides
Bar/Column
Free
Free KPI Dashboard PowerPoint Template for PowerPoint & Google Slides
Charts
Free
E-commerce Analytics Dashboard Template for PowerPoint & Google Slides
Bar/Column
Product Usage Analytics Dashboard Chart Template for PowerPoint & Google Slides
Bar/Column
Data Analytics Dashboard Design template for PowerPoint & Google Slides
Bar/Column

Efficiency KPI Dashboard Metaphor Template for PowerPoint & Google Slides
Infographics
Business Dashboard Analytics & KPIs Template for PowerPoint & Google Slides
Bar/Column
Professional Team Efficiency Dashboard Template for PowerPoint & Google Slides
Business Report
Project Management Dashboard Template for PowerPoint & Google Slides
Project
Sales Performance Dashboard template for PowerPoint & Google Slides
Business Report
Immigration Data Dashboard Template for PowerPoint & Google Slides
Bar/Column
Employee Skill Analysis Dashboard Template for PowerPoint & Google Slides
Employee Performance
Sales Growth Dashboard: KPI Gauge & Line Template for PowerPoint & Google Slides
Revenue
Social Media Performance Dashboard Template for PowerPoint & Google Slides
Bar/Column
Performance KPI Dashboard Slide Template for PowerPoint & Google Slides
Business Report
Bull and Bear Stock Market Dashboard Template for PowerPoint & Google Slides
Infographics
KPI Dashboard template for PowerPoint & Google Slides
Business Report
KPI Dashboard Overview template for PowerPoint & Google Slides
Finance
KPI Dashboard Data Visualization Template for PowerPoint & Google Slides
Bar/Column
KPI Dashboard Data Overview Slide Template for PowerPoint & Google Slides
Bar/Column
Interactive Benchmarking Gauge Dashboard Template for PowerPoint & Google Slides
Pie/Donut
Colorful Project Status Dashboard Template for PowerPoint & Google Slides
Project Status
Weekly Update Schedule Dashboard Template for PowerPoint & Google Slides
Agenda
Project Status Dashboard Template for PowerPoint & Google Slides
Project Status
Weekly Status Report Dashboard Template for PowerPoint & Google Slides
HR
Website Performance Monitoring Dashboard Template for PowerPoint & Google Slides
Business Report
One Pager Annual Report Dashboard Template for PowerPoint & Google Slides
Business Report
Social Media Statistics 2023 Dashboard Template for PowerPoint & Google Slides
Comparison
Soccer Match Stats Dashboard Slide Template for PowerPoint & Google Slides
Graphics
Employee Satisfaction Survey Dashboard Template for PowerPoint & Google Slides
Employee Performance
Customer Satisfaction KPI Dashboard Template for PowerPoint & Google Slides
Customer Experience
Weekly Project Status Dashboard Template for PowerPoint & Google Slides
Project Status
Free Quarterly Business Review Dashboard Template for PowerPoint & Google Slides
Business
Free
Cost Cutting Savings Dashboard Template for PowerPoint & Google Slides
Pie/Donut
Macroeconomic Indicators Dashboard Template for PowerPoint & Google Slides
PEST
Free Monthly Report PowerPoint Template for PowerPoint & Google Slides
Business Report
Free
Quarterly Financial Summary Dashboard Template for PowerPoint & Google Slides
Business Report
Banking Financial Overview Dashboard Template for PowerPoint & Google Slides
Finance
Quarterly Business Review Dashboard Template for PowerPoint & Google Slides
Pitch Deck
Monthly Business Review Dashboard Deck Template for PowerPoint & Google Slides
Business Report
Project Progress Dashboard Pie Charts Template for PowerPoint & Google Slides
Project
Monthly Sales Performance Dashboard Template for PowerPoint & Google Slides
Charts
HR Report Dashboard Template for PowerPoint & Google Slides
Employee Performance
Budget Forecast Dashboard & Donut Charts Template for PowerPoint & Google Slides
Pie/Donut
Risk Level Gauge Comparison Dashboard Template for PowerPoint & Google Slides
Comparison
Inventory Management Dashboard Template for PowerPoint & Google Slides
Process
Digital Marketing KPIs Dashboard Dark Template for PowerPoint & Google Slides
Business Report
Turnover Analysis Dashboard Template for PowerPoint & Google Slides
Employee Performance
Project Tracking Dashboard Table Template for PowerPoint & Google Slides
Project Status
Action Items Management Dashboard Table Template for PowerPoint & Google Slides
Project Status
Electronic Health Records Dashboard template for PowerPoint & Google Slides
Health
Customer Interview Insights Dashboard Template for PowerPoint & Google Slides
Customer Experience
Project Status Dashboard Report Template for PowerPoint & Google Slides
Project Status
Project Status Update Dashboard Table Template for PowerPoint & Google Slides
Project Status
Cohort Analysis Retention Dashboard Template for PowerPoint & Google Slides
Comparison Chart
Project Status Dashboard Template for PowerPoint & Google Slides
Project Status
Dashboard Project Status Template for PowerPoint & Google Slides
Project Status
Project Status Template Dashboard with Gauge for PowerPoint & Google Slides
Project Status
Task Completion Rate Dashboard Template for PowerPoint & Google Slides
Business
Project Status Dashboard with RAG Legend Template for PowerPoint & Google Slides
Project Status
End of Year Review Dashboard Template for PowerPoint & Google Slides
Business Report
Construction Project Dashboard Template for PowerPoint & Google Slides
Project

Employee Headcount Dashboard Report Template for PowerPoint & Google Slides
Employee Performance