Market Share Comparison Diagram Template for PowerPoint & Google Slides


Description
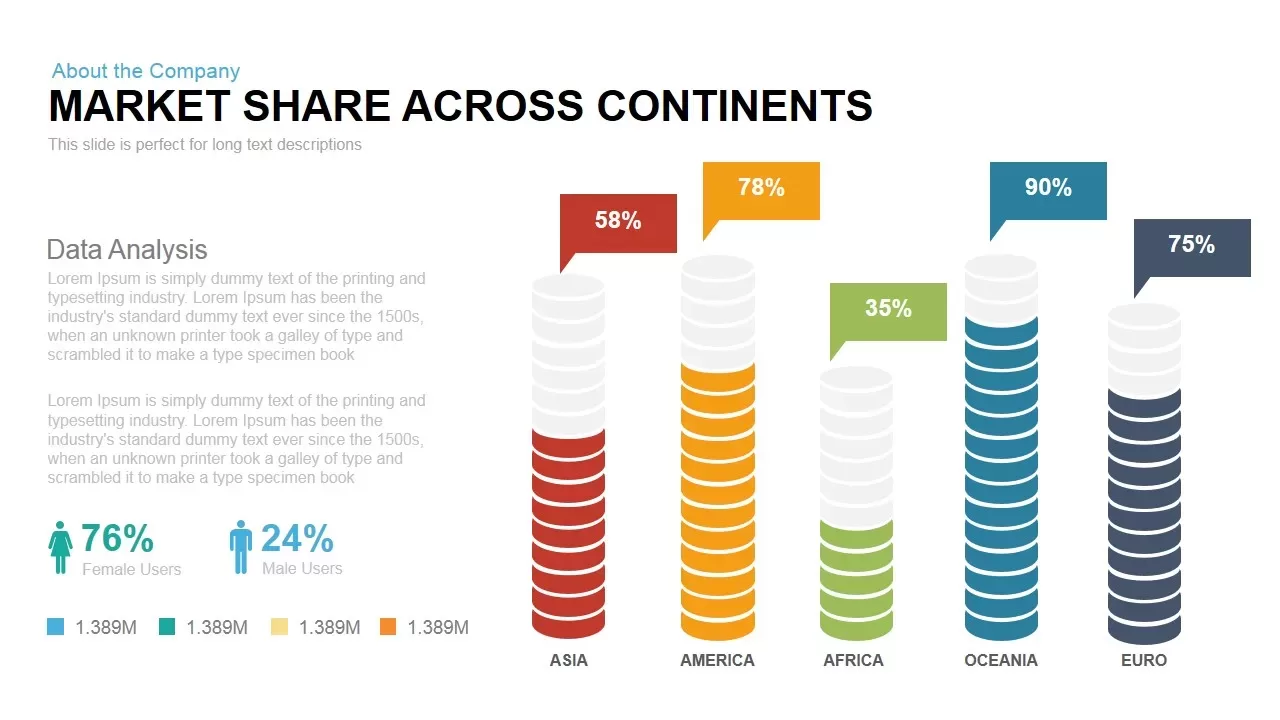
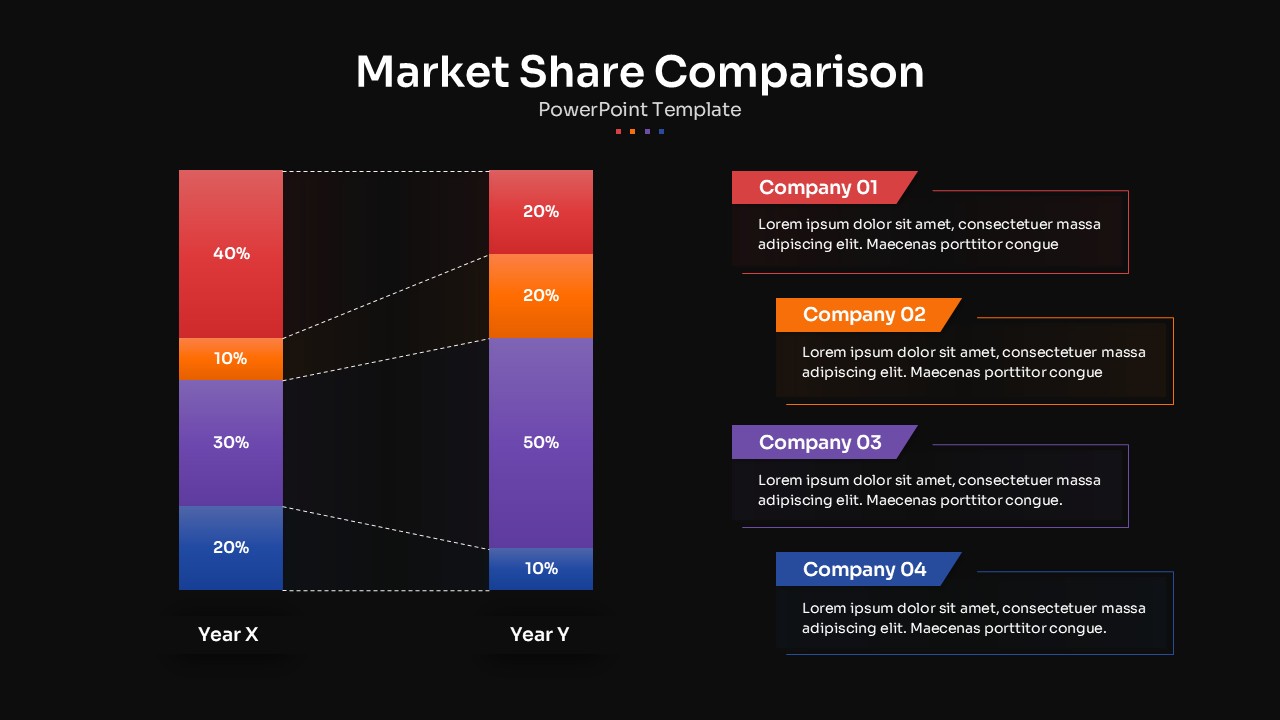
Use this Market Share Comparison diagram slide to showcase year-over-year shifts in market leadership across four companies. Two stacked bar charts—Year X and Year Y—are color-coded in red, orange, purple, and blue segments, each labeled with percentage values and linked by dashed connectors to highlight gains and losses. On the right, matching callout panels identify Company 01 through Company 04 and provide space for concise insights or strategic commentary. The clean white background, subtle drop shadows, and bold headers ensure your data stands out with professional clarity.
Editable vector shapes, text placeholders, and color fills let you update percentages, swap company names, or adjust hues to align with your brand palette. Master-slide integration guarantees consistent typography and spacing across your deck, while intuitive alignment guides speed up layout adjustments. Duplicate the slide to compare additional time periods or segment categories, or combine it with KPI dashboards and trend charts for a comprehensive analytics presentation.
Who is it for
Product managers, marketing analysts, sales directors, and executive teams seeking a clear, data-driven way to communicate market share dynamics and competitive positioning.
Other Uses
Repurpose this slide for sales territory comparisons, customer segment shifts, budget allocation changes, or any scenario where you need to illustrate percentage-based changes across categories.
Login to download this file

Item ID
SB04828
Related Templates

Global Market Share Cylinder Chart Template for PowerPoint & Google Slides
Bar/Column
Social Media Market Share Pie Charts Template for PowerPoint & Google Slides
Pie/Donut
Car Sales Market Share Pie Chart Template for PowerPoint & Google Slides
BCG
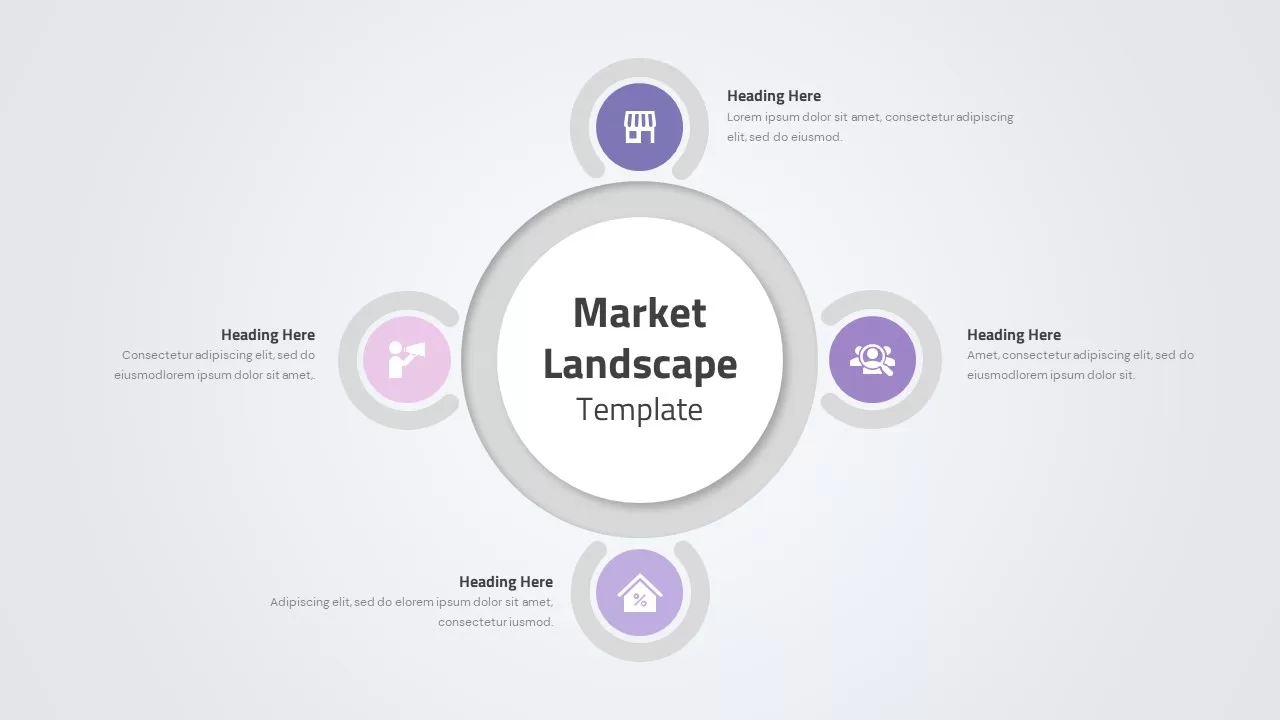
Market Landscape Hub and Spoke Diagram Template for PowerPoint & Google Slides
Infographics
Four Section Comparison Chart Diagram Template for PowerPoint & Google Slides
Infographics

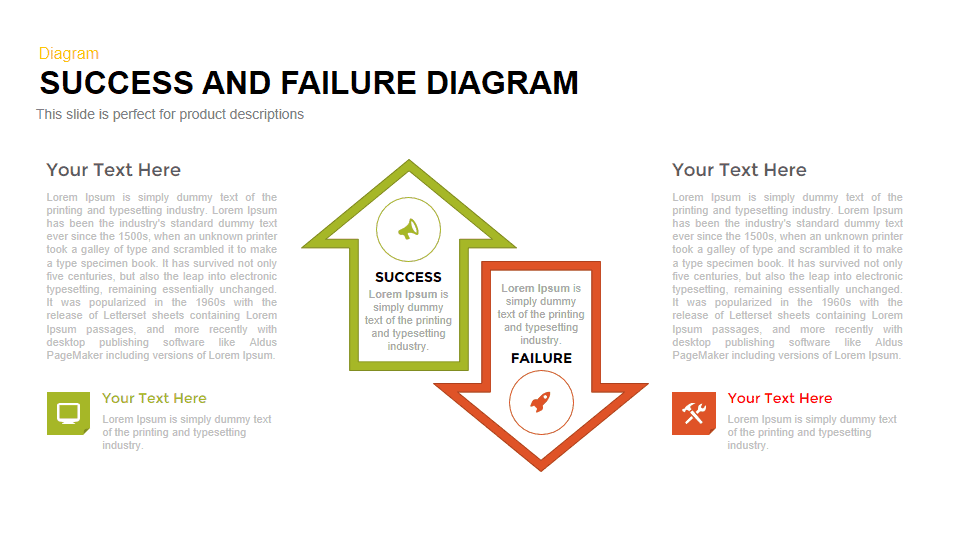
Success vs Failure Comparison Diagram Template for PowerPoint & Google Slides
Comparison
Four Business Structure Types Comparison Diagram Template for PowerPoint & Google Slides
Business Strategy

Isometric 3D Block Comparison Diagram Template for PowerPoint & Google Slides
Comparison
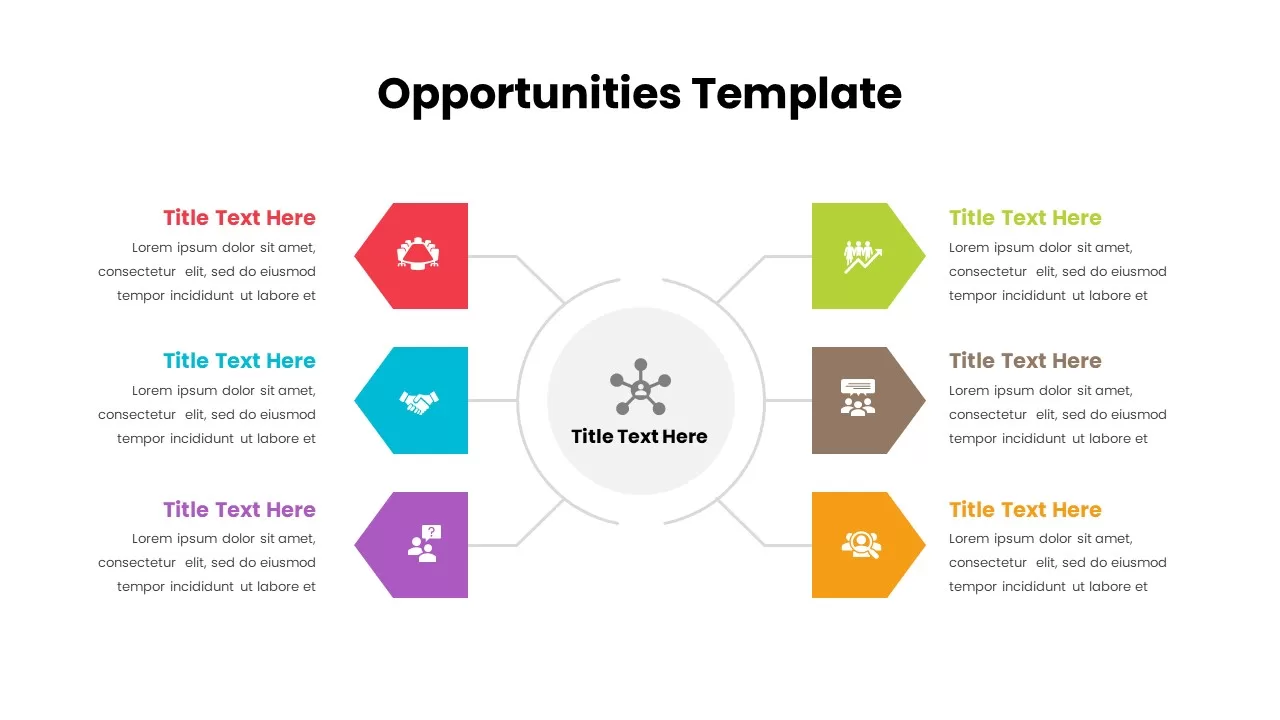
Opportunities Hub-and-Spoke Comparison Diagram Template for PowerPoint & Google Slides
Opportunities Challenges
Integrative Thinking Comparison Diagram Template for PowerPoint & Google Slides
Comparison
Two-Sided Coin Comparison Diagram Template for PowerPoint & Google Slides
Comparison
Attribution Models Comparison Diagram Template for PowerPoint & Google Slides
Comparison
Operating Channels Comparison Diagram Template for PowerPoint & Google Slides
Business Models
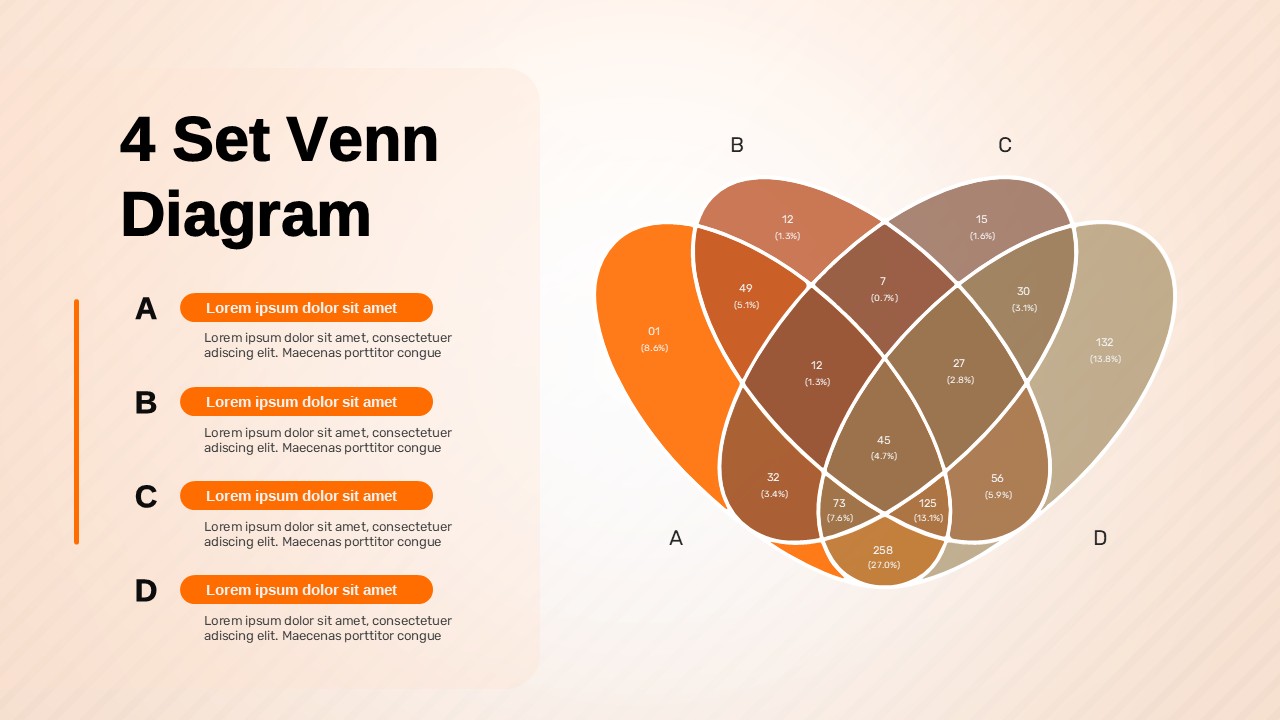
4 Set Venn Diagram Comparison Template for PowerPoint & Google Slides
Comparison

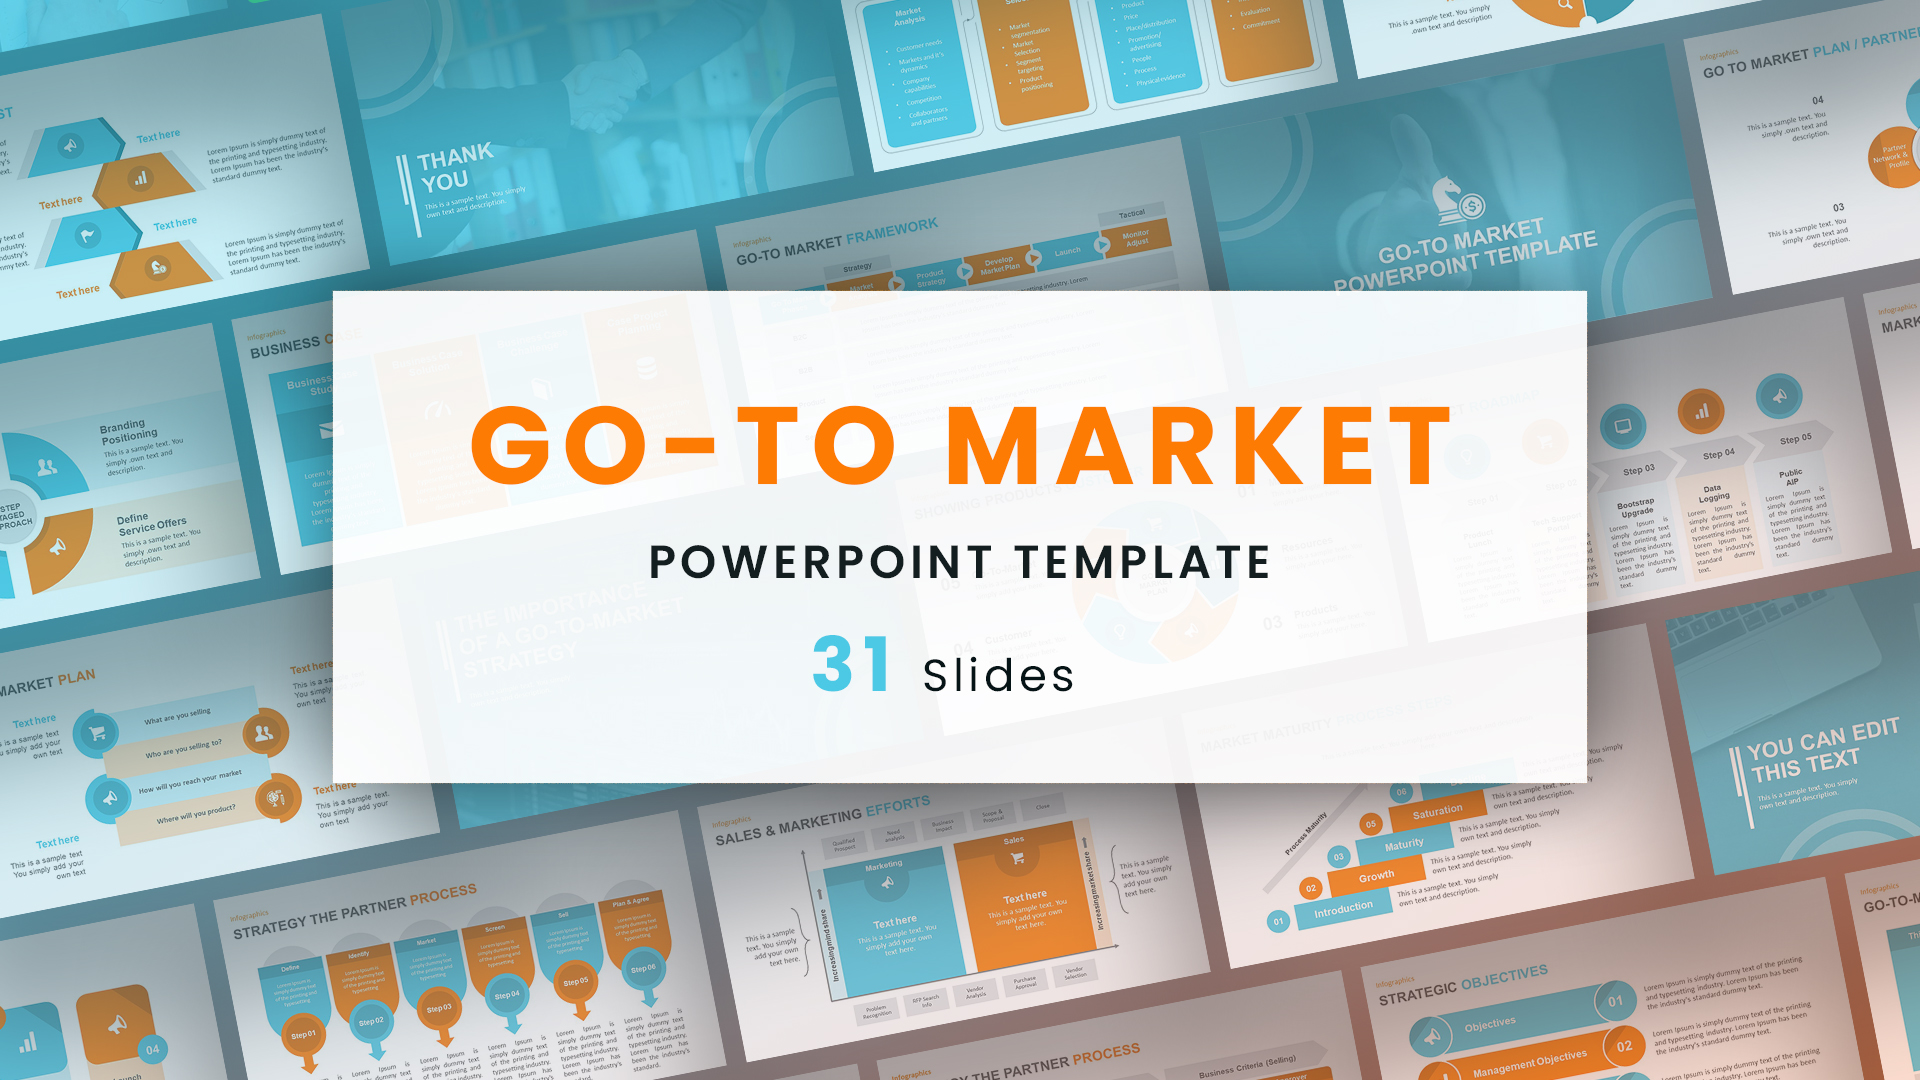
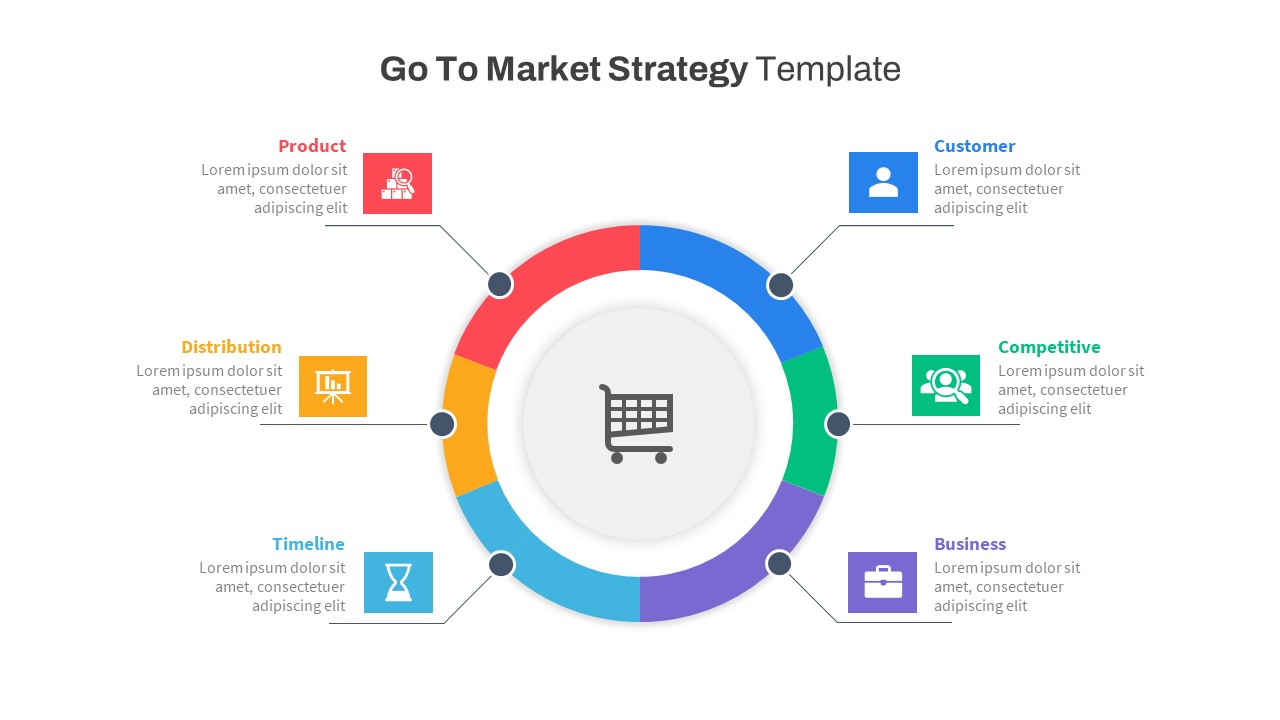
Go-to-Market Strategy PowerPoint Template for PowerPoint & Google Slides
Marketing
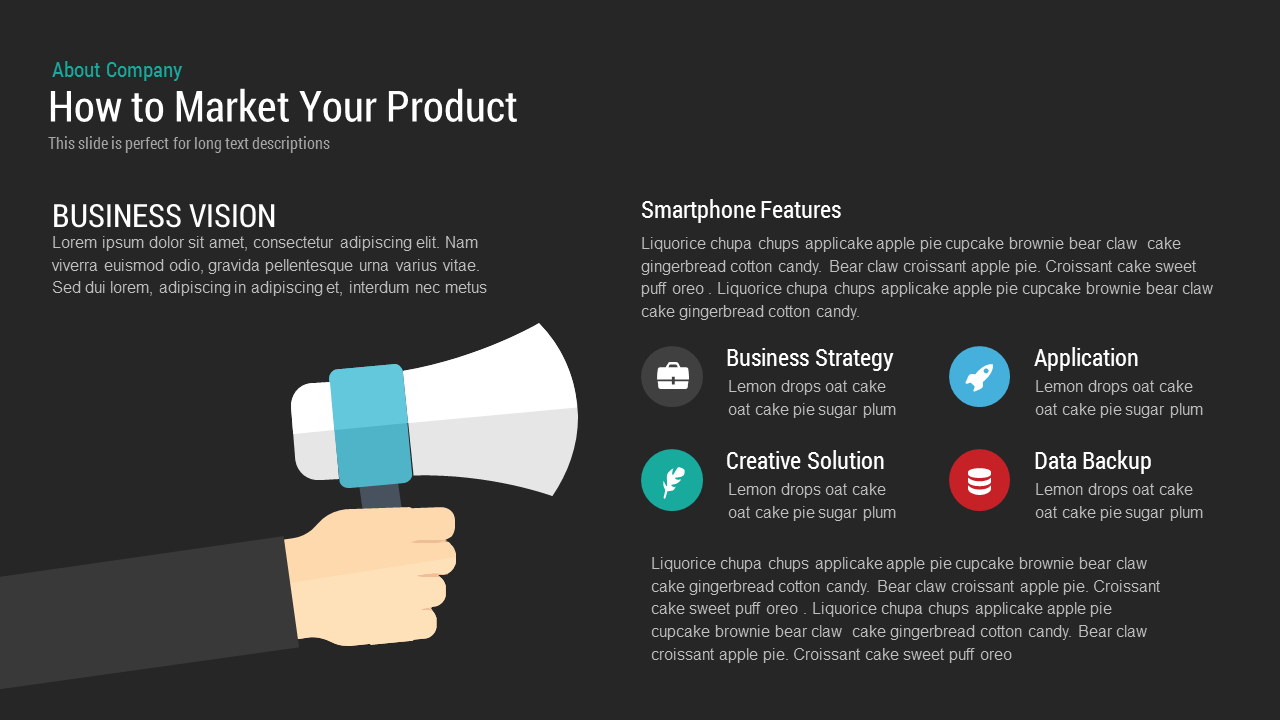
How to Market Your Product template for PowerPoint & Google Slides
Business Strategy
Free
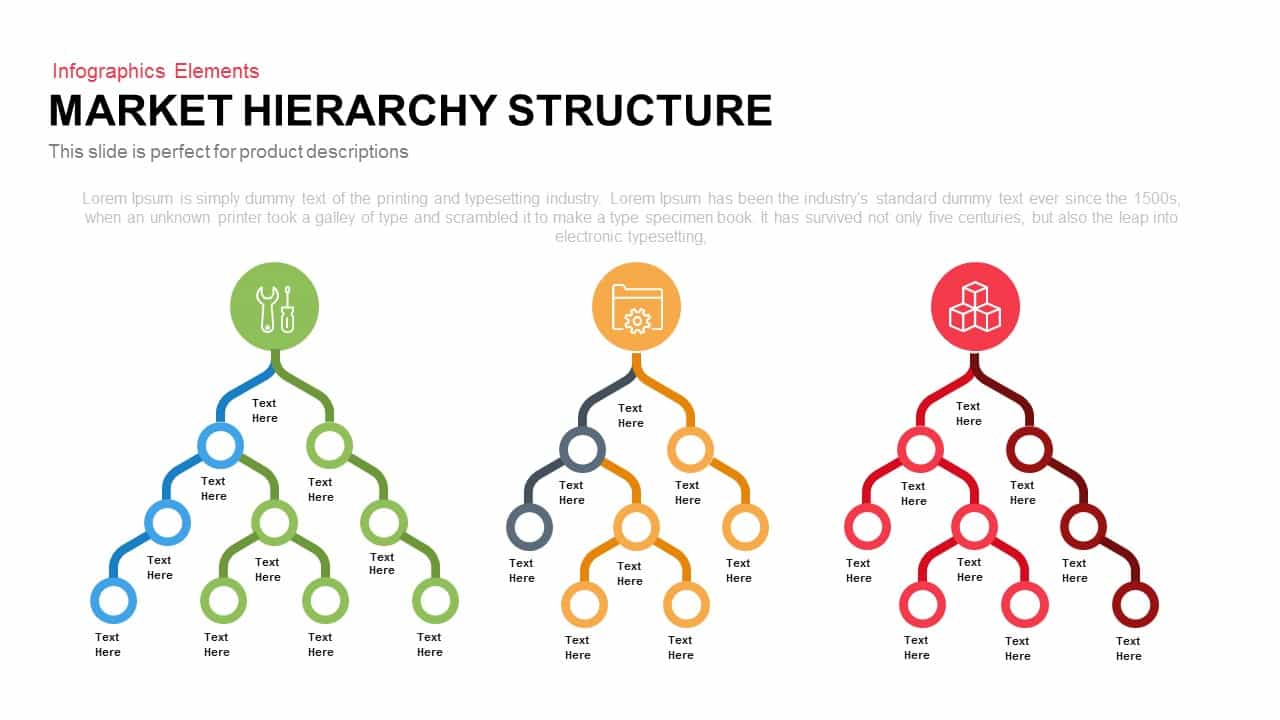
Market Hierarchy Structure Infographic template for PowerPoint & Google Slides
Org Chart
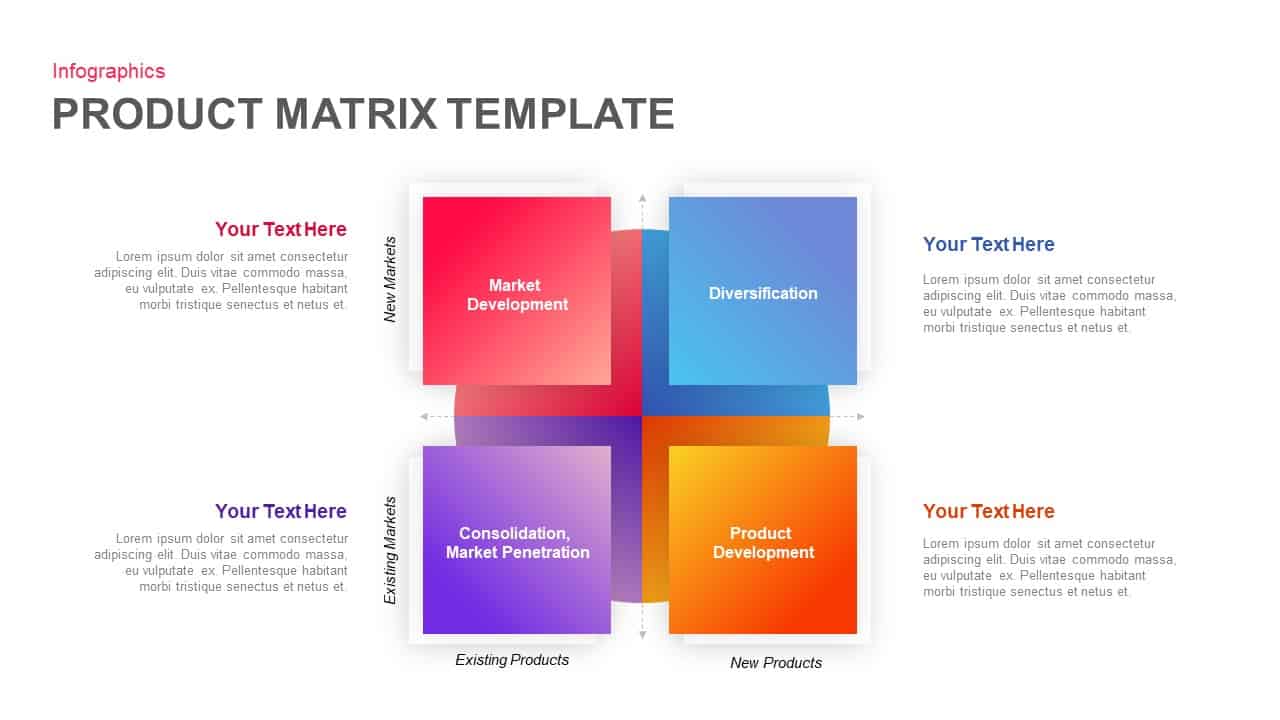
Market Development Matrix Chart Template for PowerPoint & Google Slides
Comparison Chart
Product Market Expansion Matrix Template for PowerPoint & Google Slides
Business
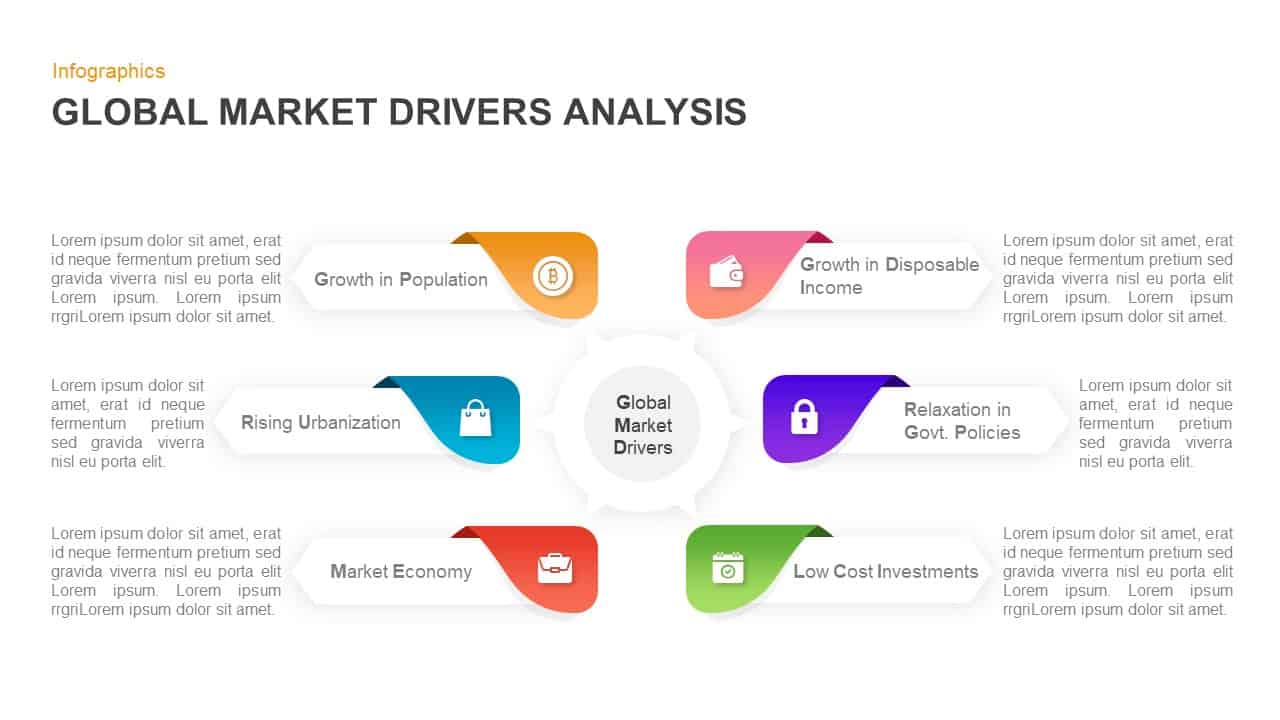
Circular Market Drivers Infographic Template for PowerPoint & Google Slides
Circular
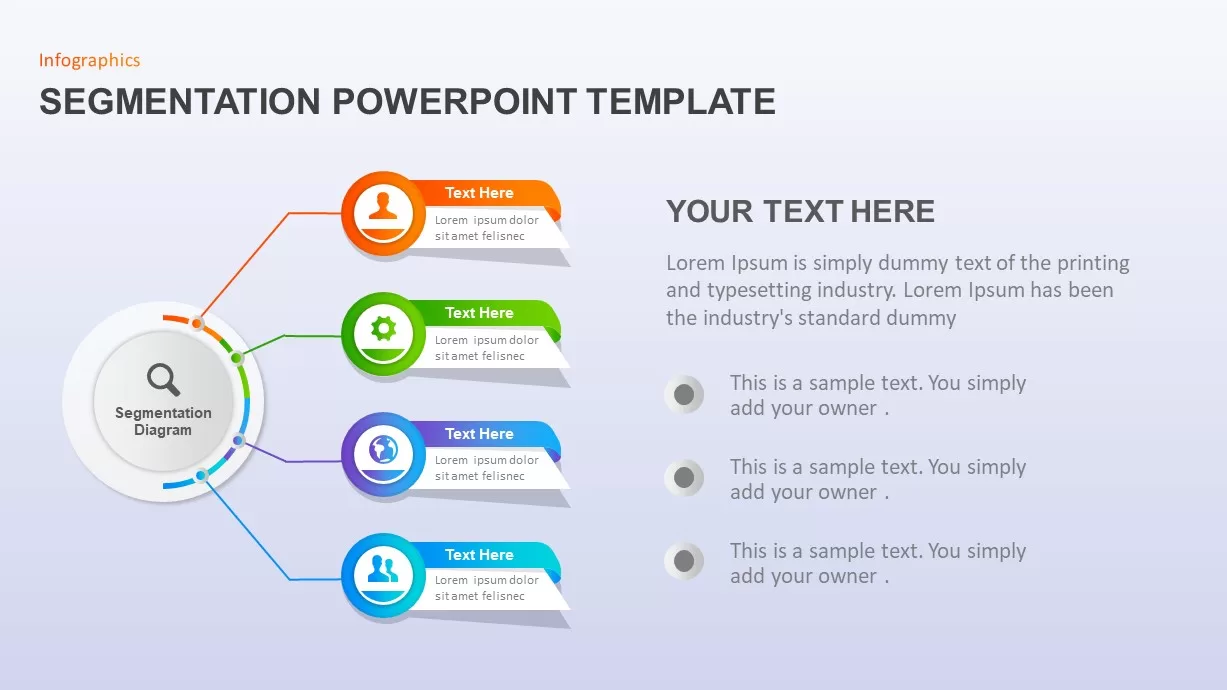
Market Segmentation & STP Infographics Pack Template for PowerPoint & Google Slides
Marketing
Business Case Deck with Market Analysis Template for PowerPoint & Google Slides
Business Report
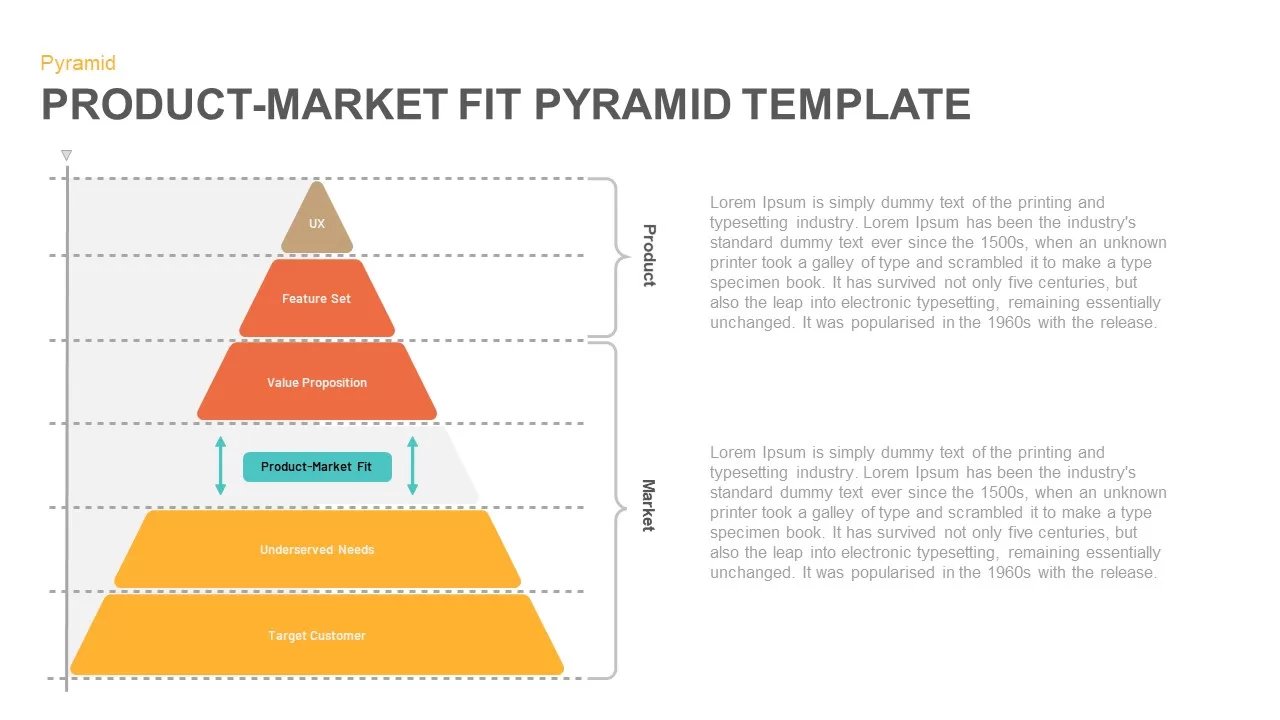
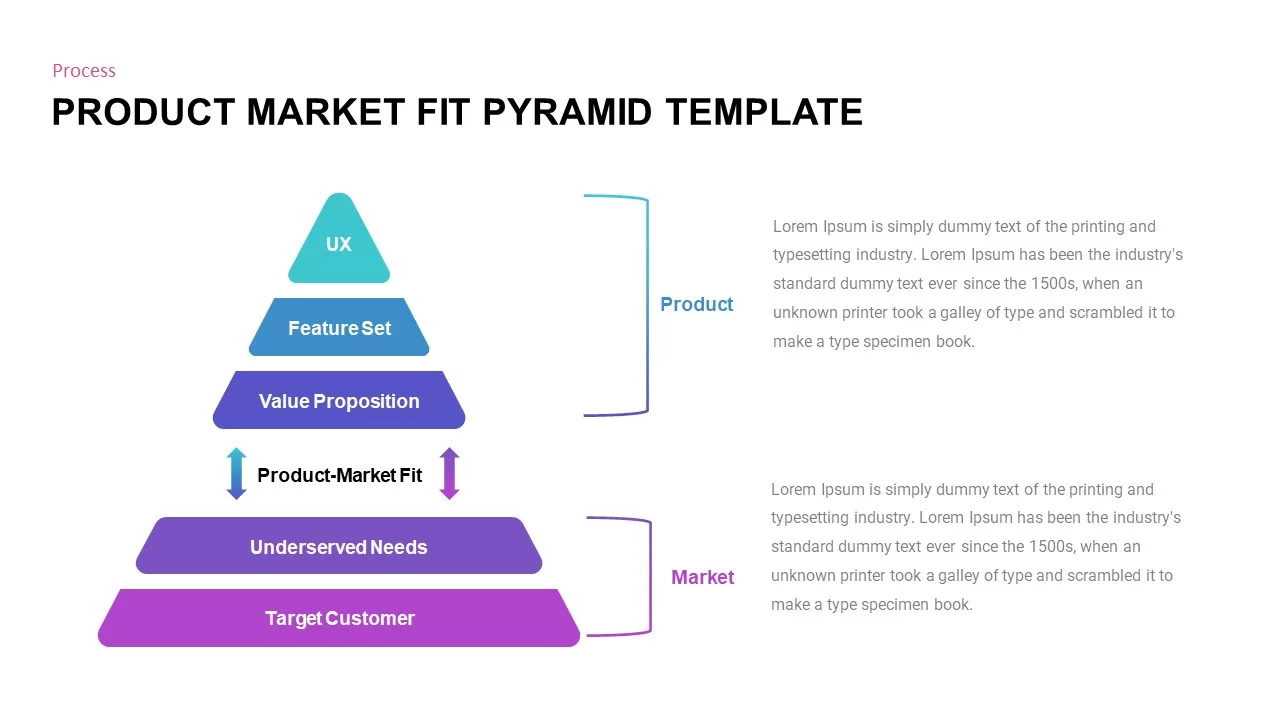
Product-Market Fit Pyramid template for PowerPoint & Google Slides
Pyramid
Professional Product Market Fit Pyramid Template for PowerPoint & Google Slides
Pyramid
Business Review Deck with Market Updates Template for PowerPoint & Google Slides
Company Profile
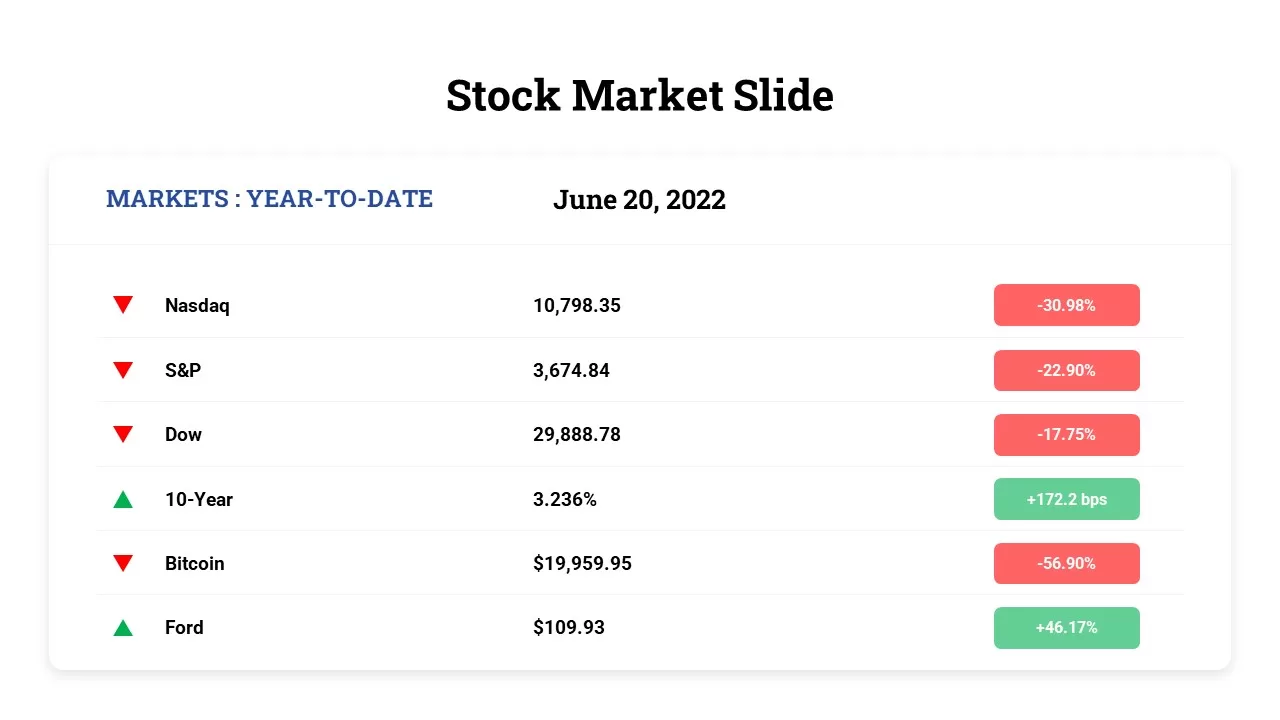
Free Stock Market Performance Overview template for PowerPoint & Google Slides
Finance
Free
Bull and Bear Stock Market Dashboard Template for PowerPoint & Google Slides
Infographics
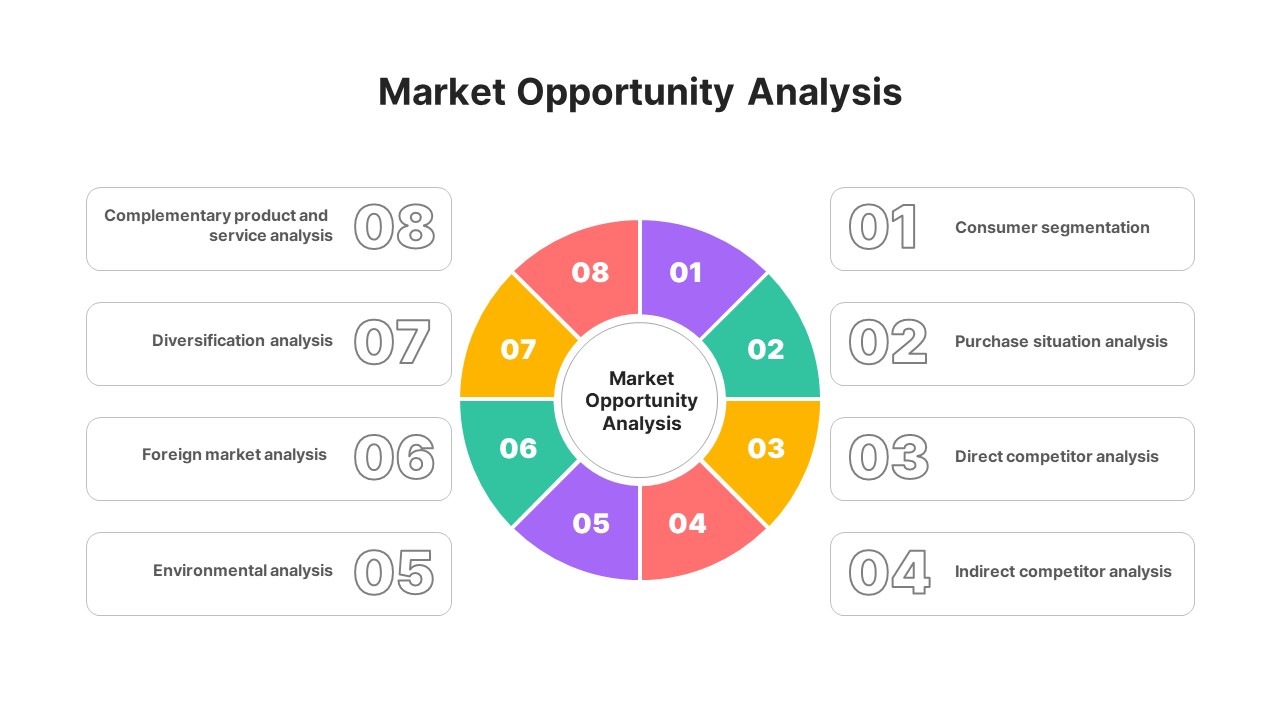
Market Opportunity Analysis Wheel template for PowerPoint & Google Slides
Business Strategy
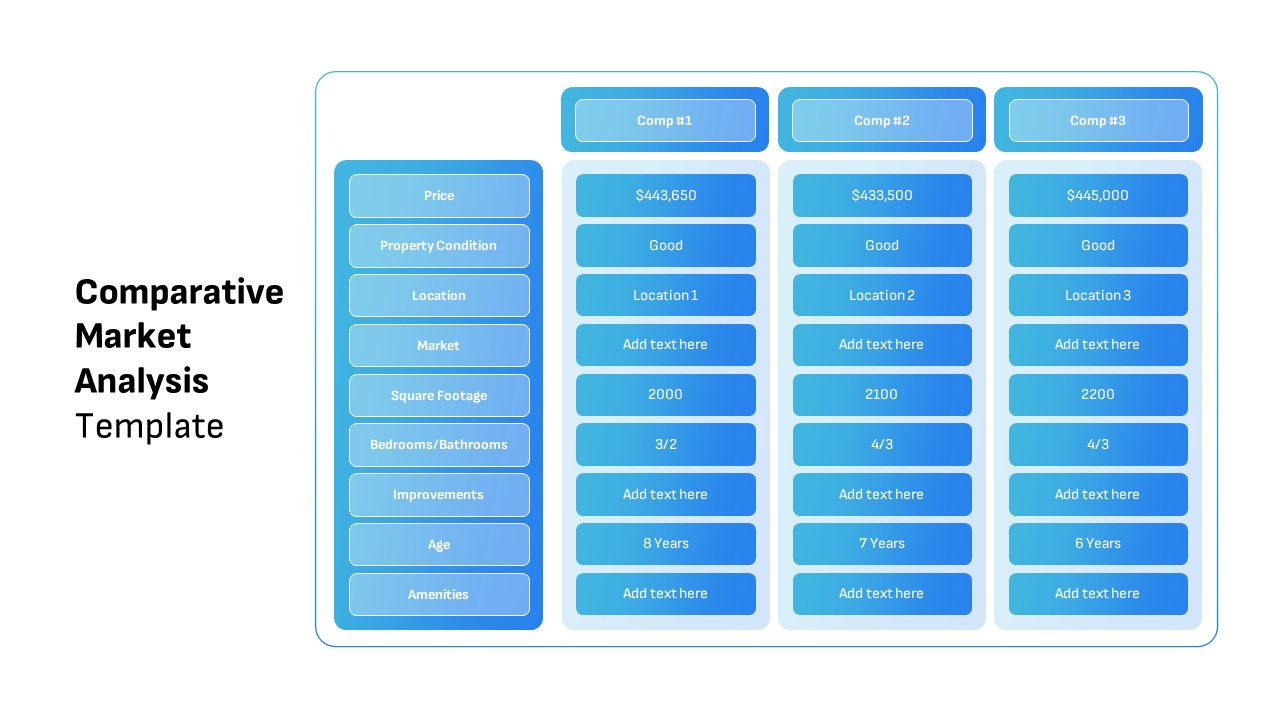
Comparative Market Analysis Template for PowerPoint & Google Slides
Comparison
Free Global Market Distribution Map Template for PowerPoint & Google Slides
World Maps
Free
Circular Go To Market Strategy Template for PowerPoint & Google Slides
Business Strategy
Free
Neon Dark Stock Market Analysis Template for PowerPoint & Google Slides
Pitch Deck
Free
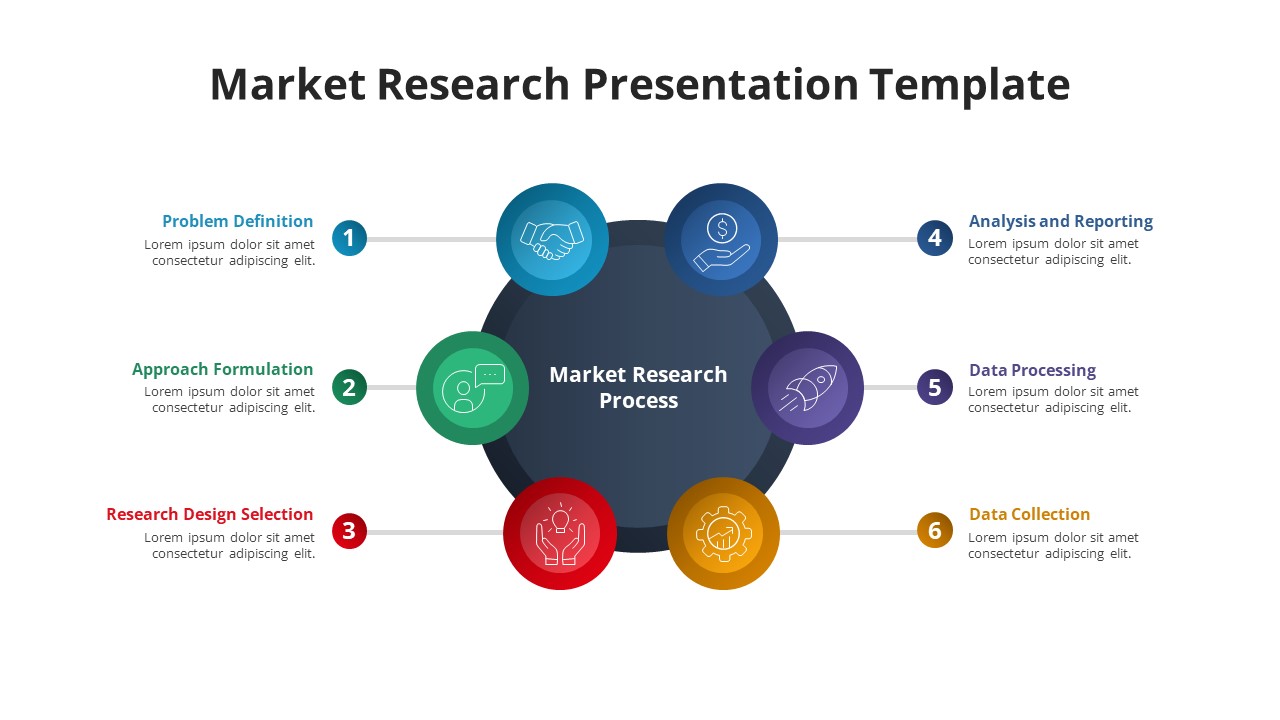
Free Six-Phase Market Research Process Template for PowerPoint & Google Slides
Process
Free
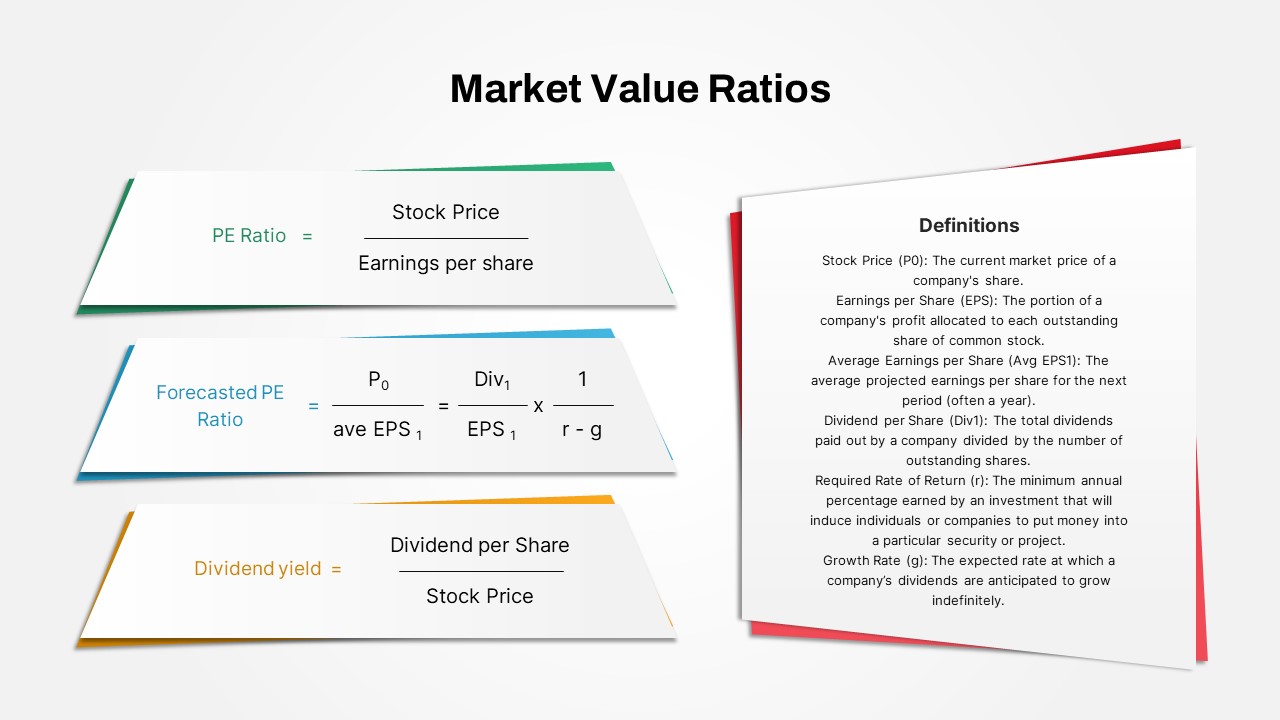
Market Value Ratios Formula Overview Template for PowerPoint & Google Slides
Business Report
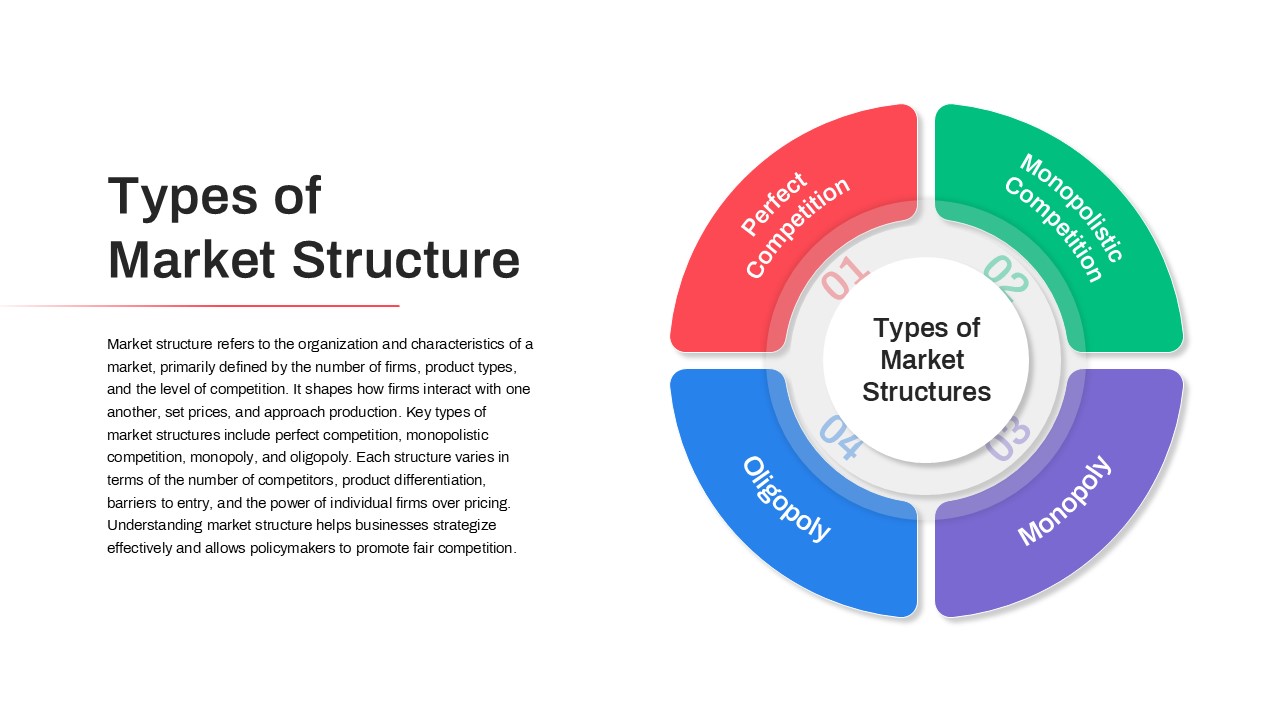
Types of Market Structure Infographic Template for PowerPoint & Google Slides
Comparison
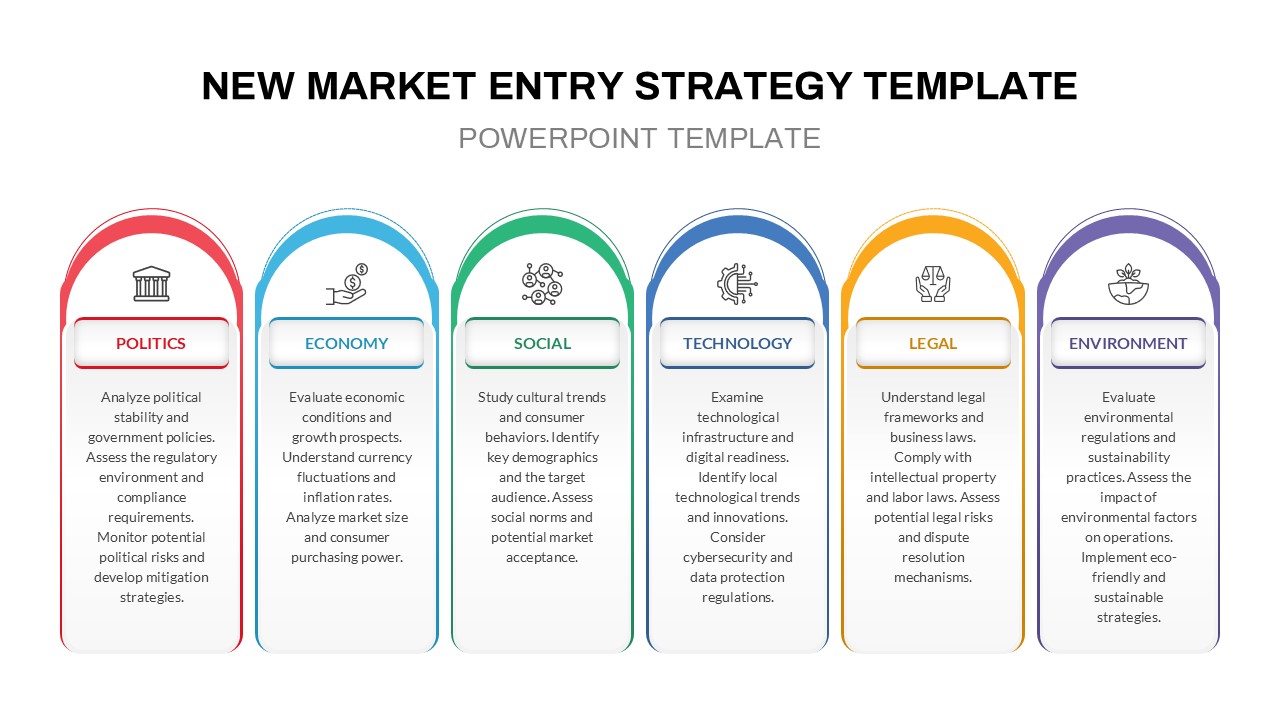
PESTLE Analysis for Market Entry Template for PowerPoint & Google Slides
PEST
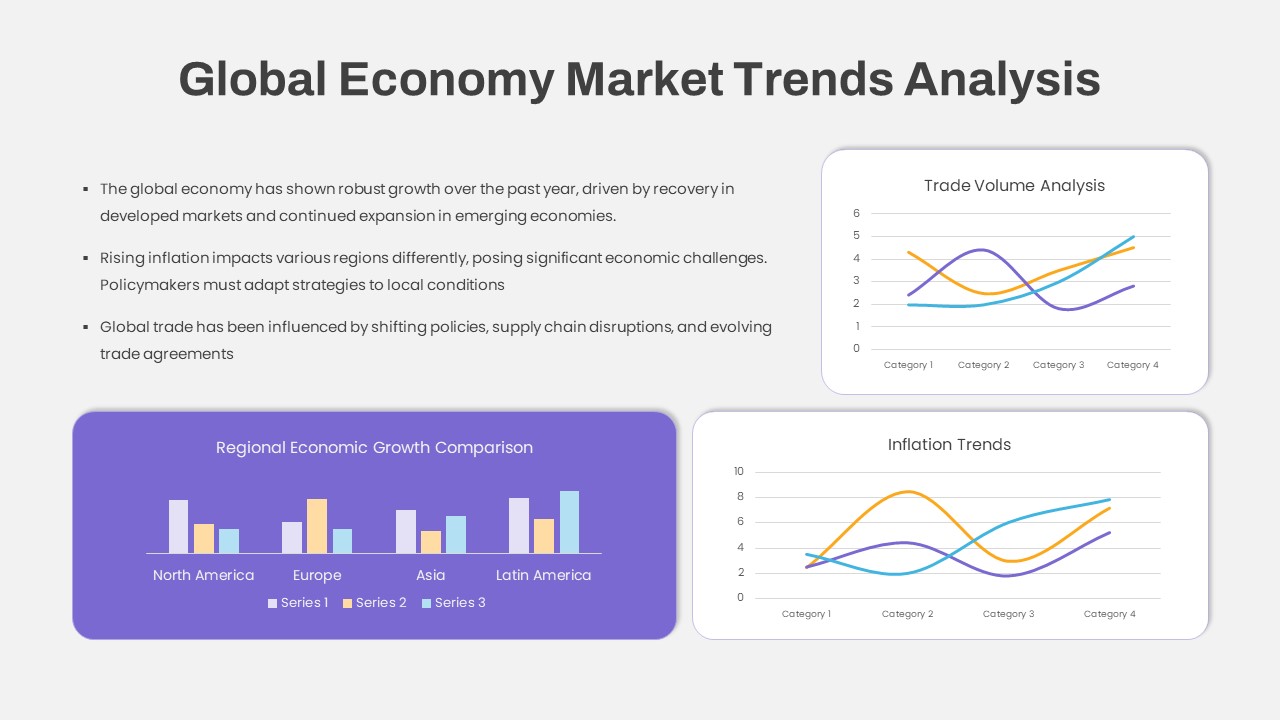
Global Economy Market Trends Analysis Template for PowerPoint & Google Slides
Comparison Chart
Market Validation Metrics Overview Template for PowerPoint & Google Slides
Business
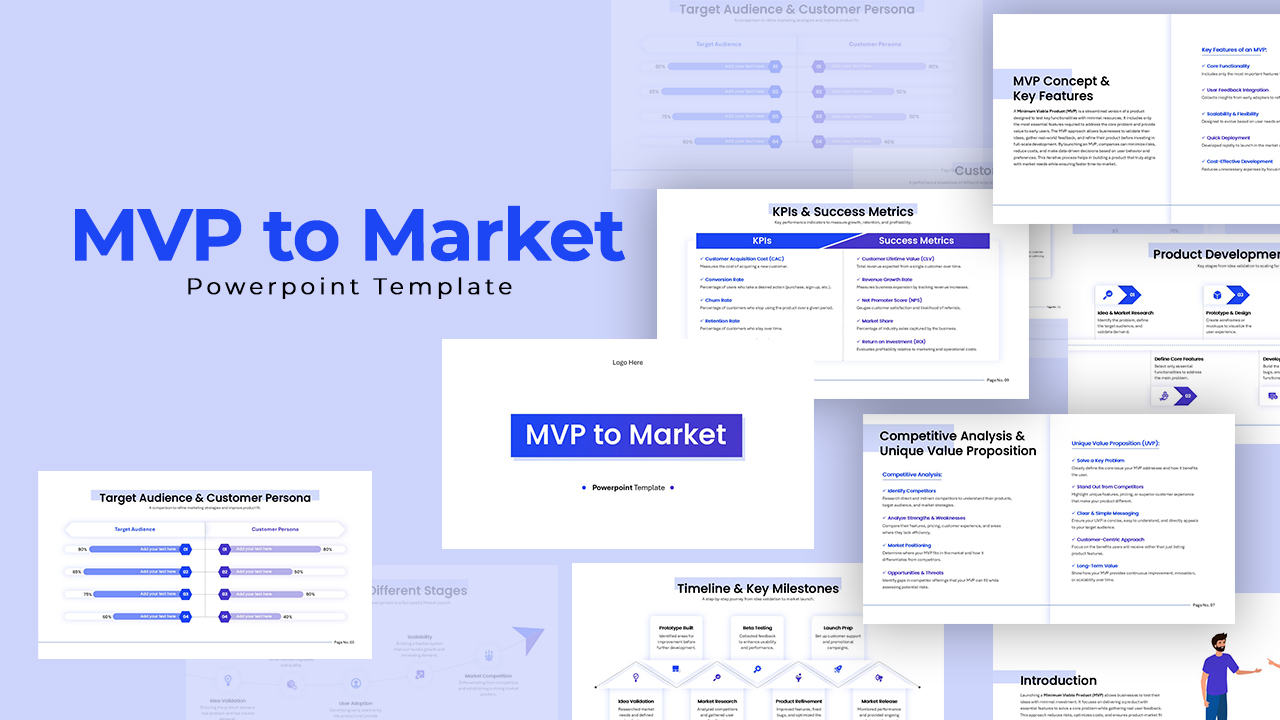
MVP to Market Strategy Pitch Deck Template for PowerPoint & Google Slides
Pitch Deck
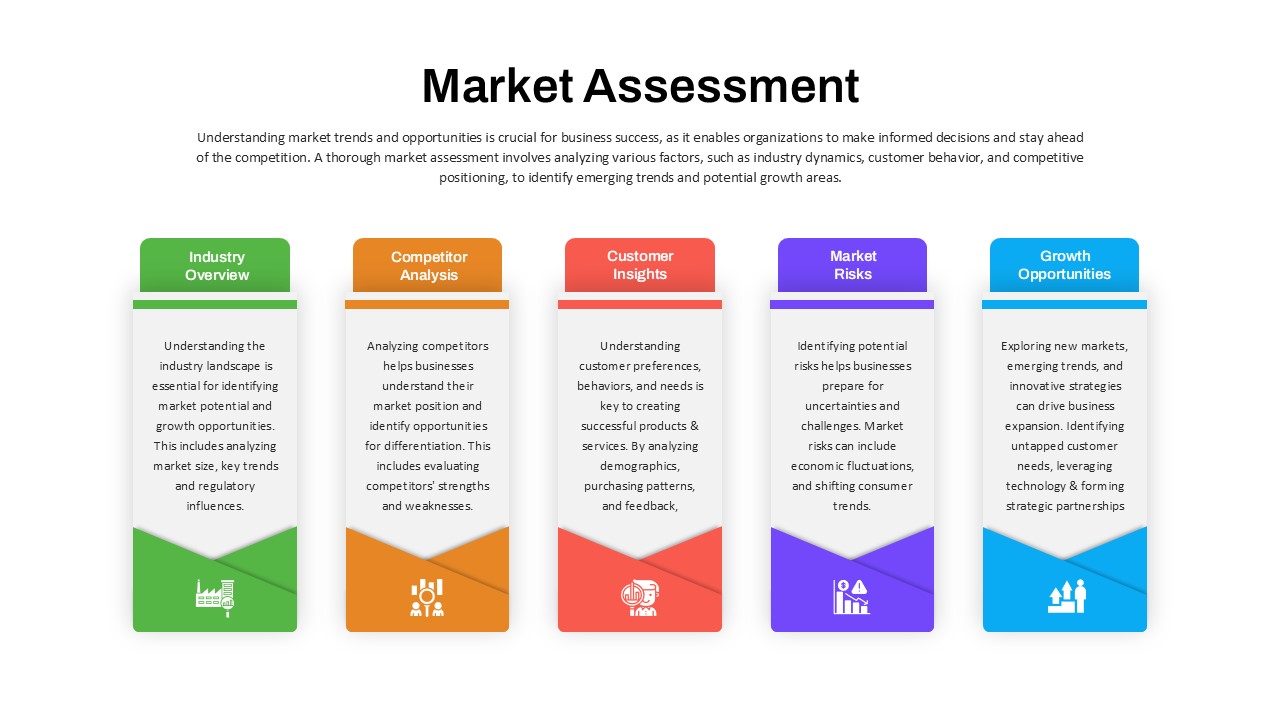
Market Assessment Infographic Slide Template for PowerPoint & Google Slides
Process
Service Zoom Feature Slides Comparison template for PowerPoint & Google Slides
Process
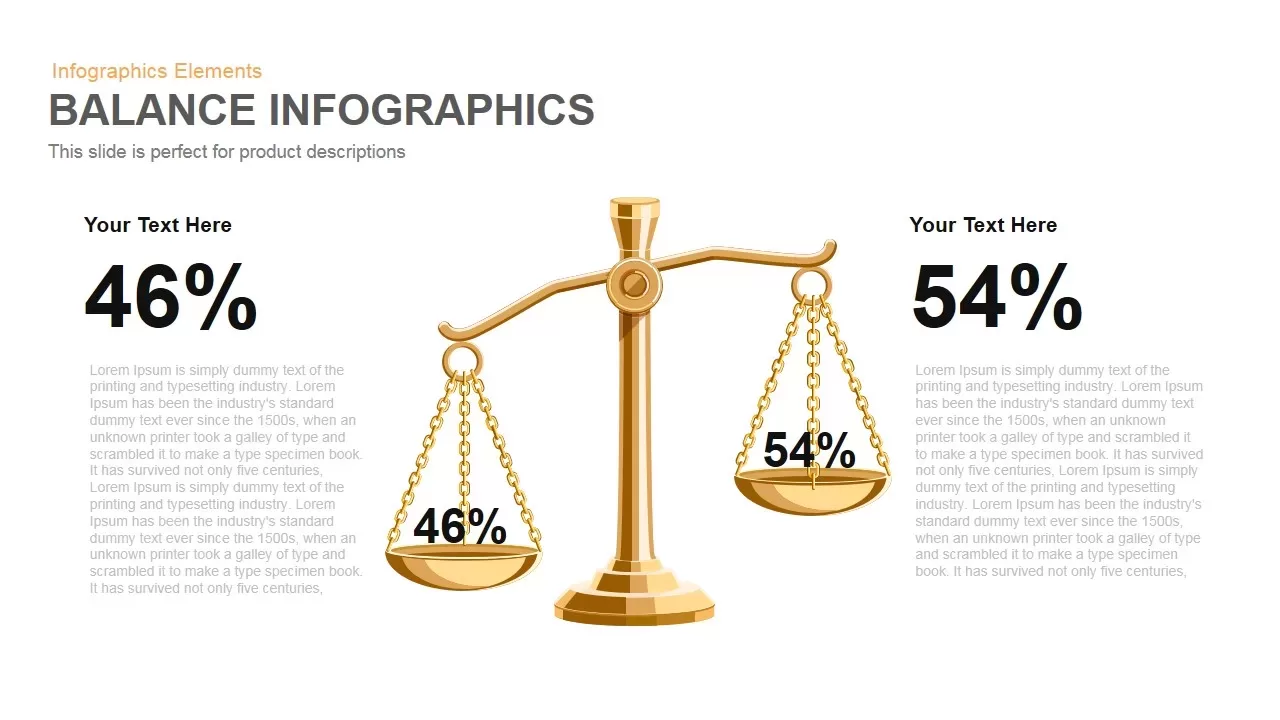
Gold Scales Balance Comparison Template for PowerPoint & Google Slides
Comparison
Comparison Bar Chart template for PowerPoint & Google Slides
Comparison Chart

A/B Testing Comparison Infographic template for PowerPoint & Google Slides
Comparison
Scale Metaphor Metrics Comparison Template for PowerPoint & Google Slides
Charts
Dual Percentage Comparison Metaphor Template for PowerPoint & Google Slides
Comparison
Gender Comparison People Infographic Template for PowerPoint & Google Slides
Comparison
Comparison Chart Overview template for PowerPoint & Google Slides
Comparison Chart
Dynamic Multicolor Comparison Table Template for PowerPoint & Google Slides
Comparison
Interactive Pricing Plan Comparison Template for PowerPoint & Google Slides
Comparison
Five-Option Text Boxes Table Comparison Template for PowerPoint & Google Slides
Business Report
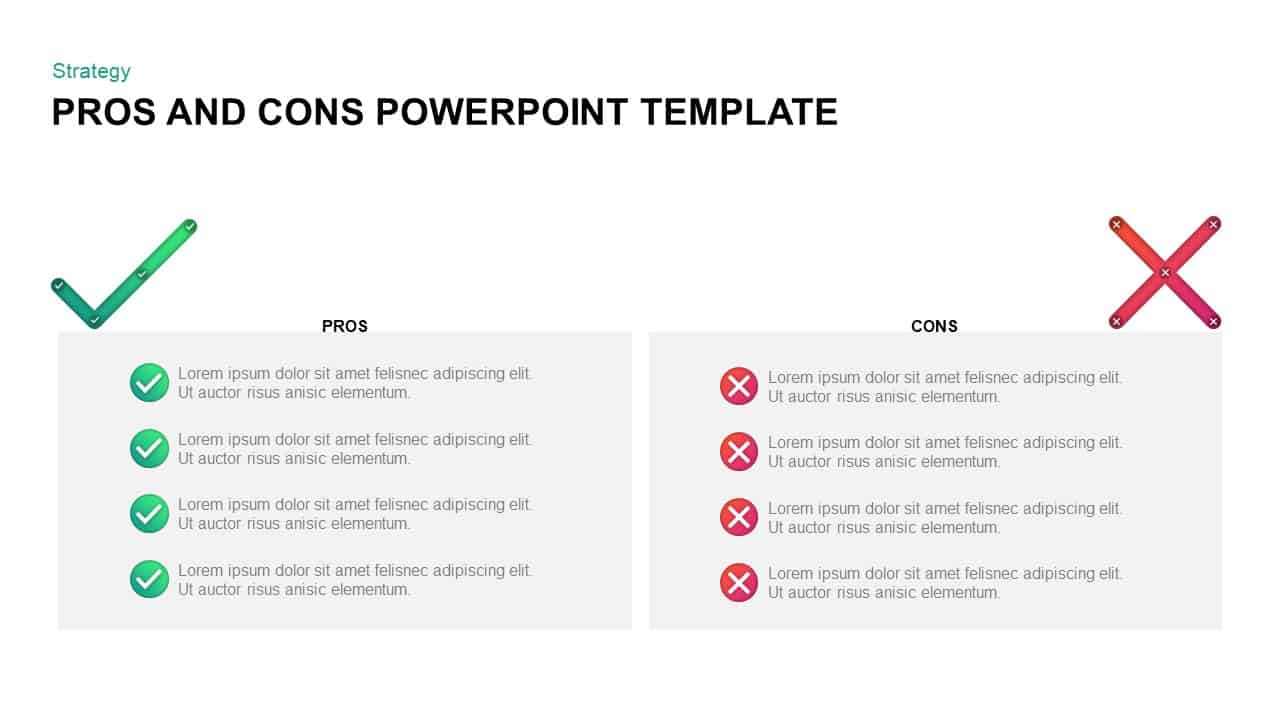
Pros and Cons Comparison Slide Template for PowerPoint & Google Slides
Comparison
Seller Portals Comparison Infographic Template for PowerPoint & Google Slides
Process
Fact and Figures Comparison Slide Template for PowerPoint & Google Slides
Business Report
BMI Category Comparison Chart Template for PowerPoint & Google Slides
Comparison
Generations Comparison Infographic Template for PowerPoint & Google Slides
Timeline
Circular Product Comparison Chart Template for PowerPoint & Google Slides
Comparison Chart
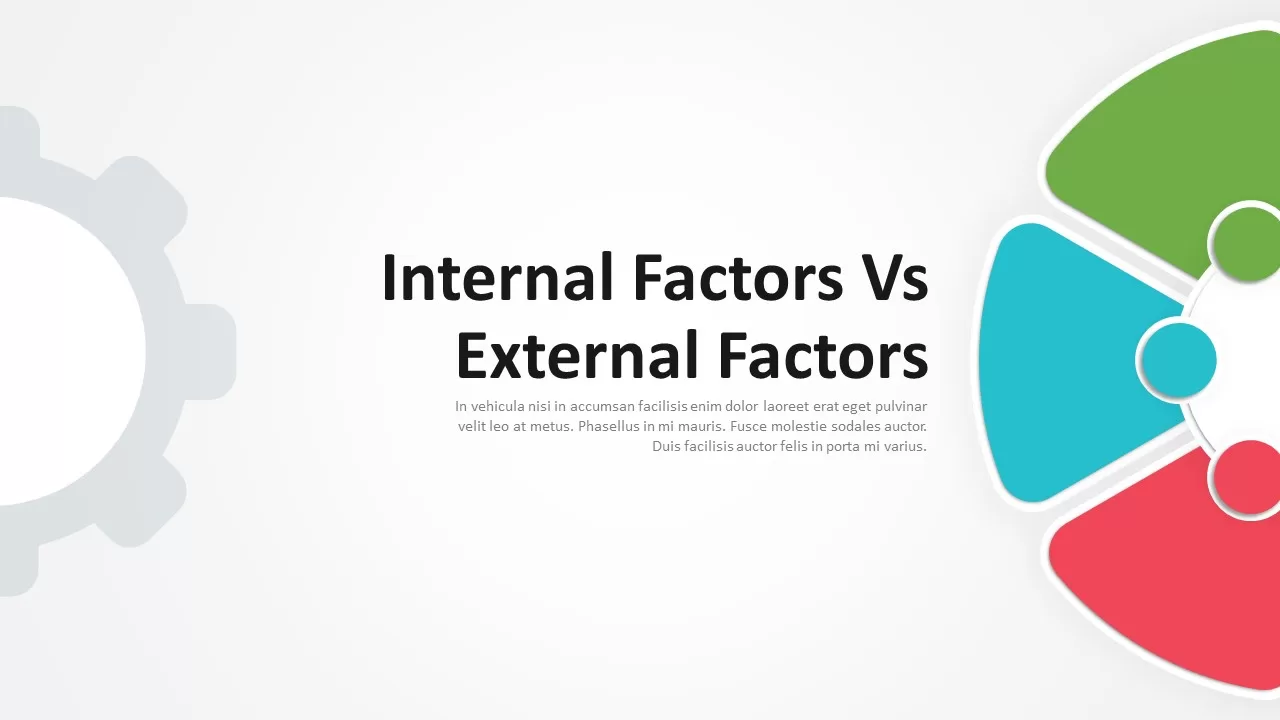
Internal vs External Factors Comparison Template for PowerPoint & Google Slides
Comparison
Theory X and Theory Y Comparison Template for PowerPoint & Google Slides
Comparison
Competitive Landscape Comparison Template Pack for PowerPoint & Google Slides
Comparison
Before and After Comparison Infographics Template for PowerPoint & Google Slides
Comparison
Current vs Future State Comparison Slide Template for PowerPoint & Google Slides
Comparison Chart
Before and After Comparison Infographic Template for PowerPoint & Google Slides
Comparison
Free
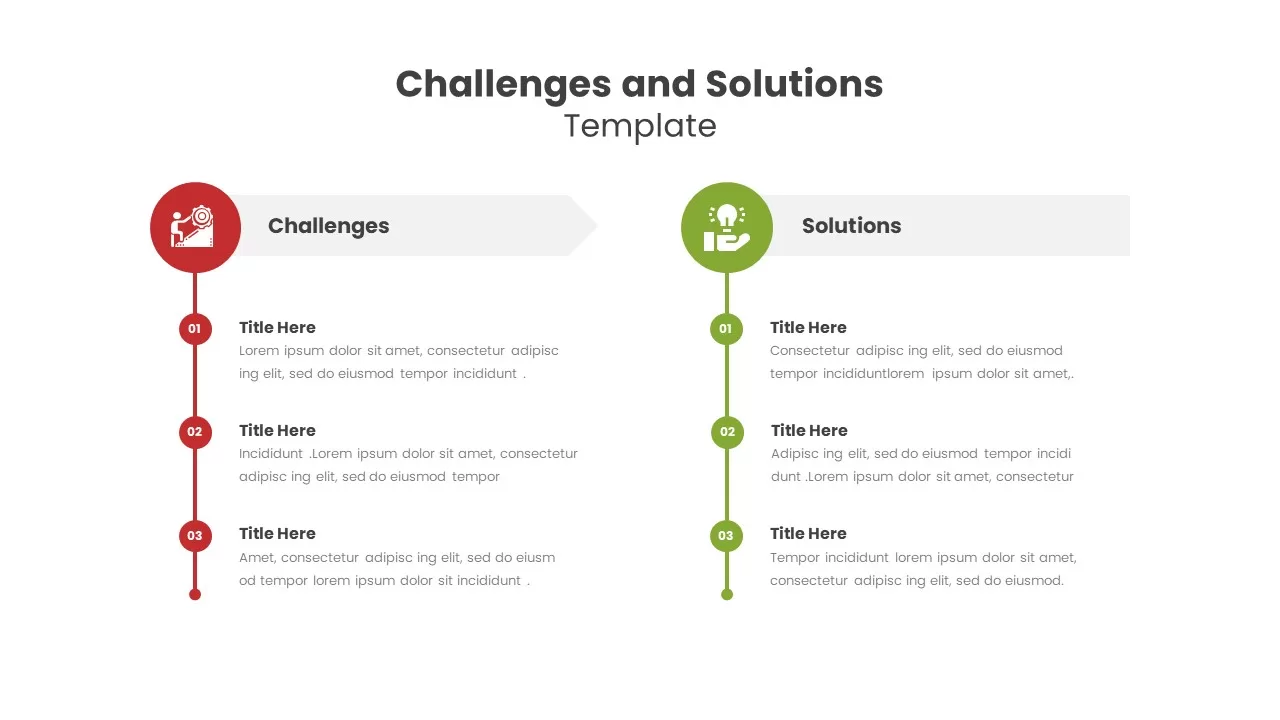
Challenges and Solutions Comparison Template for PowerPoint & Google Slides
Opportunities Challenges
Cost Benefit Analysis Comparison Template for PowerPoint & Google Slides
Comparison
Risk Heatmap Comparison Template for PowerPoint & Google Slides
Maps
Heatmap Comparison Template for PowerPoint & Google Slides
Maps
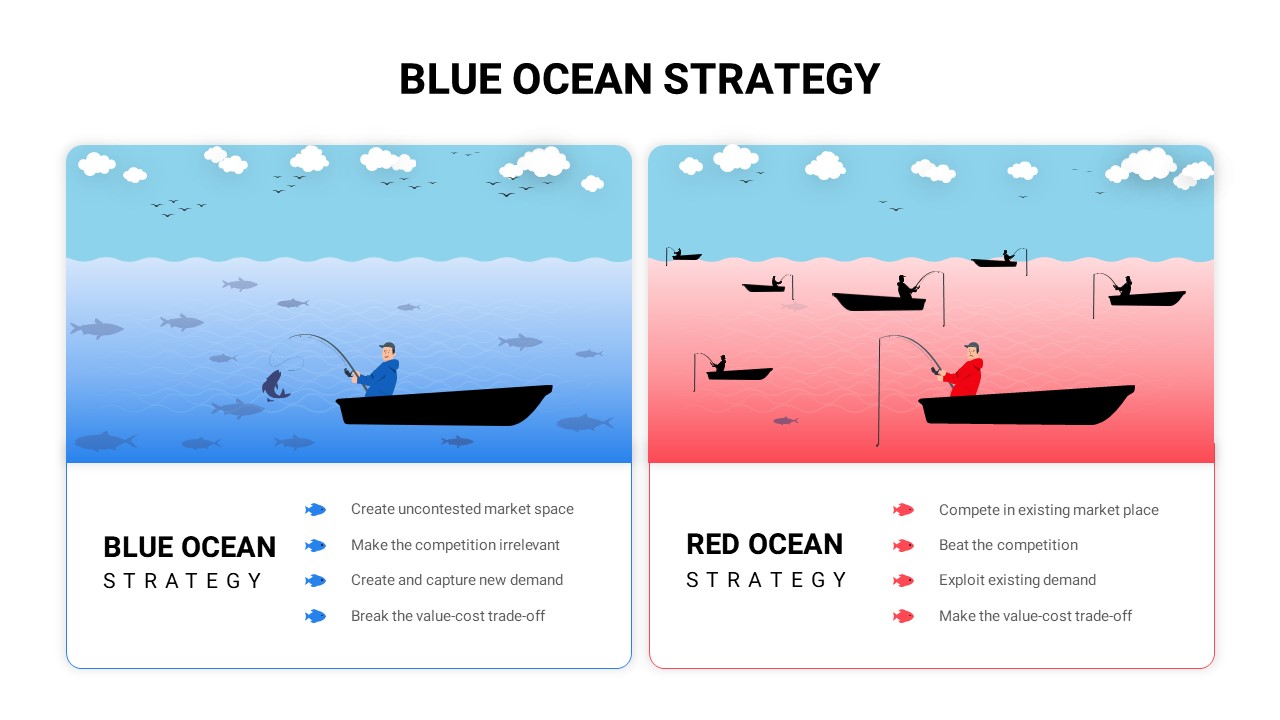
Blue vs Red Ocean Strategy Comparison Template for PowerPoint & Google Slides
Business Strategy
People Demographic Comparison Chart Template for PowerPoint & Google Slides
Comparison
Conflict Infographics Comparison Template for PowerPoint & Google Slides
Infographics
Clustered Bar Chart Comparison Template for PowerPoint & Google Slides
Bar/Column
Mirror Bar Chart Comparison Template for PowerPoint & Google Slides
Bar/Column
Free Global Warming Infographic Comparison Template for PowerPoint & Google Slides
Comparison Chart
Free
Dynamic Bar-of-Pie Chart Comparison Template for PowerPoint & Google Slides
Pie/Donut
Types of AI Comparison Infographic Template for PowerPoint & Google Slides
AI
ESG Initiatives Comparison Chart Template for PowerPoint & Google Slides
Business
Economies of Scale Cost Curve Comparison Template for PowerPoint & Google Slides
Comparison Chart
Regional Revenue Comparison Overview Template for PowerPoint & Google Slides
Comparison
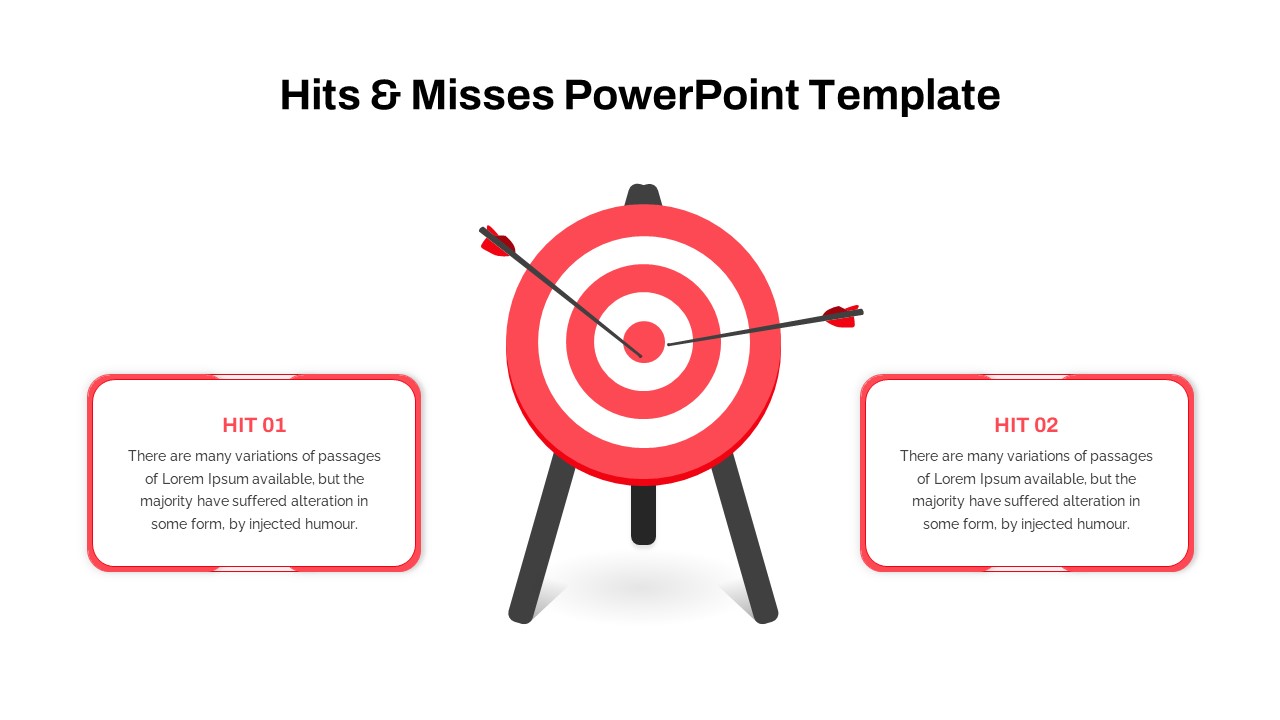
Hits & Misses Comparison Infographic Template for PowerPoint & Google Slides
Pitch Deck
Pricing Model Types Comparison Infographic Template for PowerPoint & Google Slides
Pitch Deck
Risk Level Gauge Comparison Dashboard Template for PowerPoint & Google Slides
Comparison
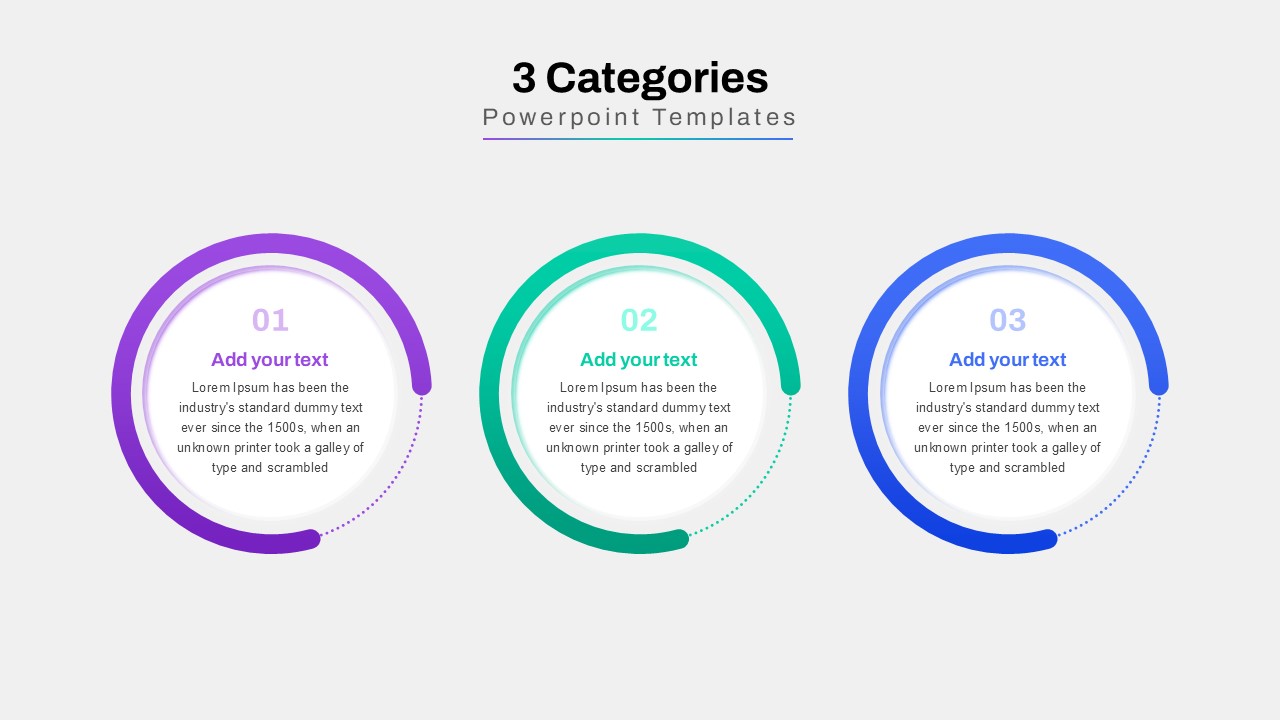
Three-Category Comparison Template for PowerPoint & Google Slides
Comparison
Profile Comparison Chart template for PowerPoint & Google Slides
Comparison Chart
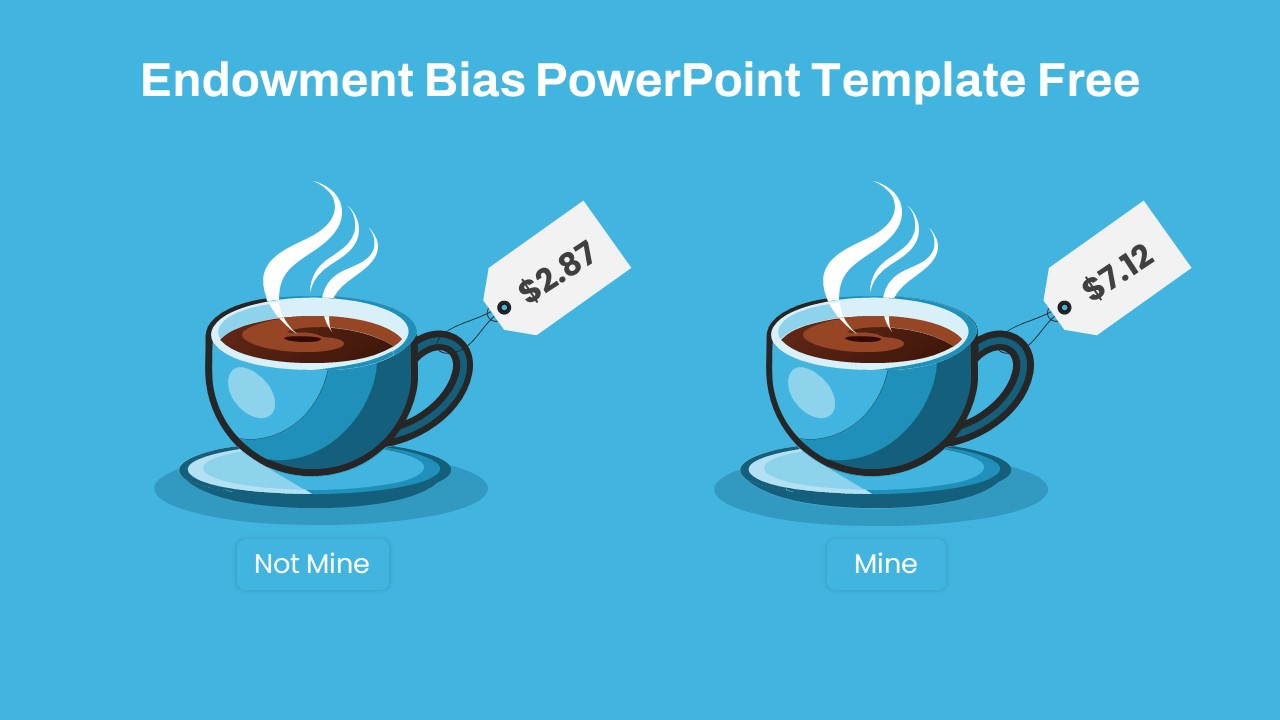
Endowment Bias Coffee Price Comparison Template for PowerPoint & Google Slides
Comparison
Free
Sales Growth Comparison Chart & Table Template for PowerPoint & Google Slides
Bar/Column
Two Section Comparison template for PowerPoint & Google Slides
Business Proposal
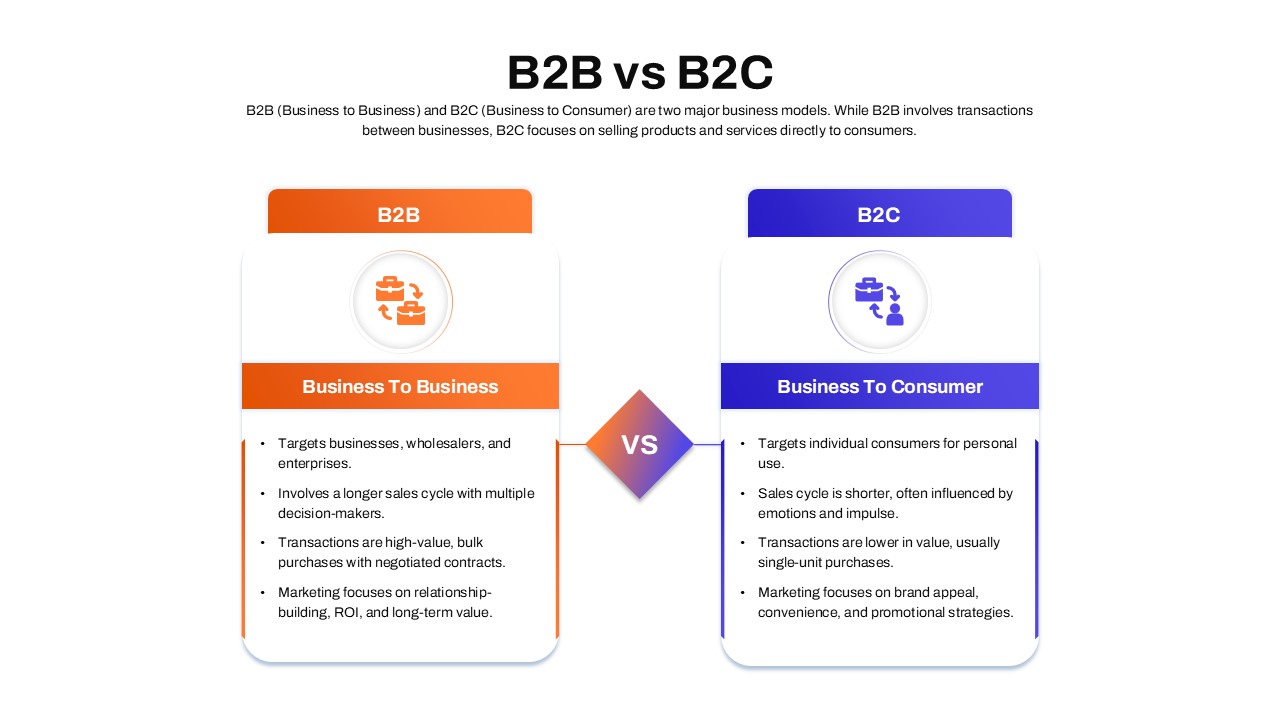
B2B vs B2C Comparison template for PowerPoint & Google Slides
Business Models
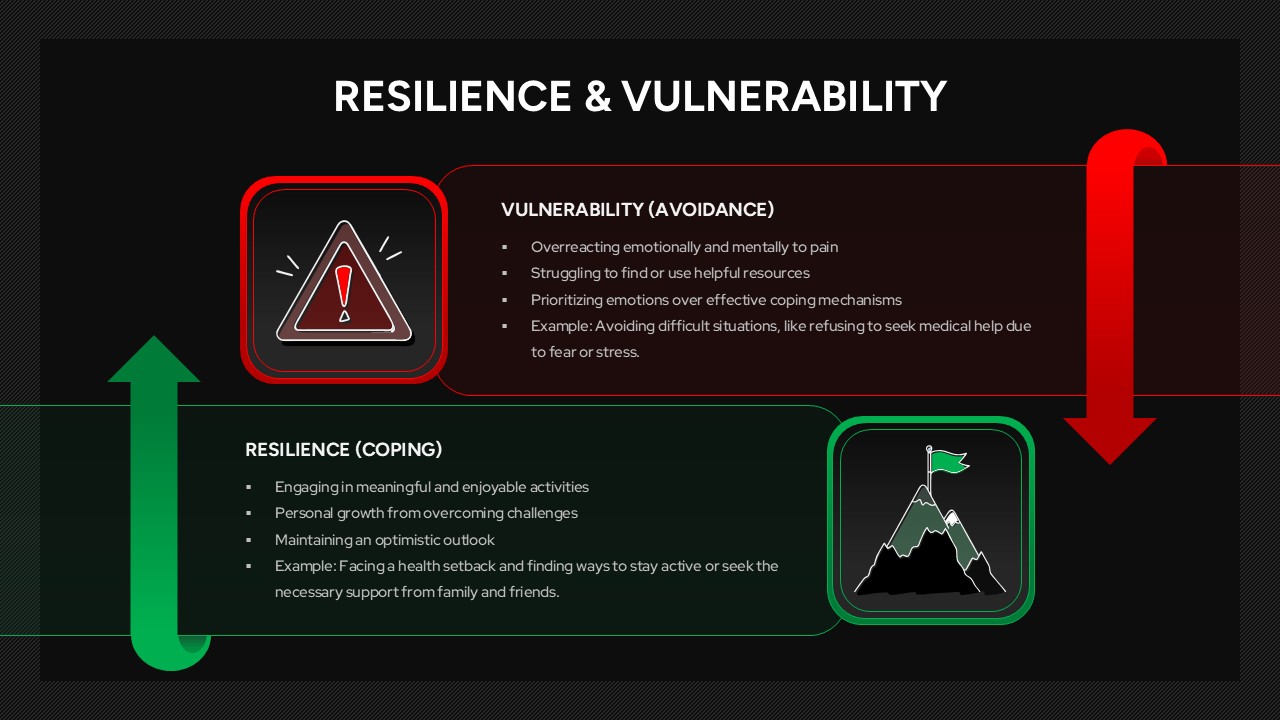
Resilience & Vulnerability Comparison Template for PowerPoint & Google Slides
Comparison
Skills Gap Analysis Comparison Chart Template for PowerPoint & Google Slides
Gap
Category Analysis Comparison Infographic Template for PowerPoint & Google Slides
Comparison
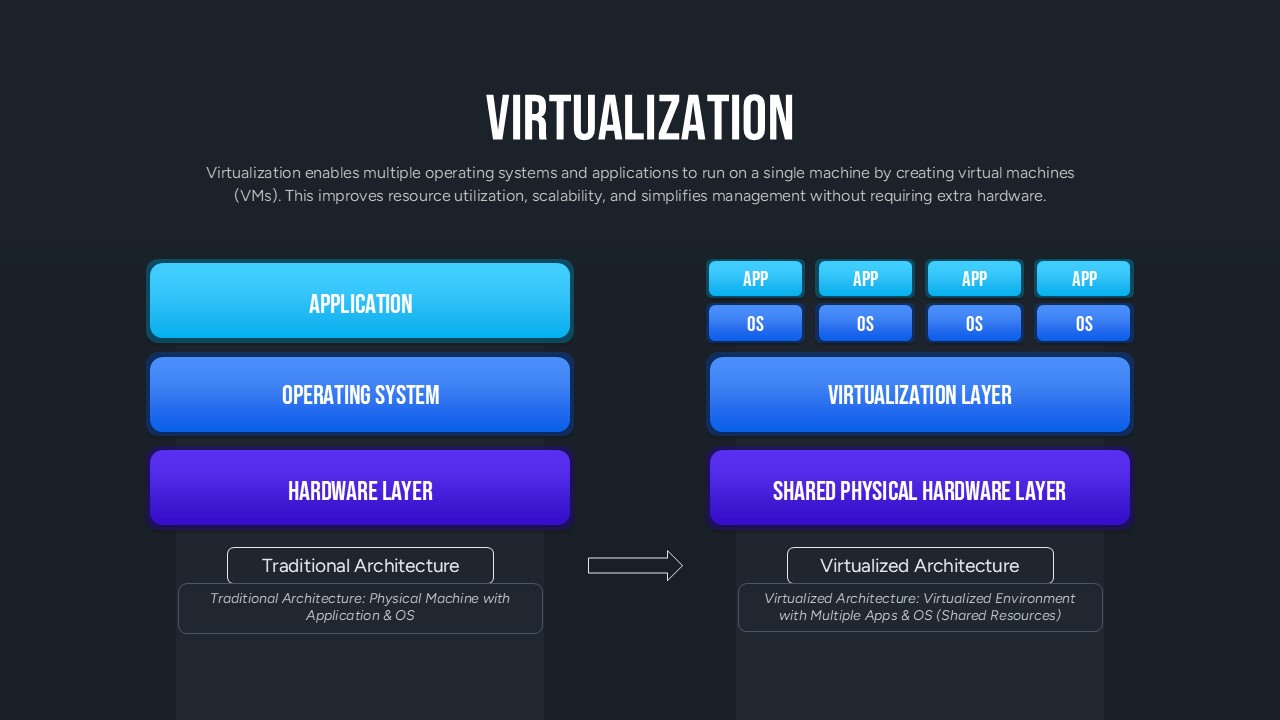
Virtualization Architecture Comparison Template for PowerPoint & Google Slides
Comparison Chart
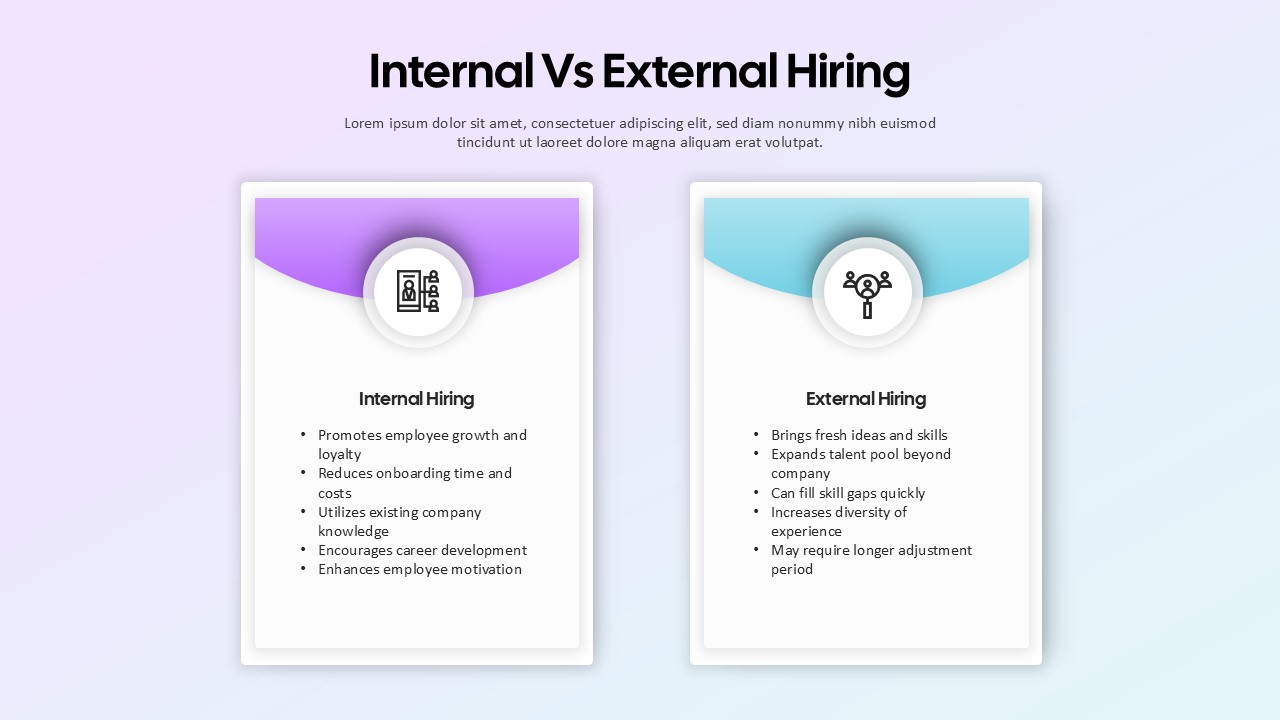
Internal vs External Hiring Comparison Template for PowerPoint & Google Slides
Comparison
Five Column Comparison Table Layout Template for PowerPoint & Google Slides
Comparison
Quarterly Comparison Pie Chart Template for PowerPoint & Google Slides
Pie/Donut
Pros and Cons Comparison Table Template for PowerPoint & Google Slides
Comparison Chart
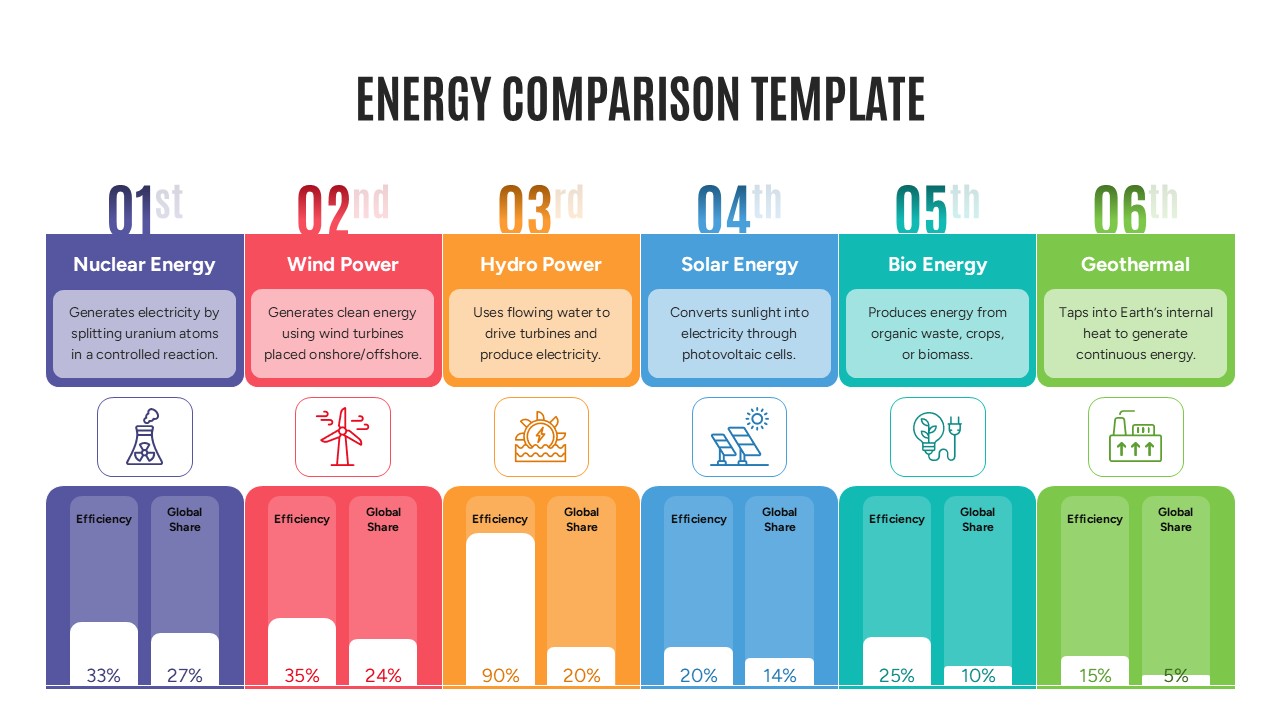
Energy Comparison Template for PowerPoint & Google Slides
Comparison
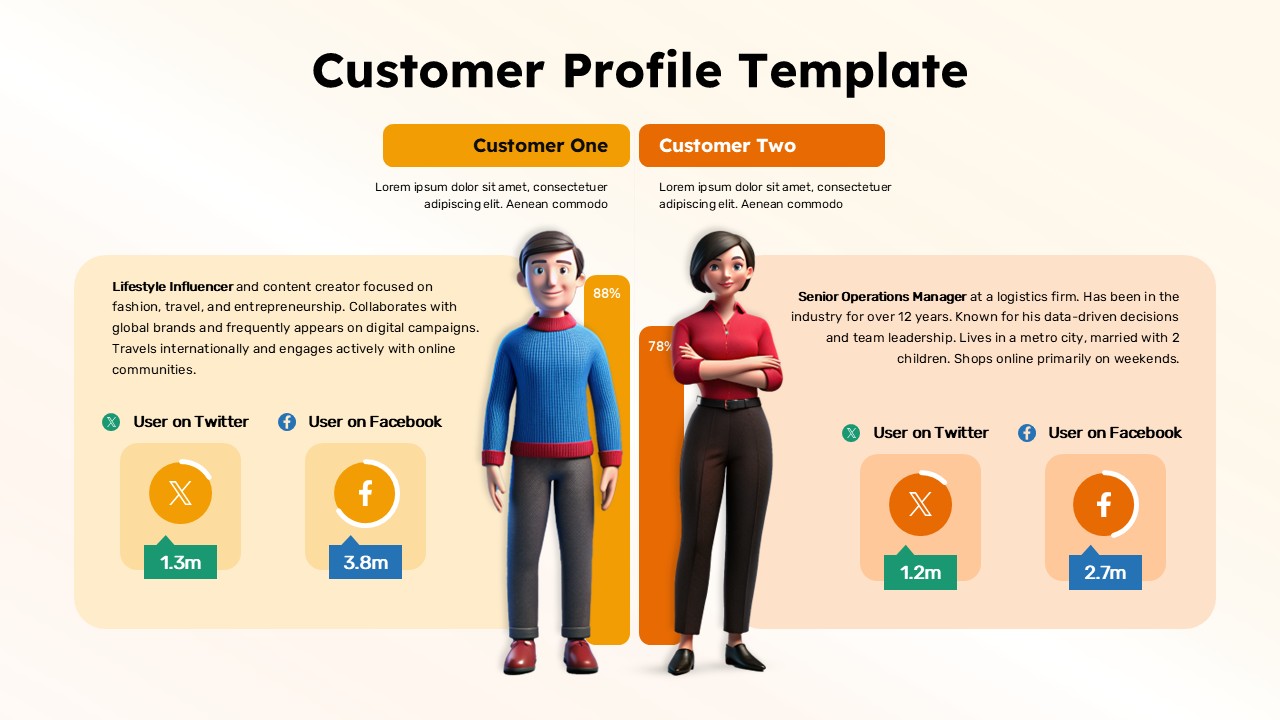
Customer Persona Comparison Profile Template for PowerPoint & Google Slides
Business
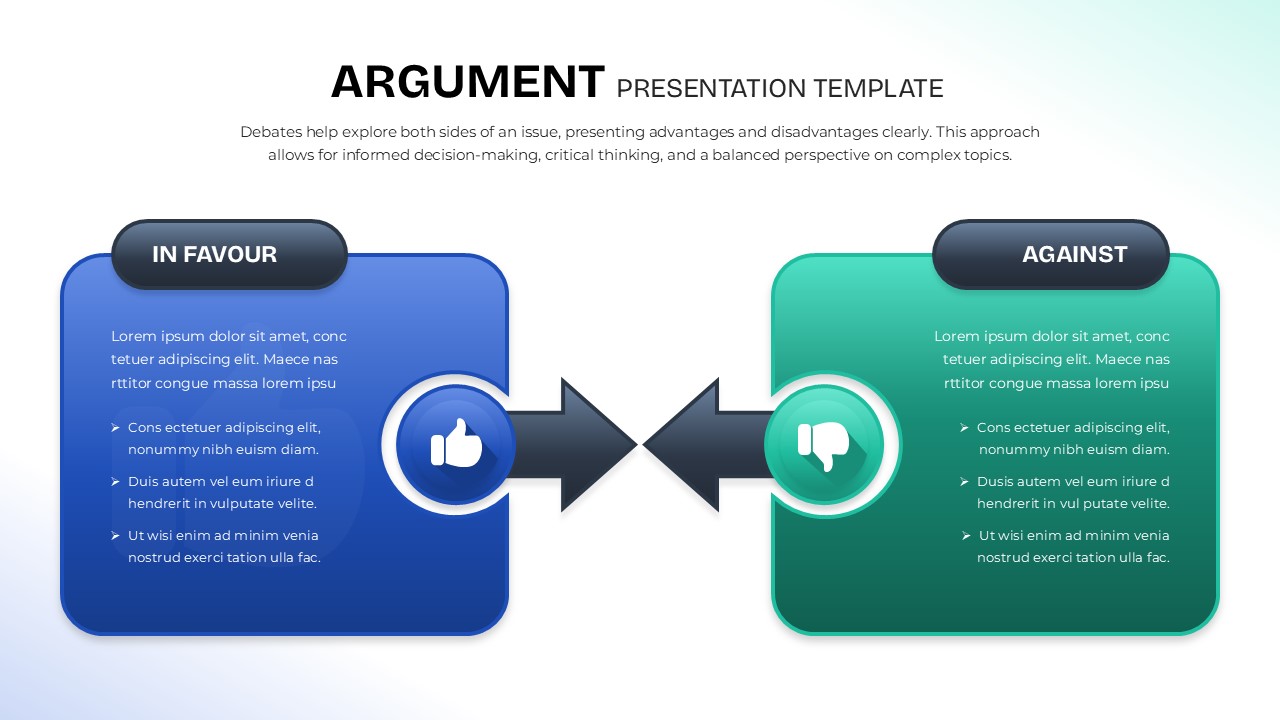
Argument Comparison Template for PowerPoint & Google Slides
Comparison
Year-over-Year Performance Comparison Template for PowerPoint & Google Slides
Comparison Chart
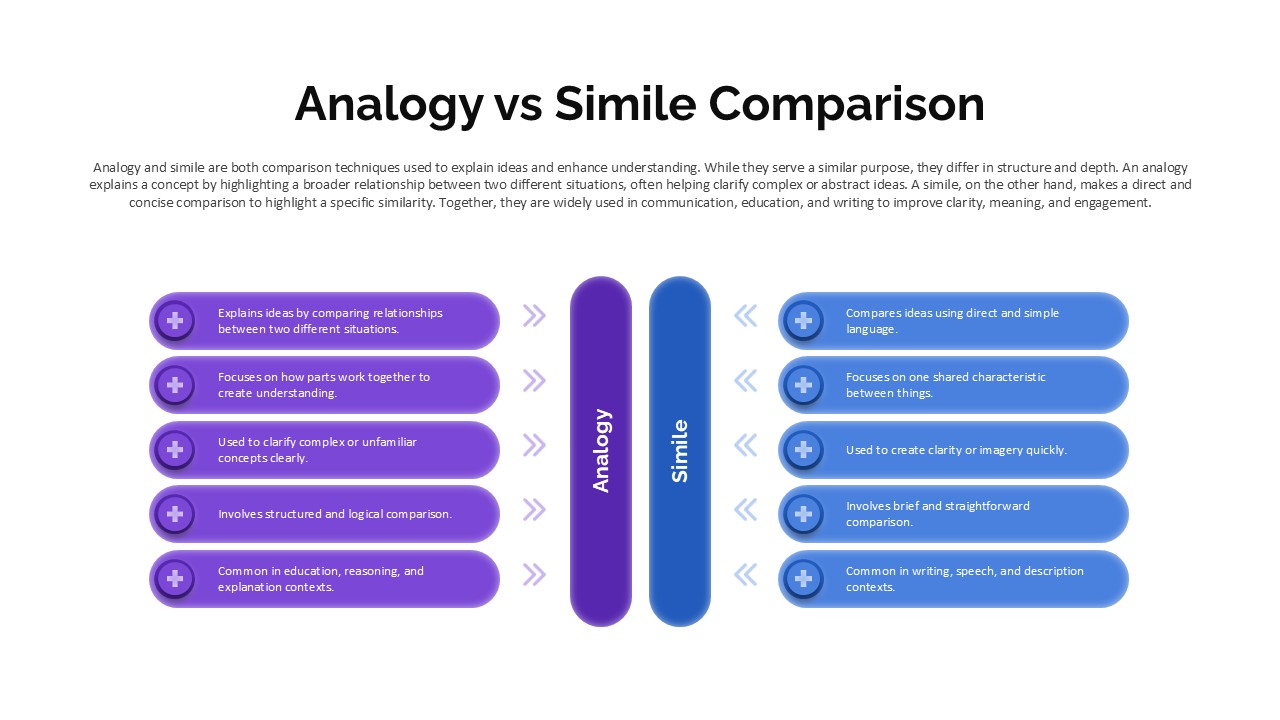
Analogy vs Simile Comparison Template for PowerPoint & Google Slides
Comparison