Leaf Infographic Data Visualization Template for PowerPoint & Google Slides

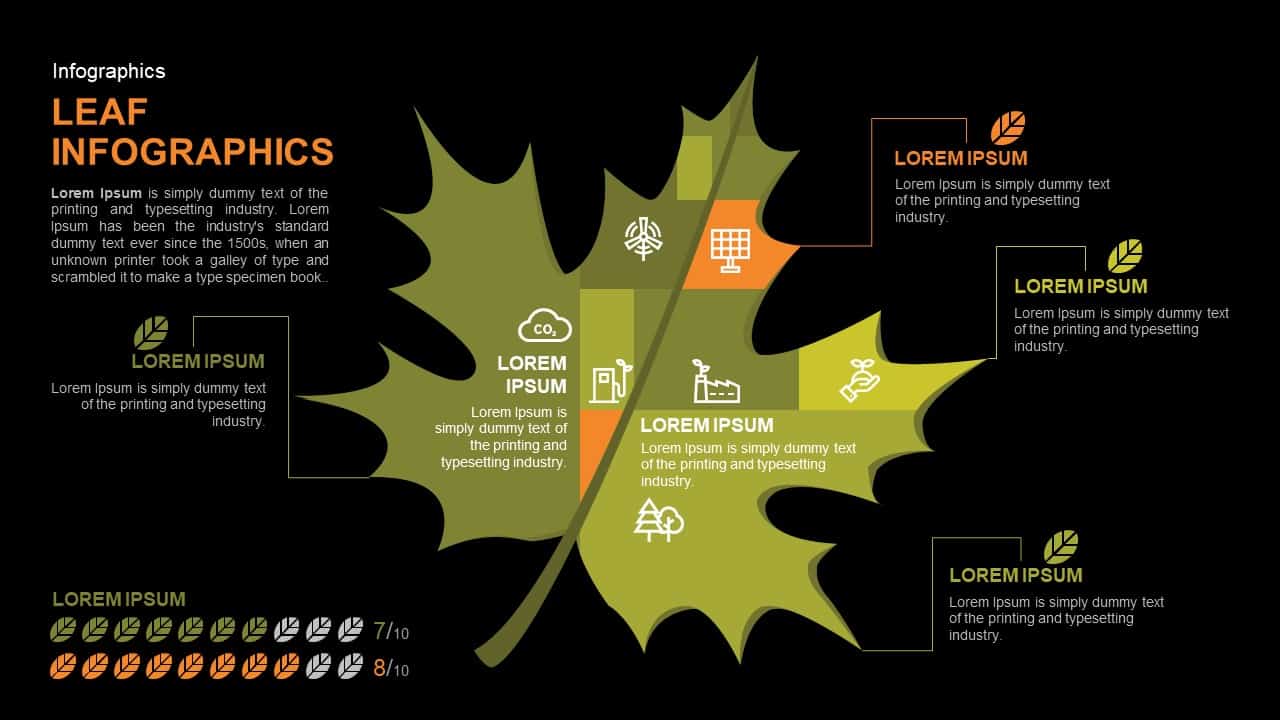
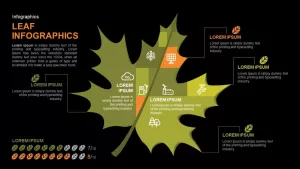
Transform complex sustainability metrics and environmental data into a compelling visual narrative with this leaf segmented infographic slide. The centerpiece features a large stylized leaf divided into five gradient-shaded sections—each segment hosts a white icon representing themes like carbon footprint, solar energy, factory emissions, reforestation, and resource management. Elegant connector lines extend to text callouts on both sides, offering customizable headings and descriptive fields for detailed explanations. A horizontal rating bar at the bottom uses colored leaf icons to visualize quantitative scores or performance metrics across two categories, making it easy to compare outcomes at a glance.
Built as fully editable vector graphics on master slides, every element—from segment shapes to color gradients and icons—can be resized, recolored, or replaced to align with your brand guidelines. Intuitive placeholders streamline updates: swap icons in seconds, adjust callout positions, or edit text directly without disrupting layout integrity. Subtle drop shadows and consistent white space ensure a modern, professional aesthetic that remains clear when presenting on PowerPoint or Google Slides. Preconfigured slide animations can introduce segments and callouts sequentially, guiding your audience through key insights and maintaining engagement.
Ideal for sustainability presentations, environmental impact reports, or circular economy workshops, this infographic slide empowers consultants, executives, and ESG specialists to illustrate complex concepts—such as lifecycle analysis or resource allocation—efficiently. Beyond environmental contexts, repurpose the leaf design for SWOT analyses, competitive comparisons, or resource planning slides by simply replacing icons and labels. Whether your audience is investors, board members, or environmental advocates, this slide ensures clarity and professionalism. Duplicate the slide to compare multiple scenarios or embed it within a broader deck to reinforce your narrative with data-driven visuals.
Who is it for
Consultants, sustainability managers, and ESG analysts will leverage this infographic to present environmental metrics, resource-allocation plans, or corporate social responsibility reports. Marketing teams, nonprofit directors, and academic researchers can use it to engage stakeholders with clear, impact-focused visuals.
Other Uses
Repurpose this slide for product feature comparisons, KPI scorecards, or resource-planning frameworks. Swap icons and labels to map customer journeys, illustrate departmental performance, or create creative organizational charts with a nature-inspired theme.
Login to download this file

Item ID
SB01135
Related Templates

Vibrant Tropical Leaf Background Slide Template for PowerPoint & Google Slides
Pitch Deck
Circle Graph Data Visualization Template for PowerPoint & Google Slides
Circular
3D Cone Chart Data Visualization template for PowerPoint & Google Slides
Bar/Column
Gear Pie Diagram Data Visualization Template for PowerPoint & Google Slides
Pie/Donut
Mobile Infographics Data Visualization Template for PowerPoint & Google Slides
Infographics
Medical Infographics Data Visualization Template for PowerPoint & Google Slides
Health
KPI Dashboard Data Visualization Template for PowerPoint & Google Slides
Bar/Column
Professional Heatmap Data Visualization Template for PowerPoint & Google Slides
Infographics
Waffle Chart Data Visualization Template for PowerPoint & Google Slides
Comparison Chart
Free Stacked Column Chart Data Visualization Template for PowerPoint & Google Slides
Bar/Column
Free
Simple Bar Chart Data Visualization Template for PowerPoint & Google Slides
Bar/Column
XY Bubble Chart Data Visualization Template for PowerPoint & Google Slides
Comparison Chart
Waterfall Chart Data Visualization Template for PowerPoint & Google Slides
Comparison Chart
UK Counties Map Data Visualization Template for PowerPoint & Google Slides
World Maps
Segmented Scatter Chart Data Visualization Template for PowerPoint & Google Slides
Business Strategy
Free Big Data Network Visualization Template for PowerPoint & Google Slides
Circular
Free
Balance Scale Visualization Infographic Template for PowerPoint & Google Slides
Comparison
Free Four Box Style Visualization template for PowerPoint & Google Slides
Process
Free

Bold Diamond Risk Alert Visualization Template for PowerPoint & Google Slides
Risk Management
3 Level Funnel Design Visualization Template for PowerPoint & Google Slides
Funnel
Professional Risk Heat Map Visualization Template for PowerPoint & Google Slides
Risk Management
Growth Curve Line Chart Visualization Template for PowerPoint & Google Slides
Charts
Free Bucket Process Visualization Template for PowerPoint & Google Slides
Process
Free
Animated Light Bulb Visualization Template for PowerPoint & Google Slides
Process
Progress Bar and Milestone Visualization Template for PowerPoint & Google Slides
Timeline
Dynamic Sunburst Chart Visualization Template for PowerPoint & Google Slides
Charts
Kentucky County Map Visualization Template for PowerPoint & Google Slides
World Maps
3D Cylinder Bar Chart Visualization Template for PowerPoint
Bar/Column
3D Stacked Infographic Layers Data Template for PowerPoint & Google Slides
Pyramid
Creative Lab Beakers Data Infographic template for PowerPoint & Google Slides
Infographics

Dynamic Data Dashboard Infographic Template for PowerPoint & Google Slides
Bar/Column
Bottle Data Percentage Infographic Template for PowerPoint & Google Slides
Infographics
Data-driven GDP Growth Infographic Pack Template for PowerPoint & Google Slides
Infographics

Modern Big Data Infographic Deck Template for PowerPoint & Google Slides
Decks
Editable Africa Map Infographic Data Template for PowerPoint & Google Slides
World Maps
Syria Regional Data Map Infographic Template for PowerPoint & Google Slides
World Maps
Data-Driven AI in Insurance Infographic Template for PowerPoint & Google Slides
Circular
Mobile User Data Analysis Infographic for PowerPoint & Google Slides
Process
Data Science PowerPoint Presentation Template for PowerPoint & Google Slides
Pitch Deck
Data Center PowerPoint Template for PowerPoint & Google Slides
Information Technology

Creative data chart analytics template for PowerPoint & Google Slides
Charts
Mobile Data Analysis Chart template for PowerPoint & Google Slides
Charts
World Map Data template for PowerPoint & Google Slides
World Maps
Circle Chart Data template for PowerPoint & Google Slides
Pie/Donut
Creative Data Analysis Bar Chart template for PowerPoint & Google Slides
Bar/Column

Smartphone Data User template for PowerPoint & Google Slides
Charts
Interactive US Population Data Map Slide Template for PowerPoint & Google Slides
World Maps
3D Bar Chart Data Infographics Template for PowerPoint & Google Slides
Bar/Column
Pencil Bar Chart Data Analysis Template for PowerPoint & Google Slides
Bar/Column
Data Analytics Dashboard Design template for PowerPoint & Google Slides
Bar/Column
Data-Driven Marketing Cycle Diagram Template for PowerPoint & Google Slides
Customer Journey
Tornado Chart Data Comparison Slide Template for PowerPoint & Google Slides
Bar/Column
Immigration Data Dashboard Template for PowerPoint & Google Slides
Bar/Column
Data Management and Analytics Diagram Template for PowerPoint & Google Slides
Circular
Data Migration Life Cycle Curved Diagram Template for PowerPoint & Google Slides
Process
DIKW Data to Wisdom Pyramid Model Template for PowerPoint & Google Slides
Pyramid
KPI Dashboard Data Overview Slide Template for PowerPoint & Google Slides
Bar/Column
North America Data Map Callouts Template for PowerPoint & Google Slides
World Maps
Donut Chart Data Breakdown template for PowerPoint & Google Slides
Pie/Donut
Layered Data Governance Maturity Model Template for PowerPoint & Google Slides
Process
Simple Area Chart Data Trends Analysis Template for PowerPoint & Google Slides
Comparison Chart
Data Over Time Line Chart template for PowerPoint & Google Slides
Charts
Multipurpose Spline Chart Data Trend Template for PowerPoint & Google Slides
Bar/Column
Advanced Data Flow Diagram Pack Template for PowerPoint & Google Slides
Flow Charts
Interactive Jump Line Data Chart Template for PowerPoint & Google Slides
Comparison Chart
Data Analysis Bar Chart with Insights Template for PowerPoint & Google Slides
Bar/Column
Free
Data Lake Hub-and-Spoke Diagram Template for PowerPoint & Google Slides
Cloud Computing
ETL Data Pipeline Workflow Diagram Template for PowerPoint & Google Slides
Process
Data Privacy template for PowerPoint & Google Slides
Information Technology
Data Protection Strategies template for PowerPoint & Google Slides
Information Technology
Comprehensive Data & AI Capability Model Template for PowerPoint & Google Slides
AI
Data Flywheel Strategy template for PowerPoint & Google Slides
Business
Data Privacy and Compliance in ML template for PowerPoint & Google Slides
Technology
AI and Data Ecosystem Map Template for PowerPoint & Google Slides
AI
Data Studio Insights template for PowerPoint & Google Slides
Business Report
Data Protection & Encryption in the Cloud Overview template for PowerPoint & Google Slides
Cloud Computing
Customer Data Platform Workflow Diagram Template for PowerPoint & Google Slides
Information Technology
Data-Driven Marketing Lifecycle Diagram Template for PowerPoint & Google Slides
Process
Data-Driven Decision Making overview template for PowerPoint & Google Slides
Business
First Party Data Overview Template for PowerPoint & Google Slides
Business
Data Governance Roles Pyramid Diagram Template for PowerPoint & Google Slides
Pyramid
Business Data Table Template for PowerPoint & Google Slides
Table
Colorful Business Data Comparison Table Template for PowerPoint & Google Slides
Table
Six Column Data Table Template for PowerPoint & Google Slides
Table
Data Gap Analysis Template for PowerPoint & Google Slides
Business
Data-Driven Sales Strategy Diagram Template for PowerPoint & Google Slides
Marketing
Bar Data Chart Slide for PowerPoint & Google Slides
Bar/Column
Weekly Data Chart Slide for PowerPoint & Google Slides
Comparison Chart

3D Column Chart with Data Table for PowerPoint & Google Slides
Bar/Column

Cone Data Chart for PowerPoint & Google Slides
Charts
4 Business Data Infographics Diagram for PowerPoint & Google Slides
Process
Data-Driven Line Chart Diagram Template for PowerPoint
Comparison Chart
Clustered Column Chart Data Analysis Template for PowerPoint
Bar/Column
Free Data Analytics Dashboard Template for PowerPoint
Charts
Free
Google Ads Optimization & Performance Infographic Template for PowerPoint & Google Slides
Digital Marketing
Six Double Diamond Infographic Slides Template for PowerPoint & Google Slides
Process
Agenda Infographic Pack of 2 Slides Template for PowerPoint & Google Slides
Agenda
Quad Chart Infographic Pack of 8 Slides Template for PowerPoint & Google Slides
Comparison Chart
Four Options Infographic Slides Template for PowerPoint & Google Slides
Comparison
Game Plan Infographic Slides Pack Template for PowerPoint & Google Slides
Infographics