Circular Improvement Process Diagram Template for PowerPoint & Google Slides
Description
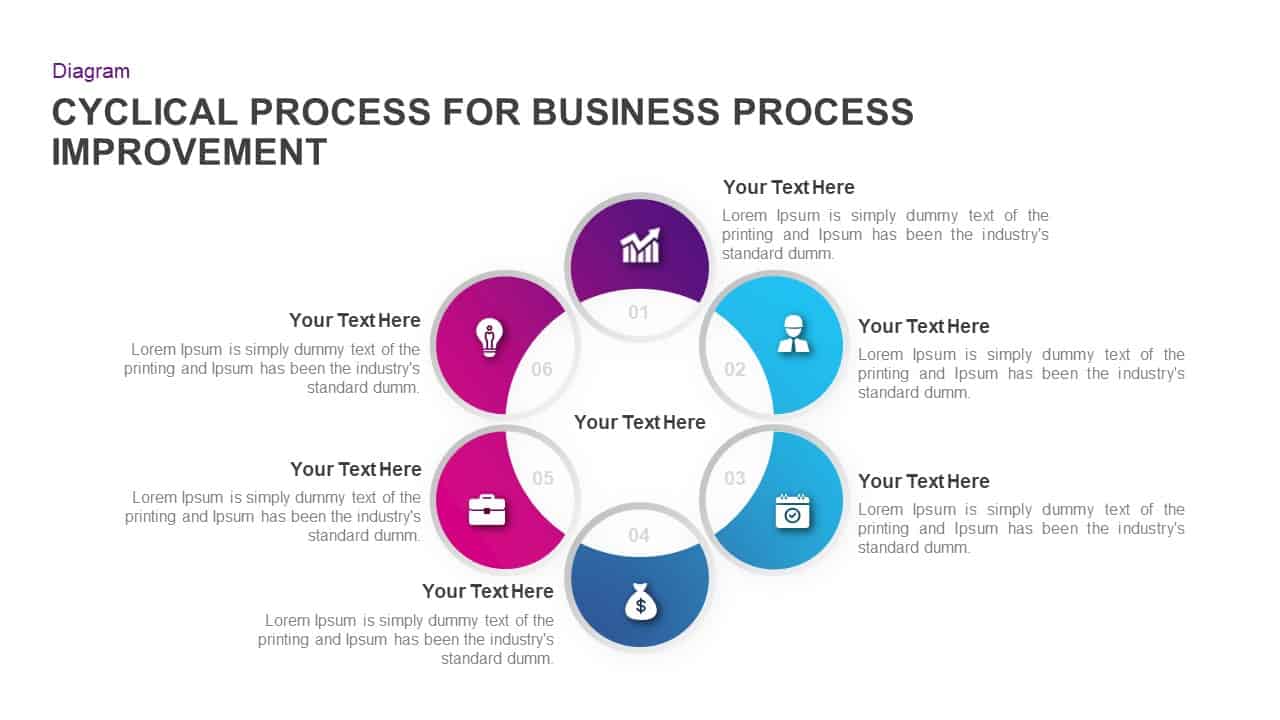
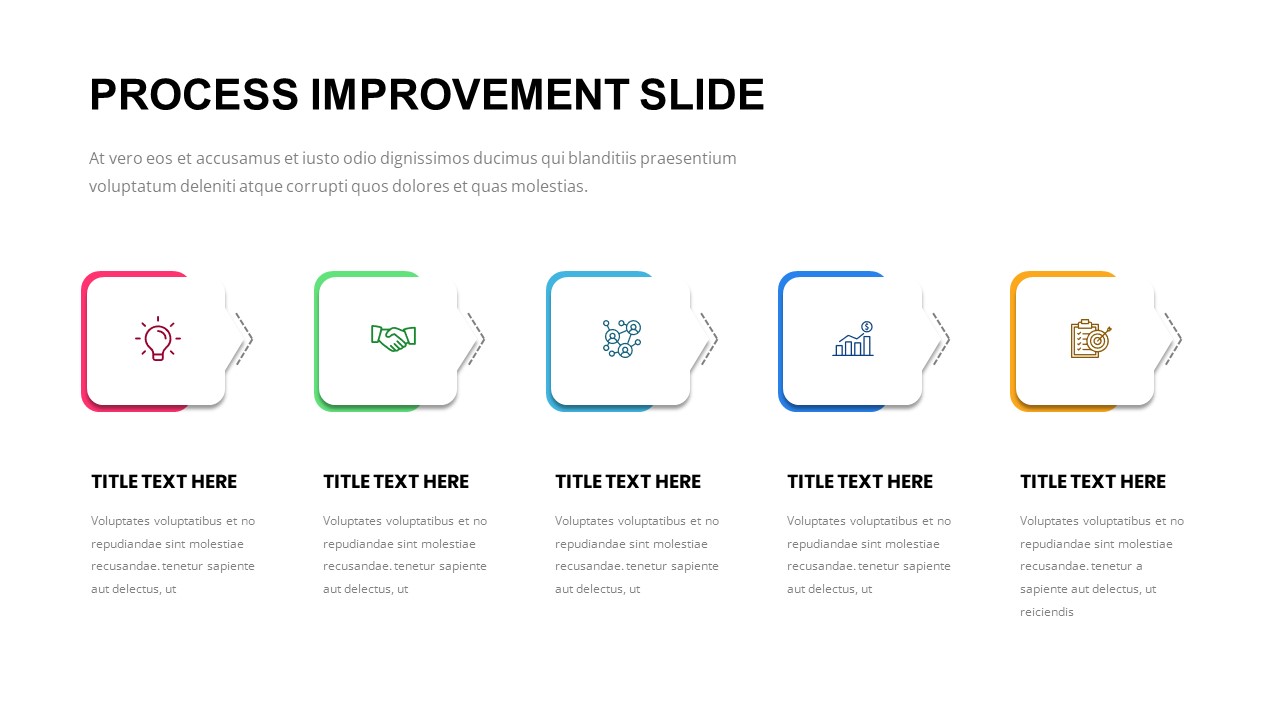
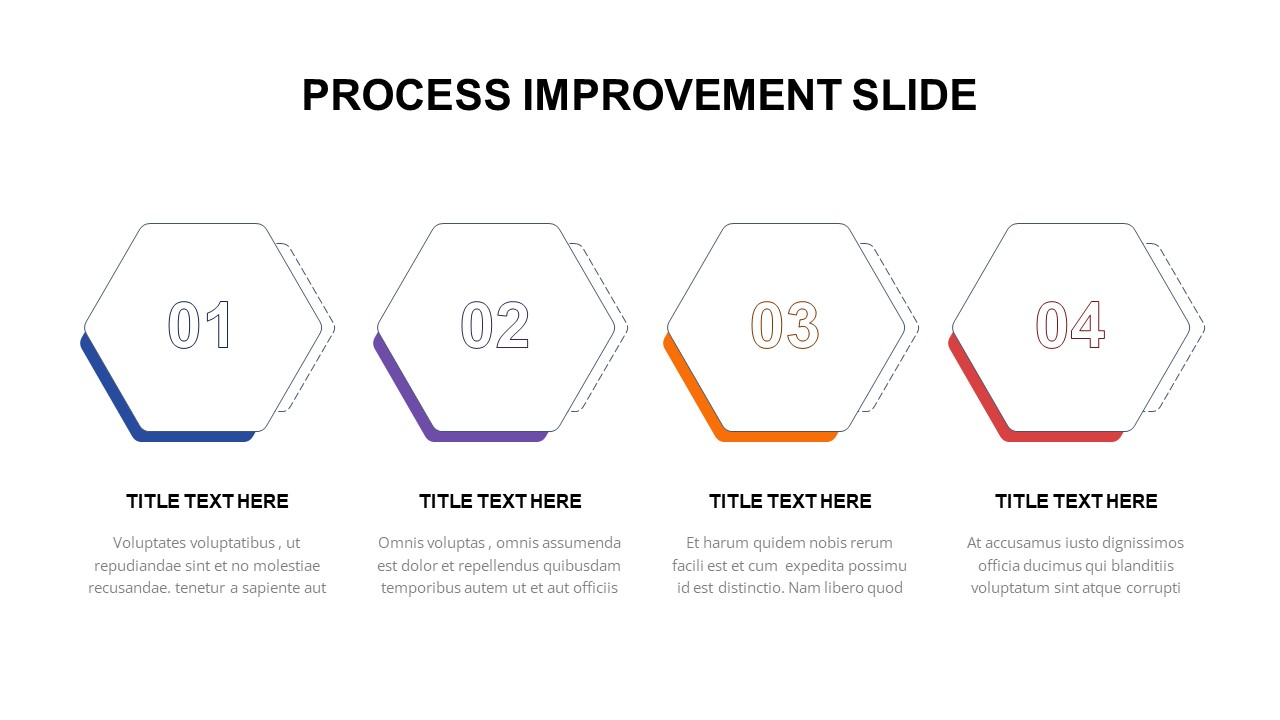
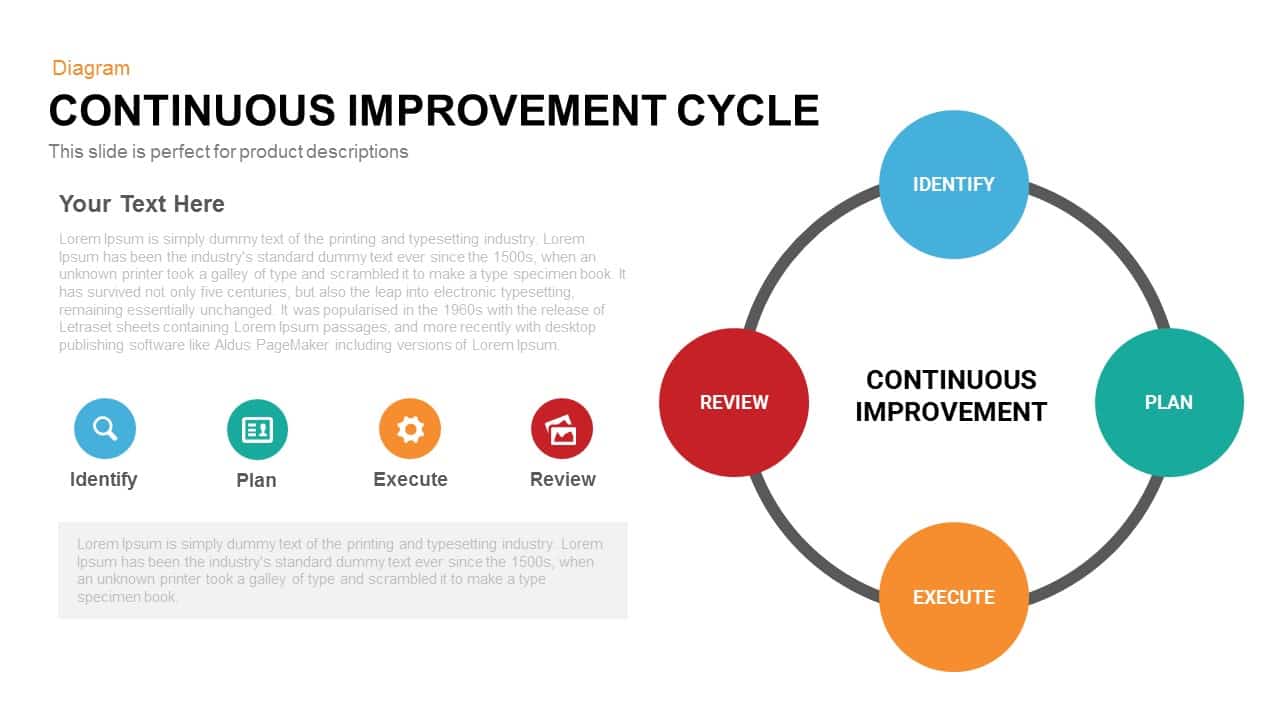
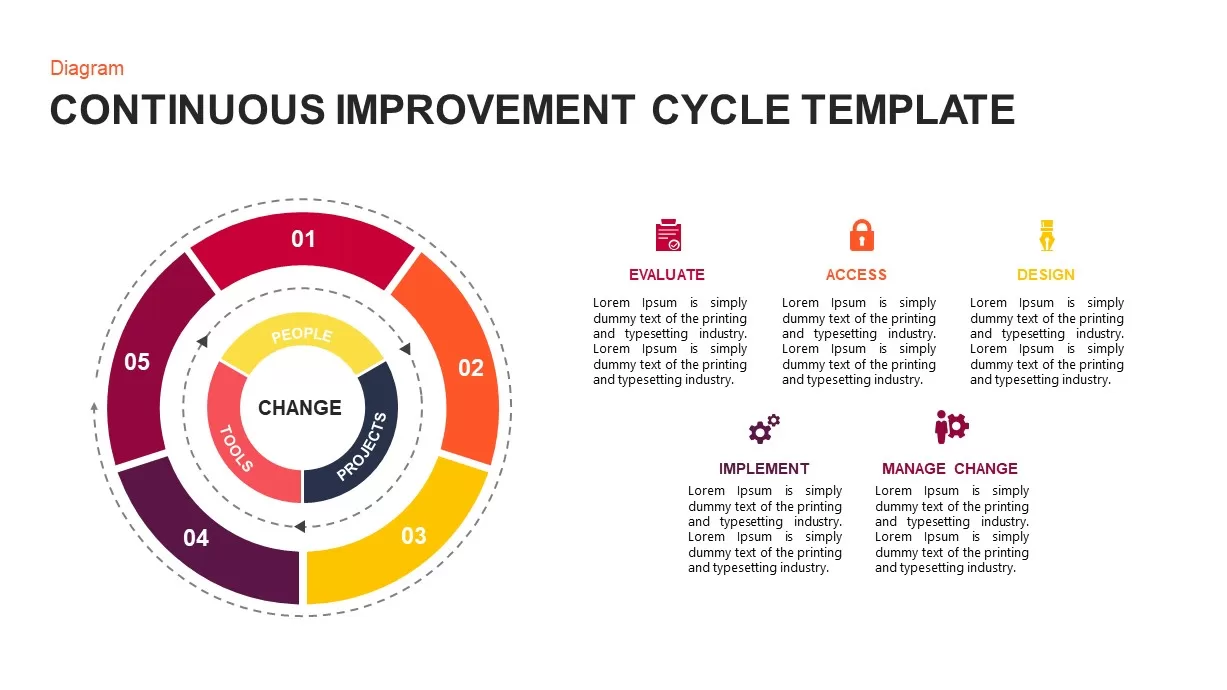
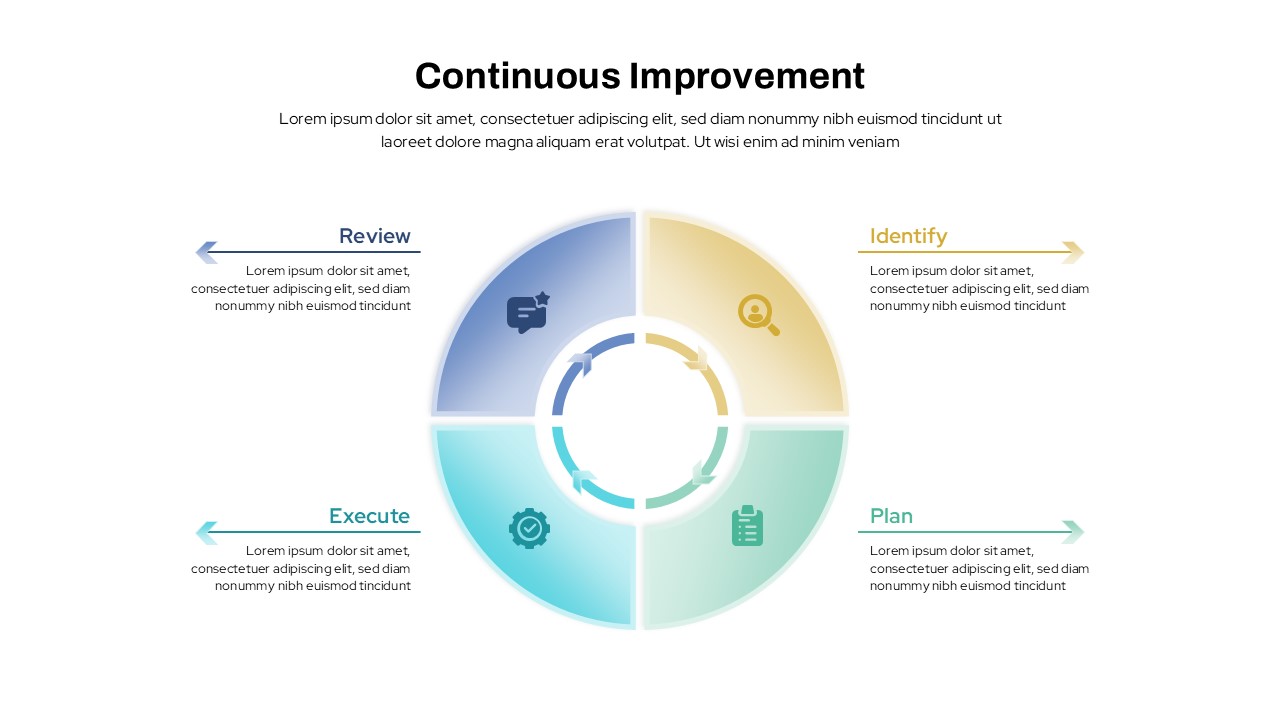
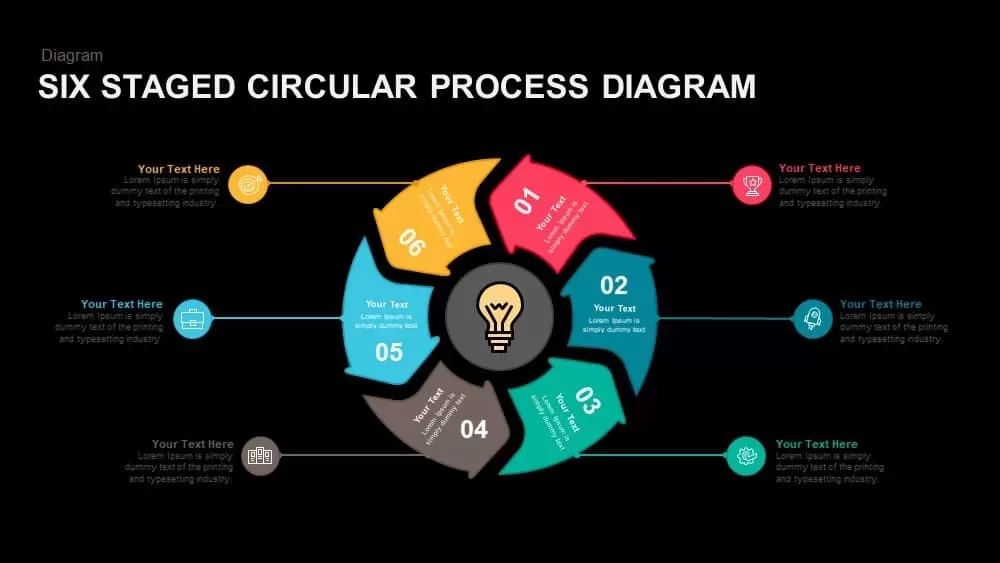
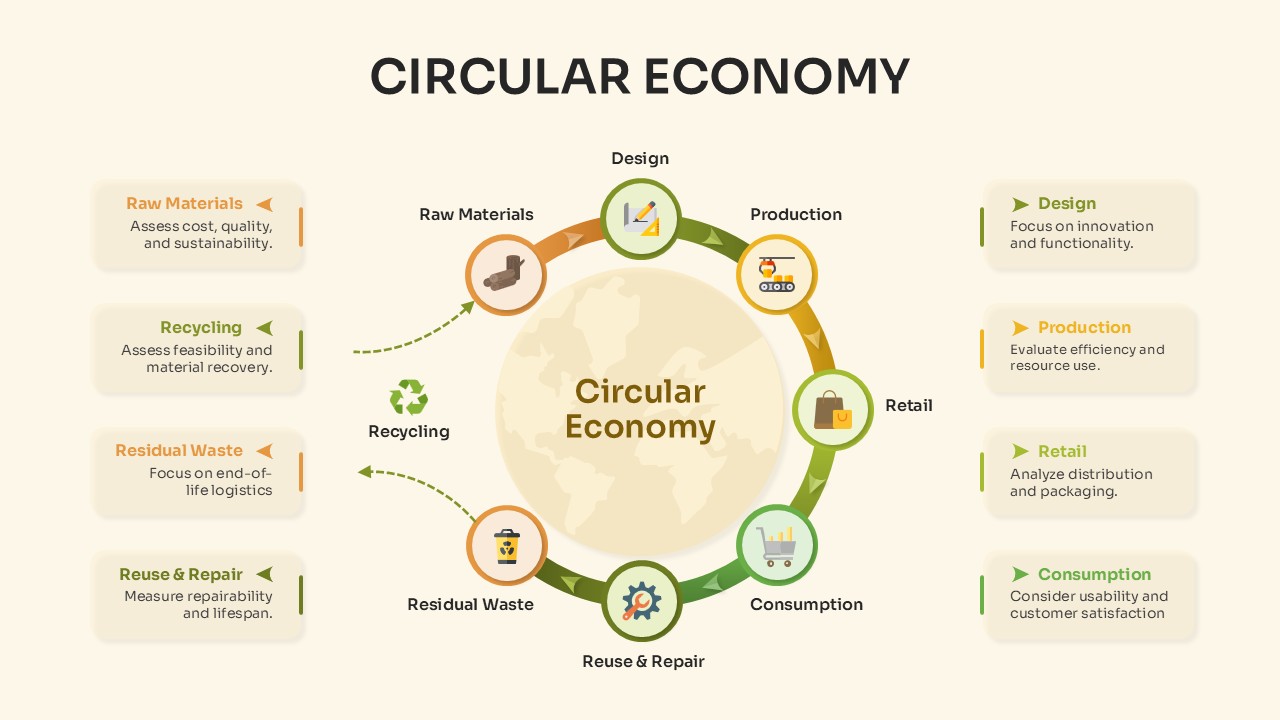
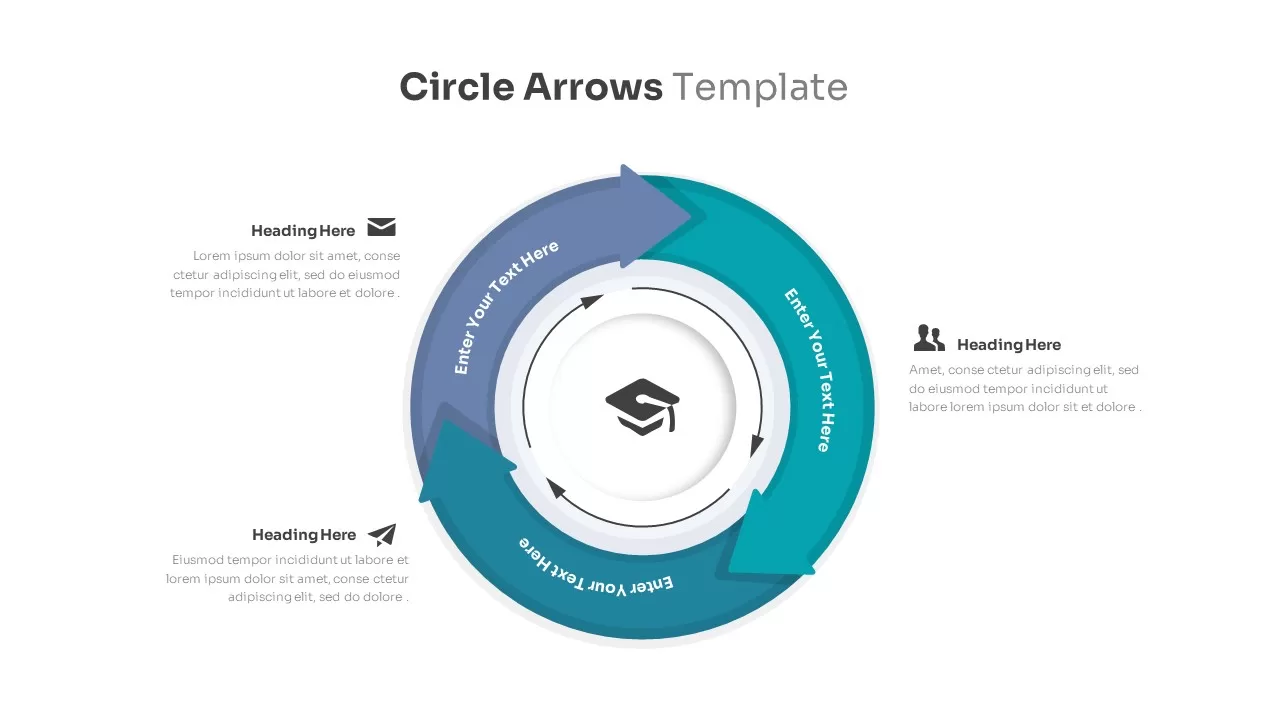
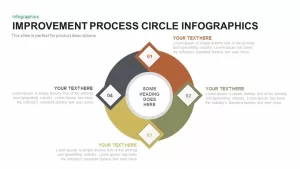
Leverage this dynamic circular improvement process slide to visualize iterative performance enhancements and workflow optimizations with clarity and impact. Six evenly spaced arrowed segments form a seamless loop around a central hub, each numbered 01–06 and color-coded by default for clear differentiation. Each segment includes an editable vector icon placeholder, bold headline, and concise text block to highlight key improvement steps—such as analysis, planning, execution, evaluation, adjustment, and reinforcement. Built entirely with scalable vector shapes on master slides, you can swap icons from the embedded 50+ symbol library, recolor segments to match your brand palette, adjust segment angles or sizes, and modify typography without loss of fidelity. Precision snap-to-grid alignment guides and optional drop shadows maintain perfect symmetry and subtle depth, while generous white space preserves a modern, uncluttered aesthetic. Intuitive placeholders streamline content updates, and the modular framework lets you duplicate or remove segments to tailor the cycle length. Optimized for both PowerPoint and Google Slides, this template preserves high-definition clarity across devices and supports collaborative, cloud-based editing.
Who is it for
Process consultants, project managers, quality-improvement teams, operations leads, and business analysts will benefit from this slide when mapping continuous improvement cycles, Kaizen workflows, or iterative project enhancements in executive briefings and stakeholder workshops.
Other Uses
Repurpose this diagram for performance-review cycles, training-module iterations, product-development loops, risk-mitigation plans, or customer-journey optimizations. Simply update labels, icons, and colors to suit any multi-step narrative.
Login to download this file

Item ID
SB00605
Related Templates

Process Improvement Metaphor Diagram Template for PowerPoint & Google Slides
Process

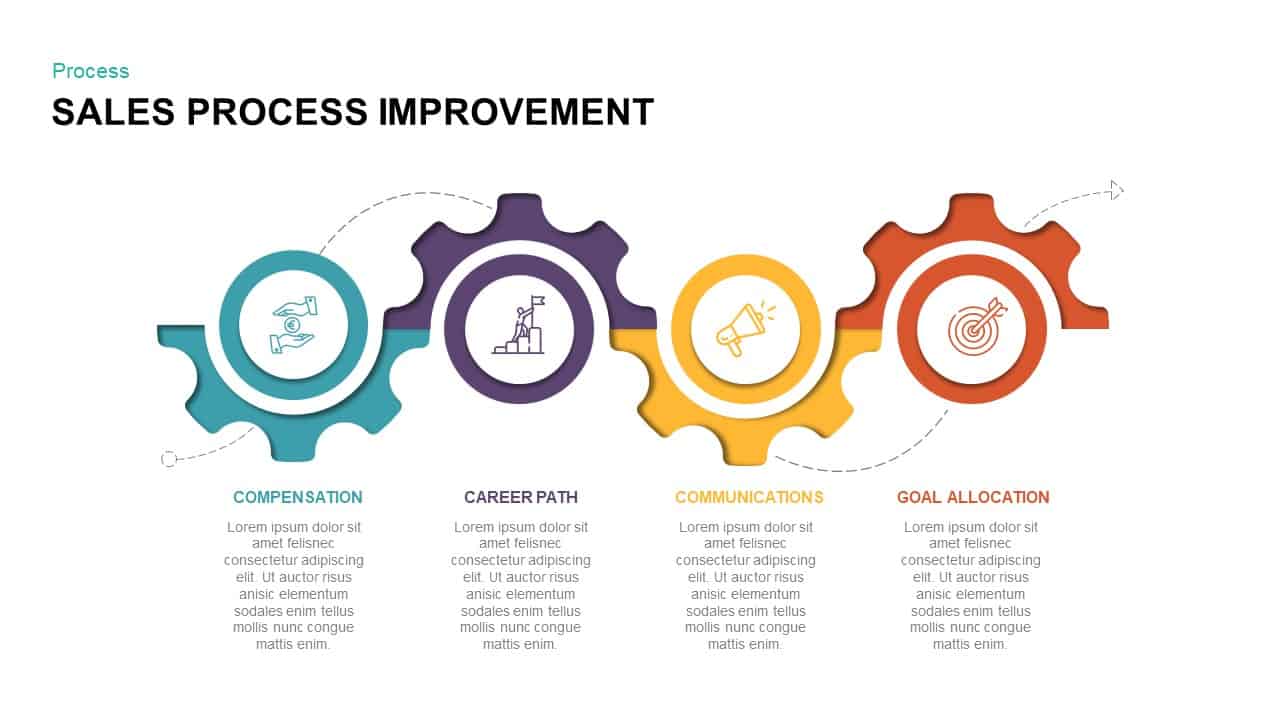
Sales Process Improvement Gear Diagram Template for PowerPoint & Google Slides
Process
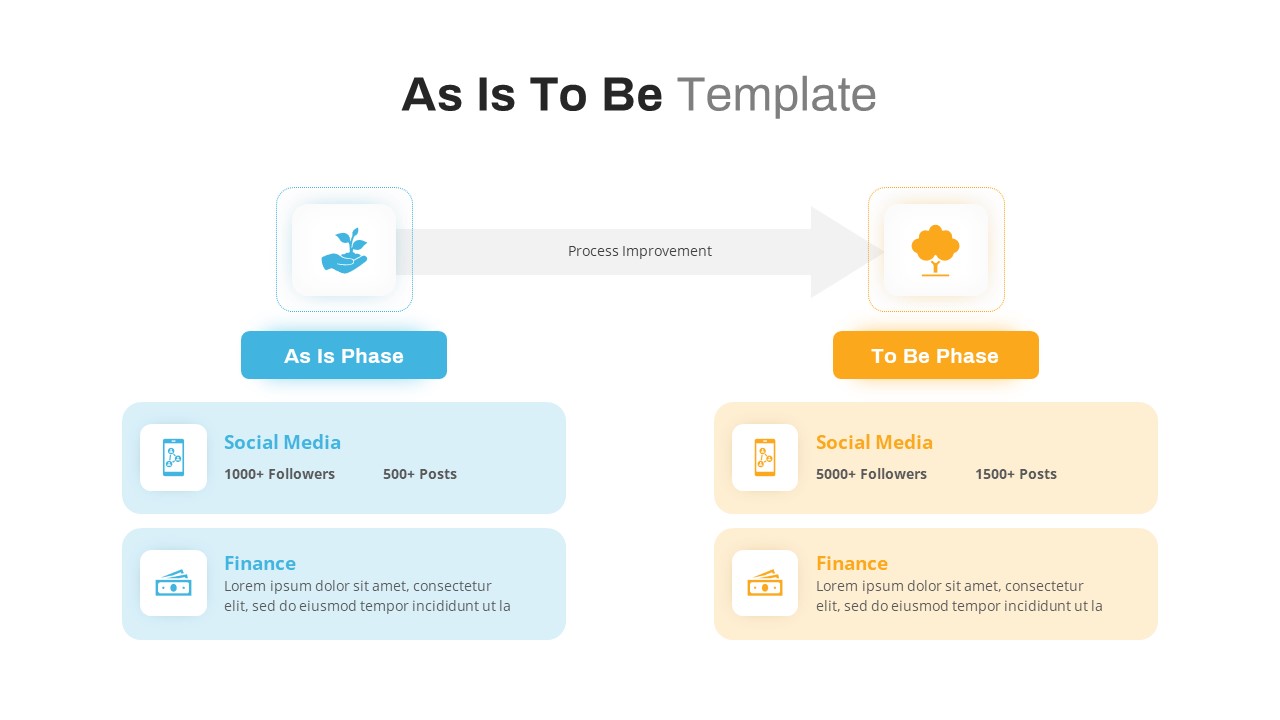
As Is to Be Process Improvement Diagram Template for PowerPoint & Google Slides
Business Strategy
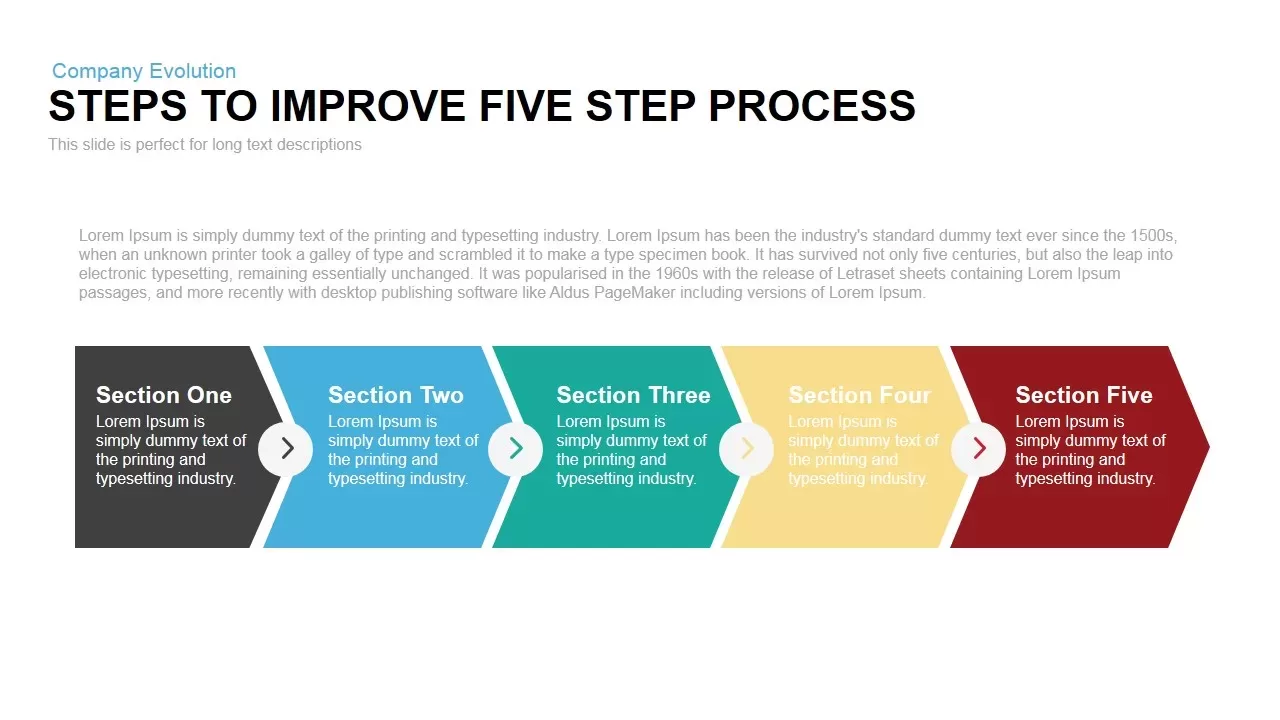
Five-Step Process Improvement Template for PowerPoint & Google Slides
Process

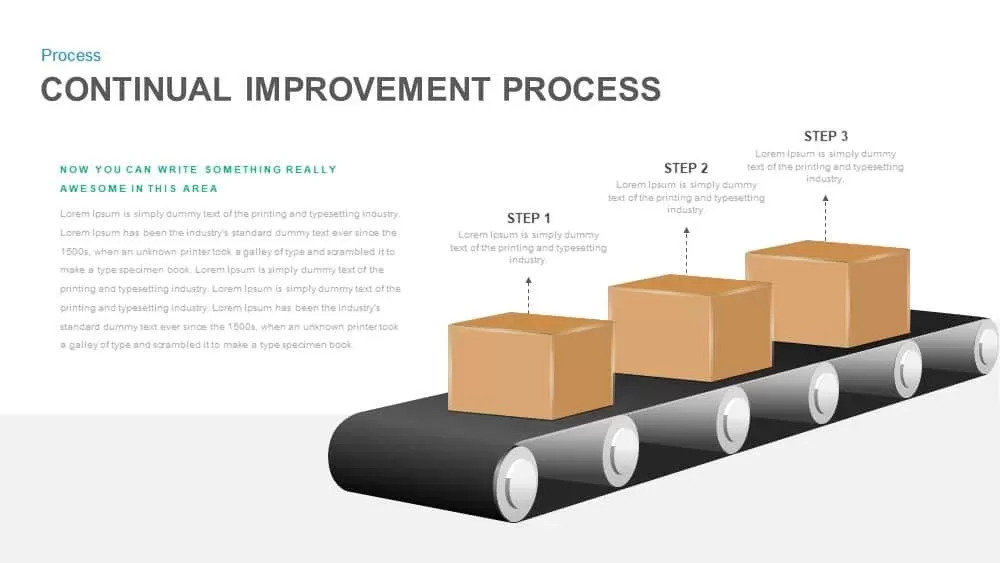
Continual Improvement Process Conveyor Template for PowerPoint & Google Slides
Process
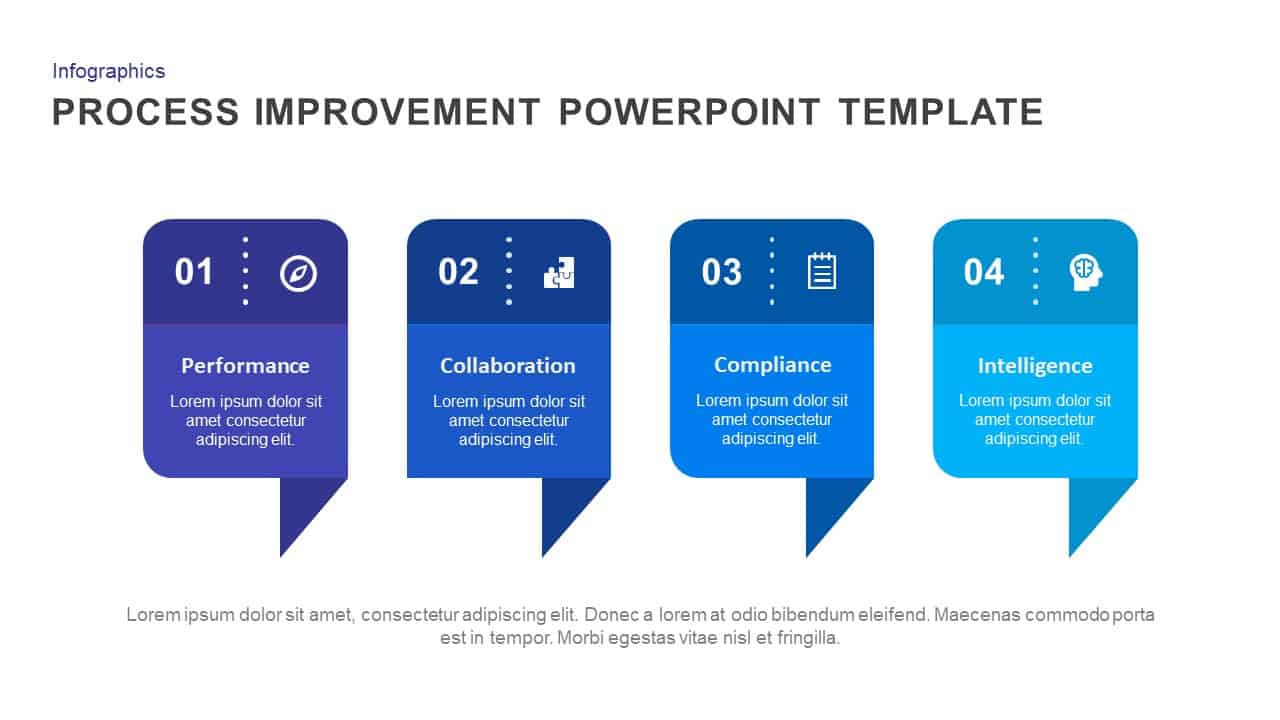
Process Improvement template for PowerPoint & Google Slides
Process
Business Process Improvement Cycle Template for PowerPoint & Google Slides
Process
Business Process Improvement Cycle Template for PowerPoint & Google Slides
Circular

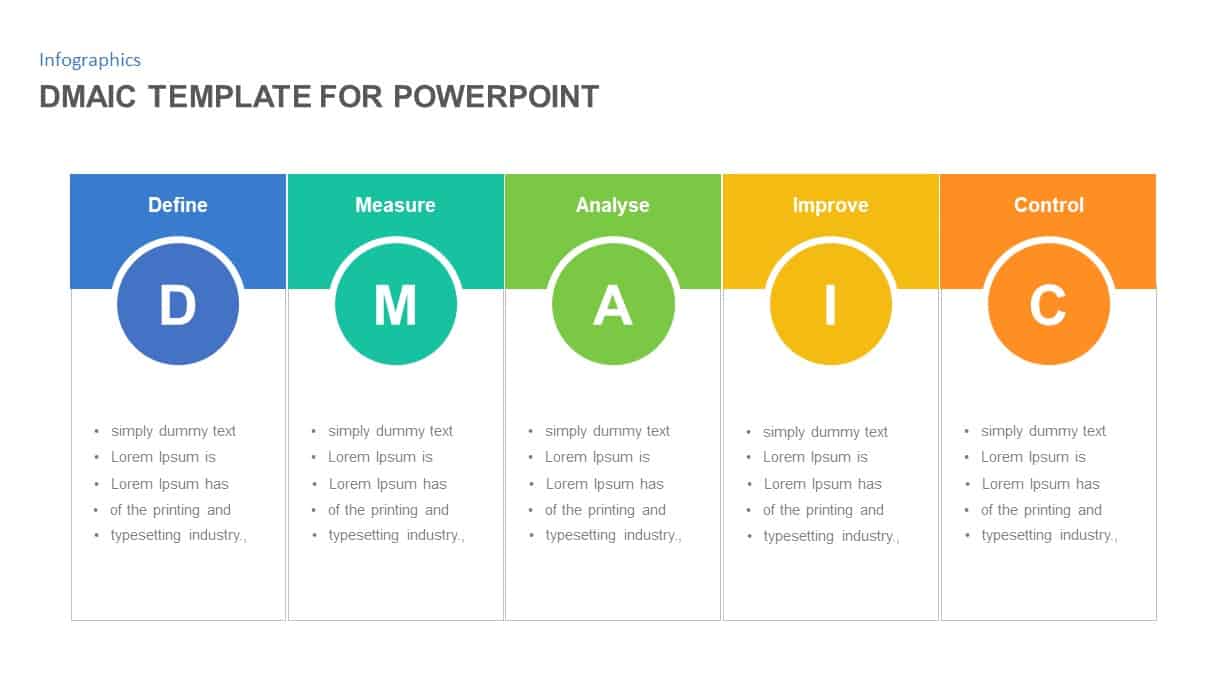
DMAIC Process Improvement Infographic Template for PowerPoint & Google Slides
Process
Process improvement roadmap template for PowerPoint & Google Slides
Process
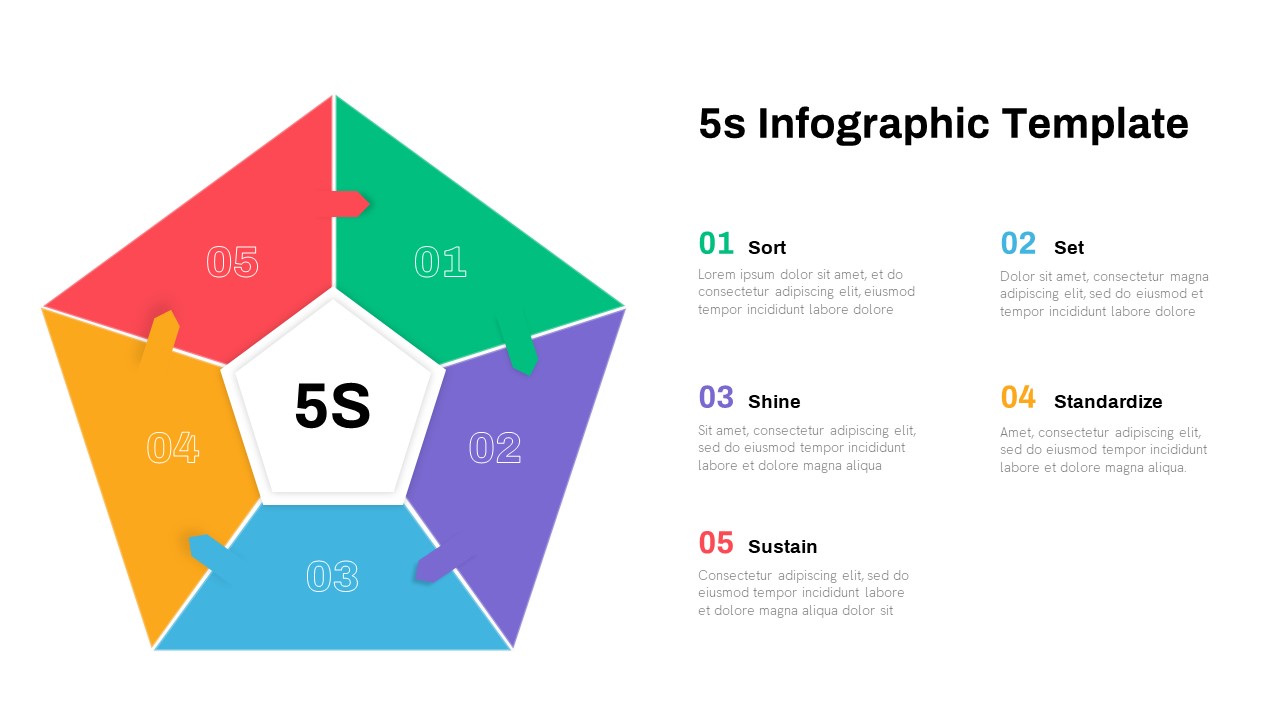
5S Lean Process Improvement Infographic Template for PowerPoint & Google Slides
Business Strategy
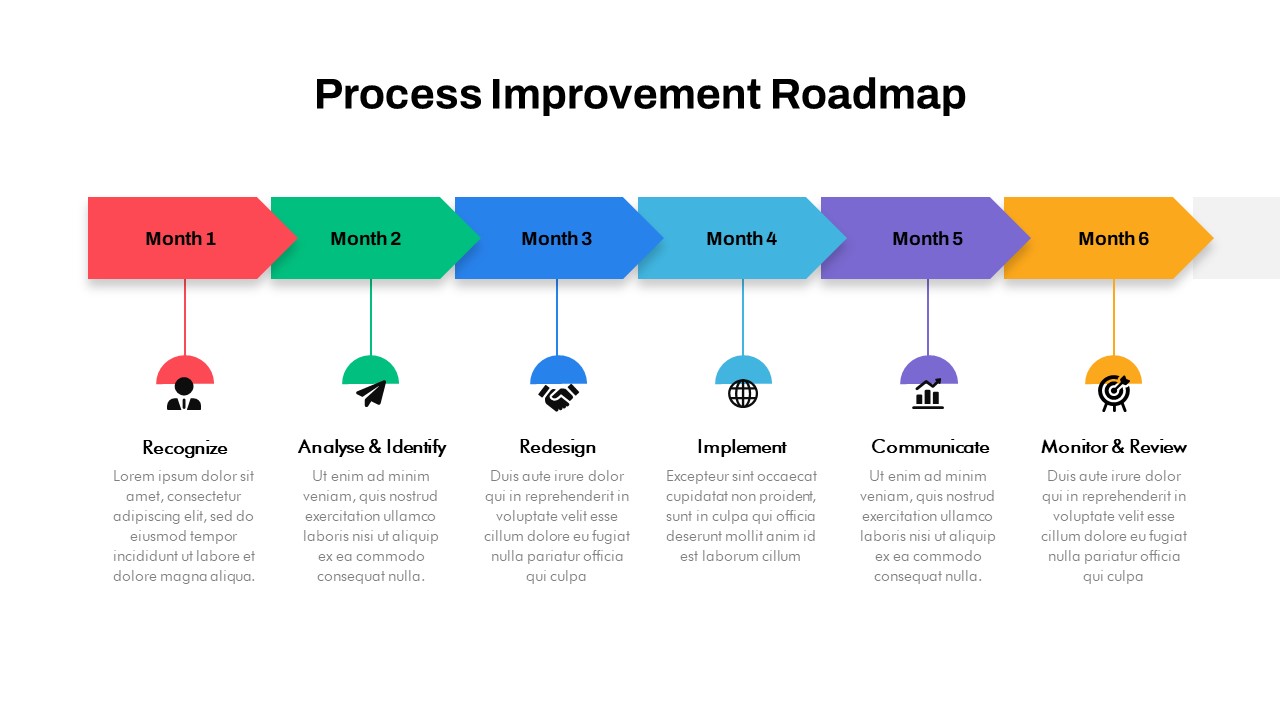
Process Improvement Roadmap Template for PowerPoint & Google Slides
Infographics
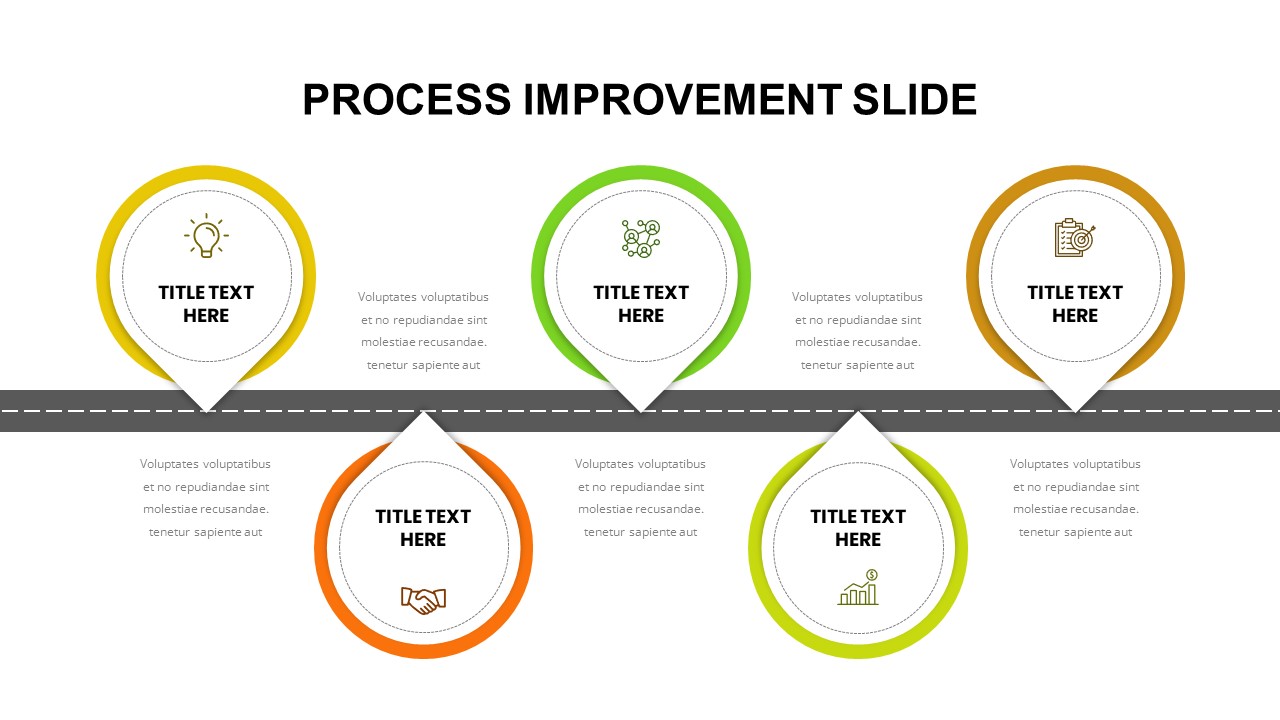
Process Improvement Slide for PowerPoint & Google Slides
Business Proposal
4 Step Process Improvement for PowerPoint & Google Slides
Process
Continuous Improvement Cycle Diagram Template for PowerPoint & Google Slides
Circular
Continuous Improvement Cycle Diagram Template for PowerPoint & Google Slides
Process
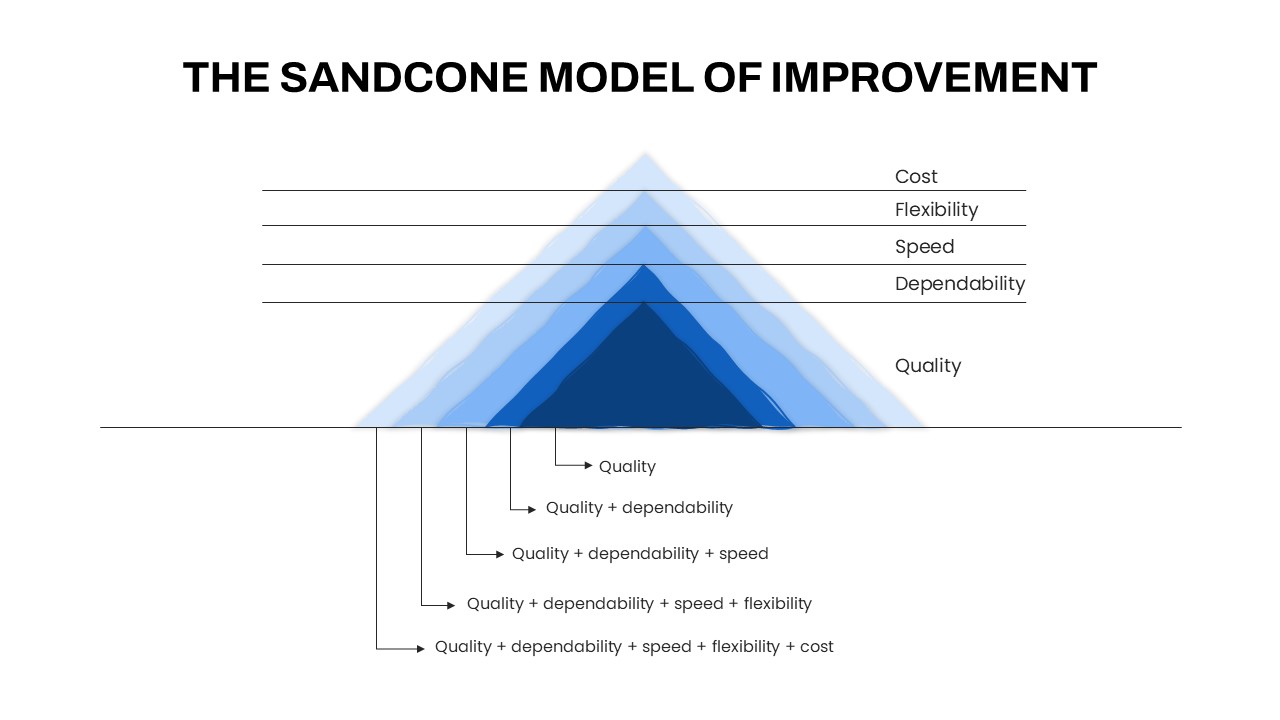
Sandcone Model of Improvement Diagram Template for PowerPoint & Google Slides
Pyramid
Continuous Improvement Cycle Diagram Template for PowerPoint & Google Slides
Process
Improvement Growth Arrow Metaphor Template for PowerPoint & Google Slides
Bar/Column
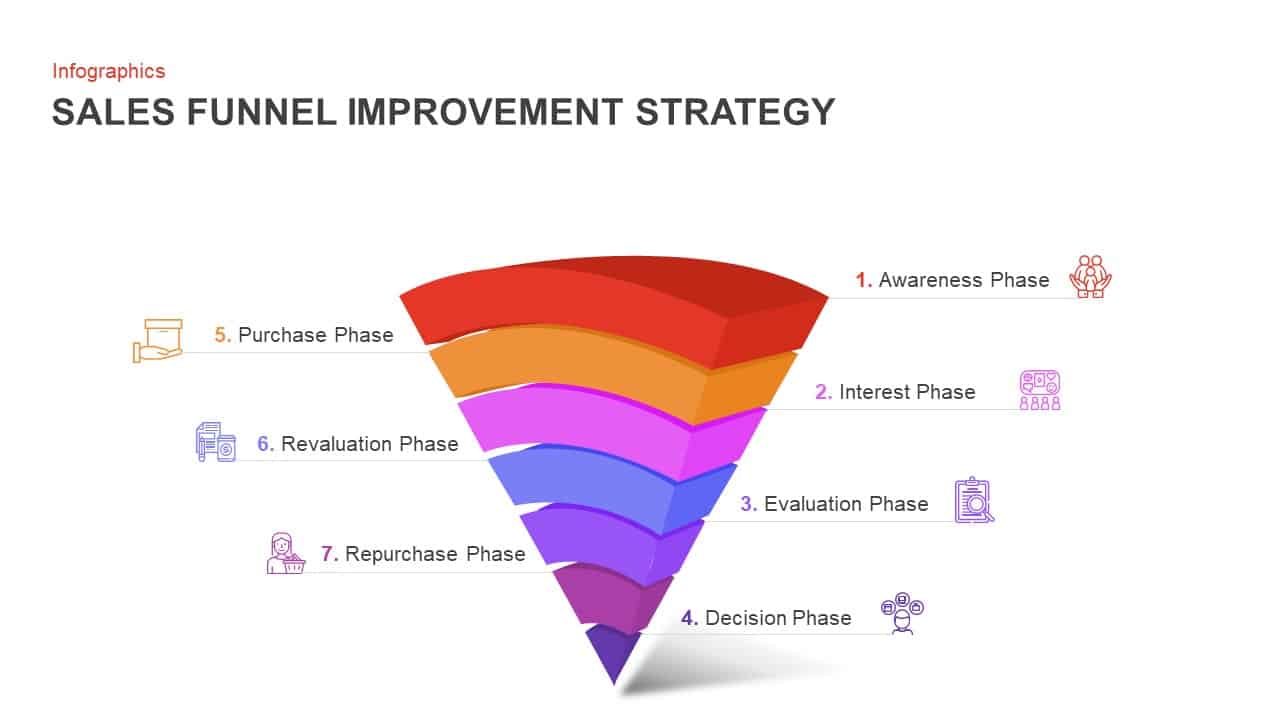
7-Step Sales Funnel Improvement Strategy Template for PowerPoint & Google Slides
Infographics
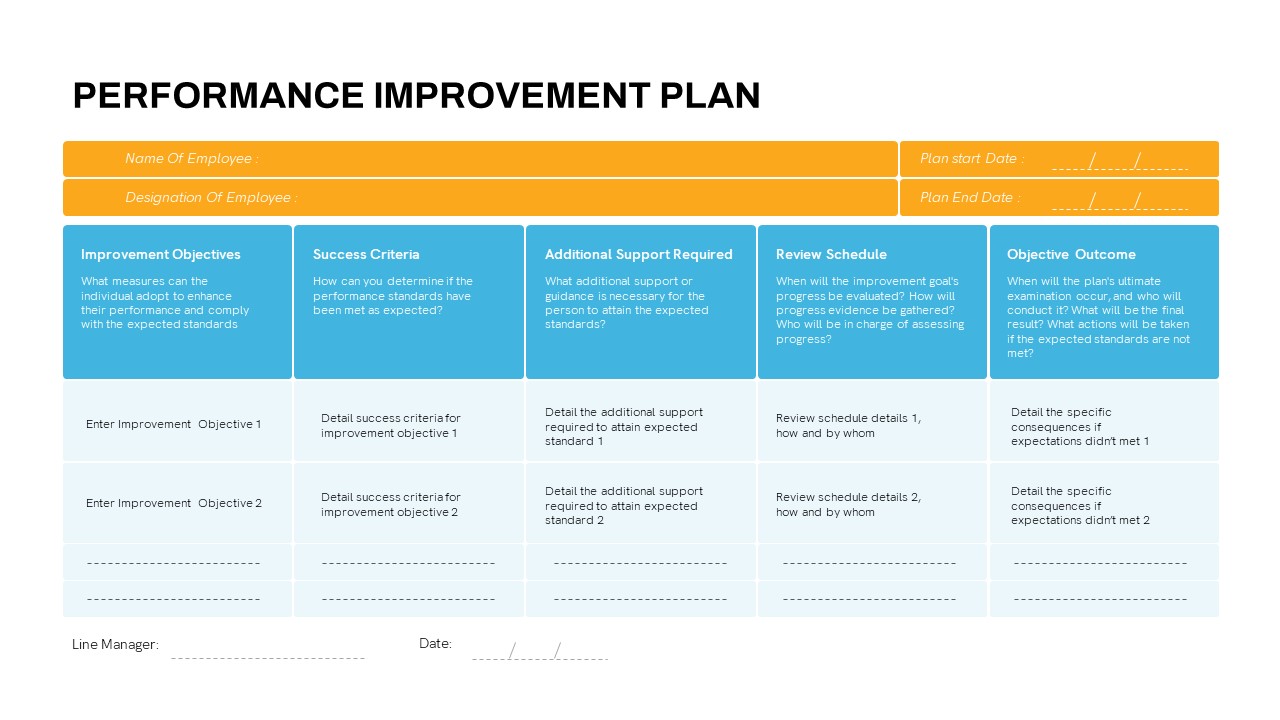
Detailed Performance Improvement Plan Template for PowerPoint & Google Slides
Employee Performance
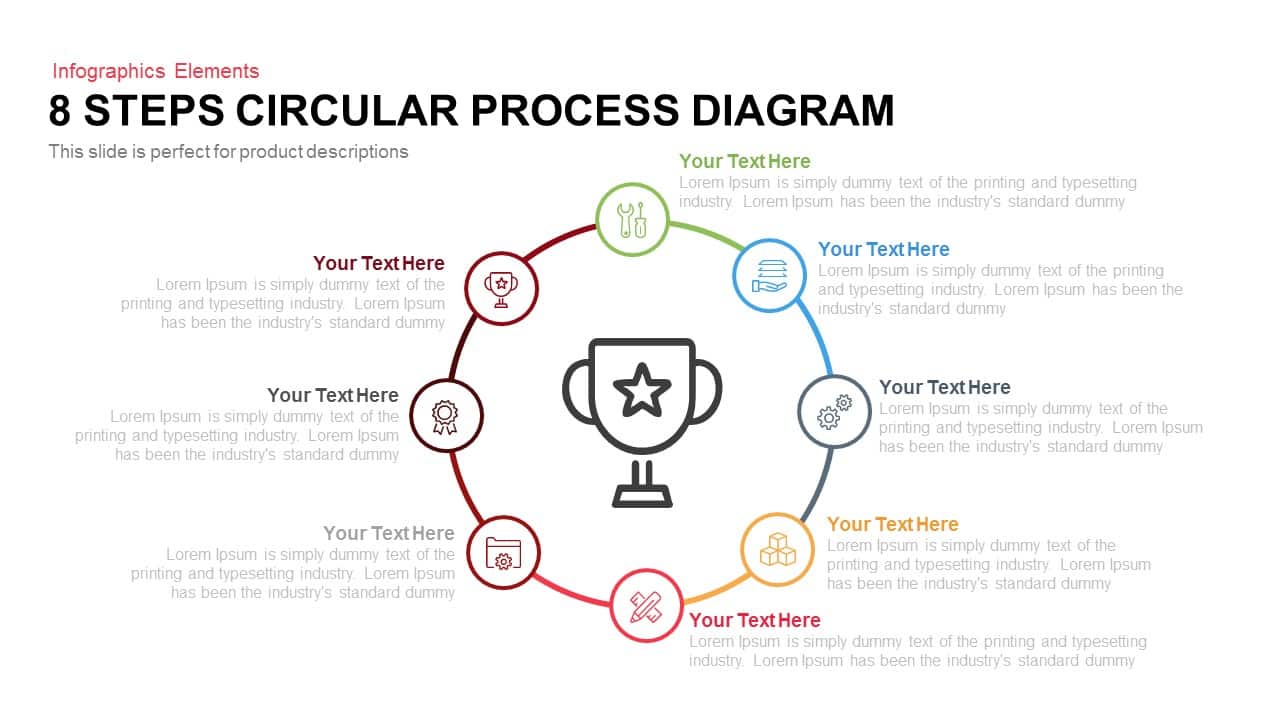
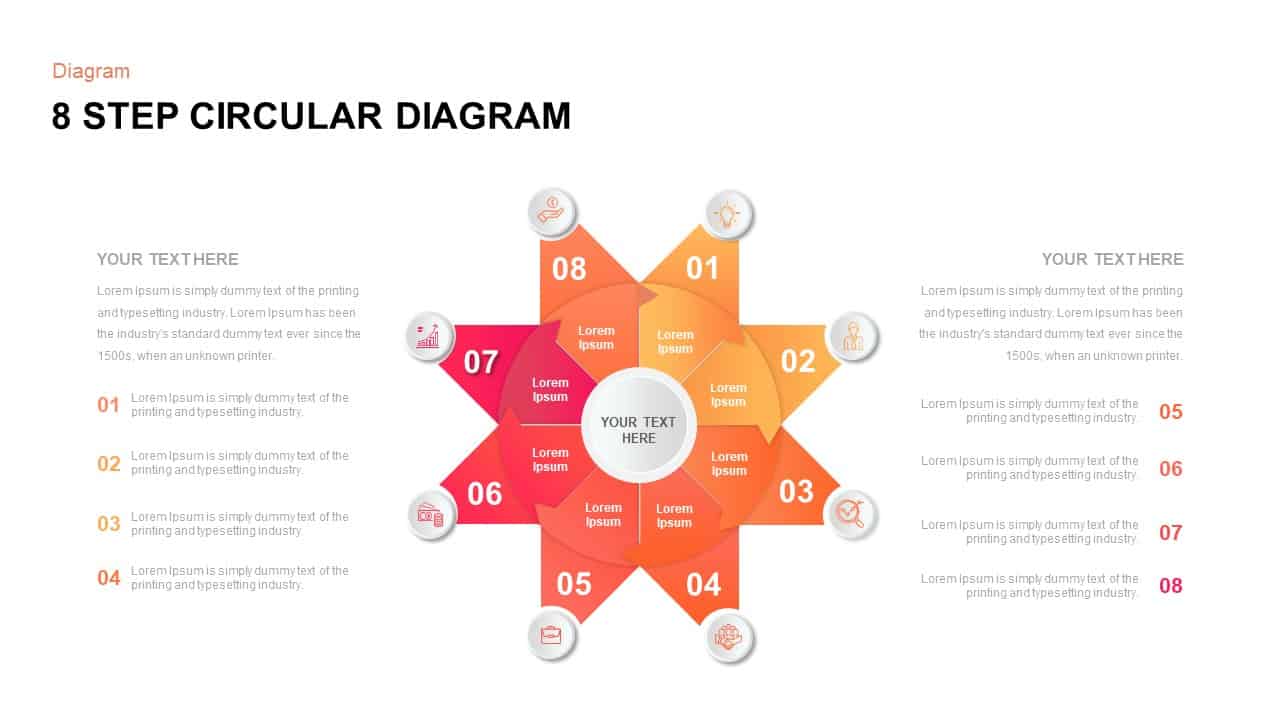
8 Steps Circular Process Diagram Template for PowerPoint & Google Slides
Process
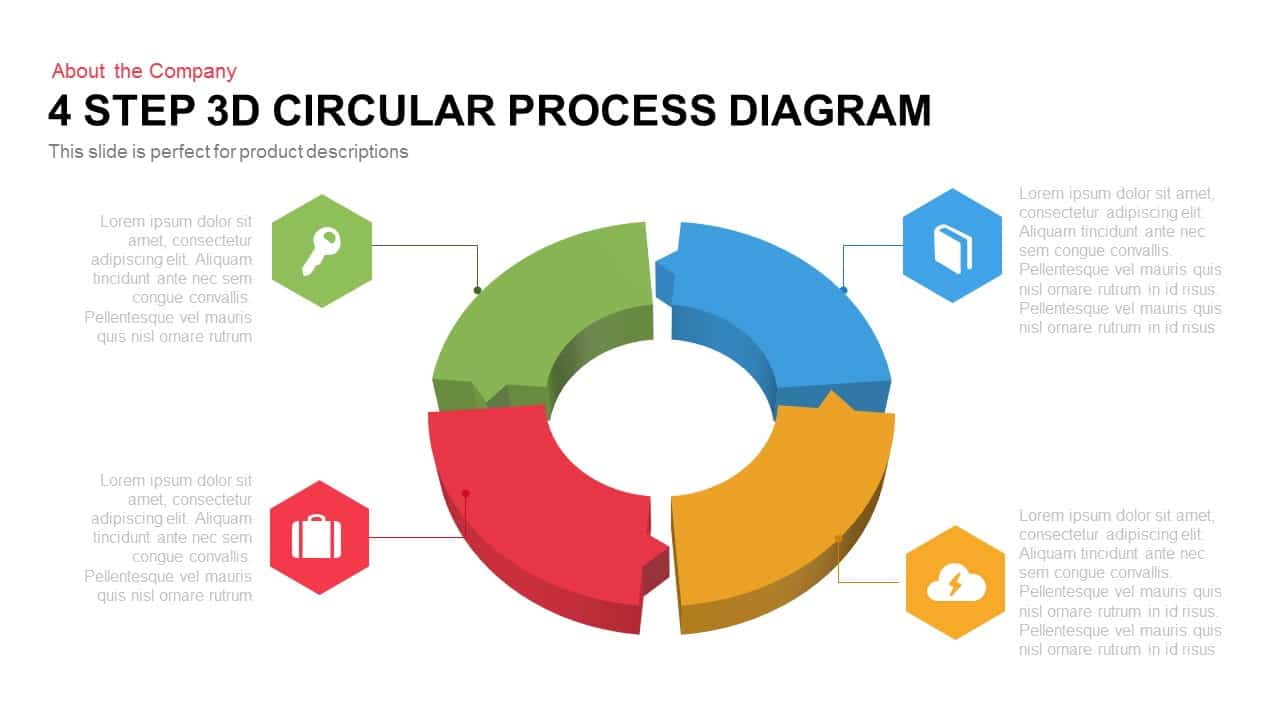
4 Step 3D Circular Process Diagram template for PowerPoint & Google Slides
Process
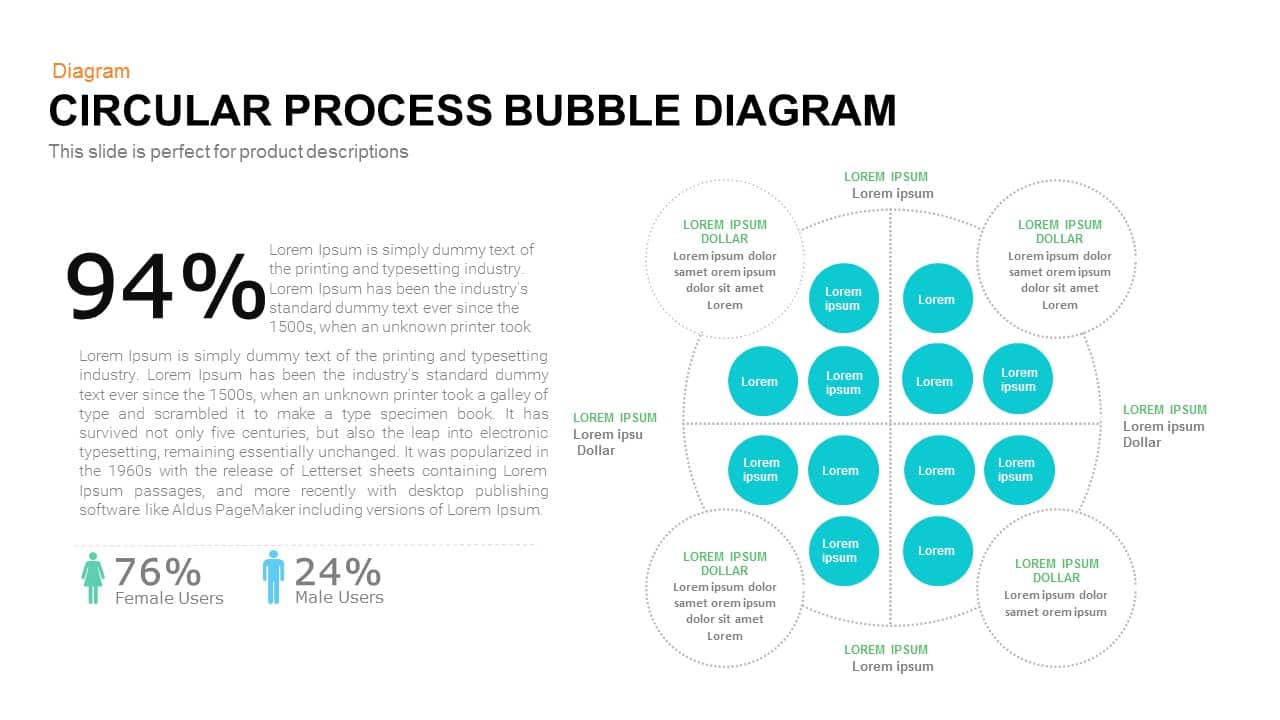
Bubble Circular Process Diagram Template for PowerPoint & Google Slides
Process

Six-Process Circular Arrow Diagram Template for PowerPoint & Google Slides
Circular
Six-Stage Circular Process Diagram Template for PowerPoint & Google Slides
Process
9-Step Circular Arrows Process Diagram Template for PowerPoint & Google Slides
Process
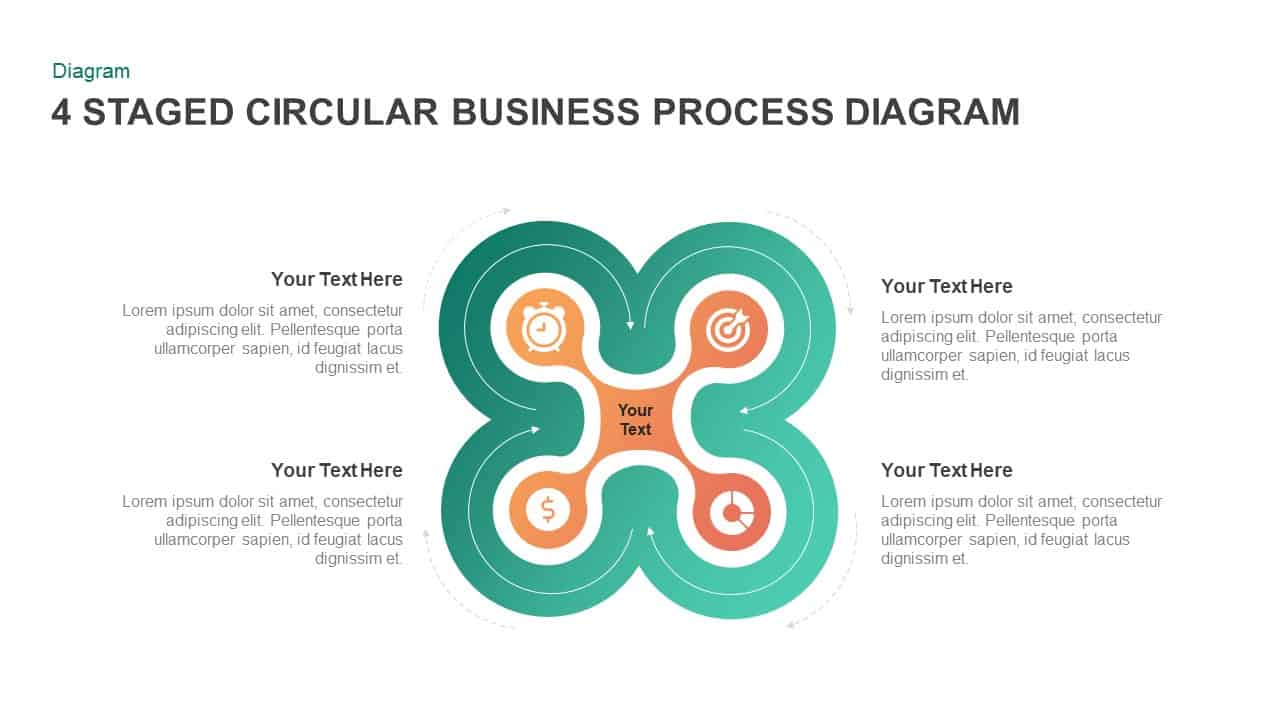
4 Staged Circular Business Process Diagram template for PowerPoint & Google Slides
Process
Six-Stage Circular Diagram Process Template for PowerPoint & Google Slides
Circular
Five-Stage Circular Process Diagram Template for PowerPoint & Google Slides
Circular
8 Steps Circular Process Diagram Template for PowerPoint & Google Slides
Circular
Five-Stage Circular Process Flow Diagram Template for PowerPoint & Google Slides
Circular
Five-Step Circular Process Diagram Template for PowerPoint & Google Slides
Circular
Circular CRM Process Diagram Infographic Template for PowerPoint & Google Slides
Circular
8 Step Circular Process Flow Diagram Template for PowerPoint & Google Slides
Process
6-Step Circular Process Flow Diagram Template for PowerPoint & Google Slides
Process
Value Chain Circular Process Diagram Template for PowerPoint & Google Slides
Business Models
Circular CRM Process Infographic Diagram Template for PowerPoint & Google Slides
Circular
Circular Arrow Process Diagram Template for PowerPoint & Google Slides
Circular
10-Step Circular Process Diagram Template for PowerPoint & Google Slides
Process
10-Step Circular Process Diagram Template for PowerPoint & Google Slides
Process
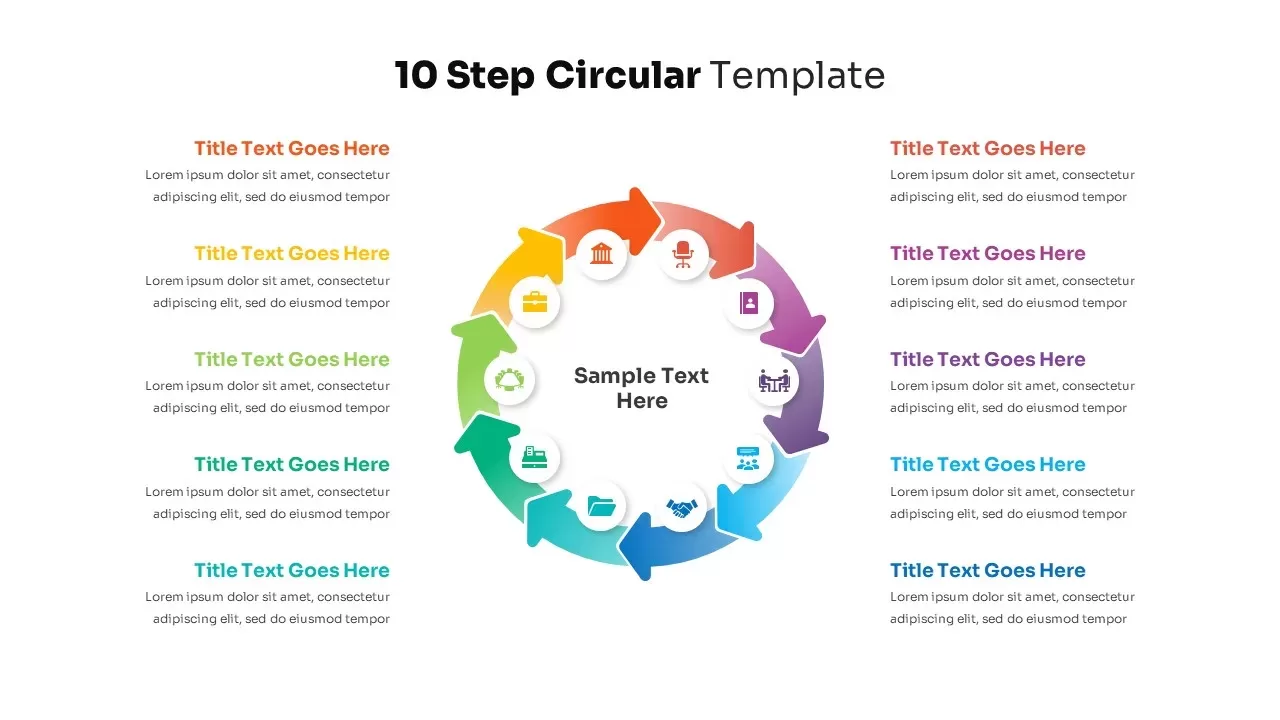
10 Step Circular Process Diagram Template for PowerPoint & Google Slides
Circular
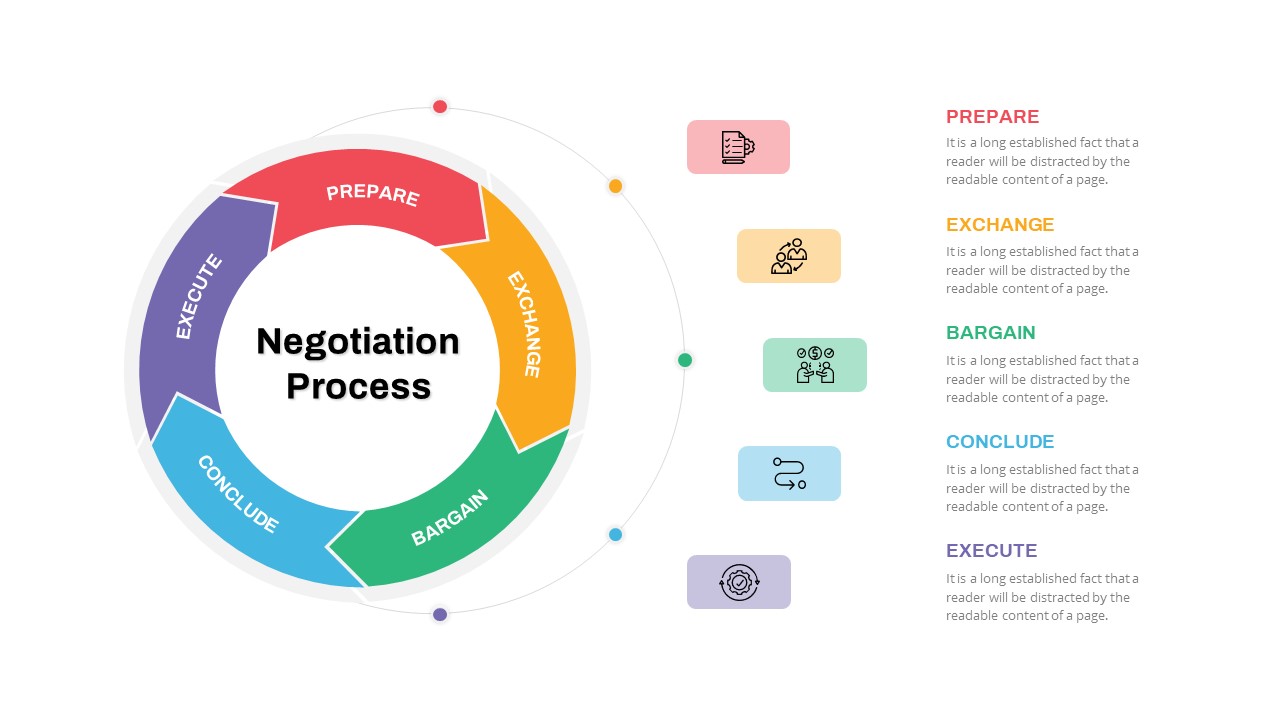
Negotiation Process Circular Diagram Template for PowerPoint & Google Slides
Circular
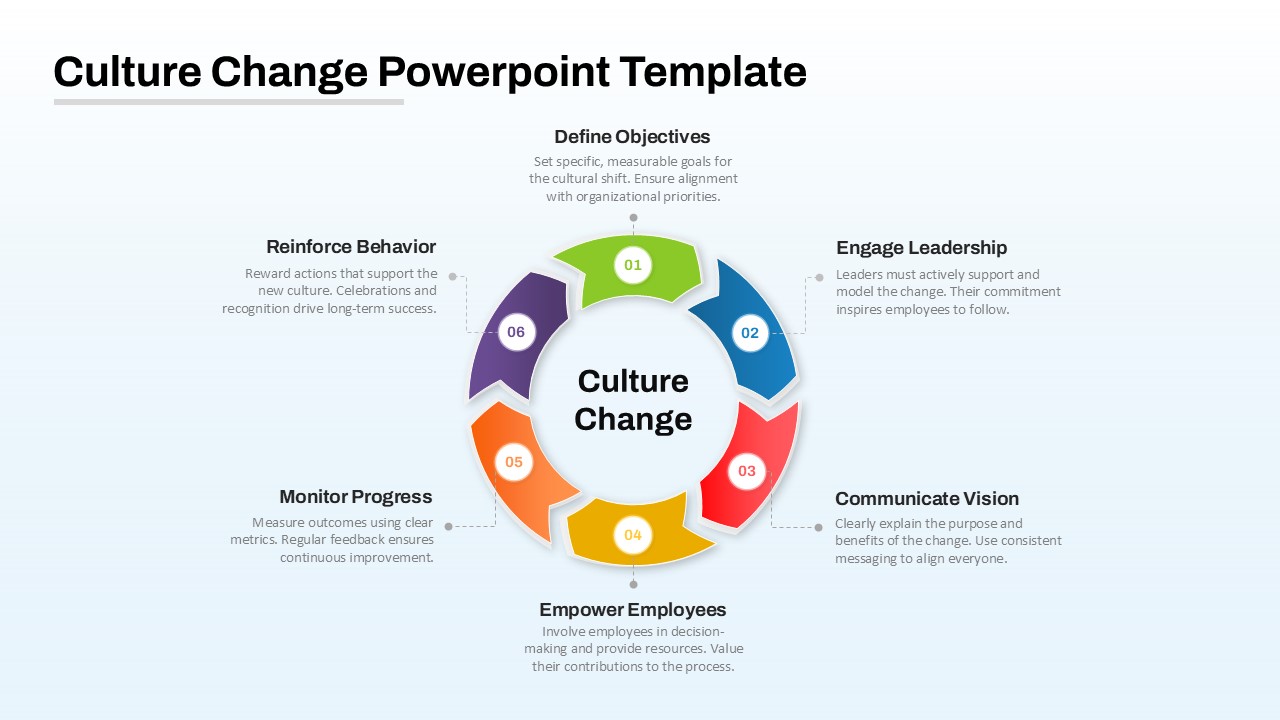
Culture Change Circular Process Diagram Template for PowerPoint & Google Slides
Process
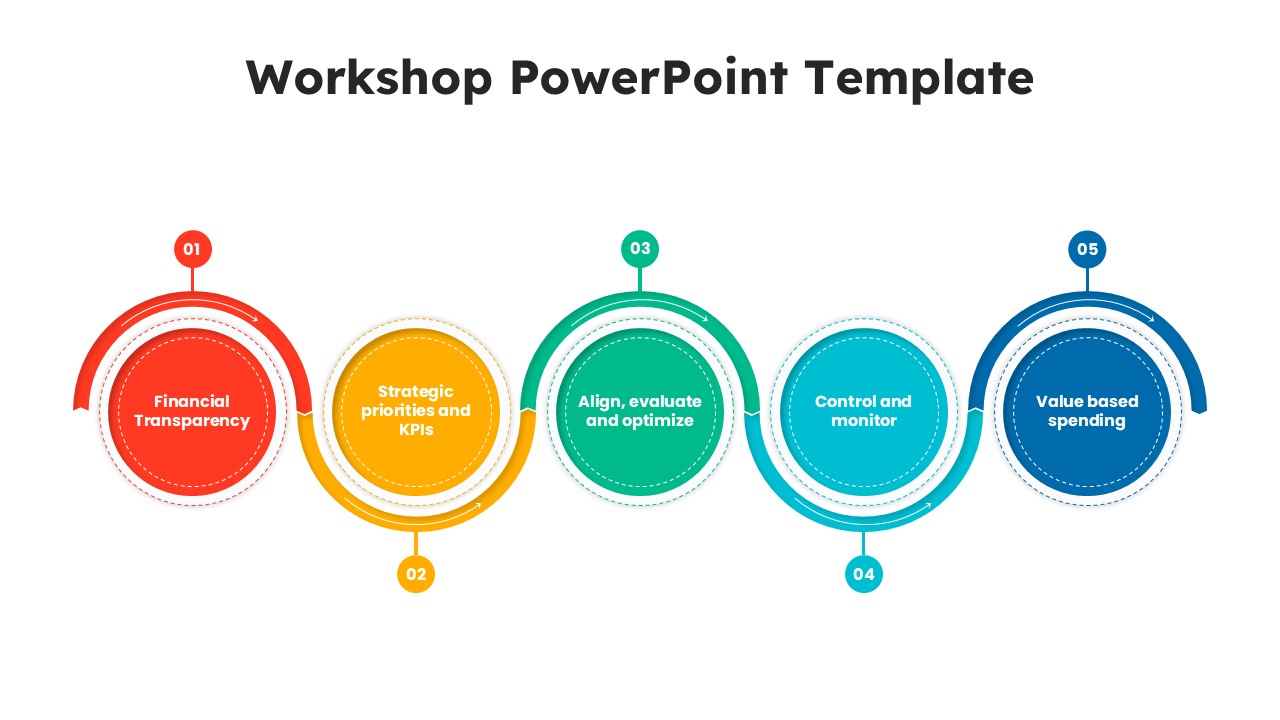
Workshop 5-Step Circular Process Diagram Template for PowerPoint & Google Slides
Circular
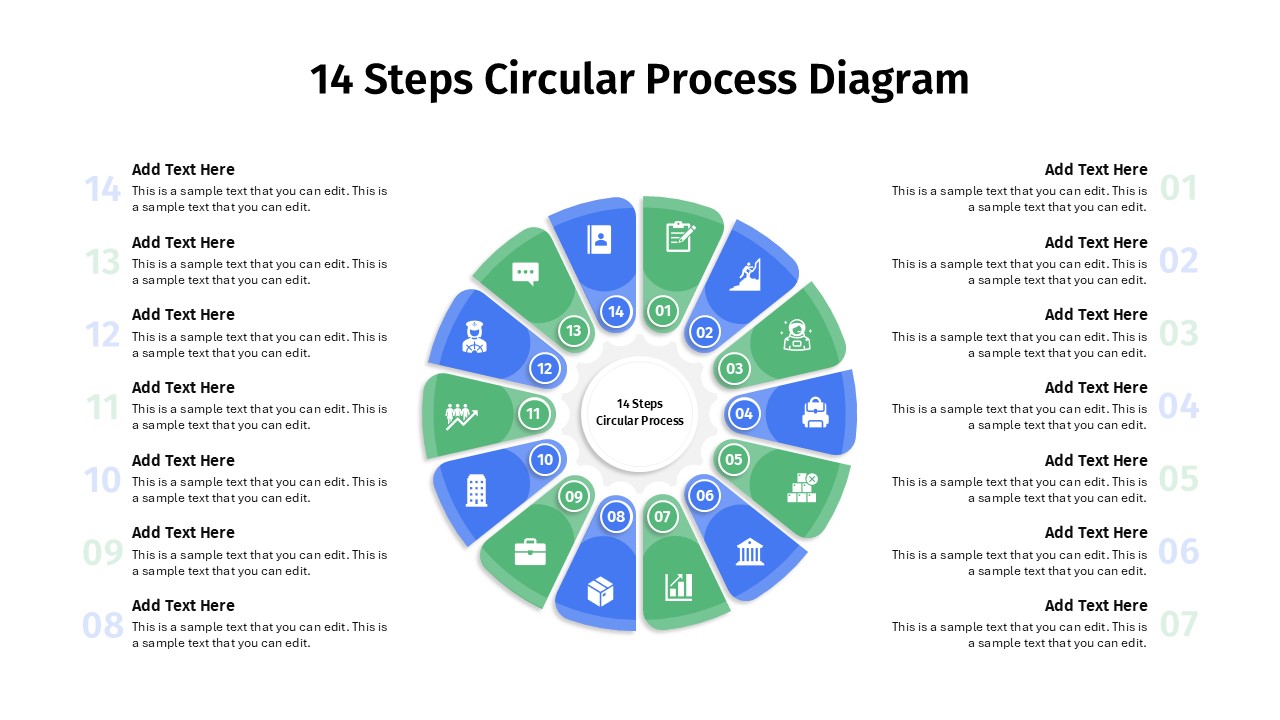
14 Steps Circular Process Diagram Template for PowerPoint & Google Slides
Circular
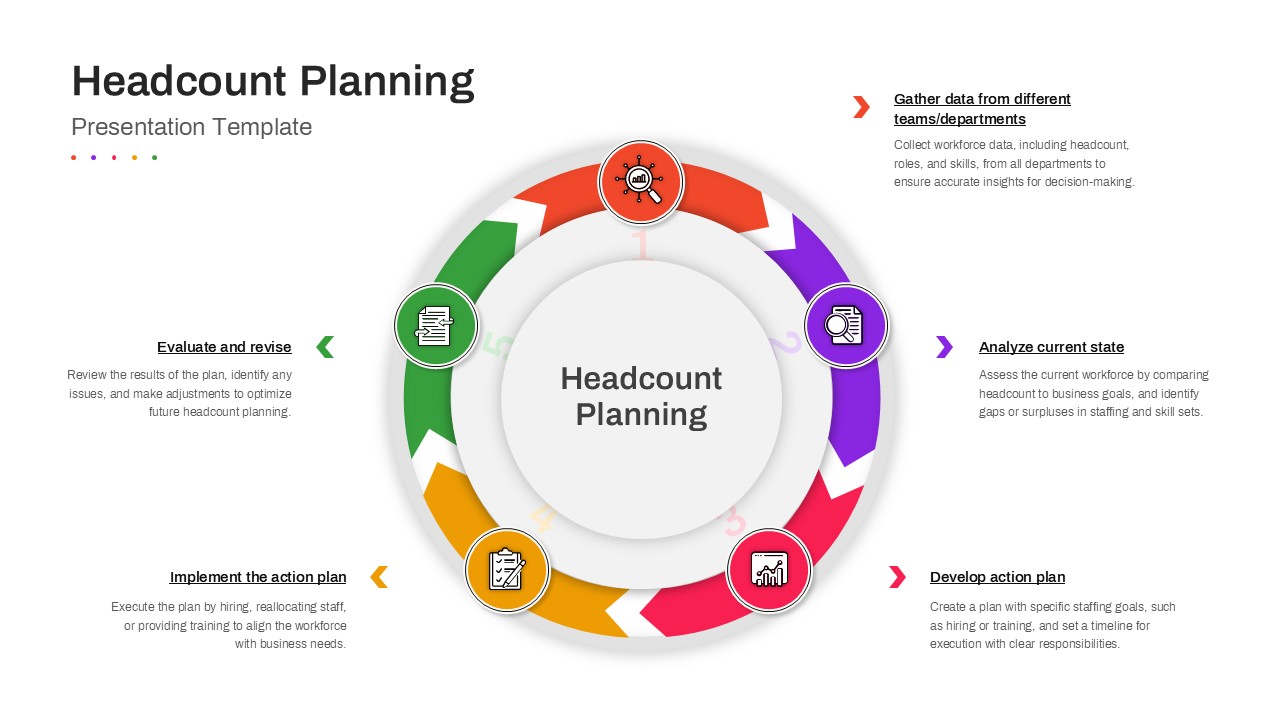
Headcount Planning Circular Process Diagram Template for PowerPoint & Google Slides
HR
4 Staged Circular Business Process Diagram for PowerPoint & Google Slides
Process
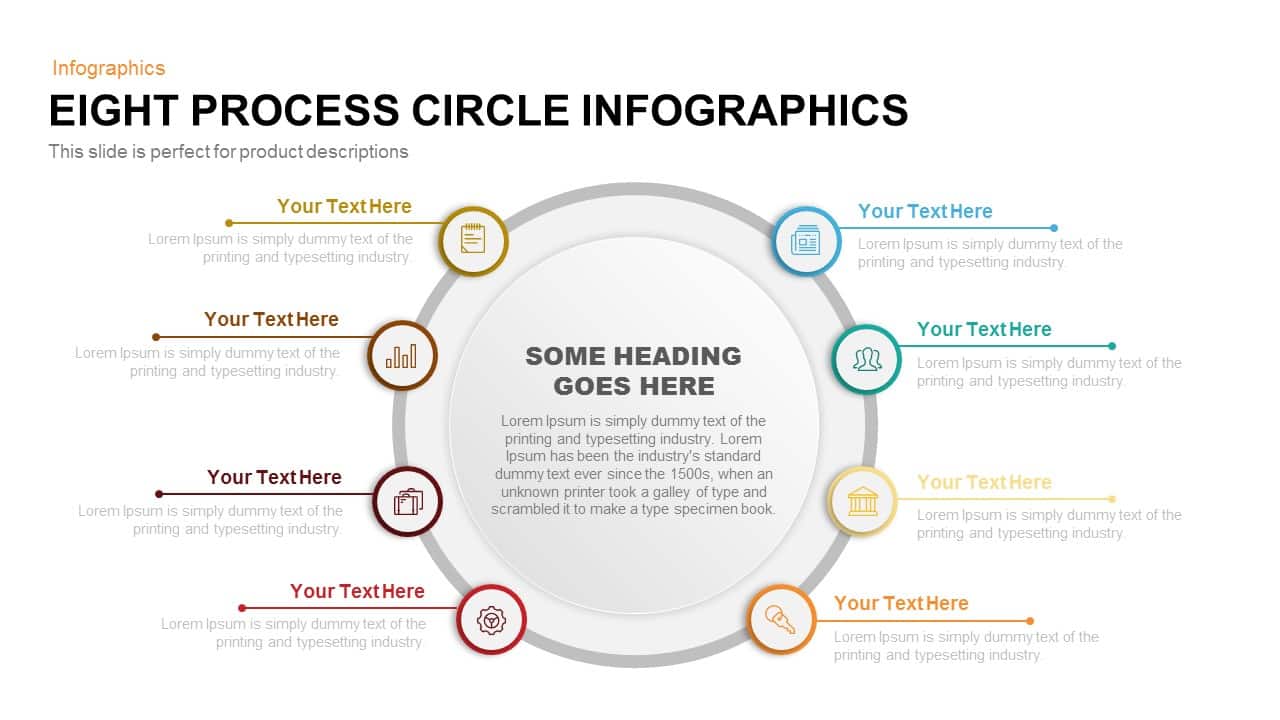
Eight-Stage Circular Process Infographic Template for PowerPoint & Google Slides
Circular
Four-Stage Circular Process Flow Template for PowerPoint & Google Slides
Process
Financial Planning Circular Process Template for PowerPoint & Google Slides
Process
5-Step Circular Gradient Process Flow Template for PowerPoint & Google Slides
Process
Colorful 5-Step Circular Process Template for PowerPoint & Google Slides
Process
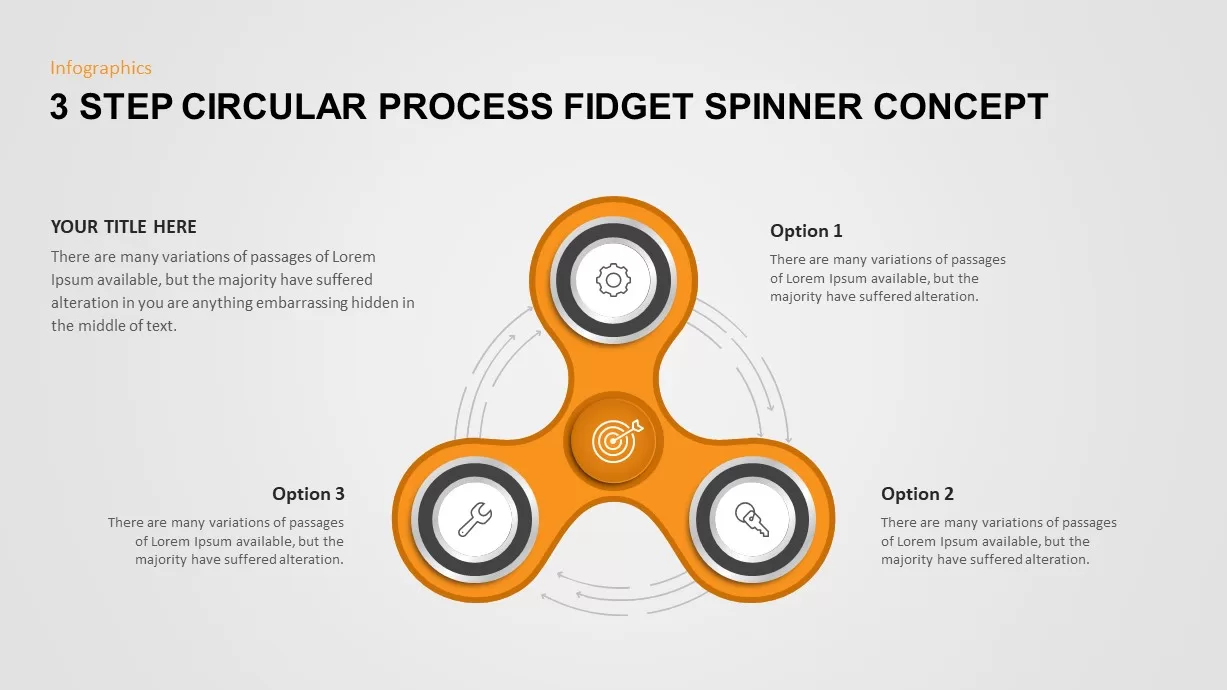
3 Step Circular Process Fidget Spinner Template for PowerPoint & Google Slides
Process
Four-Step Circular Process Infographics Template for PowerPoint & Google Slides
Circular
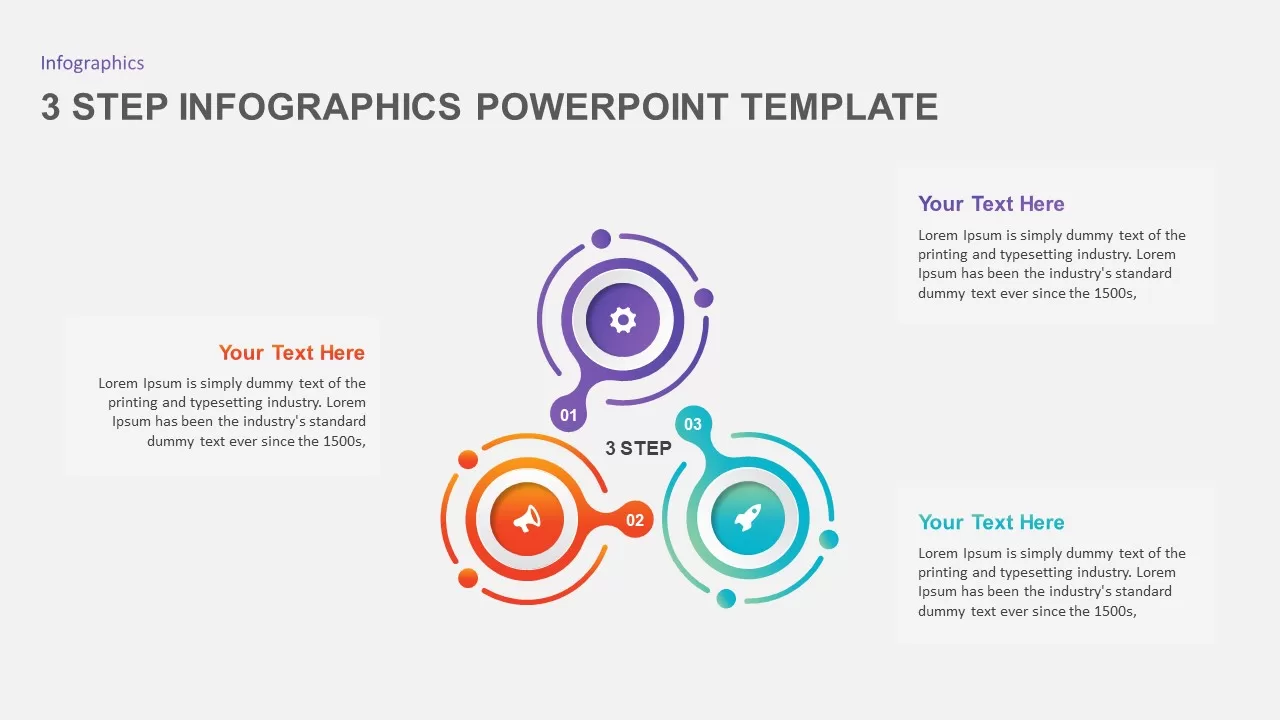
3 & 4 Step Circular Process Infographic Template for PowerPoint & Google Slides
Process
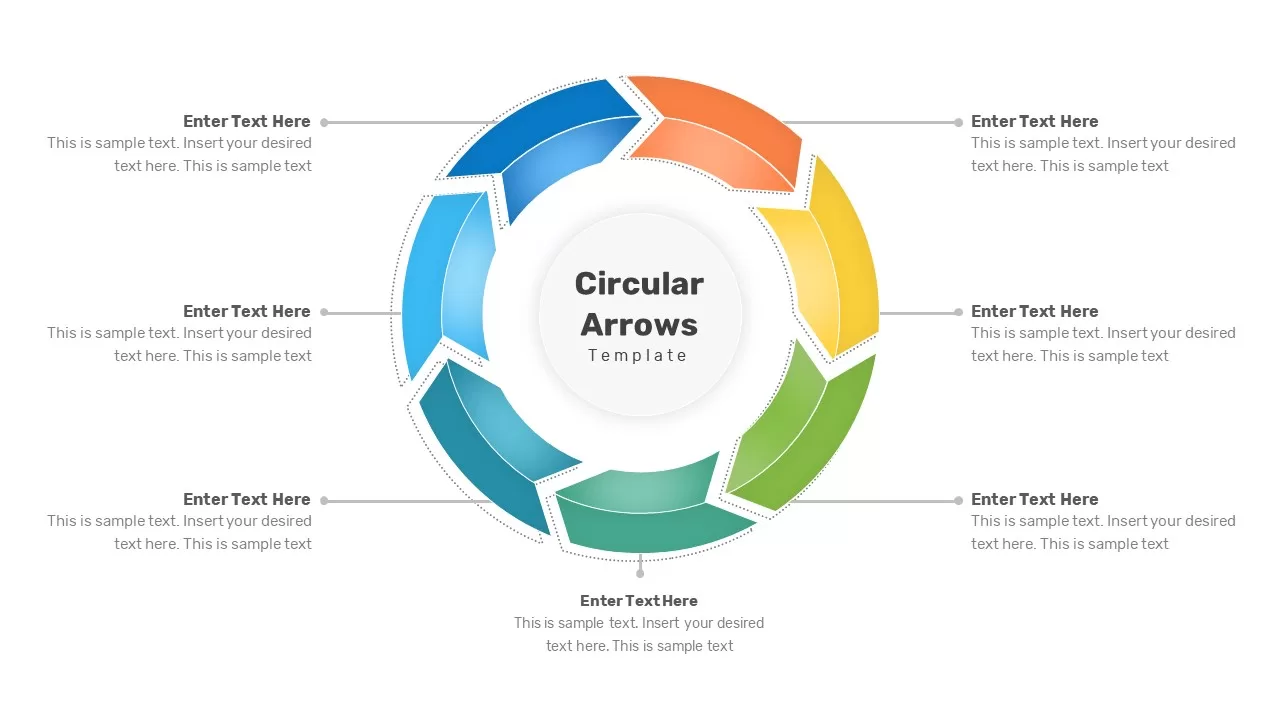
Circular Arrows Process Flow template for PowerPoint & Google Slides
Process
Circular Arrows Process Flow template for PowerPoint & Google Slides
Process
Circular Arrows Process Flow template for PowerPoint & Google Slides
Process
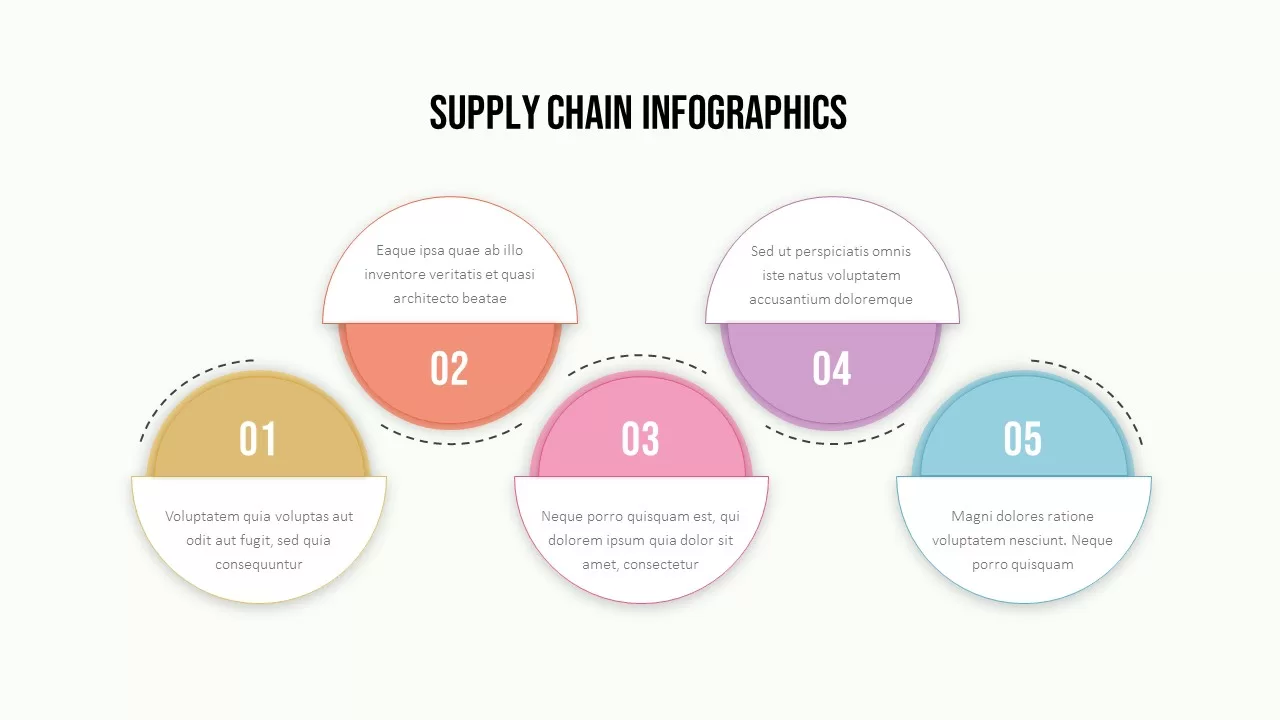
Supply Chain Circular Process Infographics Template for PowerPoint & Google Slides
Business Strategy
Ten Step Circular Process Infographic Template for PowerPoint & Google Slides
Process
Ten-Step Circular Process Infographic Template for PowerPoint & Google Slides
Circular
Key Objectives Circular Process template for PowerPoint & Google Slides
Business
Lean Methodology Circular Process Template for PowerPoint & Google Slides
Process
Circular Economy Process Overview Template for PowerPoint & Google Slides
Circular
Circular Business Development Process Template for PowerPoint & Google Slides
Process
3D Circular Diagram template for PowerPoint & Google Slides
Circular
Circular Flow Diagram Template for PowerPoint & Google Slides
Infographics
Six Step Creative Circular Diagram Template for PowerPoint & Google Slides
Circular
Six Steps Circular CRM Diagram Template for PowerPoint & Google Slides
Customer Journey
Six Section Circular Infographic Diagram Template for PowerPoint & Google Slides
Circular
Four-Stage Business Circular Diagram Template for PowerPoint & Google Slides
Process
Five-Section Circular Arrow Diagram Template for PowerPoint & Google Slides
Circular
Four Section Circular Text Boxes Diagram Template for PowerPoint & Google Slides
Circular
Eight-Step Circular Diagram Infographic Template for PowerPoint & Google Slides
Circular
PEST Analysis Circular Diagram Template for PowerPoint & Google Slides
PEST
Five Layer Circular Ring Diagram Template for PowerPoint & Google Slides
Circular
Five Stage Circular Arrow Diagram Template for PowerPoint & Google Slides
Process
Five-Stage Circular Flow Diagram Template for PowerPoint & Google Slides
Circular
4 Ps of Management Circular Diagram Template for PowerPoint & Google Slides
Circular
4 Factors Circular Diagram Infographic Template for PowerPoint & Google Slides
Circular
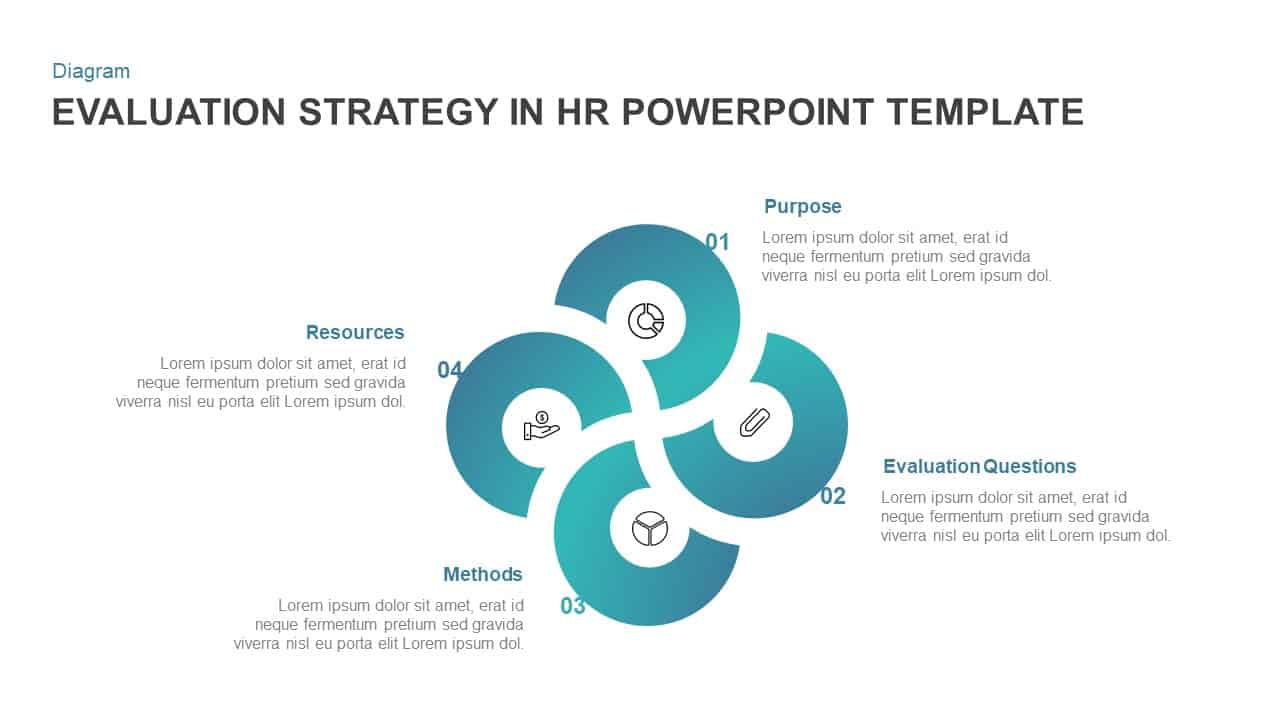
HR Evaluation Strategy Circular Diagram Template for PowerPoint & Google Slides
Circular
Six-Stage Circular Flow Diagram Template for PowerPoint & Google Slides
Circular
Eight Step Circular Diagram Template for PowerPoint & Google Slides
Circular
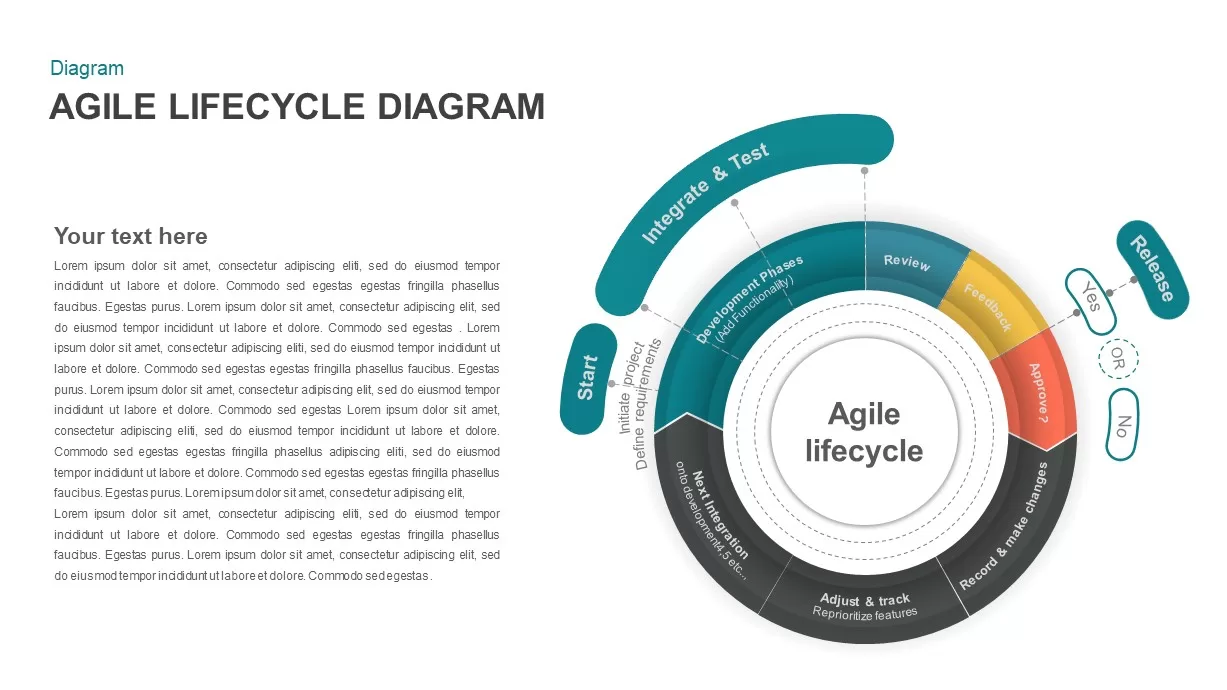
Agile Lifecycle Circular Diagram Template for PowerPoint & Google Slides
Circular
2-8 Step Circular Diagram Template for PowerPoint & Google Slides
Infographics
4MAT Learning Cycle Circular Diagram Template for PowerPoint & Google Slides
Circular
4-Step Circular PDCA Cycle Diagram Template for PowerPoint & Google Slides
Process
Concentric Circular Arrow Cycle Diagram Template for PowerPoint & Google Slides
Process
Three-Step Circular Arrows Diagram Template for PowerPoint & Google Slides
Process
10-Step Colorful Circular Diagram Template for PowerPoint & Google Slides
Circular
Multi-Variation Circular Chart Diagram Template for PowerPoint & Google Slides
Circular
AI Methods Circular Diagram Slide Template for PowerPoint & Google Slides
AI
HROps Hub and Spoke Circular Diagram Template for PowerPoint & Google Slides
Circular
5Cs of Network Effect Circular Diagram Template for PowerPoint & Google Slides
Circular
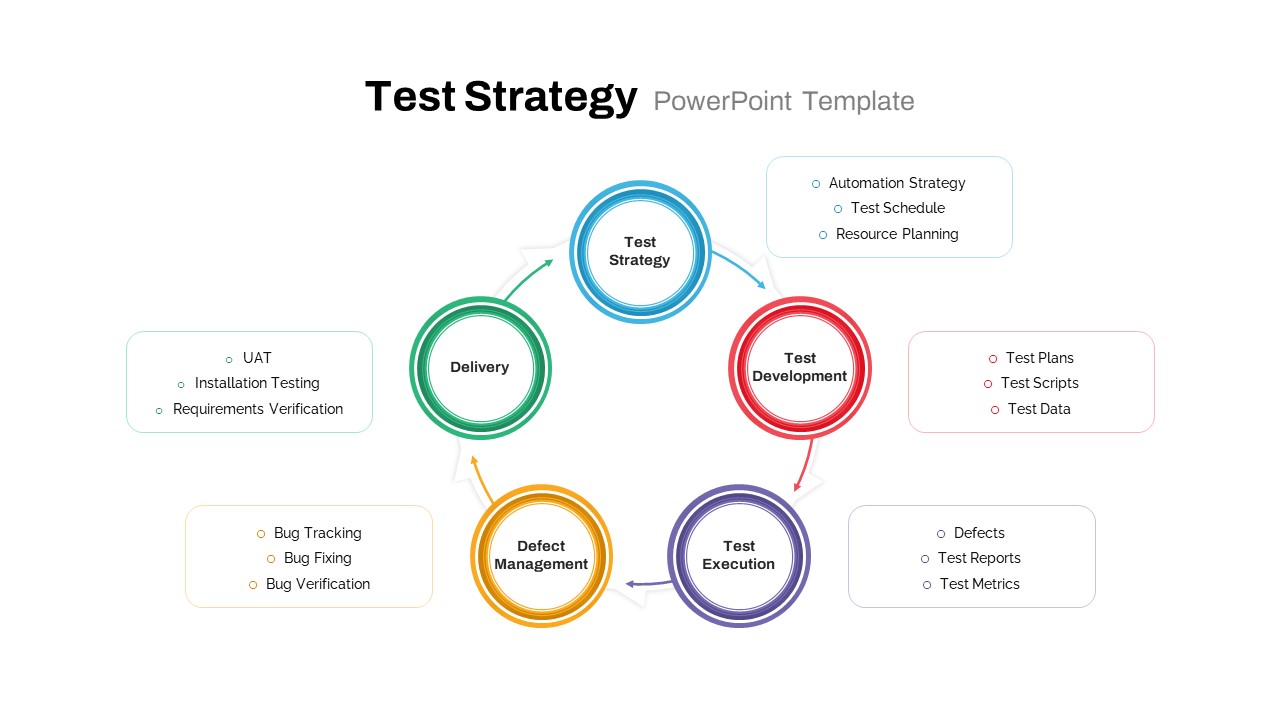
Test Strategy Circular Diagram Template for PowerPoint & Google Slides
Circular
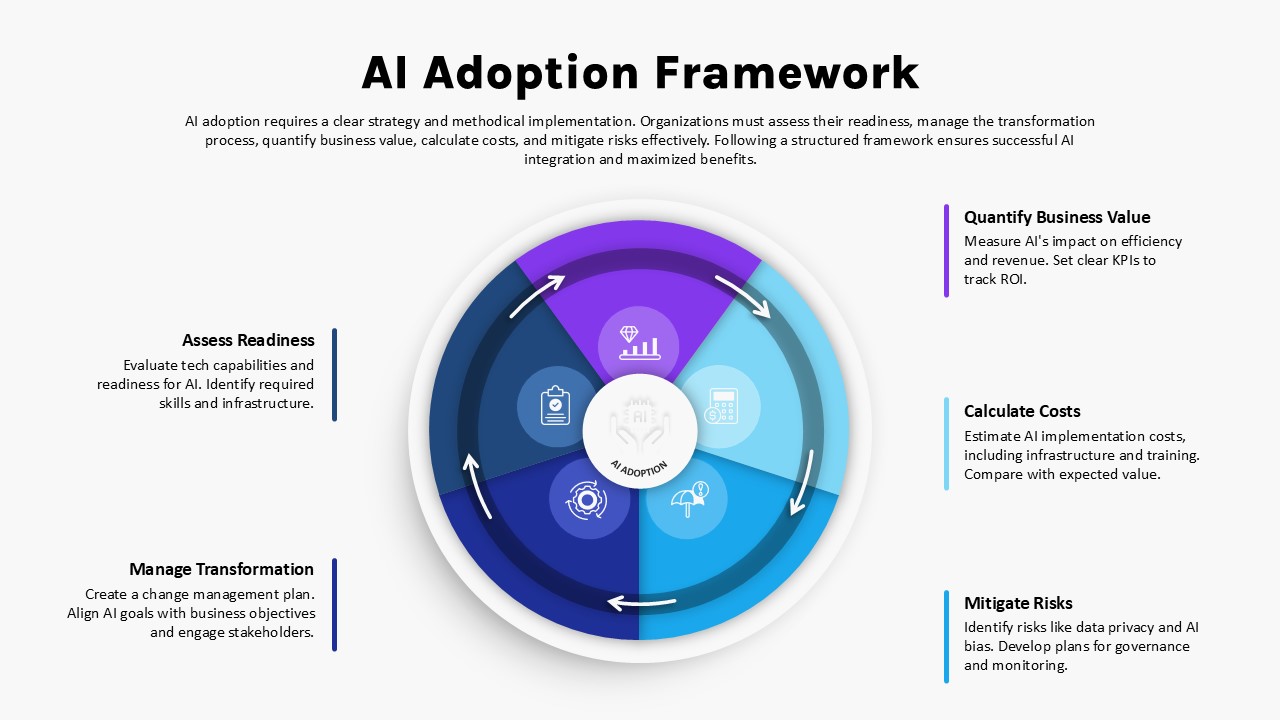
AI Adoption Framework Circular Diagram Template for PowerPoint & Google Slides
AI
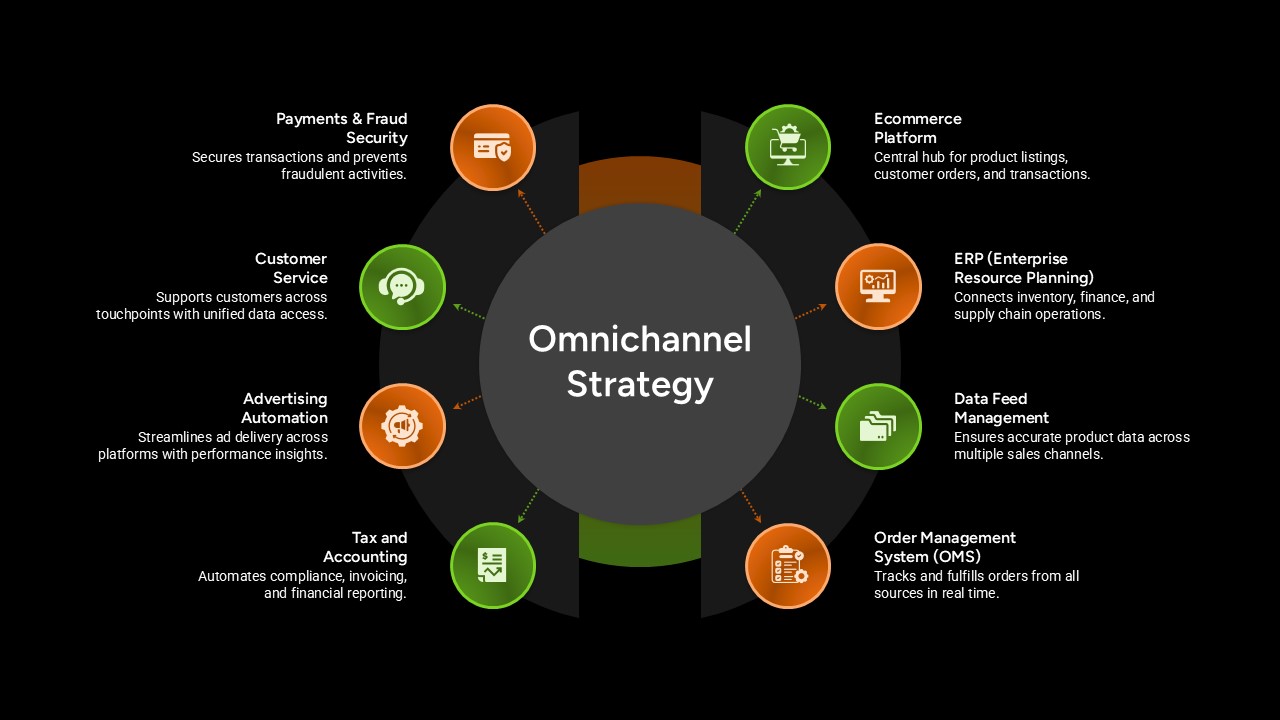
Omnichannel Strategy Circular Diagram Template for PowerPoint & Google Slides
Digital Marketing
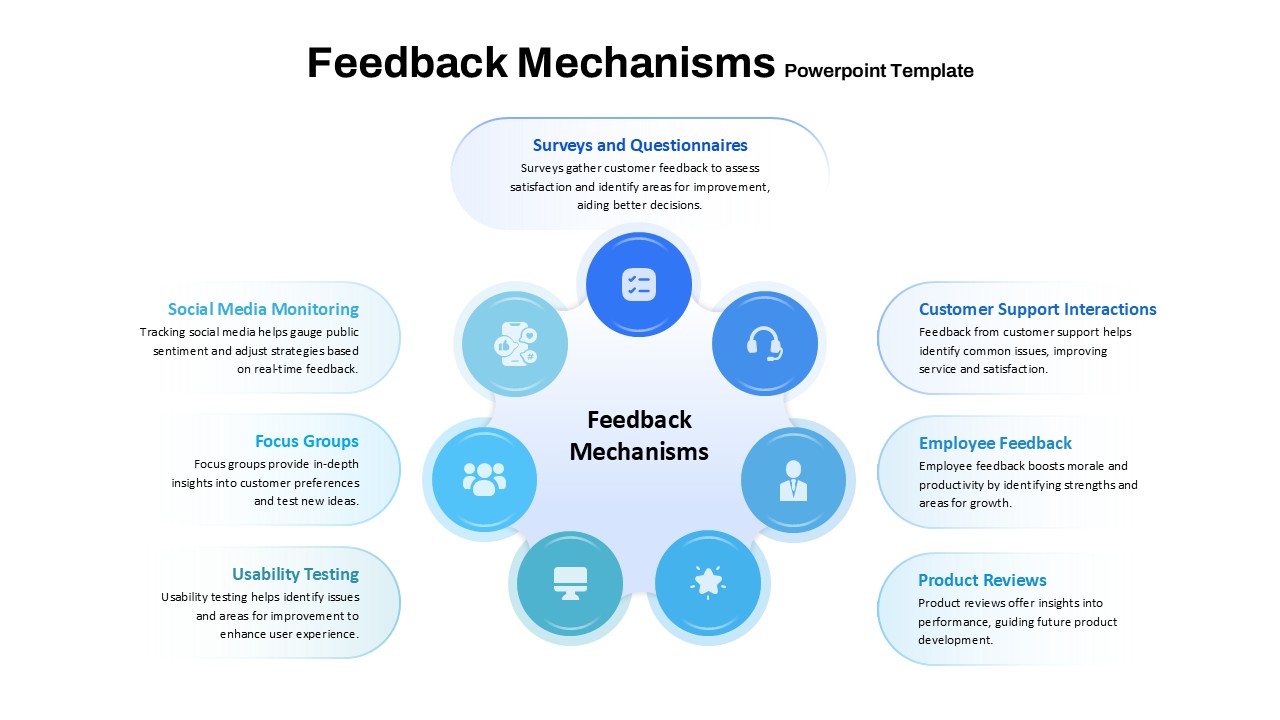
Feedback Mechanisms Circular Diagram Template for PowerPoint & Google Slides
Circular
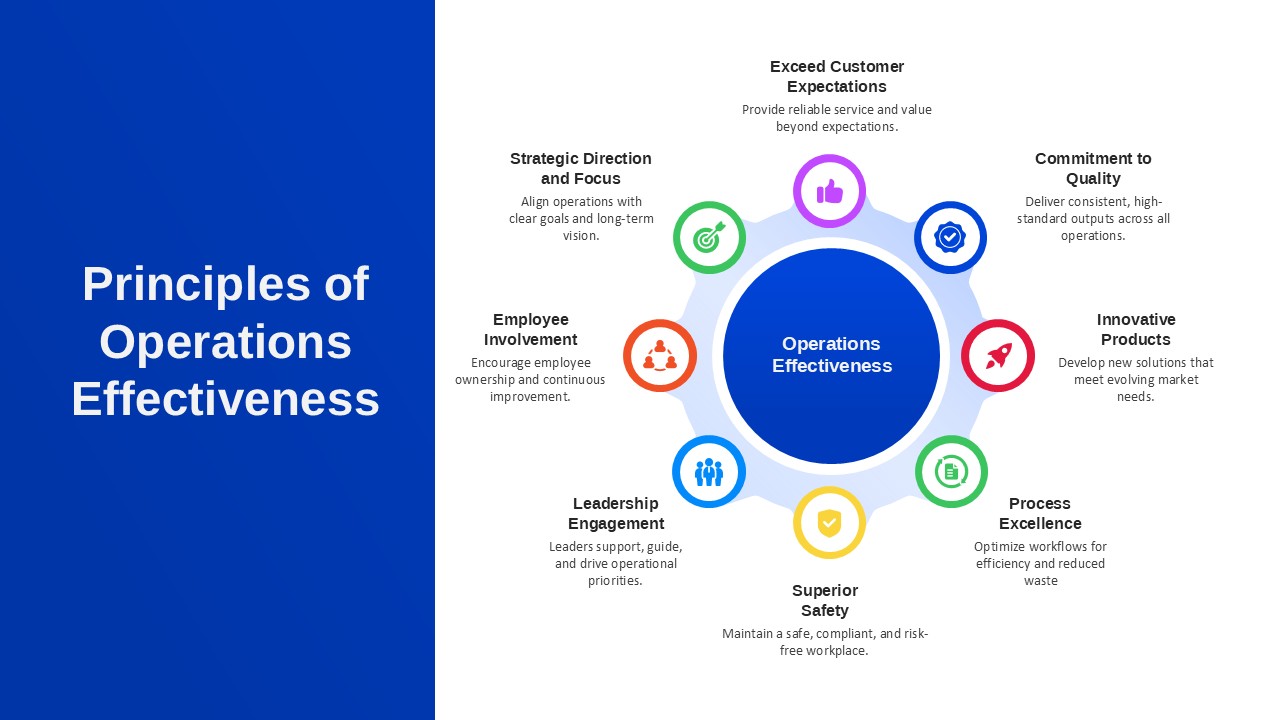
Principles of Operations Effectiveness Circular Diagram Template for PowerPoint & Google Slides
Leadership