Iberian Peninsula Map Outline Infographic Template for PowerPoint & Google Slides

Description
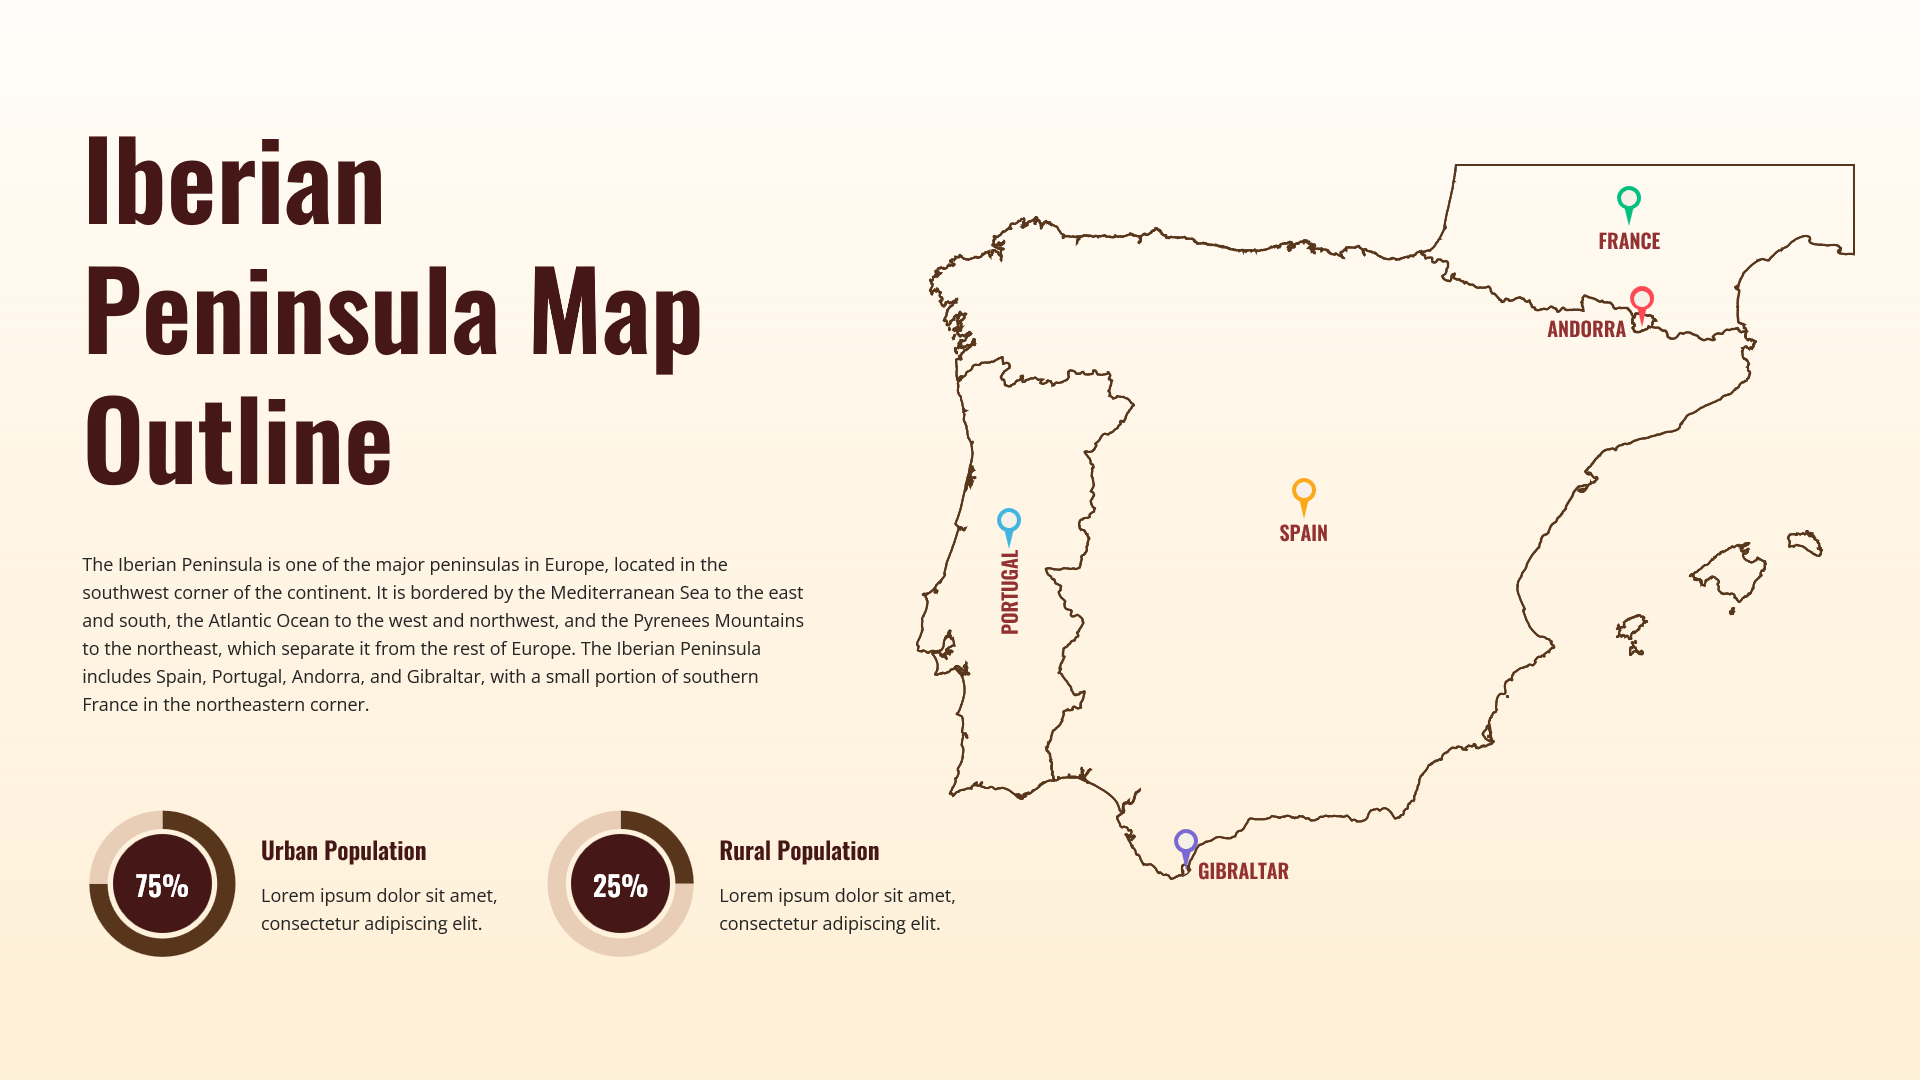
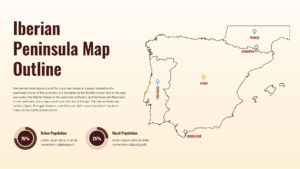
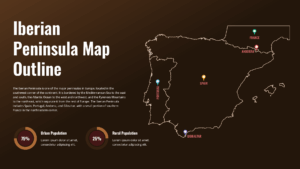
Showcase geographic insights with this clean and elegant Iberian Peninsula Map Outline slide. Featuring a detailed outline of Spain and Portugal, along with highlighted markers for France, Andorra, and Gibraltar, this layout provides a clear visual reference for regional analysis and presentations. The minimalist line map design keeps the focus on geographic boundaries while allowing space for contextual data, annotations, and country-specific insights.
The slide also incorporates two donut charts to illustrate comparative statistics such as urban versus rural population, market distribution, or demographic segmentation. With balanced typography, subtle earth-tone styling, and clearly labeled location markers, the design delivers a professional and informative visual experience. All map elements, labels, and data charts are fully editable, enabling you to customize colors, adjust percentages, or add additional data points as needed. Optimized for both PowerPoint and Google Slides, the layout ensures consistent formatting and high-resolution clarity across platforms.
Who is it for
This slide is ideal for geography educators, market analysts, business strategists, and consultants presenting regional data about Southern Europe. It also suits tourism boards, logistics planners, and international sales teams analyzing the Iberian market.
Other Uses
Beyond geographic overviews, repurpose this map slide for market expansion plans, demographic studies, distribution network mapping, or cross-border trade analysis. The donut charts can be adapted for KPI comparisons, investment breakdowns, or population statistics, making this layout a versatile asset for business and academic presentations.
Login to download this file

Item ID
SB05720Designed By
Niranjana
Related Templates

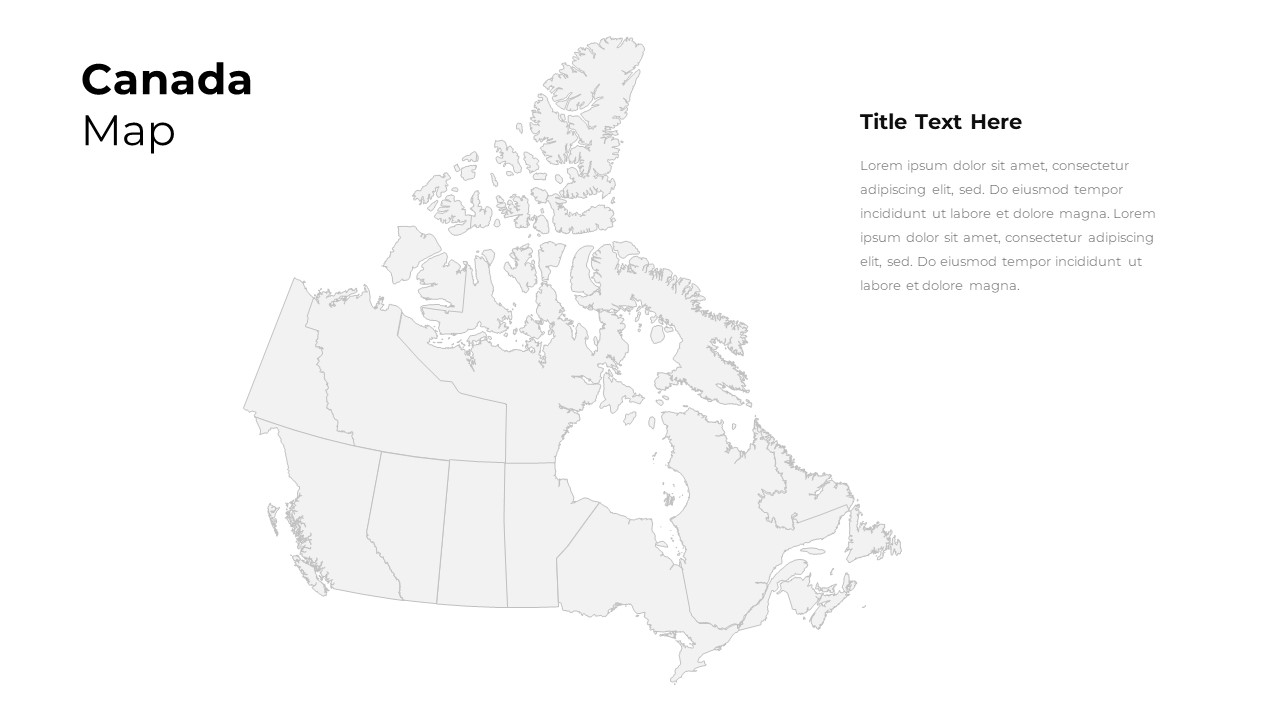
Customizable Canada Map Outline Template for PowerPoint & Google Slides
World Maps
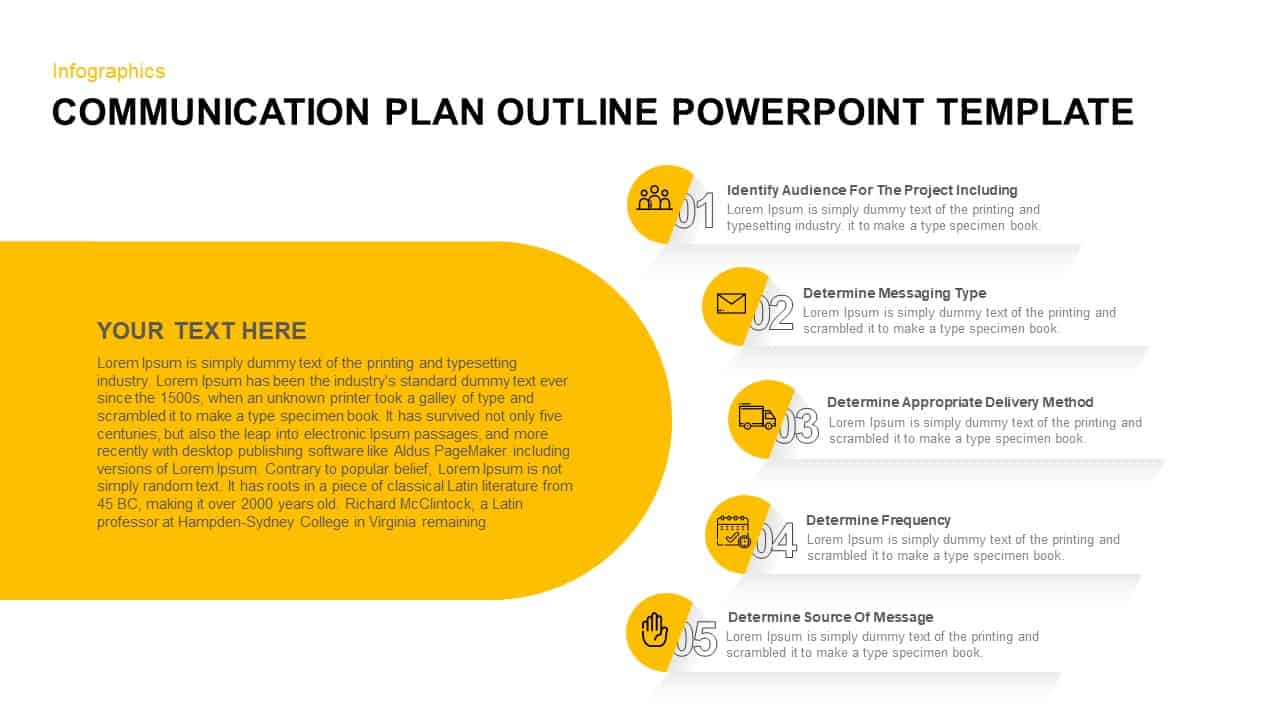
Communication Plan Outline Template Pack for PowerPoint & Google Slides
Infographics
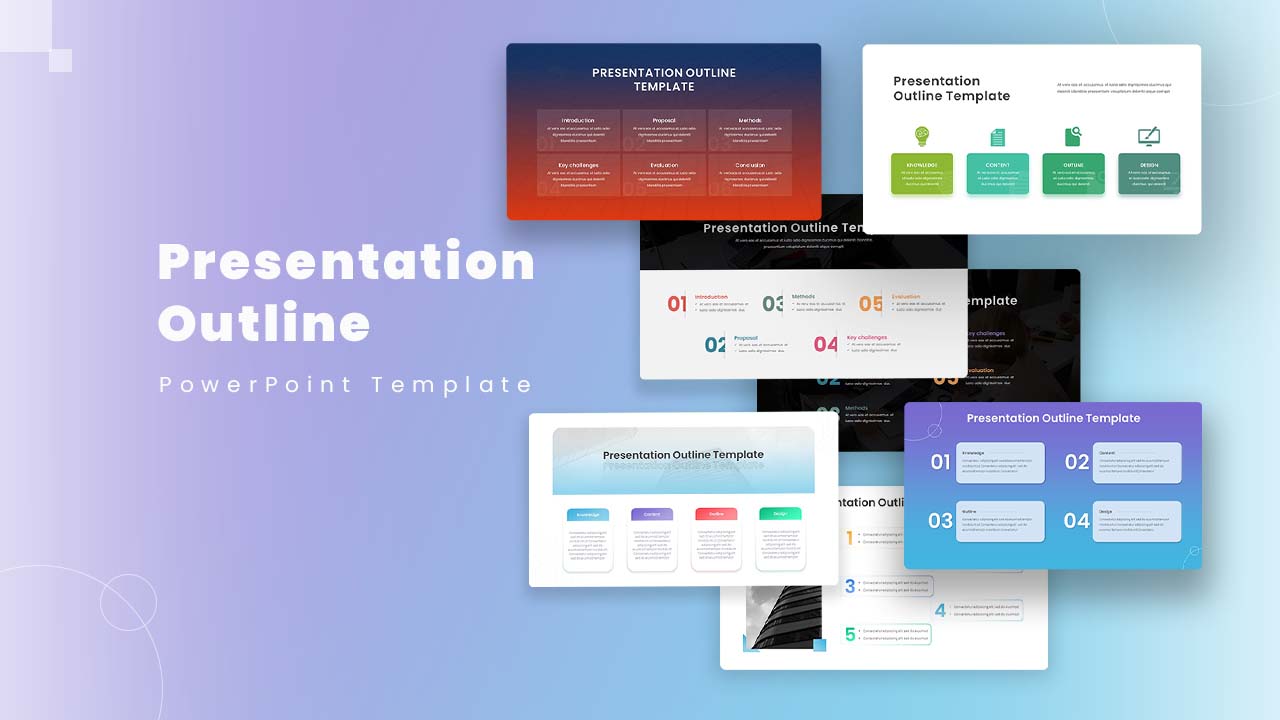
Modern Presentation Outline Template for PowerPoint & Google Slides
Process
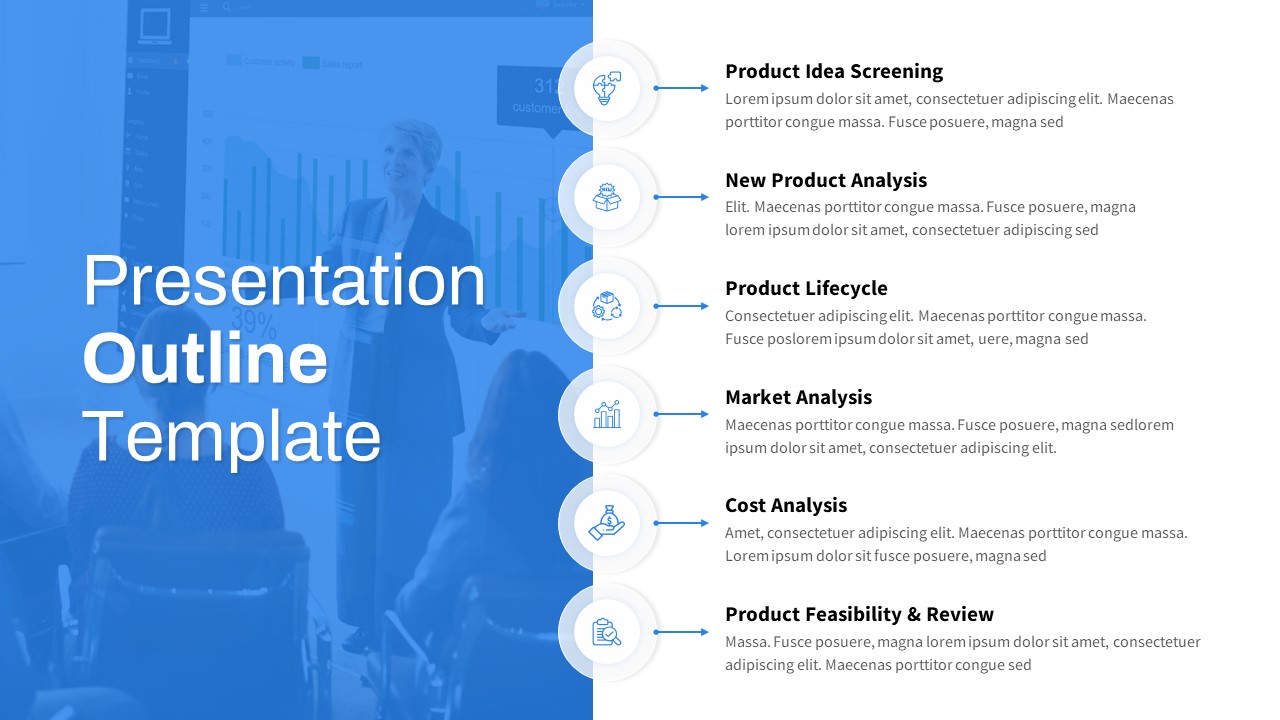
Free Product Development Process Outline Template for PowerPoint & Google Slides
Infographics
Free
Africa Country Map Infographic Template for PowerPoint & Google Slides
World Maps
Asia Map Infographic with Demographics template for PowerPoint & Google Slides
World Maps
Curved Road Map Timeline Infographic Template for PowerPoint & Google Slides
Roadmap

Japan Province Map Infographic Template for PowerPoint & Google Slides
Maps
Malaysia Regional Map Infographic Template for PowerPoint & Google Slides
Maps
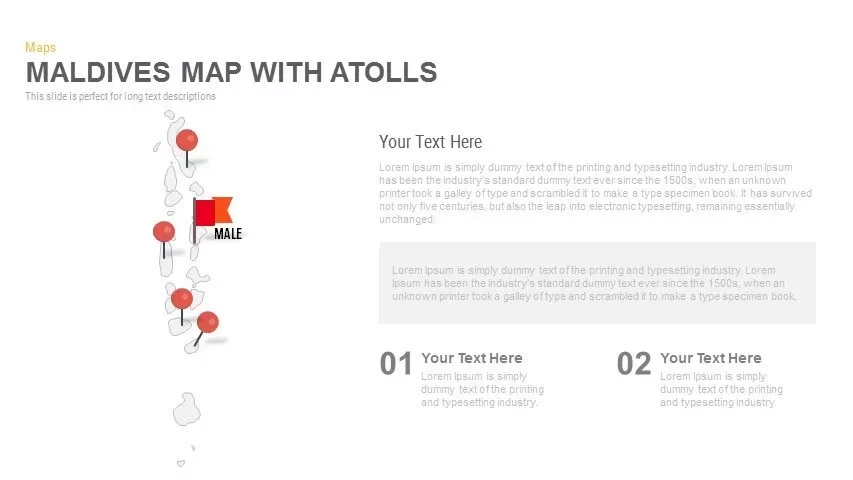
Maldives Map Infographic Template for PowerPoint & Google Slides
Maps
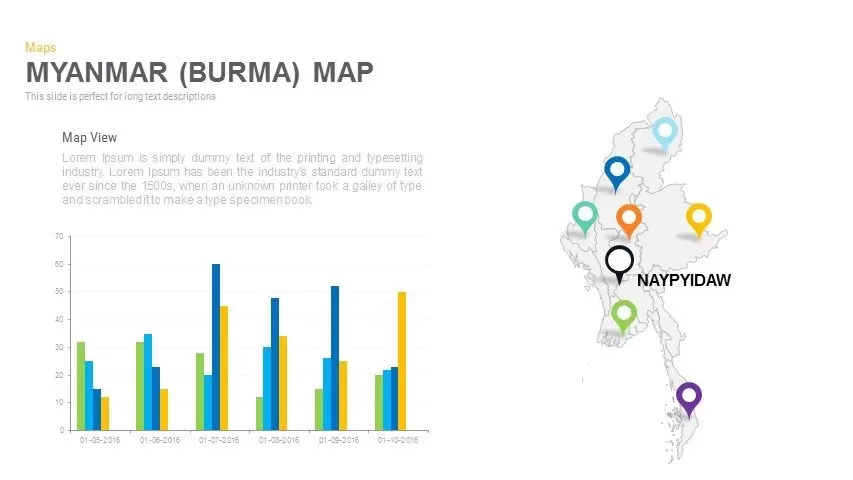
Myanmar (Burma) Provincial Map Infographic Template for PowerPoint & Google Slides
Maps
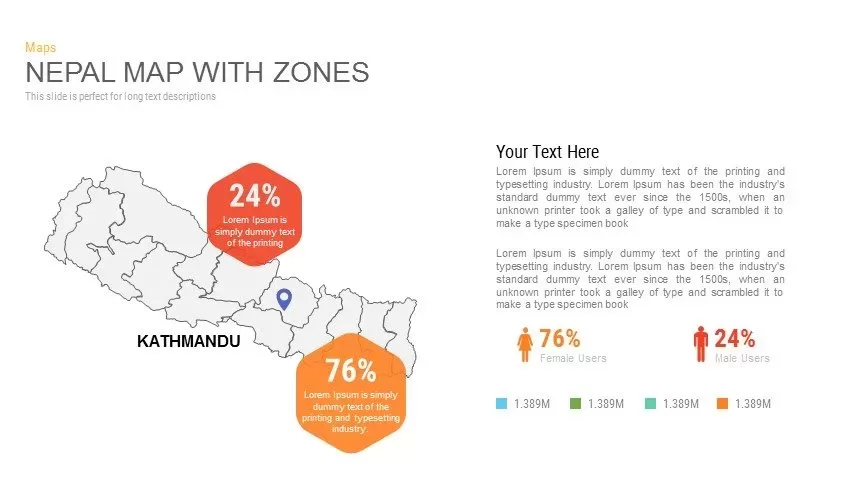
Nepal Map with Zones Infographic Template for PowerPoint & Google Slides
Maps
North Korea Map with Provinces Infographic Pack Template for PowerPoint & Google Slides
Maps
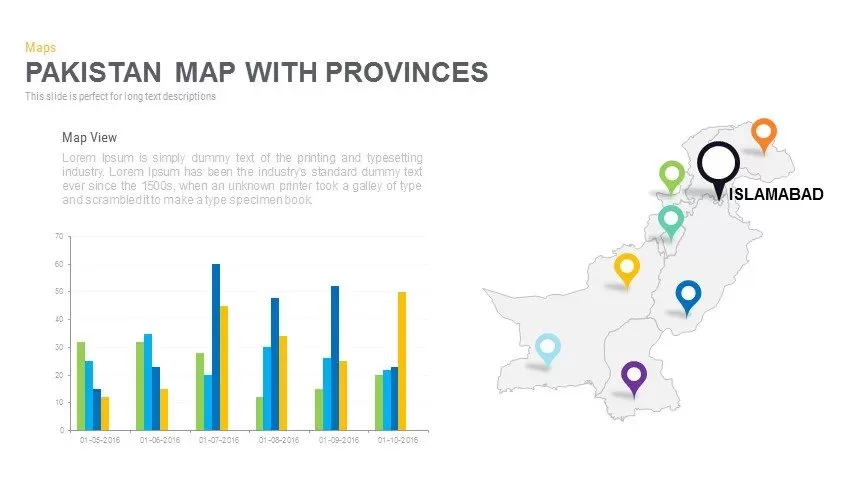
Pakistan Provinces Map Infographic Pack Template for PowerPoint & Google Slides
Maps
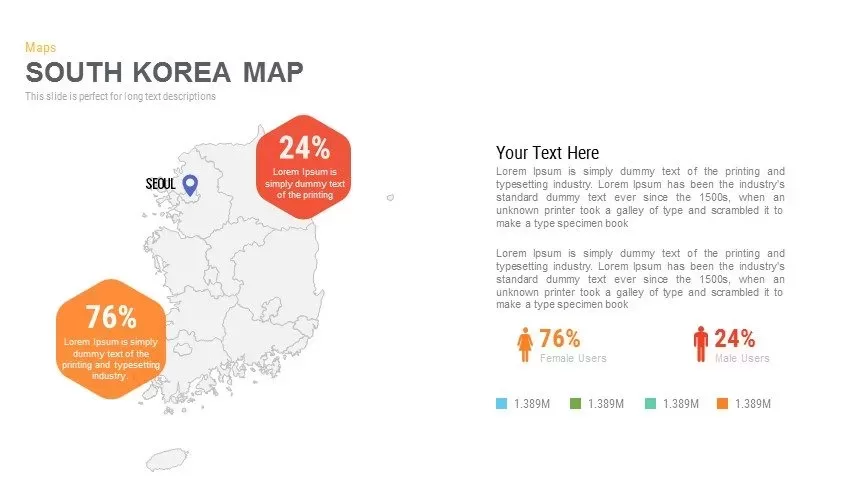
Infographic South Korea Map Template for PowerPoint & Google Slides
Maps
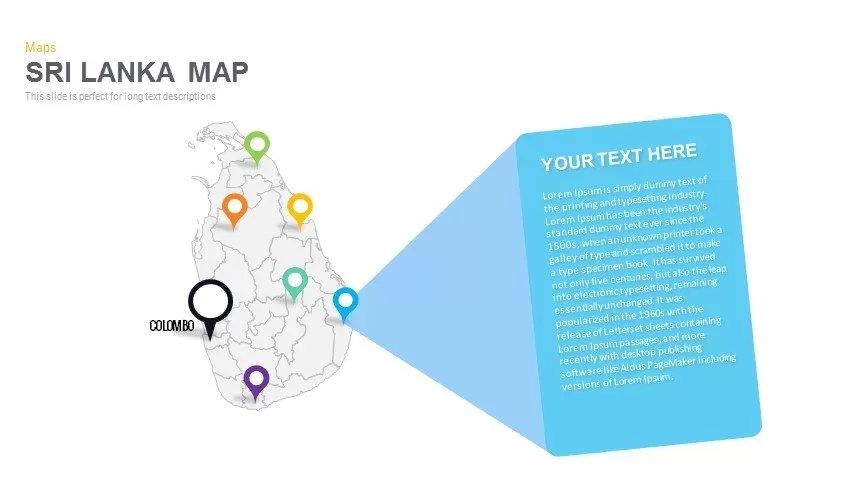
Sri Lanka Map Infographic Pack Template for PowerPoint & Google Slides
Maps
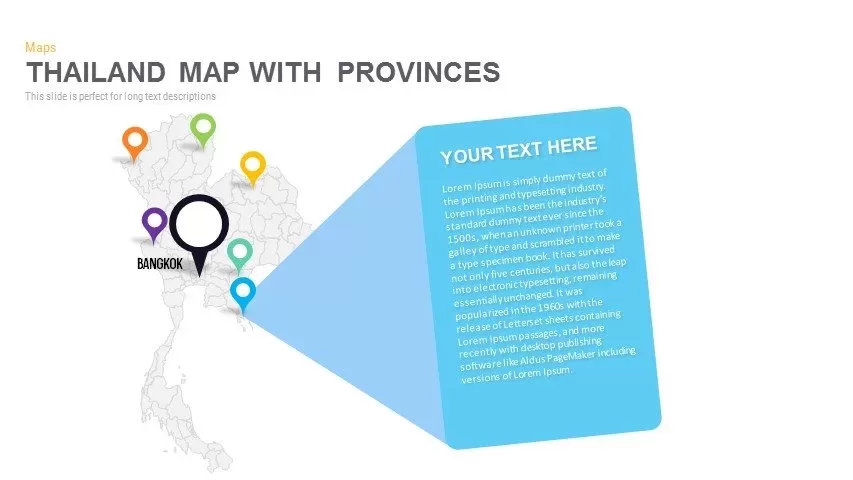
Thailand Provinces Map Infographic Pack Template for PowerPoint & Google Slides
Maps
Vietnam Provinces Map Infographic Pack Template for PowerPoint & Google Slides
Maps
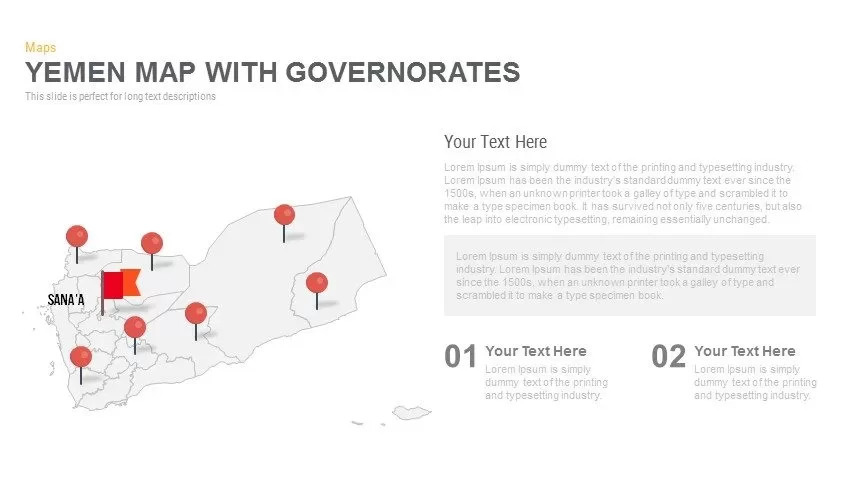
Yemen Governorates Infographic Map Template for PowerPoint & Google Slides
Maps

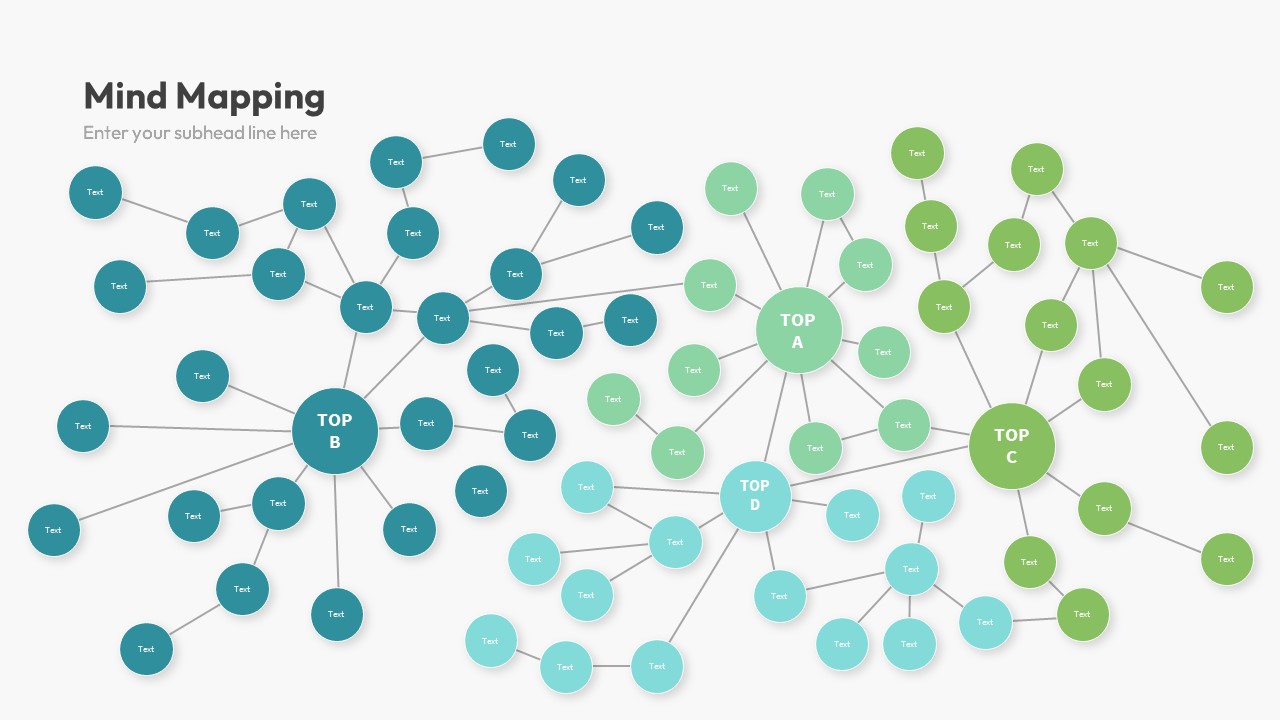
Multi-Cluster Mind Map Infographic Template for PowerPoint & Google Slides
Mind Maps
Colorful Mind Map Infographic Template with Icons for PowerPoint & Google Slides
Mind Maps
Colorful Mind Map Infographic Template for PowerPoint & Google Slides
Mind Maps
Mind Map Infographic Slide Template for PowerPoint & Google Slides
Mind Maps

Modern World Map Callout Infographic Template for PowerPoint & Google Slides
World Maps
Eight-Node Mind Map Infographic Diagram Template for PowerPoint & Google Slides
Mind Maps
Six-Stage Road Map Infographic Timeline Template for PowerPoint & Google Slides
Roadmap
Versatile Mind Map Infographic Template for PowerPoint & Google Slides
Mind Maps
Structured Mind Map Infographic Diagram Template for PowerPoint & Google Slides
Mind Maps
Dual Topic Mind Map Infographic Template for PowerPoint & Google Slides
Mind Maps
Tri-Cluster Mind Map Infographic Template for PowerPoint & Google Slides
Mind Maps
Fully Editable World Map Infographic Template for PowerPoint & Google Slides
World Maps
Editable World Map Callout Infographic Template for PowerPoint & Google Slides
World Maps
Editable World Map Callout Infographic Template for PowerPoint & Google Slides
World Maps
North America Percentage Map Infographic Template for PowerPoint & Google Slides
World Maps
North America Map Infographic Slide Template for PowerPoint & Google Slides
World Maps
Editable Africa Map Infographic Data Template for PowerPoint & Google Slides
World Maps
Editable Ireland Map Infographic Slide Template for PowerPoint & Google Slides
World Maps
Free
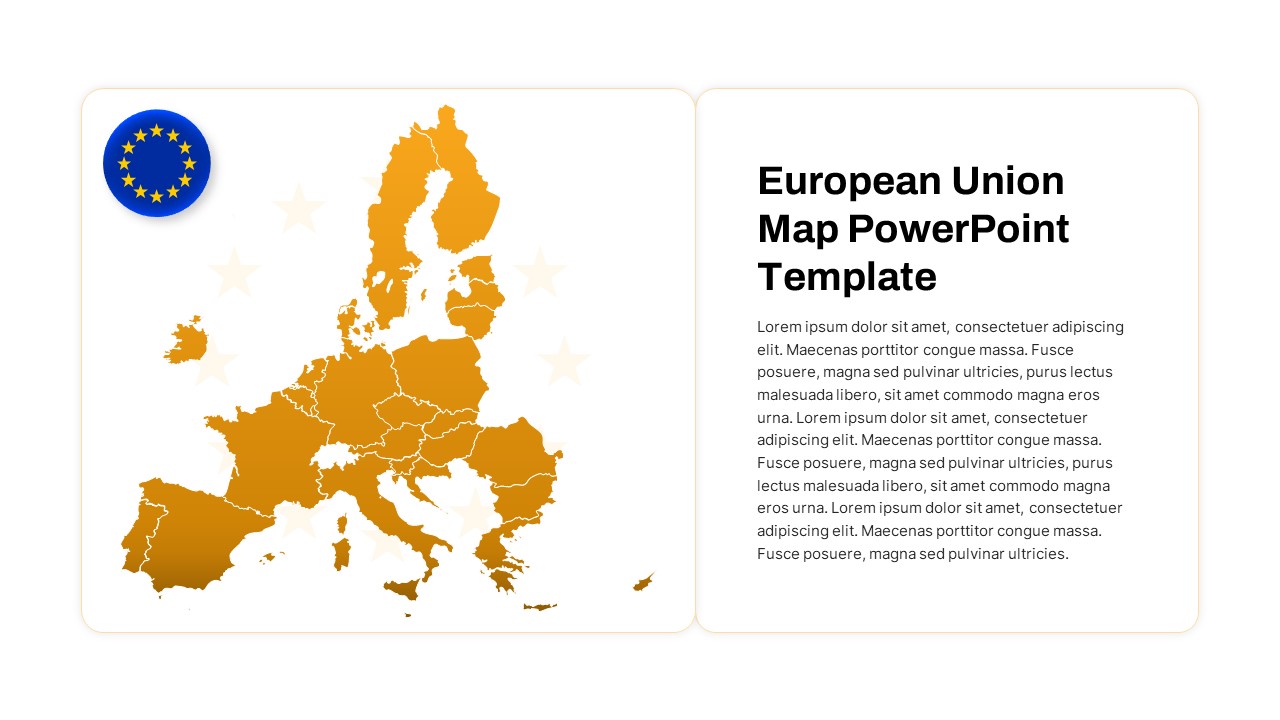
European Union Map Infographic Template for PowerPoint & Google Slides
World Maps
Syria Regional Data Map Infographic Template for PowerPoint & Google Slides
World Maps
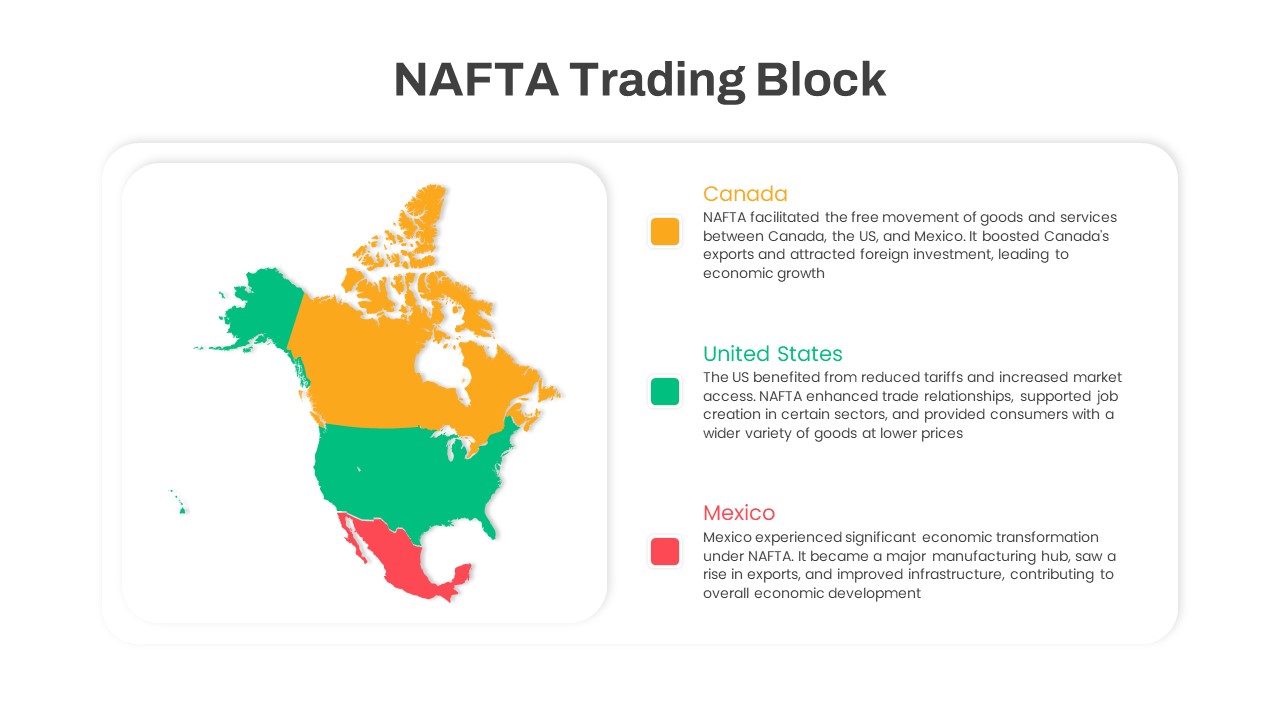
NAFTA Trading Block Map Infographic Template for PowerPoint & Google Slides
World Maps
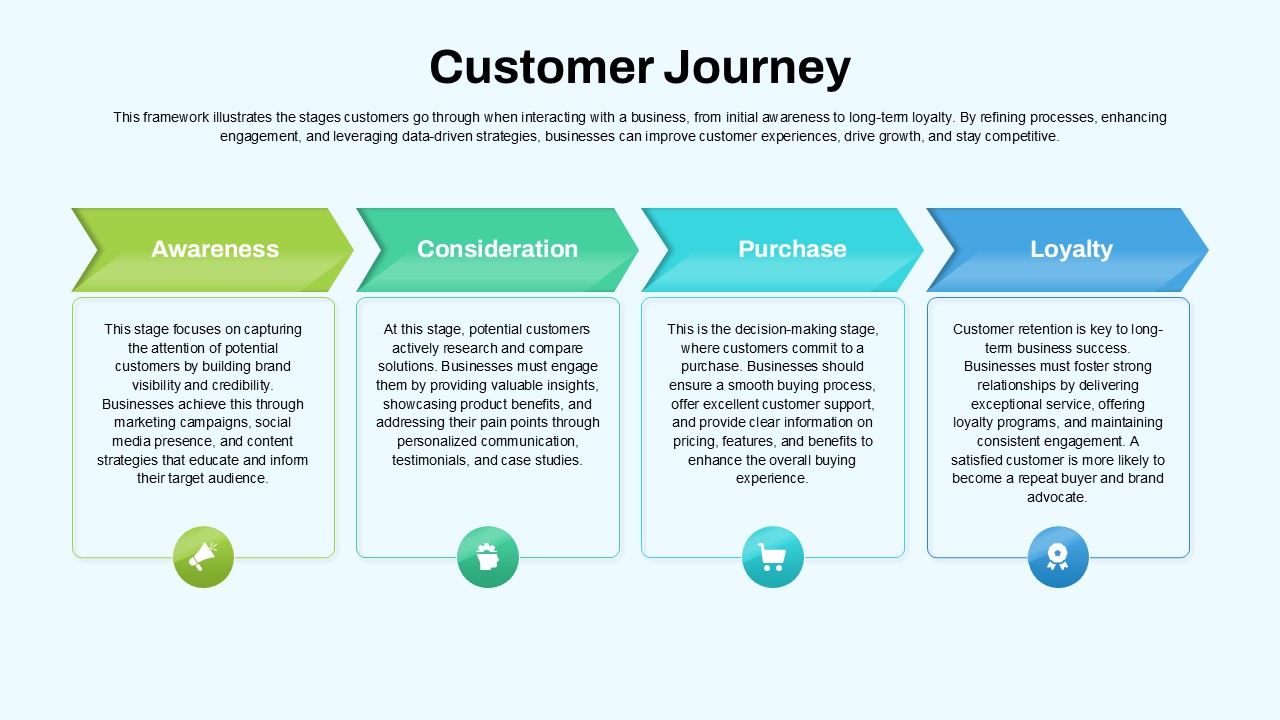
Customer Journey Process Map Infographic Template for PowerPoint & Google Slides
Customer Journey
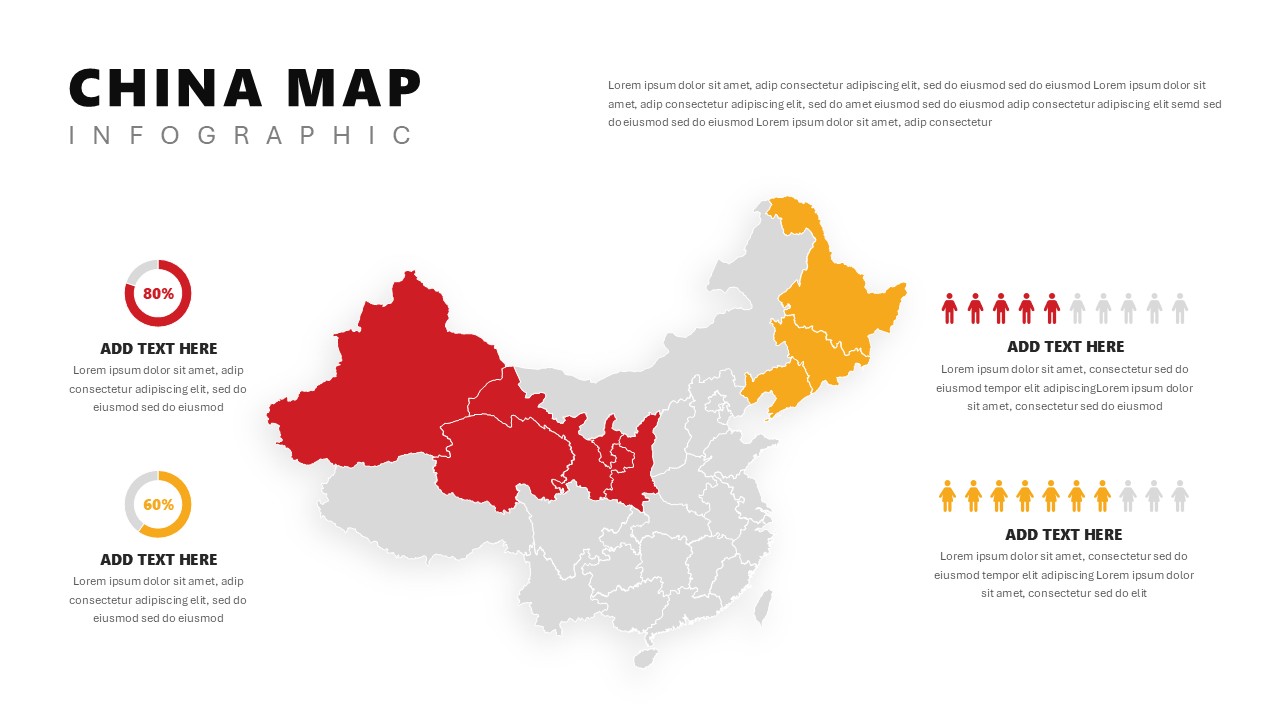
China Map Infographic Regional Stats Template for PowerPoint & Google Slides
World Maps
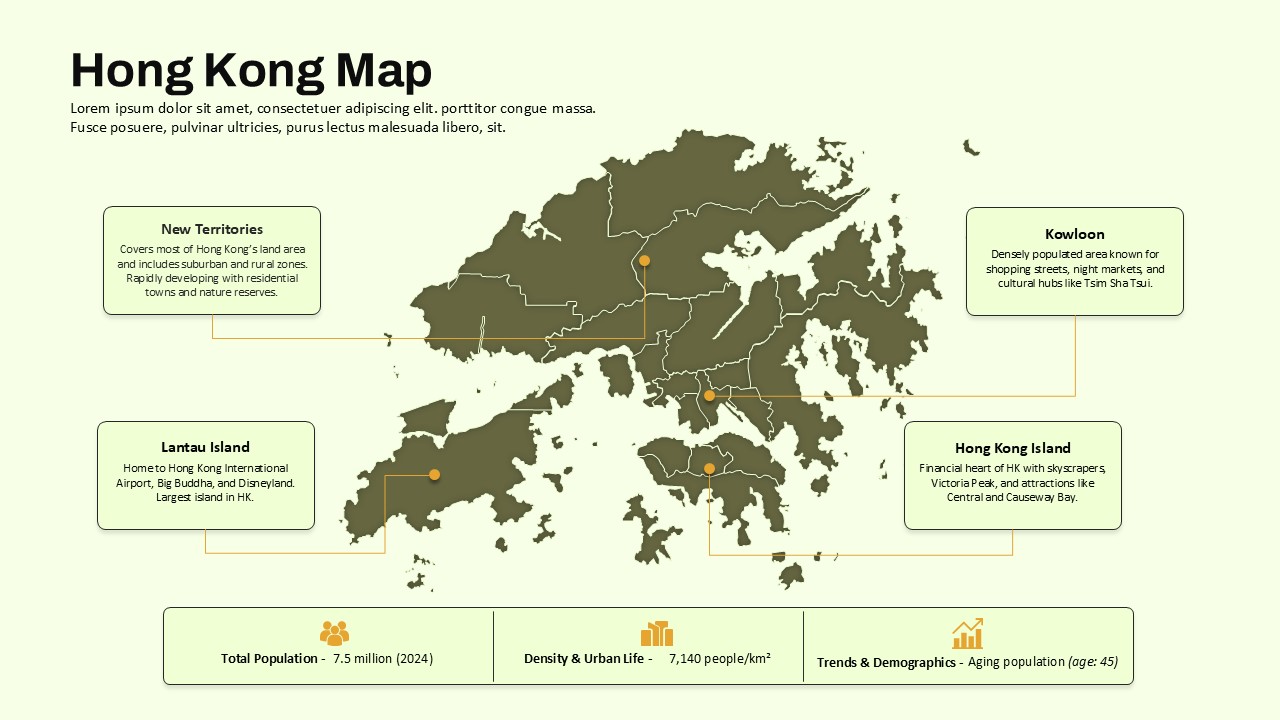
Hong Kong Geographic Map Infographic Template for PowerPoint & Google Slides
World Maps
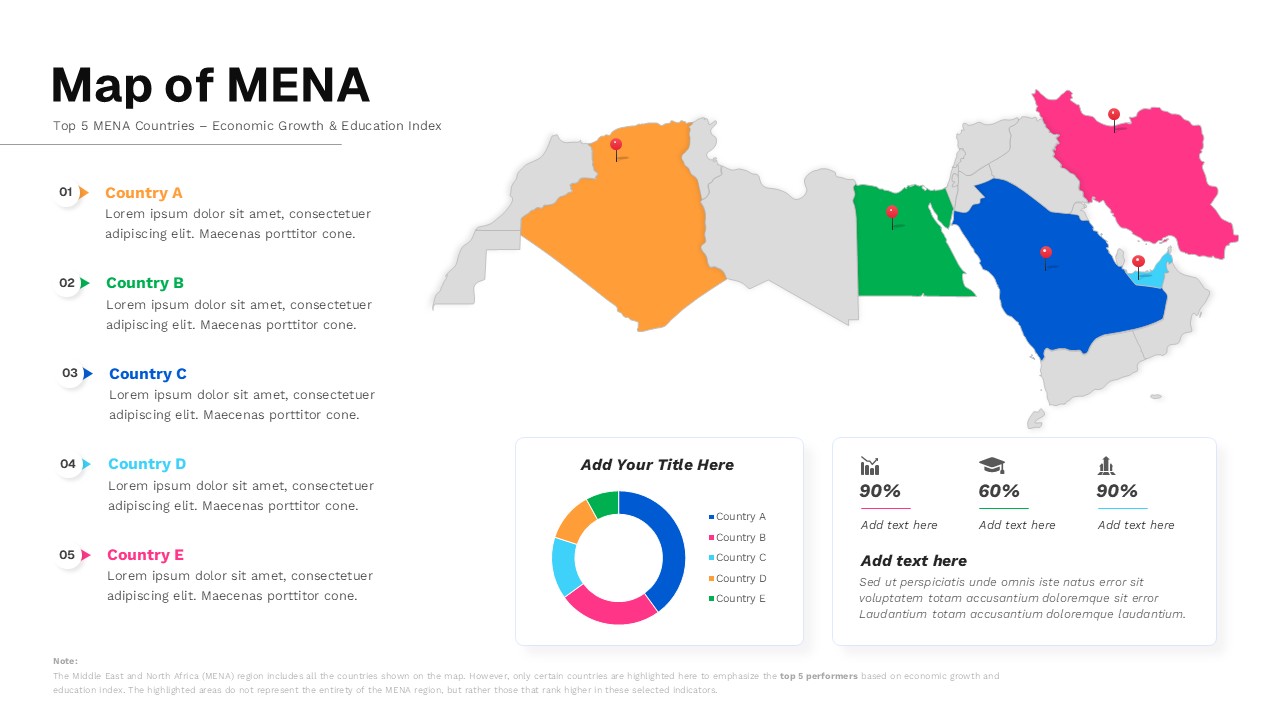
Map of MENA Infographic Template for PowerPoint & Google Slides
World Maps
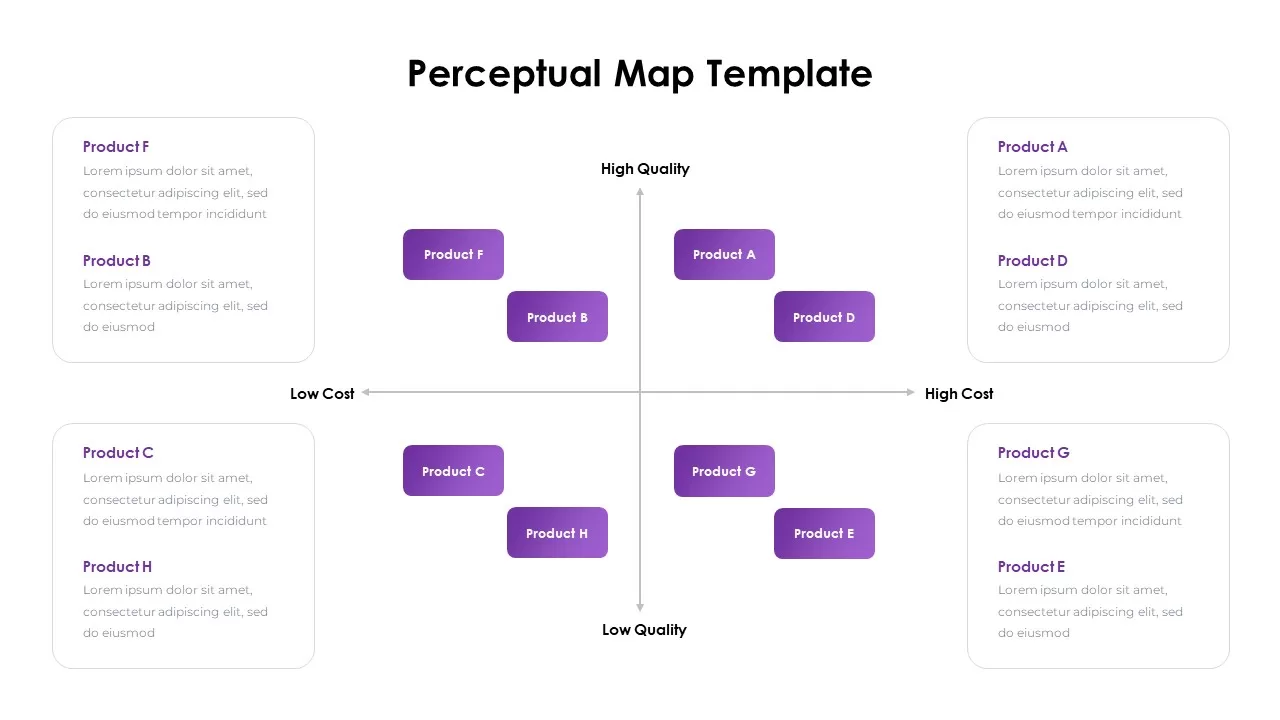
Perceptual Map infographic for PowerPoint & Google Slides
Competitor Analysis
Mind Map PowerPoint template for PowerPoint & Google Slides
Mind Maps
Editable Colombia Map PowerPoint Template for PowerPoint & Google Slides
Business Models
World Map Data template for PowerPoint & Google Slides
World Maps
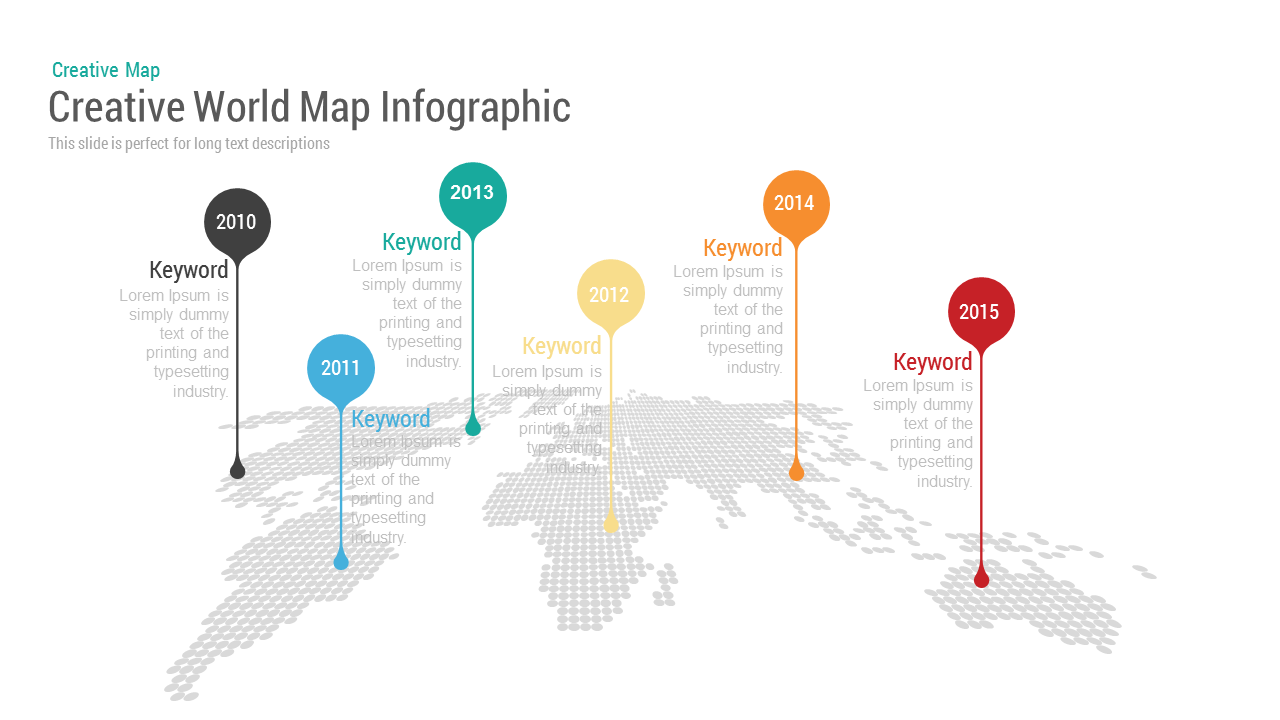
Creative World Map template for PowerPoint & Google Slides
World Maps
Interactive US Population Data Map Slide Template for PowerPoint & Google Slides
World Maps
Asia Map with KPI Metrics and Legend Template for PowerPoint & Google Slides
World Maps
Diamond Mind Map Diagram Four Branches Template for PowerPoint & Google Slides
Mind Maps
Simple Multi-Branch Mind Map Template for PowerPoint & Google Slides
Mind Maps
Customizable USA Map With State Markers Template for PowerPoint & Google Slides
World Maps
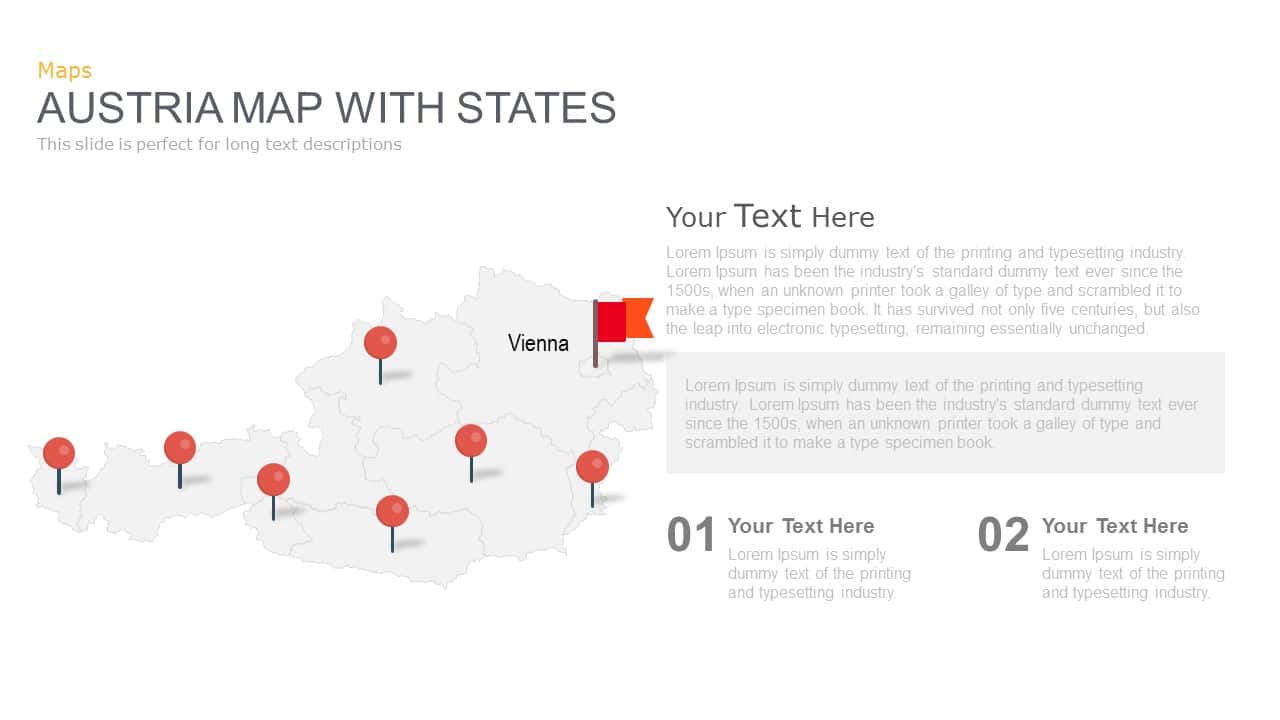
Austria Map With State Markers Template for PowerPoint & Google Slides
World Maps
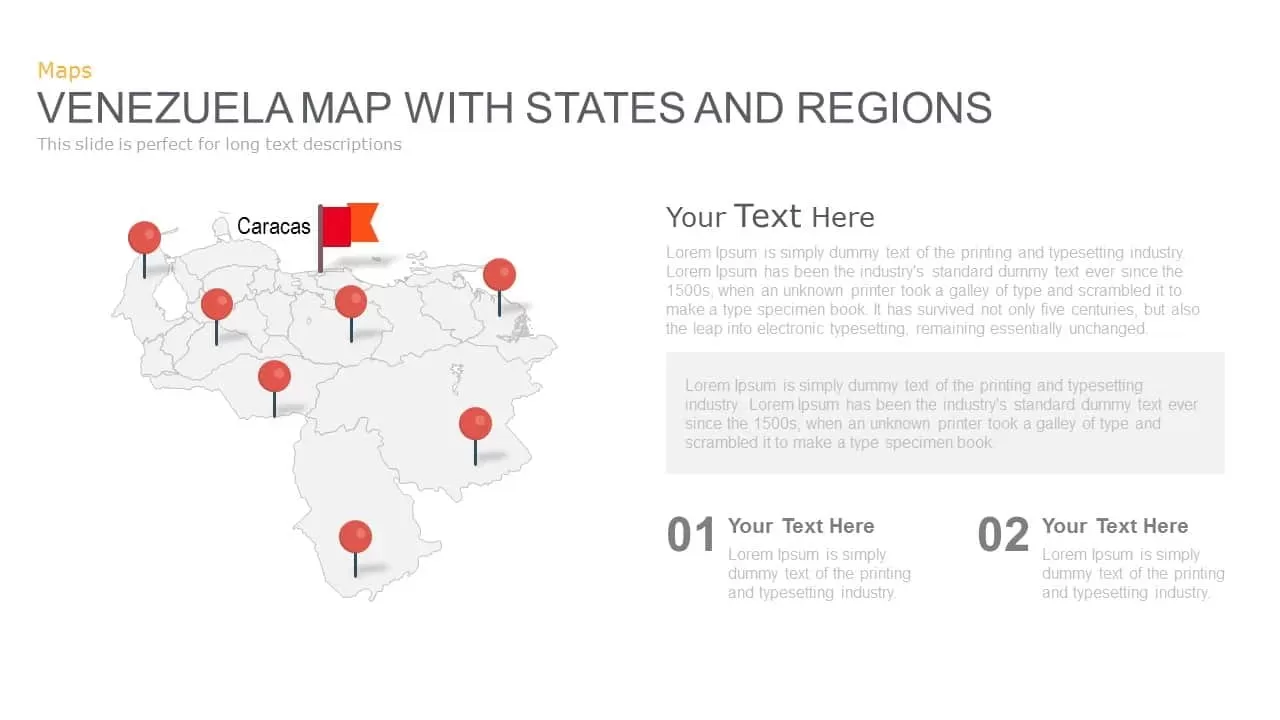
Venezuela Map with States and Regions Template for PowerPoint & Google Slides
World Maps
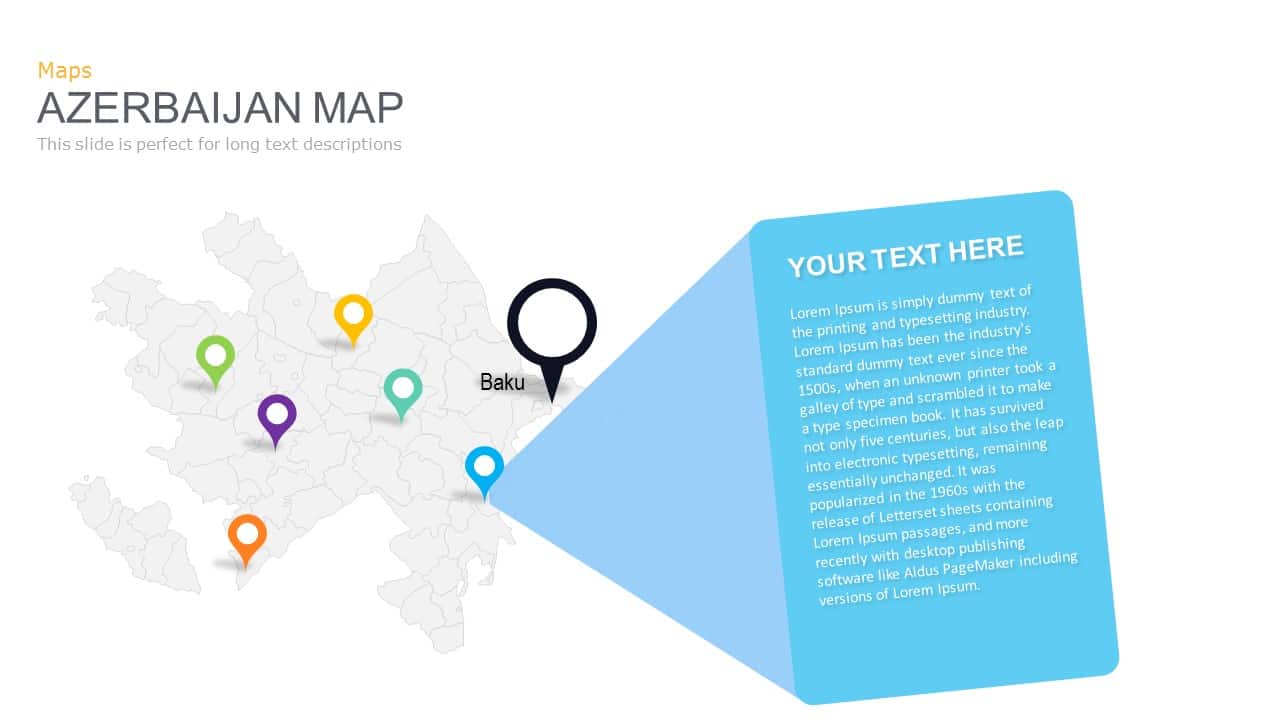
Azerbaijan Map with Provinces & Callouts Template for PowerPoint & Google Slides
World Maps
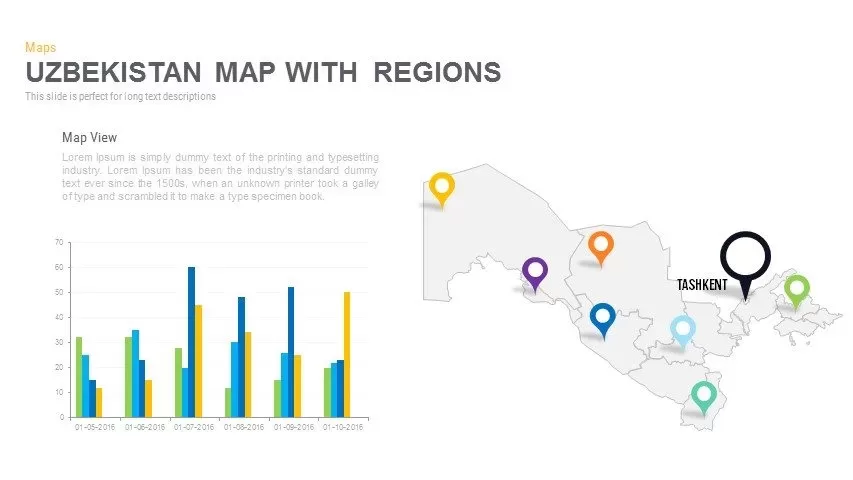
Uzbekistan Map with Regions Pack Template for PowerPoint & Google Slides
Maps
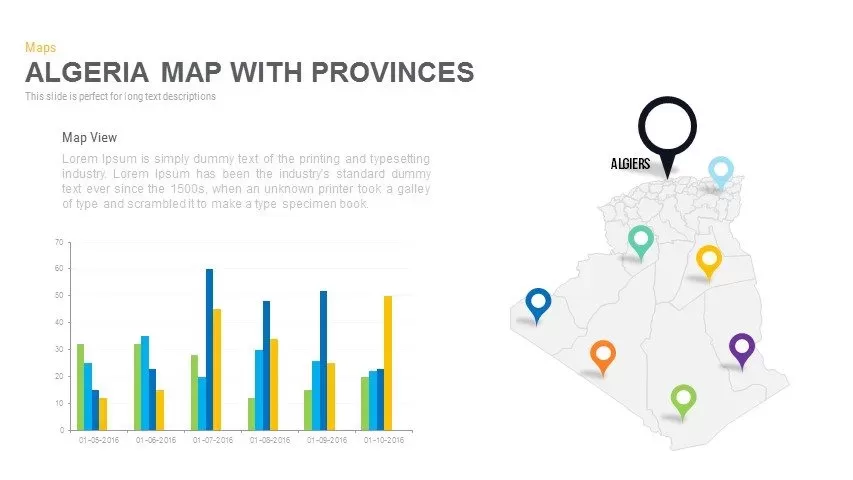
Algeria Map with Provinces Pack Template for PowerPoint & Google Slides
Maps
Chad Map with Regions Slide Pack Template for PowerPoint & Google Slides
World Maps
DR Congo Prefecture Map Slide Pack Template for PowerPoint & Google Slides
World Maps
Egypt Regional Map Slide Pack Template for PowerPoint & Google Slides
World Maps
Ethiopia Map with Regions Slide Pack Template for PowerPoint & Google Slides
World Maps
Iran Map with Provinces Slide Pack Template for PowerPoint & Google Slides
World Maps

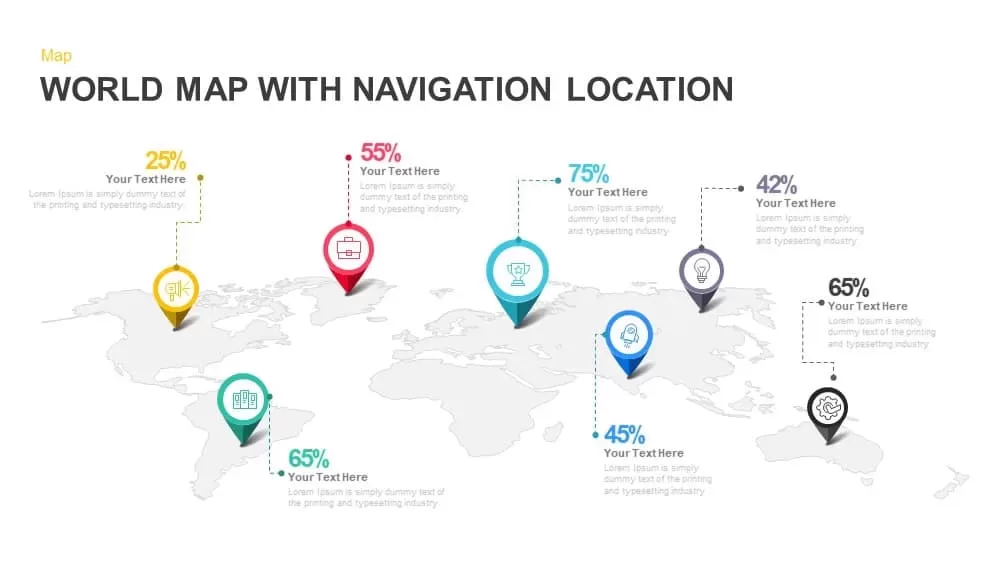
Global Map with Location Markers Template for PowerPoint & Google Slides
World Maps
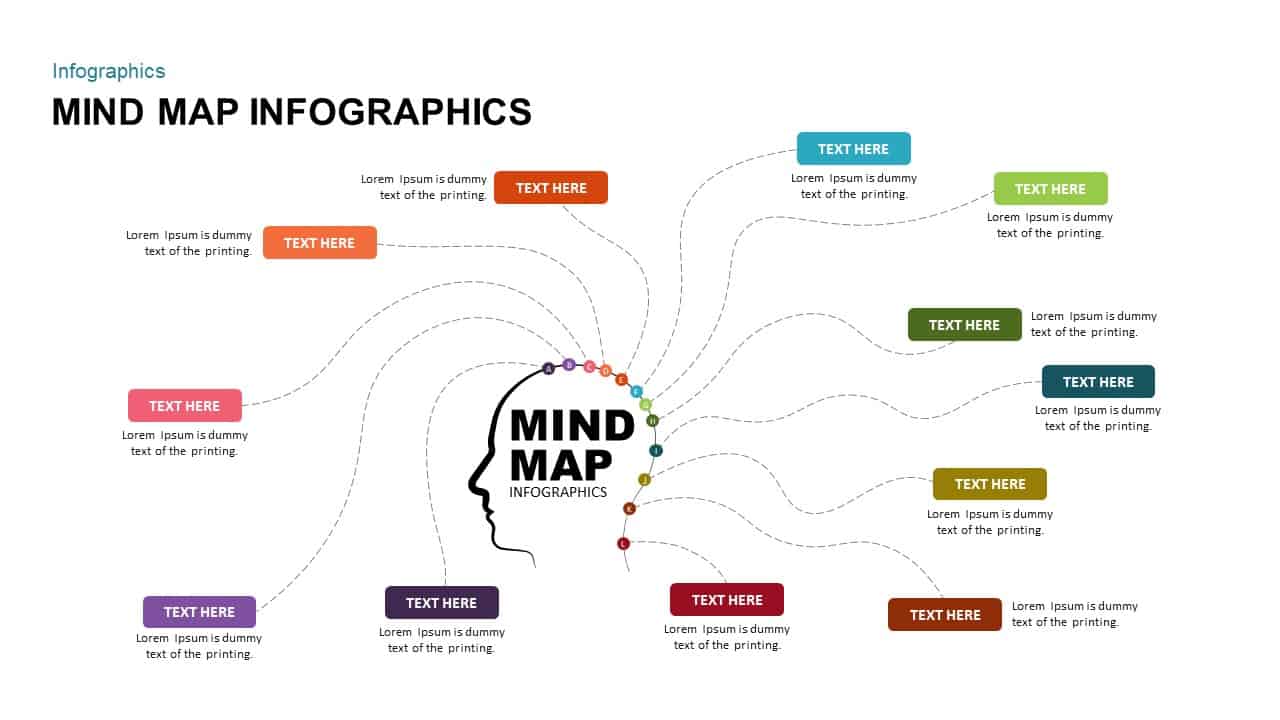
Mind Map Infographics template for PowerPoint & Google Slides
Mind Maps
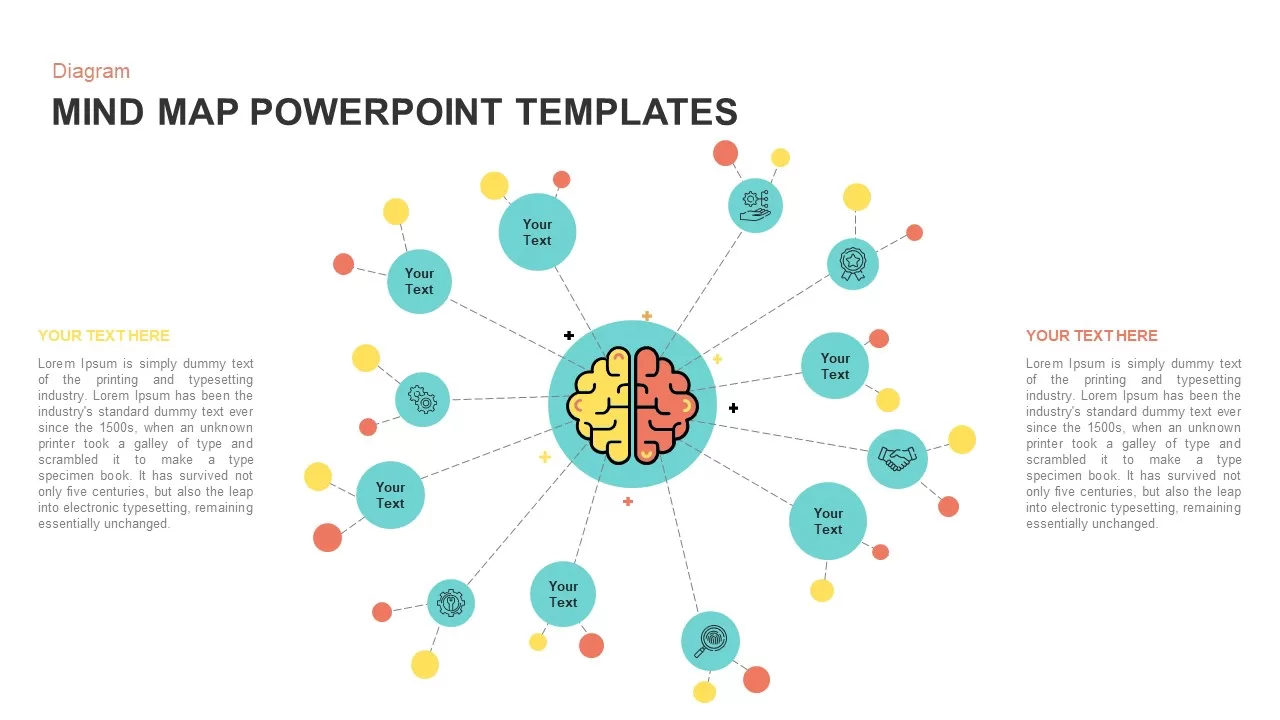
Mind Map Diagram Template for PowerPoint & Google Slides
Mind Maps
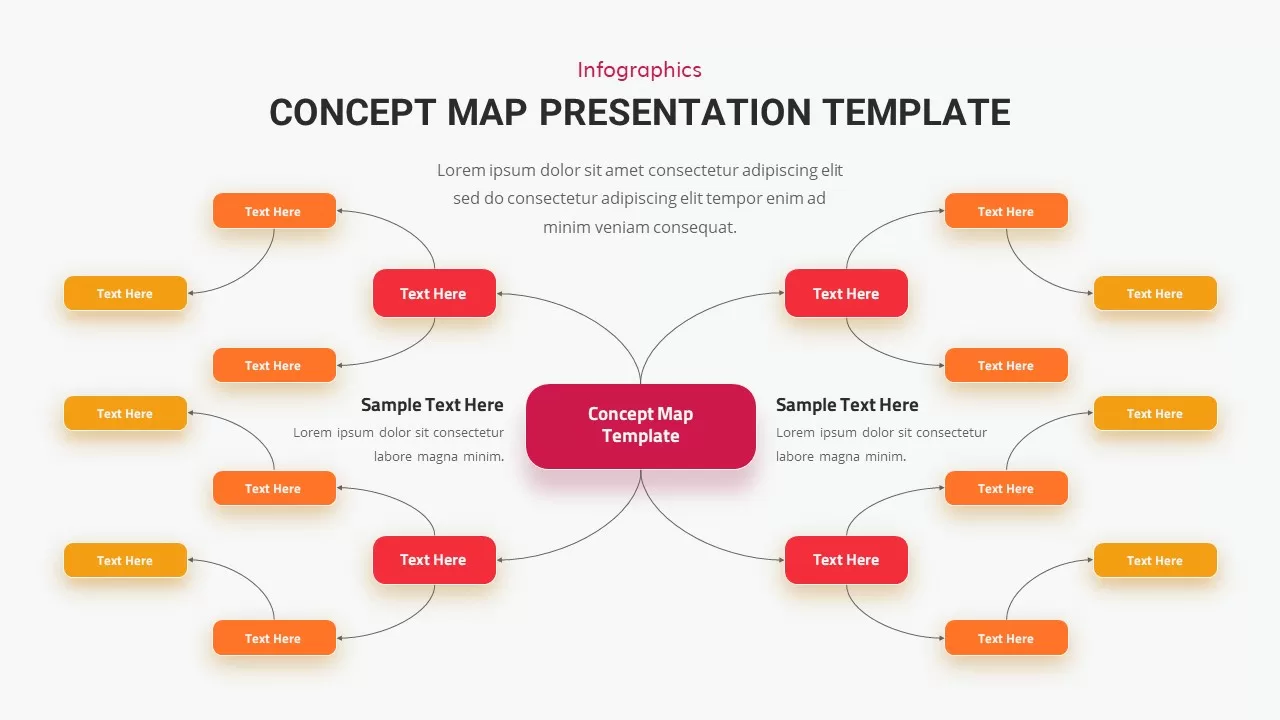
Concept Map Presentation Template for PowerPoint & Google Slides
Mind Maps
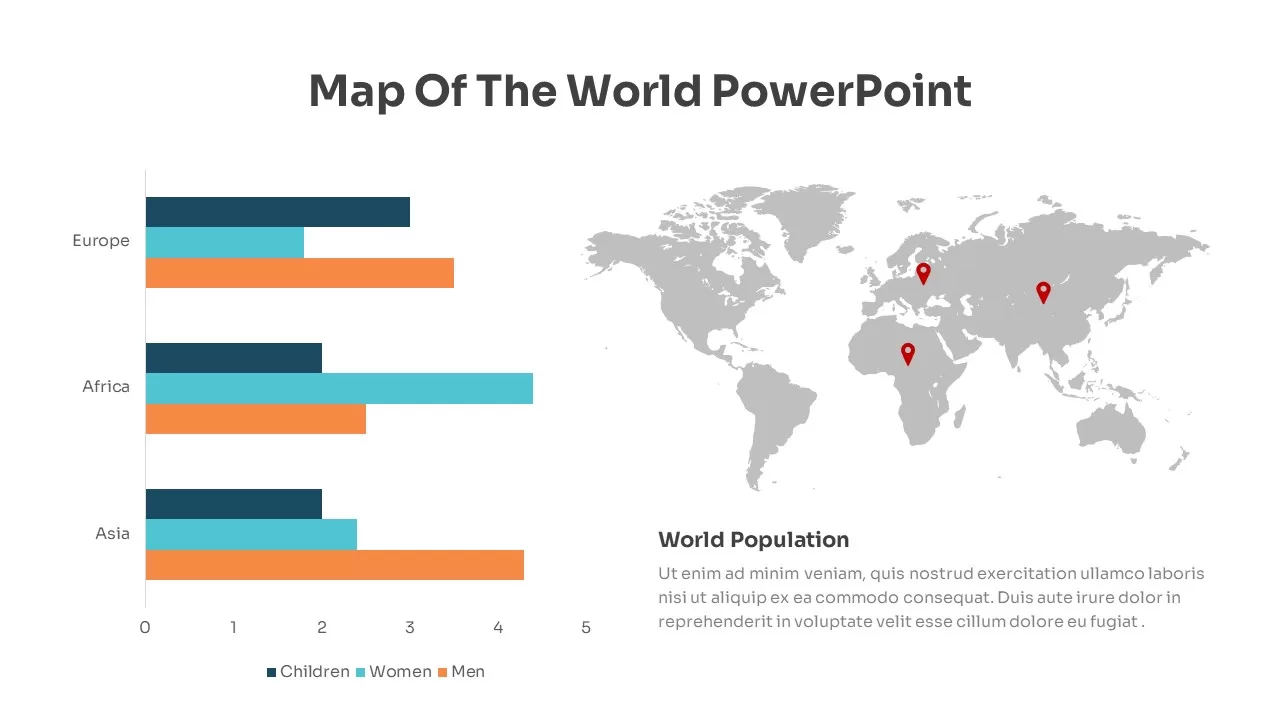
Global Population Demographics & Map Template for PowerPoint & Google Slides
Bar/Column
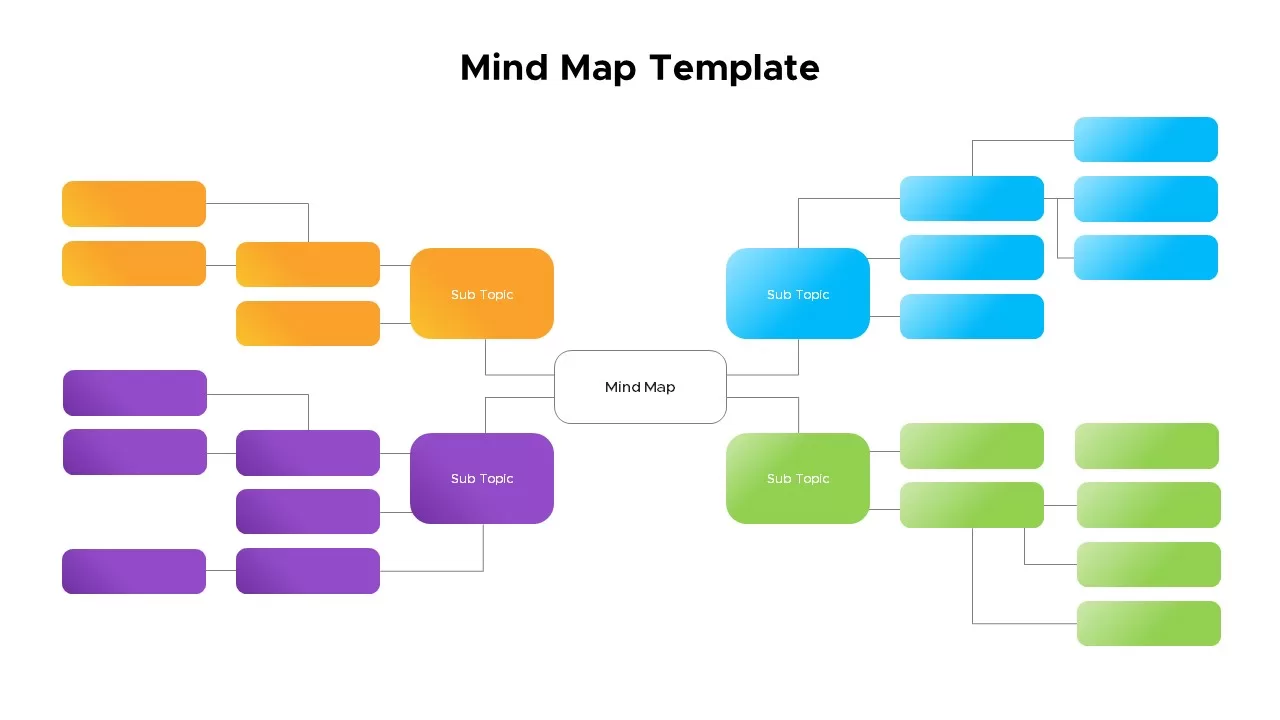
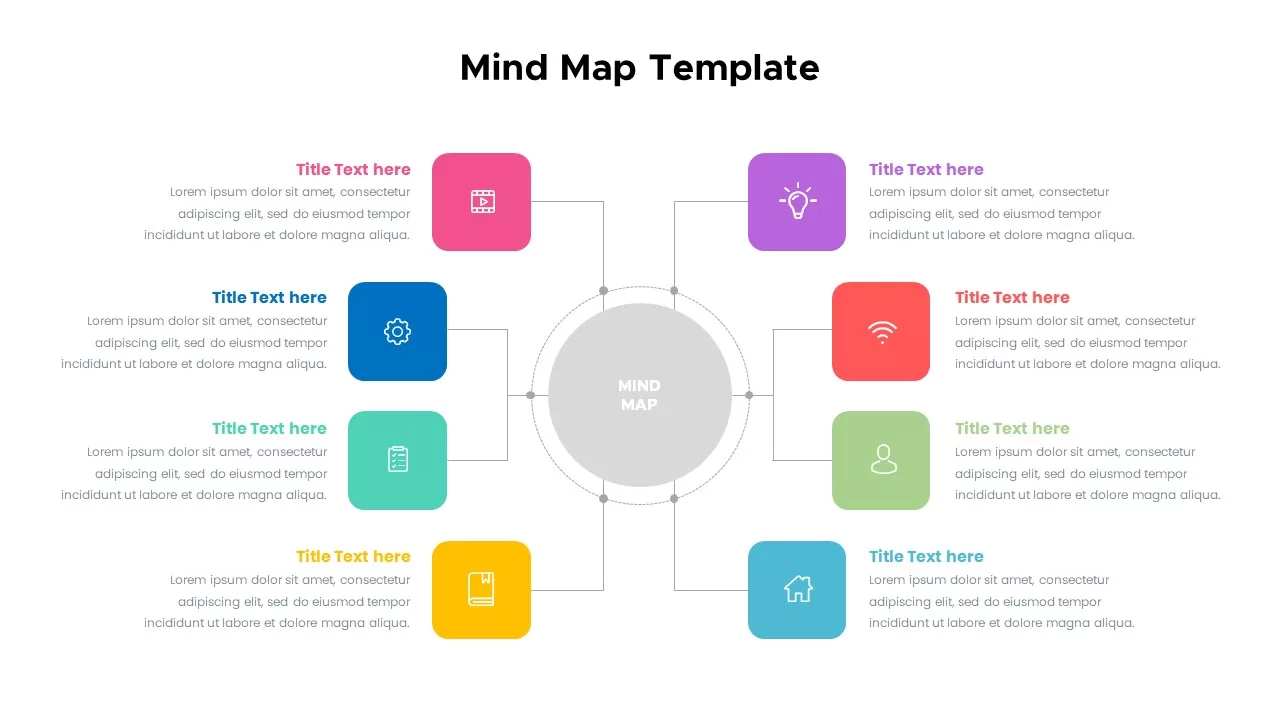
Mind Map Template for PowerPoint & Google Slides
Mind Maps
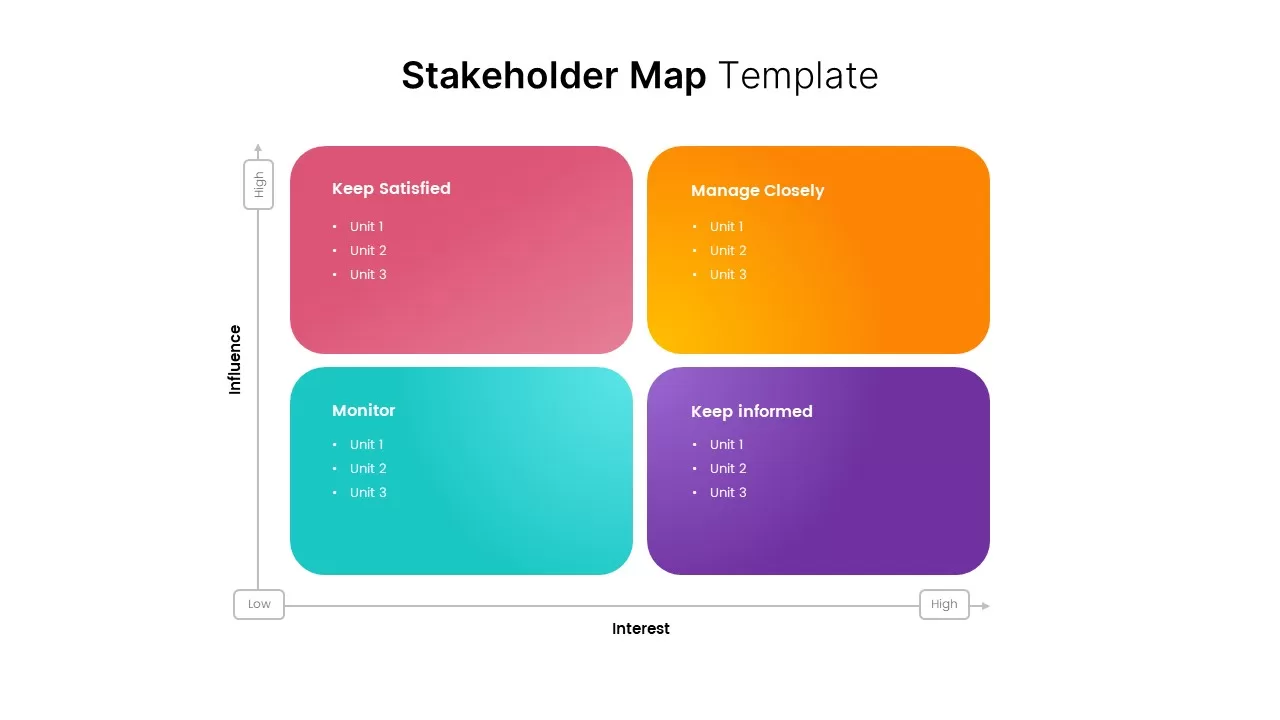
Stakeholder Map Template for PowerPoint & Google Slides
Business
Colorful Mind Map with Icons Template for PowerPoint & Google Slides
Mind Maps
Colorful Mind Map Template for PowerPoint & Google Slides
Mind Maps
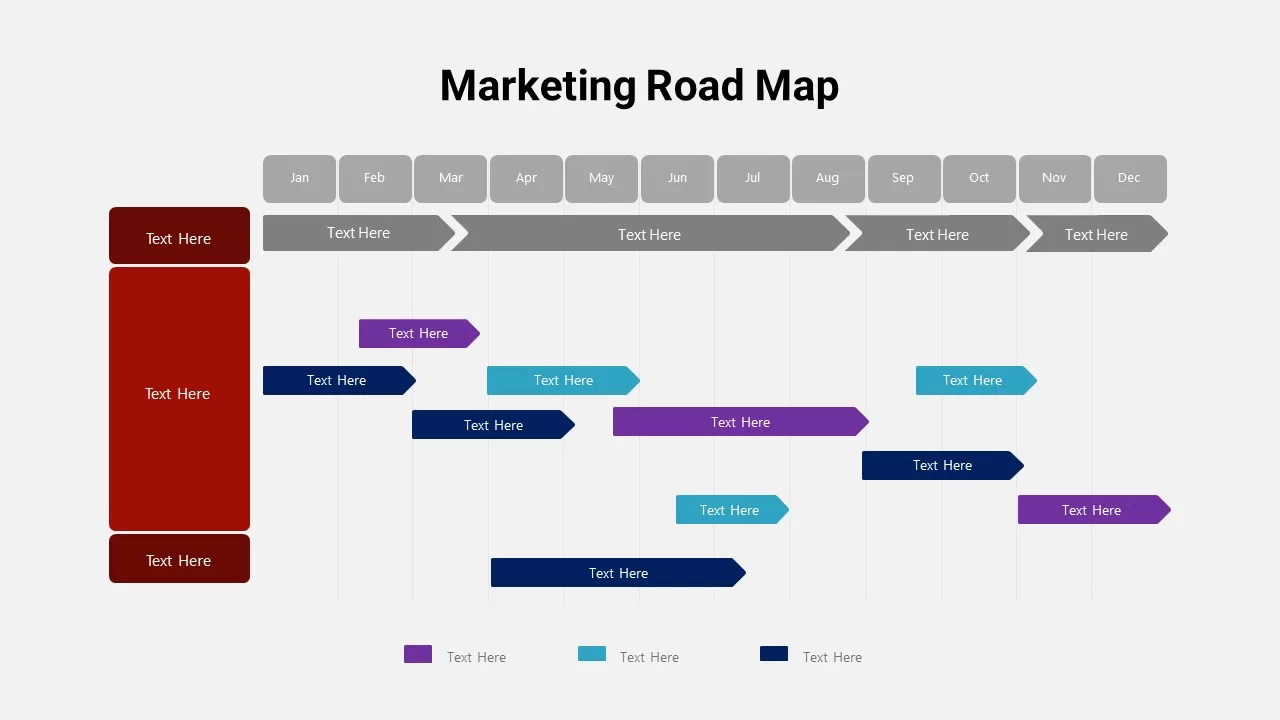
Detailed Marketing Road Map Timeline Template for PowerPoint & Google Slides
Timeline
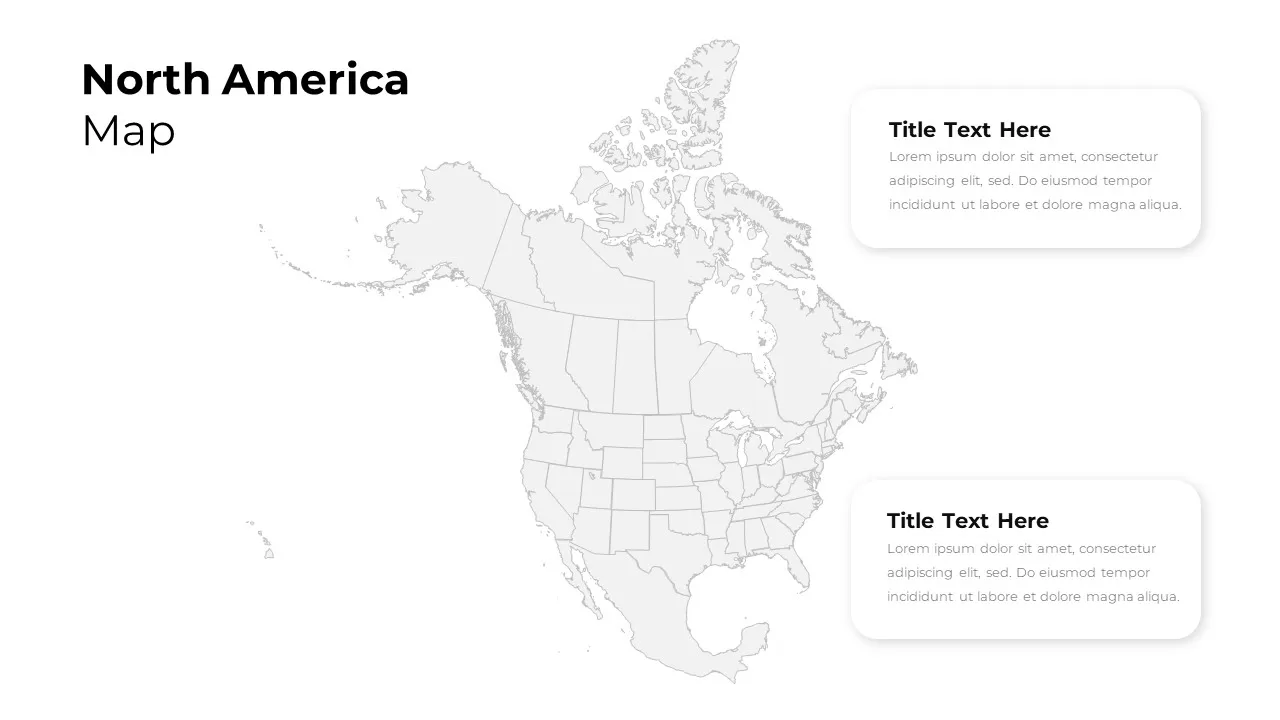
North America Regional Map Overview Template for PowerPoint & Google Slides
World Maps
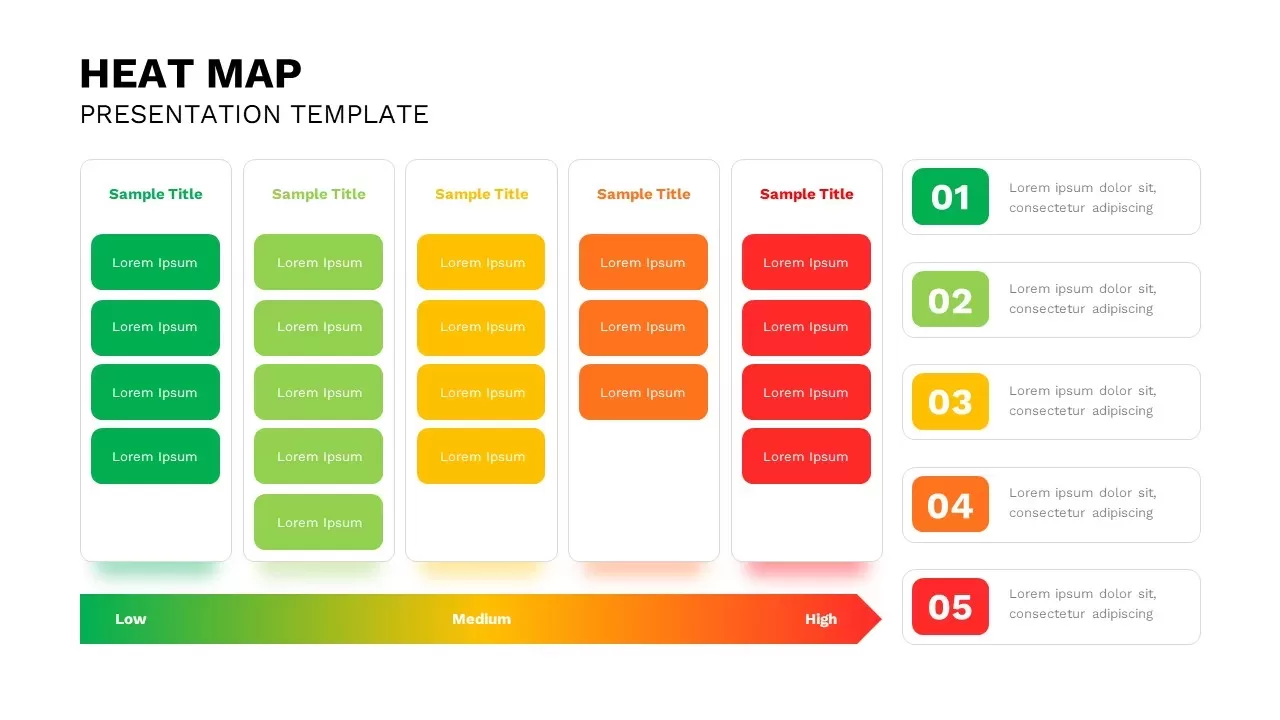
Heat Map Analysis Template for PowerPoint & Google Slides
Risk Management
Professional Risk Heat Map Visualization Template for PowerPoint & Google Slides
Risk Management
Interactive Heat Map Template for PowerPoint & Google Slides
Bar/Column
Heat Map Risk Matrix Dashboard Template for PowerPoint & Google Slides
Comparison Chart
Free Editable Saudi Arabia Map Template for PowerPoint & Google Slides
World Maps
Germany Map with Regional Callouts Template for PowerPoint & Google Slides
World Maps
Free Global Market Distribution Map Template for PowerPoint & Google Slides
World Maps
Free
Interactive Oklahoma County Map Template for PowerPoint & Google Slides
World Maps
Modern Custom Eight-Branch Mind Map Template for PowerPoint & Google Slides
Mind Maps
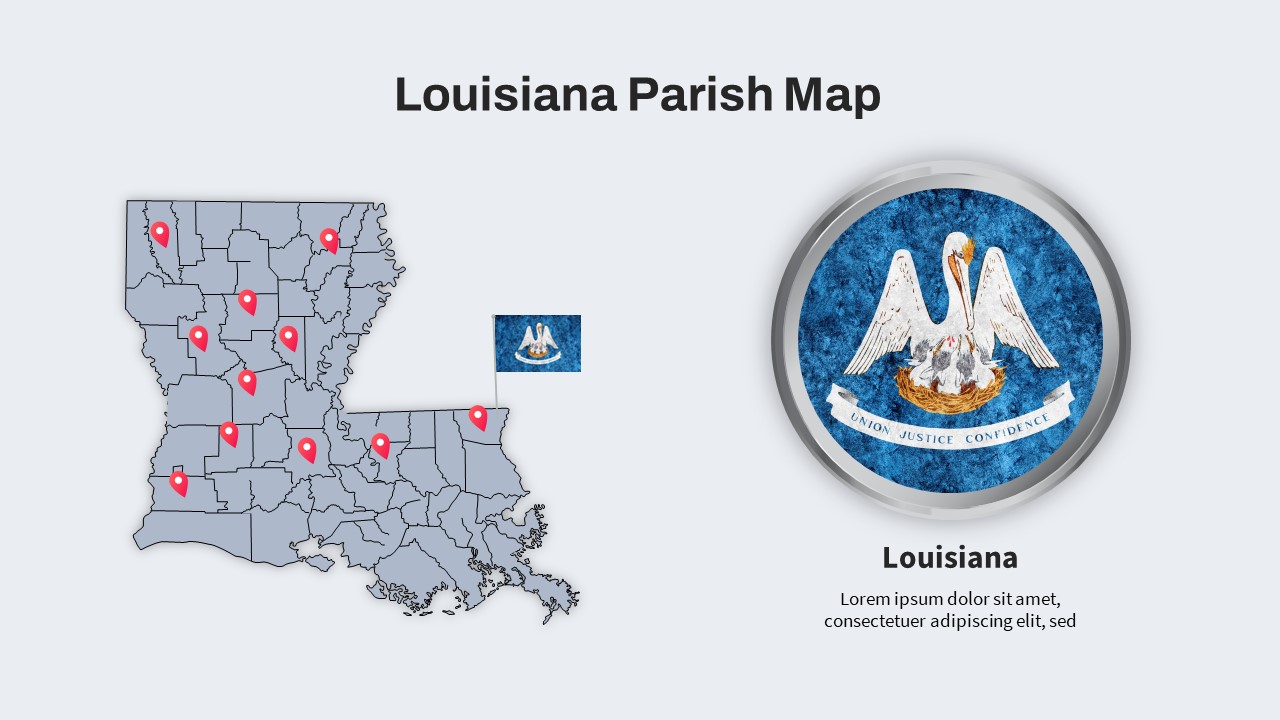
Louisiana Parish Map with Markers Template for PowerPoint & Google Slides
Maps
Colorful Multi-Branch Mind Map Slide Template for PowerPoint & Google Slides
Mind Maps
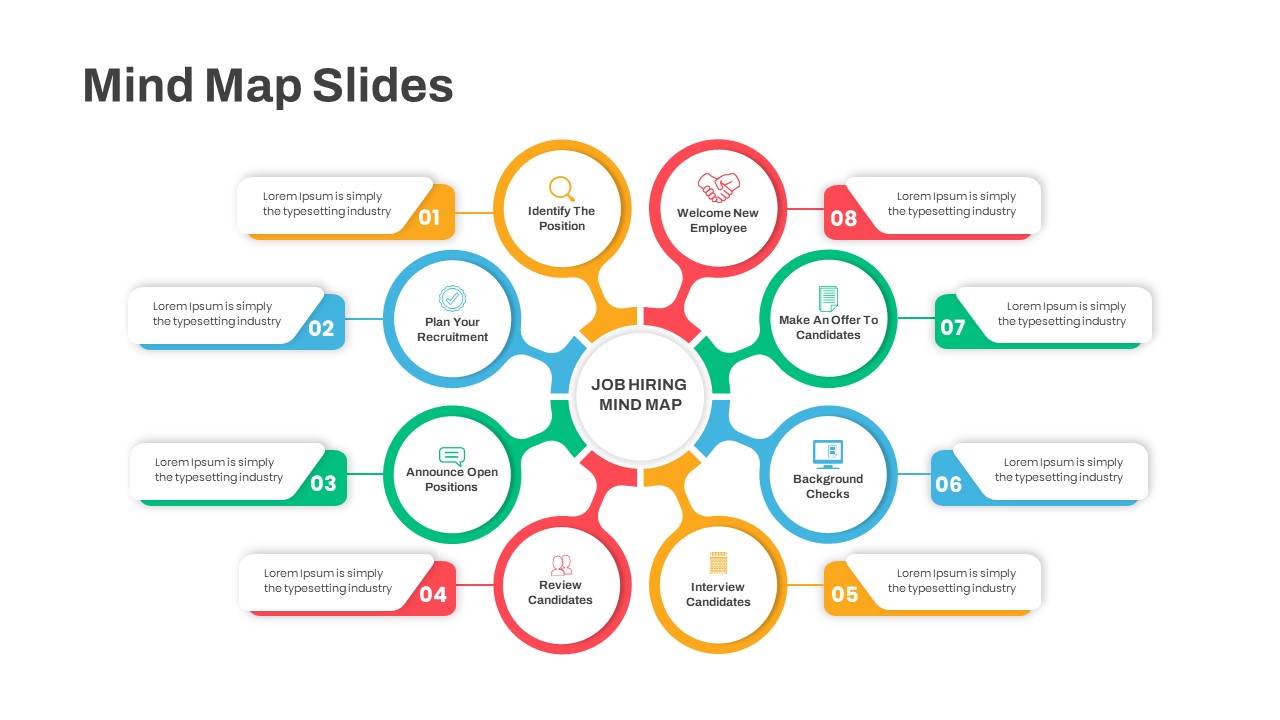
Eight-Step Job Hiring Mind Map Template for PowerPoint & Google Slides
Mind Maps
Michigan County Map with KPI Dashboard Template for PowerPoint & Google Slides
World Maps
Kentucky County Map Visualization Template for PowerPoint & Google Slides
World Maps
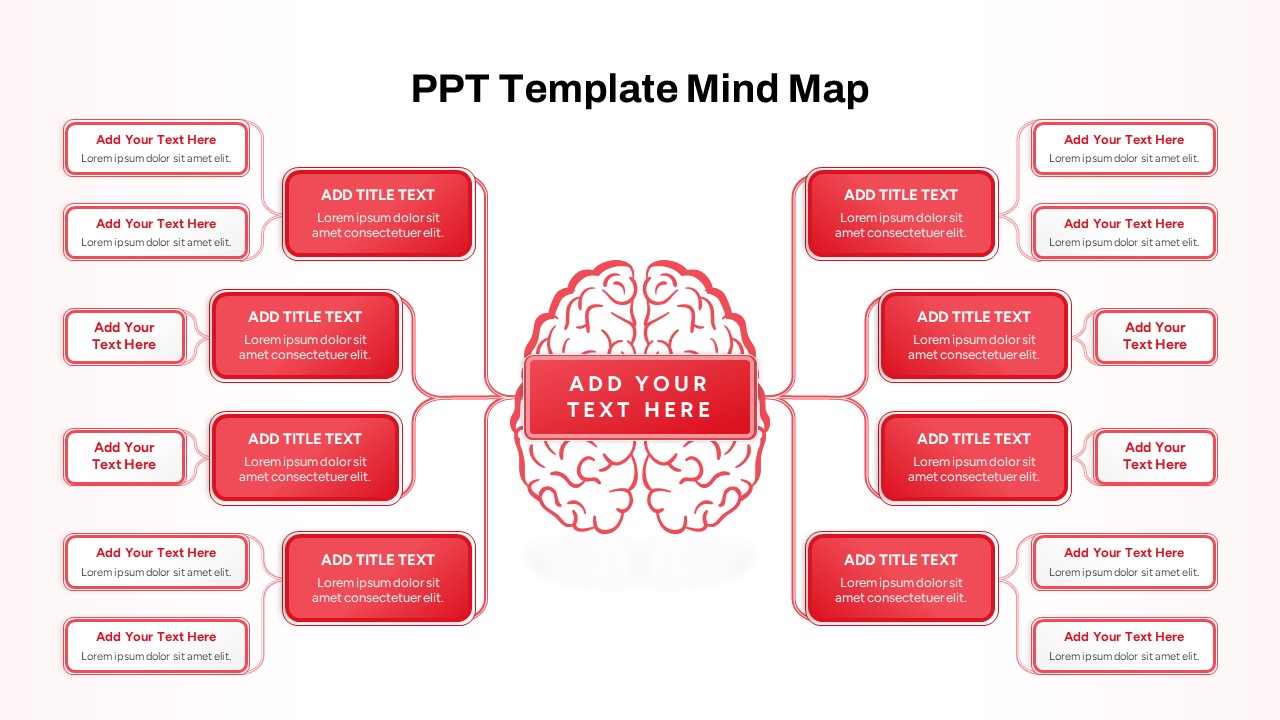
Red Brain Mind Map Diagram Template for PowerPoint & Google Slides
Mind Maps
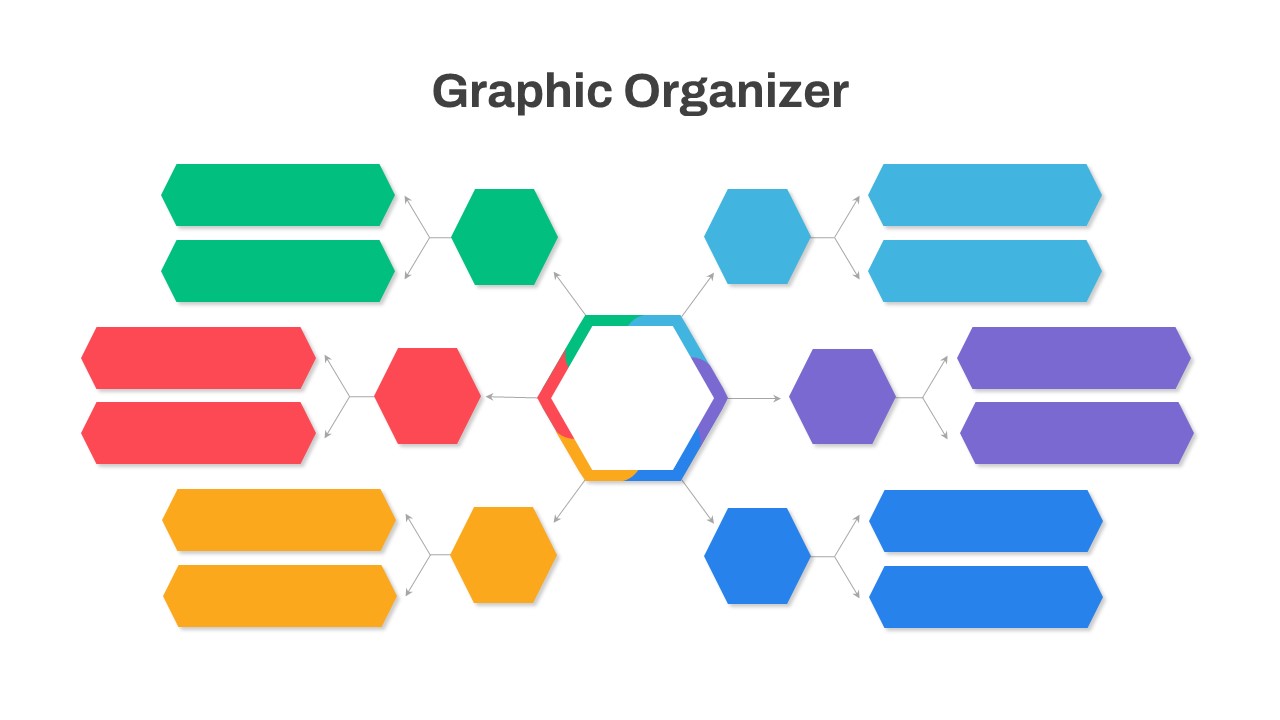
Graphic Organizer & Double Bubble Map Template for PowerPoint & Google Slides
Maps
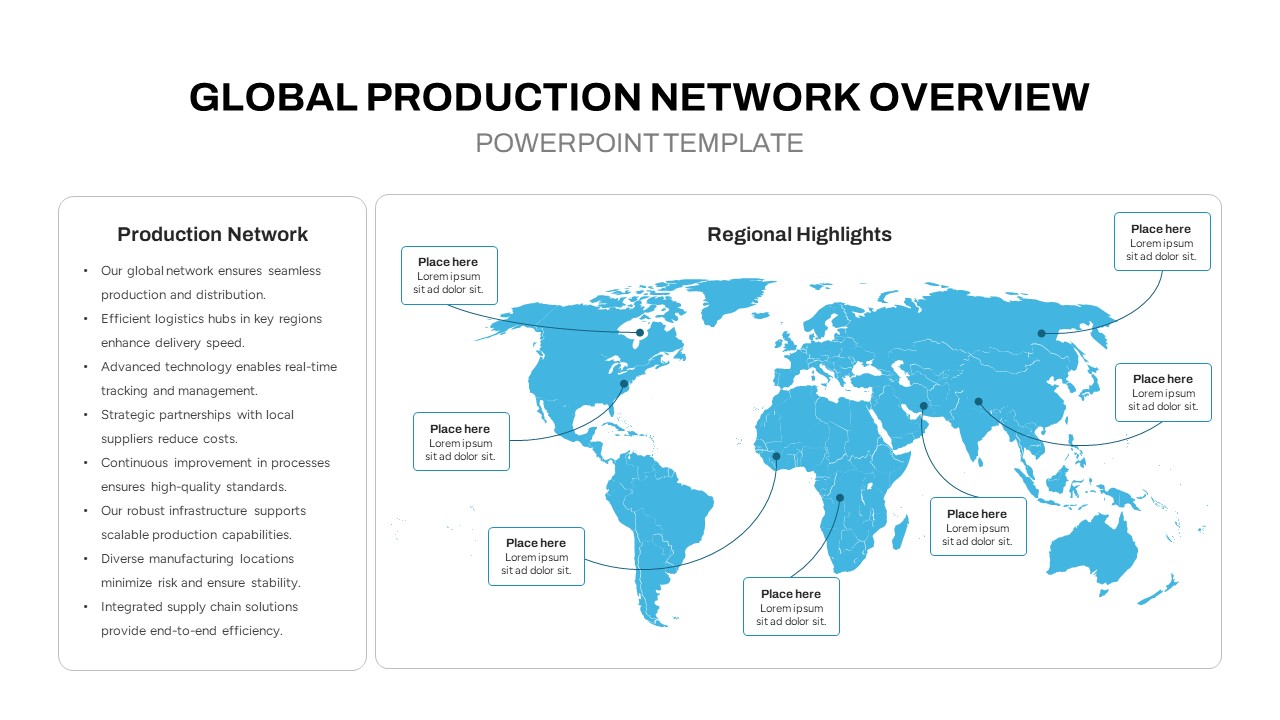
Global Production Network Overview Map Template for PowerPoint & Google Slides
World Maps
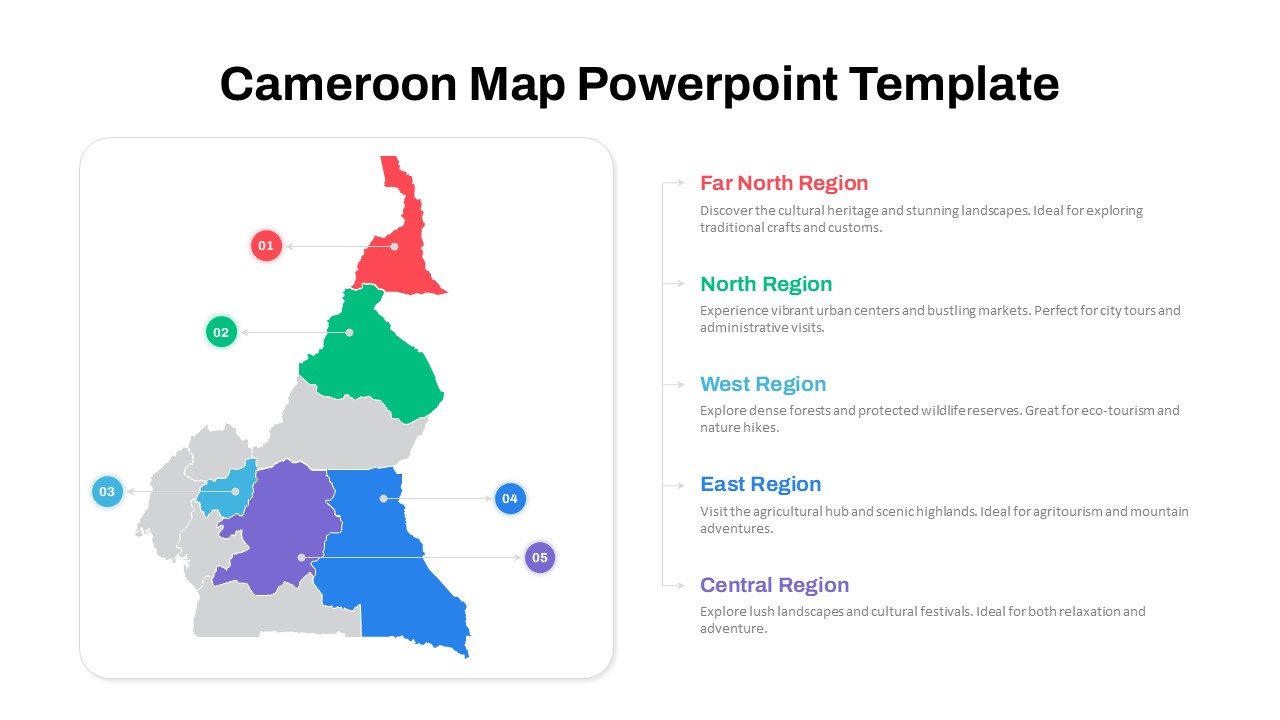
Numbered Cameroon Regional Map Slide Template for PowerPoint & Google Slides
World Maps
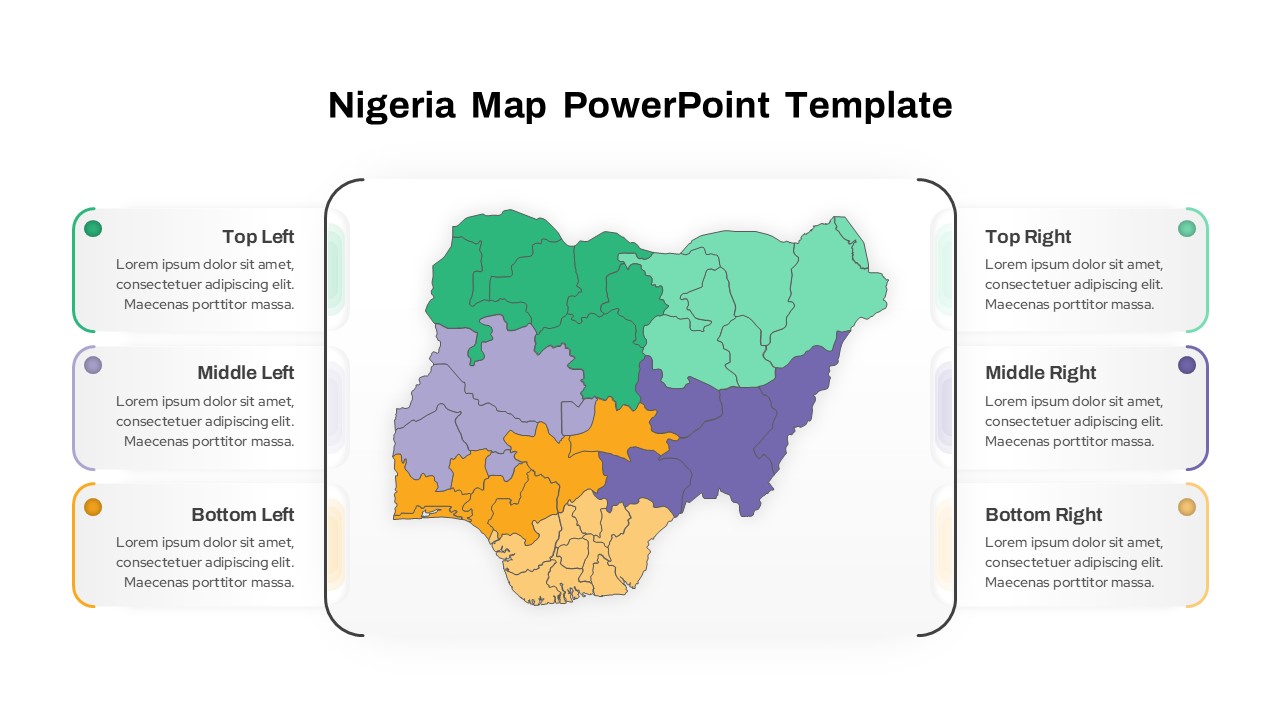
Nigeria Regional Callout Map Diagram Template for PowerPoint & Google Slides
Maps
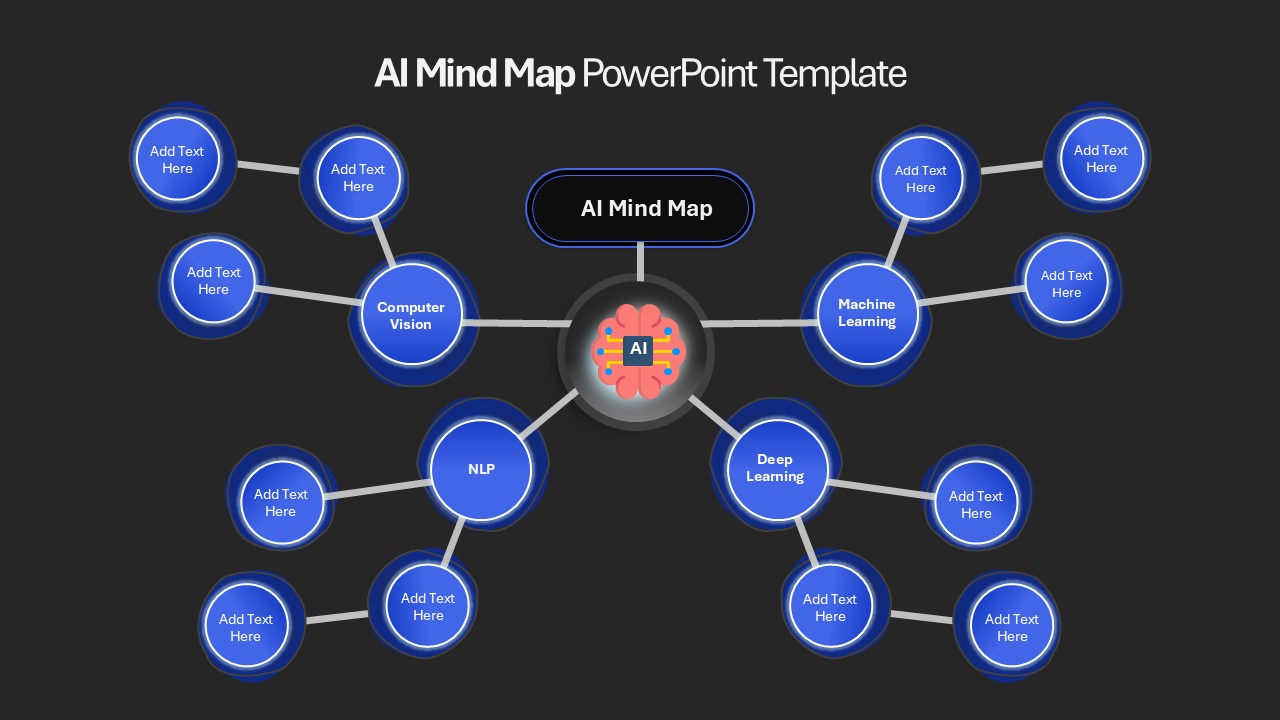
AI Mind Map & Hub-and-Spoke Diagram Template for PowerPoint & Google Slides
Mind Maps
AI and Data Ecosystem Map Template for PowerPoint & Google Slides
AI
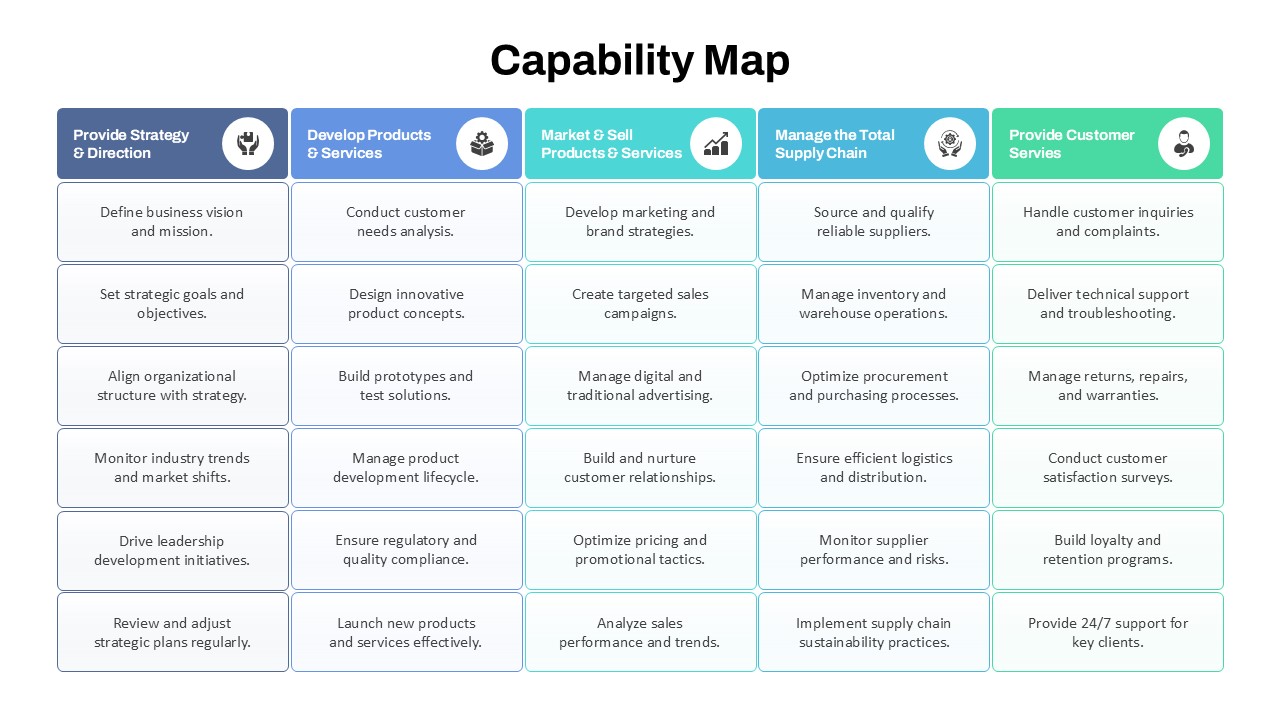
Capability Map Overview Template for PowerPoint & Google Slides
Business Strategy
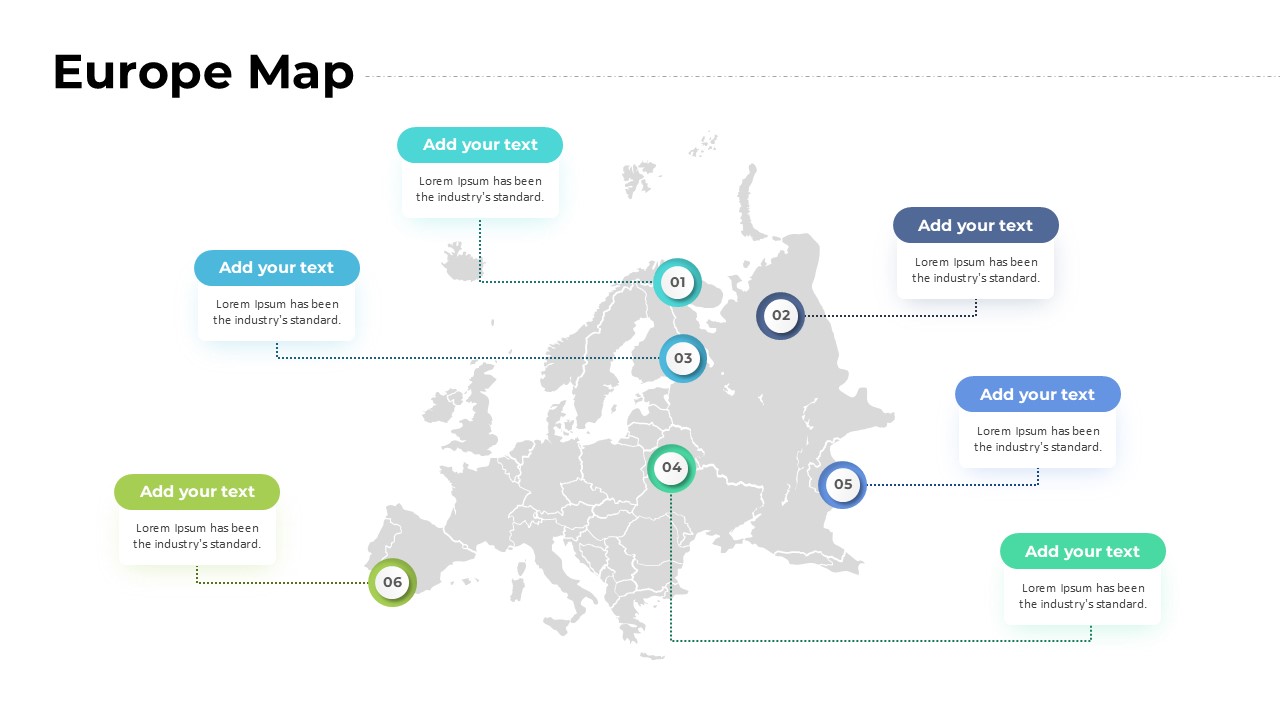
Europe Map with Six Editable Points Template for PowerPoint & Google Slides
World Maps
USA Map with Bar Chart Template for PowerPoint & Google Slides
World Maps
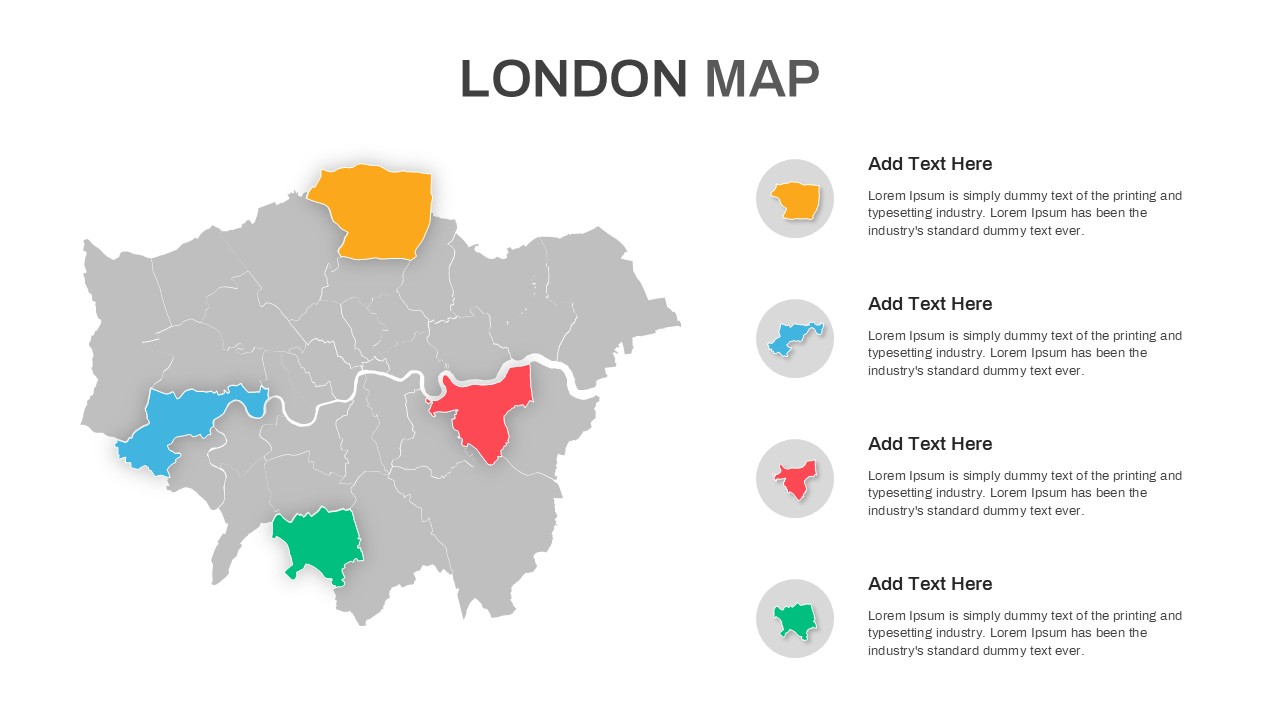
London Map with Highlighted Boroughs Template for PowerPoint & Google Slides
World Maps