Good Better Best Comparison template for PowerPoint & Google Slides


Description
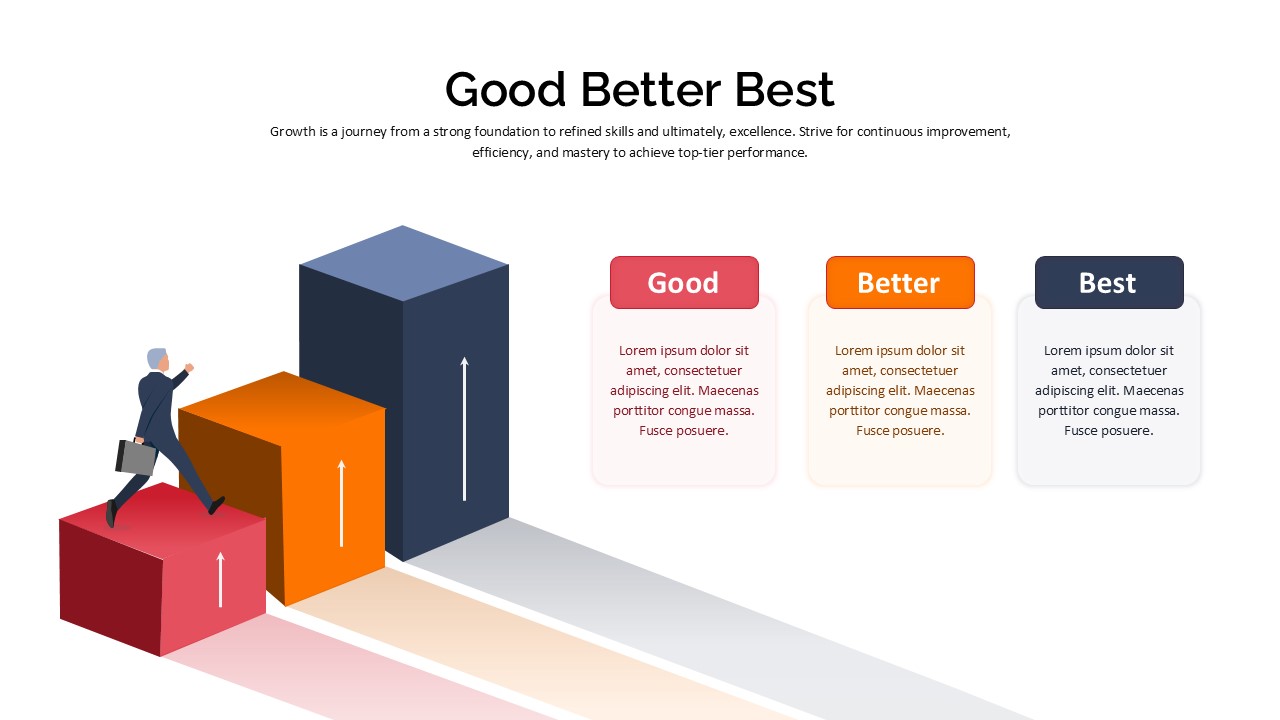
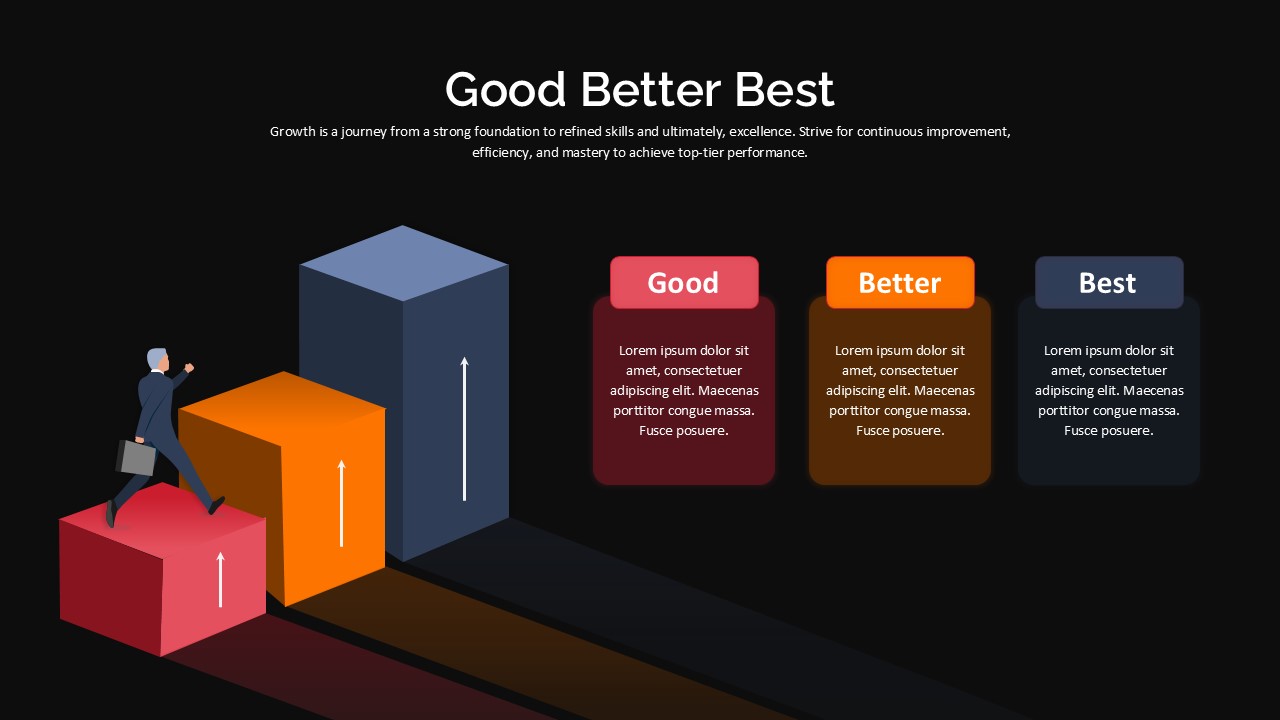
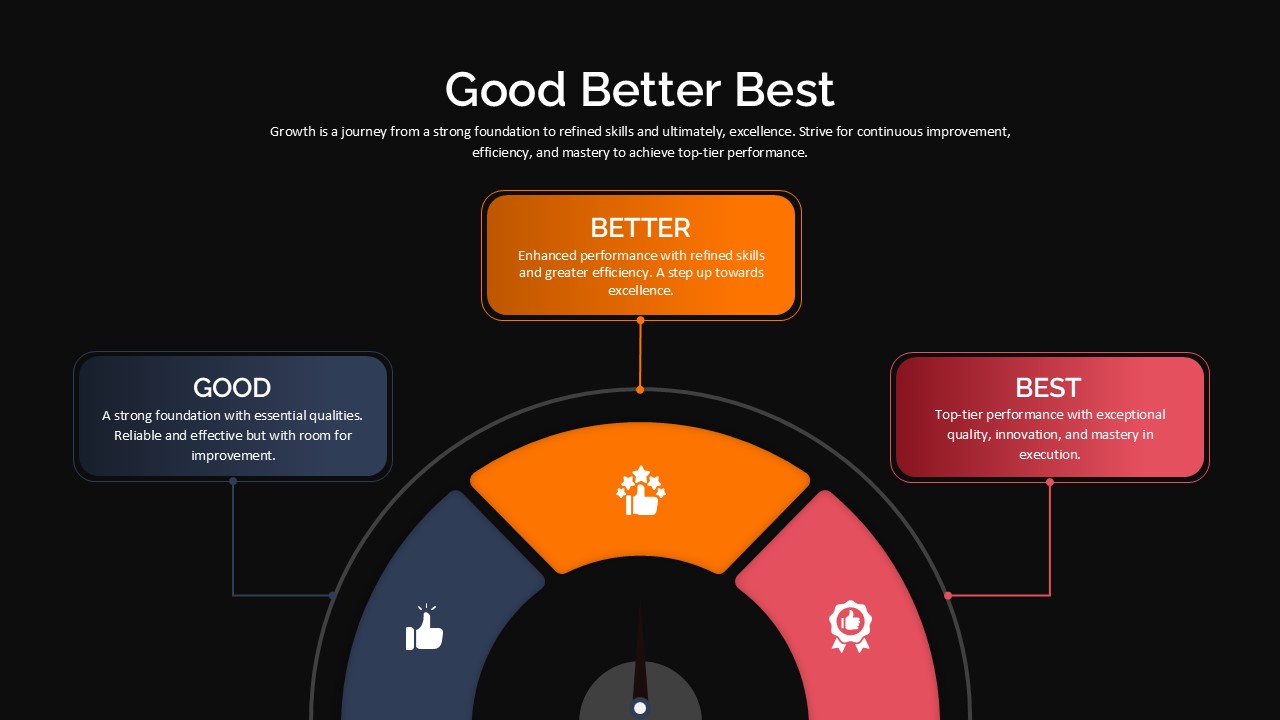
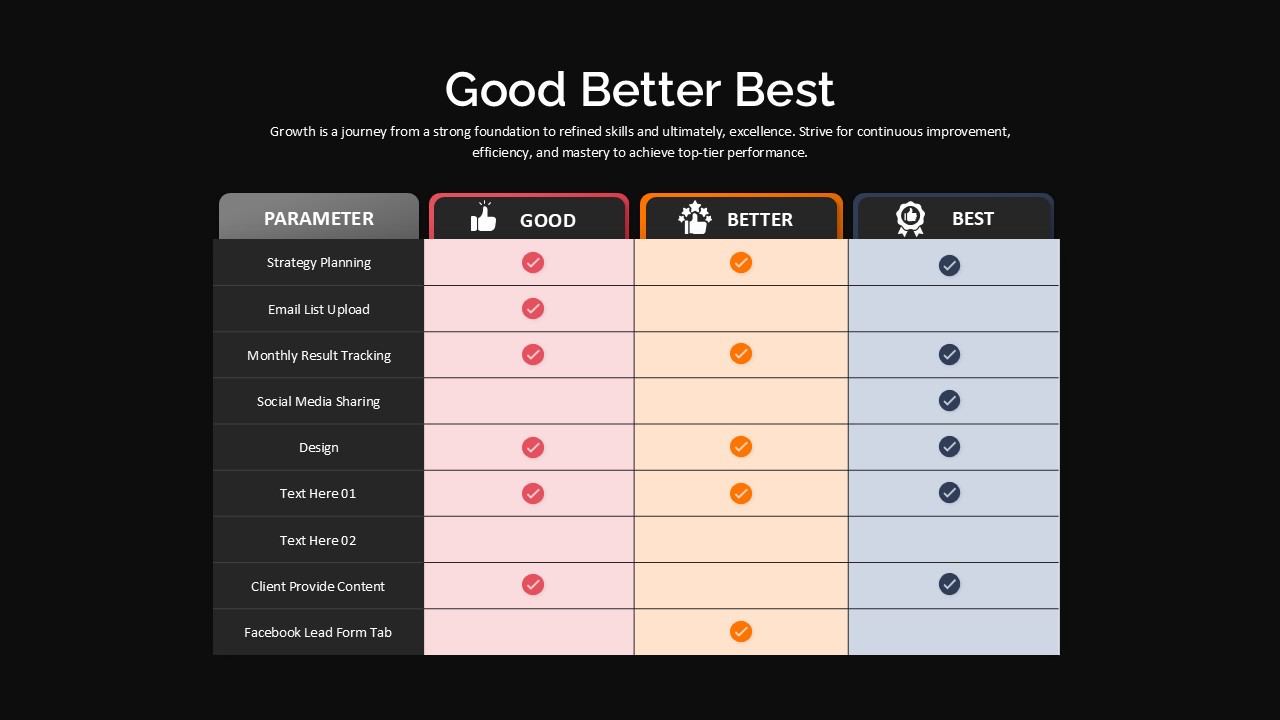
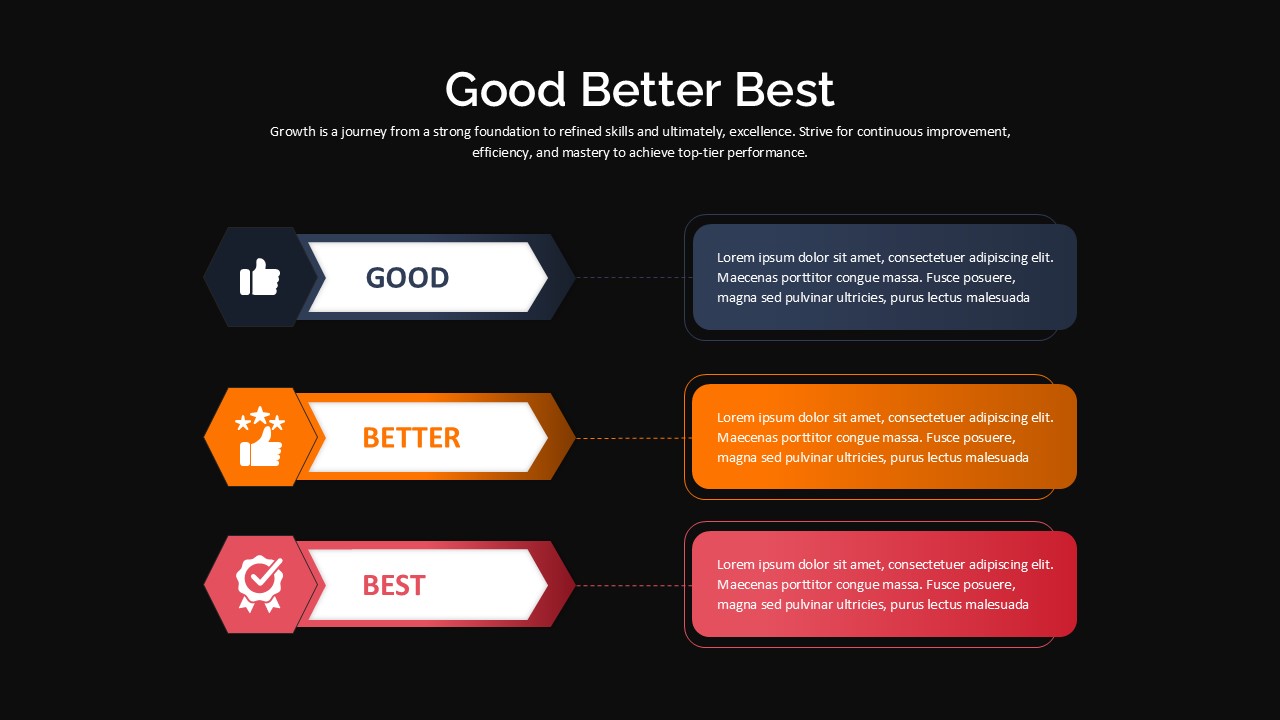
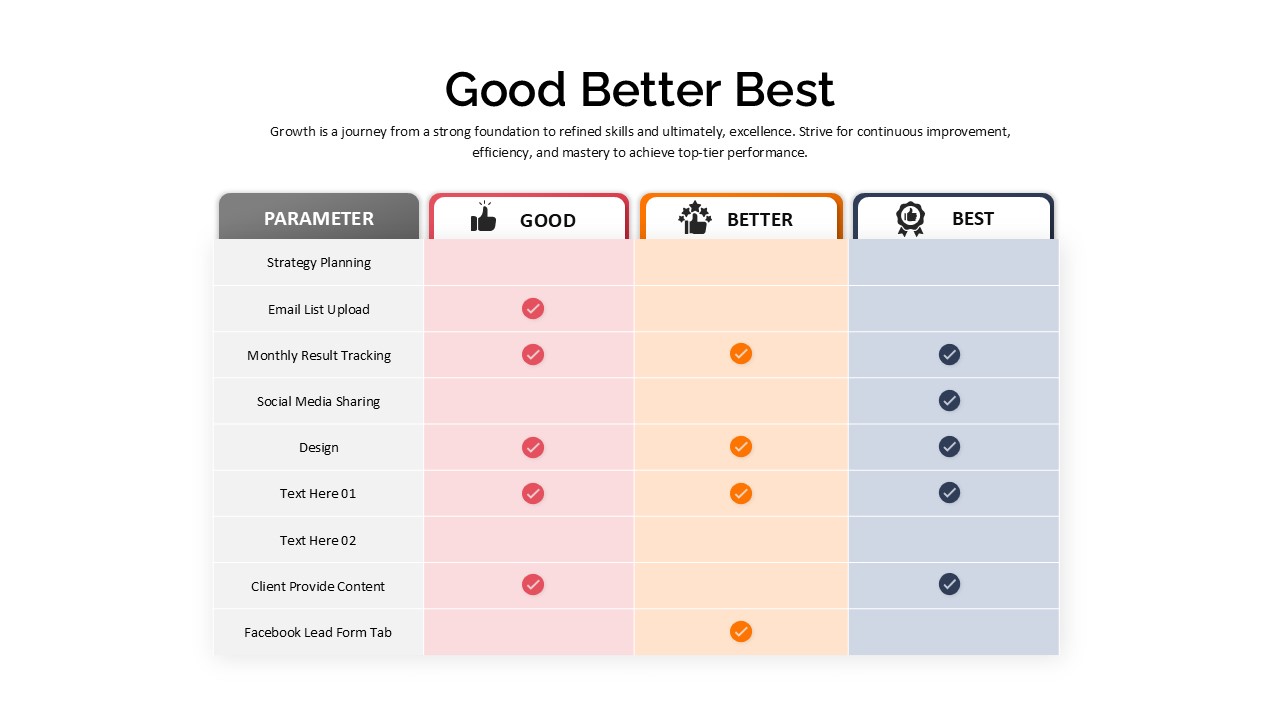
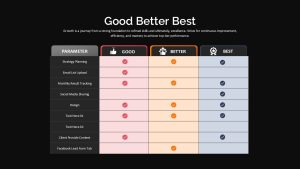
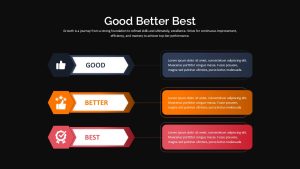
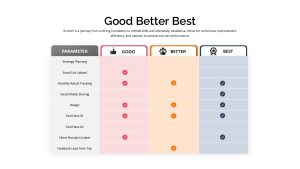
This Good Better Best Comparison template allows you to clearly present the progressive improvements of various parameters across four different levels—Good, Better, and Best. The slide is designed to help assess and compare performance, goals, or deliverables in a visually engaging manner. The template uses color-coded cells—pink for Good, orange for Better, and blue for Best—to visually differentiate each stage, with checkmarks indicating the completion or quality level for each parameter. The layout fits well within the broader family of comparison templates used for structured performance or value based reviews.
It is ideal for performance reviews, project assessments, or service comparison scenarios, particularly for evaluating the quality of work, client expectations, or marketing efforts. The design provides a simple yet effective way to display which areas meet basic requirements (Good), exceed them (Better), and deliver outstanding results (Best). The template is fully customizable, making it easy to adapt for various purposes, whether presenting to stakeholders, team members, or clients.
Compatible with both PowerPoint and Google Slides, this template is a versatile asset for business presentations, performance tracking, and strategic planning.
Who is it for
This template is ideal for business managers, marketers, project managers, and consultants who need to present performance comparisons or project evaluations. It is also useful for teams assessing individual tasks or client service goals, and educators presenting grading systems or progress metrics.
Other Uses
In addition to performance scoring, this layout can support feature ranking, service level mapping, milestone reviews, and campaign evaluations. A team reviewing vendor strengths can pair the structure with the vendor comparison slide when supplier clarity is essential. A session focused on outlining the areas of disagreement or alignment between ideas or teams can work well with the conflict infographics comparison to show contrasting viewpoints beside your progressive scoring table.
Login to download this file

Item ID
SB04829
Related Templates

Service Zoom Feature Slides Comparison template for PowerPoint & Google Slides
Process
Simple Comparison Table Template for PowerPoint & Google Slides
Comparison
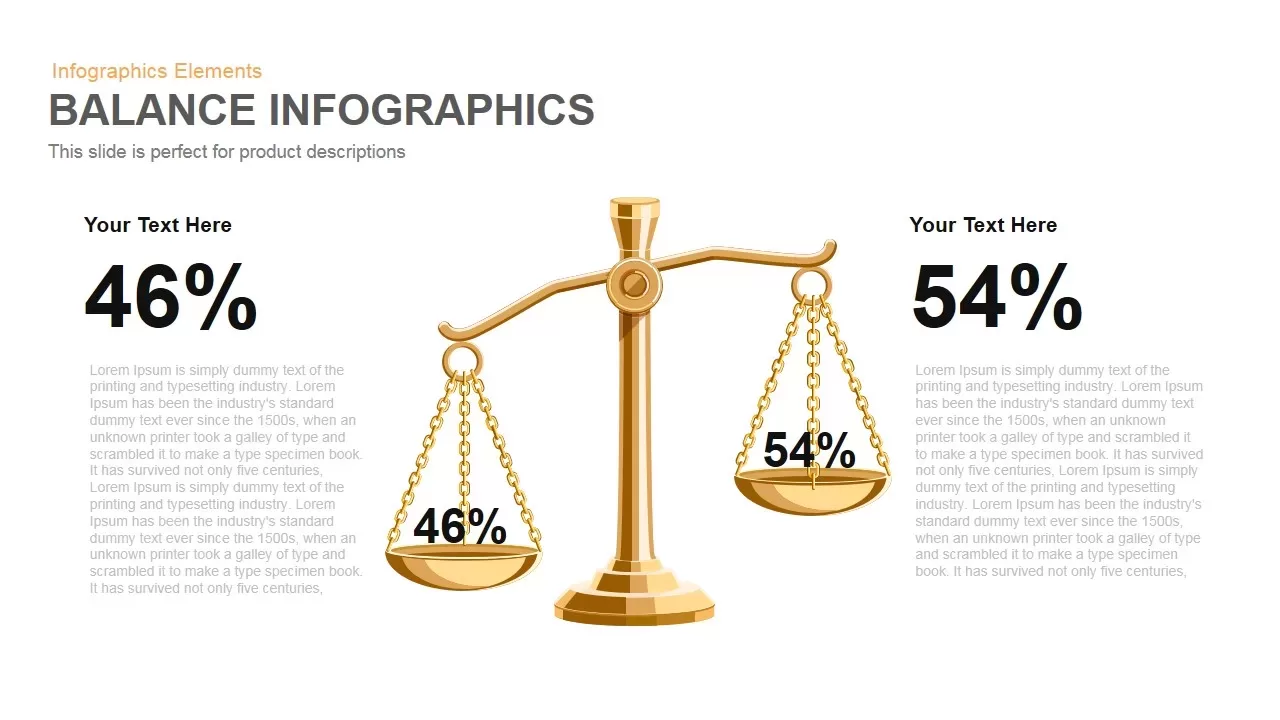
Gold Scales Balance Comparison Template for PowerPoint & Google Slides
Comparison
Four-Tier Pricing Comparison Table Template for PowerPoint & Google Slides
Comparison
Comparison Bar Chart template for PowerPoint & Google Slides
Comparison Chart
Speedometer Infographic Gauge Comparison Template for PowerPoint & Google Slides
Comparison
3-Column Comparison template for PowerPoint & Google Slides
Comparison

A/B Testing Comparison Infographic template for PowerPoint & Google Slides
Comparison
Clean Mobile Service Comparison Slide Template for PowerPoint & Google Slides
Comparison
Four-Plan Pricing Table Comparison Template for PowerPoint & Google Slides
Comparison
Interactive Product Comparison Bar Chart Template for PowerPoint & Google Slides
Bar/Column
Gender Comparison People Infographic Template for PowerPoint & Google Slides
Comparison

Comparison Pricing Table Infographic Template for PowerPoint & Google Slides
Comparison Chart
Interactive Pricing Plan Comparison Template for PowerPoint & Google Slides
Comparison
Tornado Chart Data Comparison Slide Template for PowerPoint & Google Slides
Bar/Column
Radar Chart Product Comparison Template for PowerPoint & Google Slides
Comparison Chart
Six-Metric Green Product Comparison Template for PowerPoint & Google Slides
Comparison
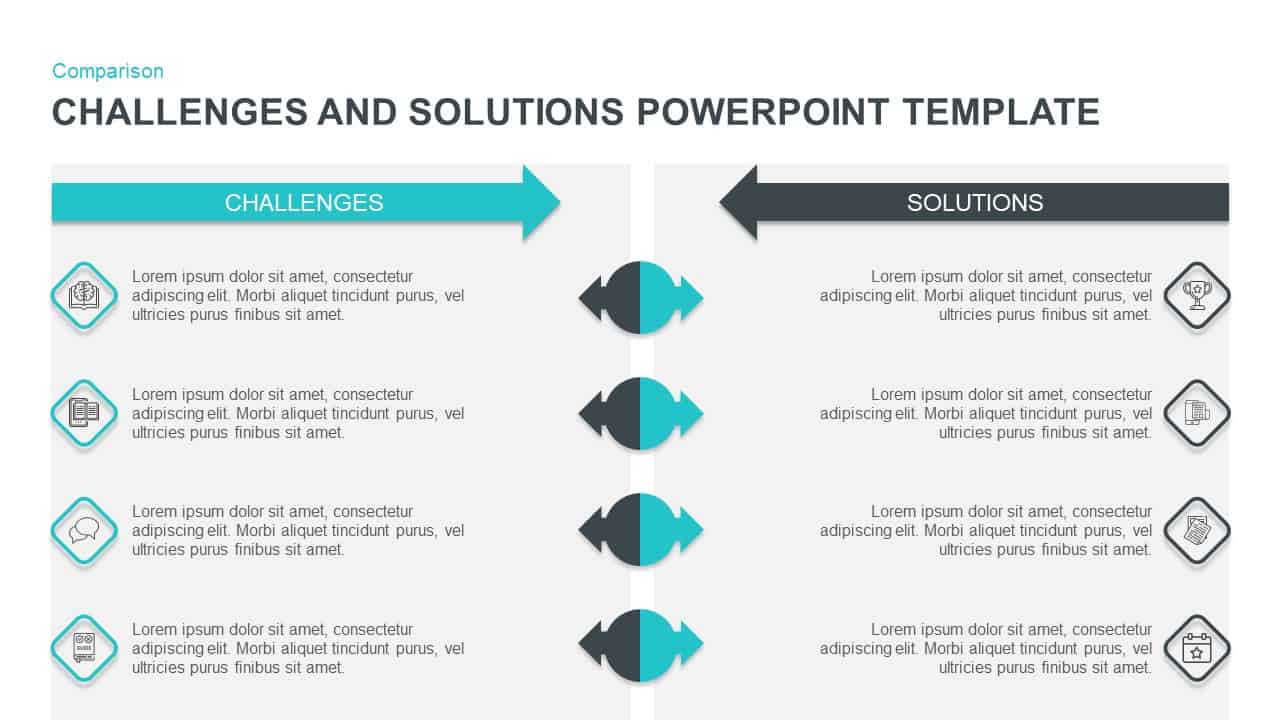
Challenges vs Solutions Comparison Template for PowerPoint & Google Slides
Comparison
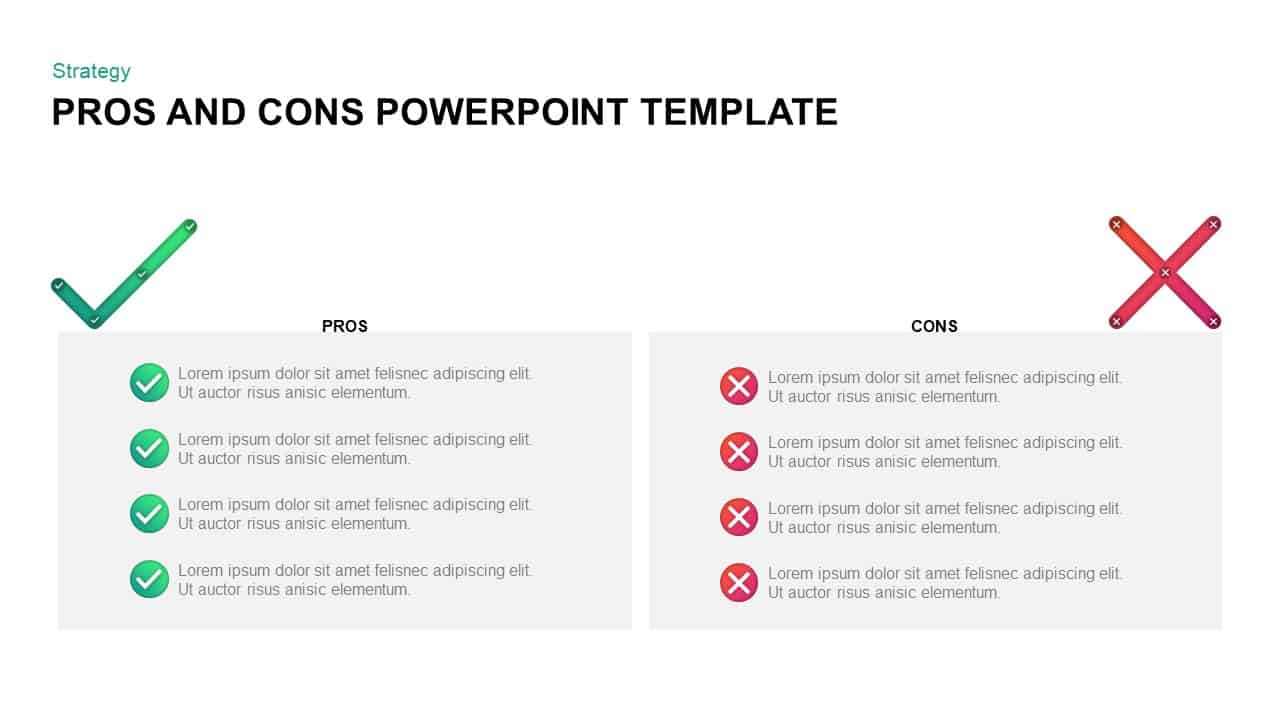
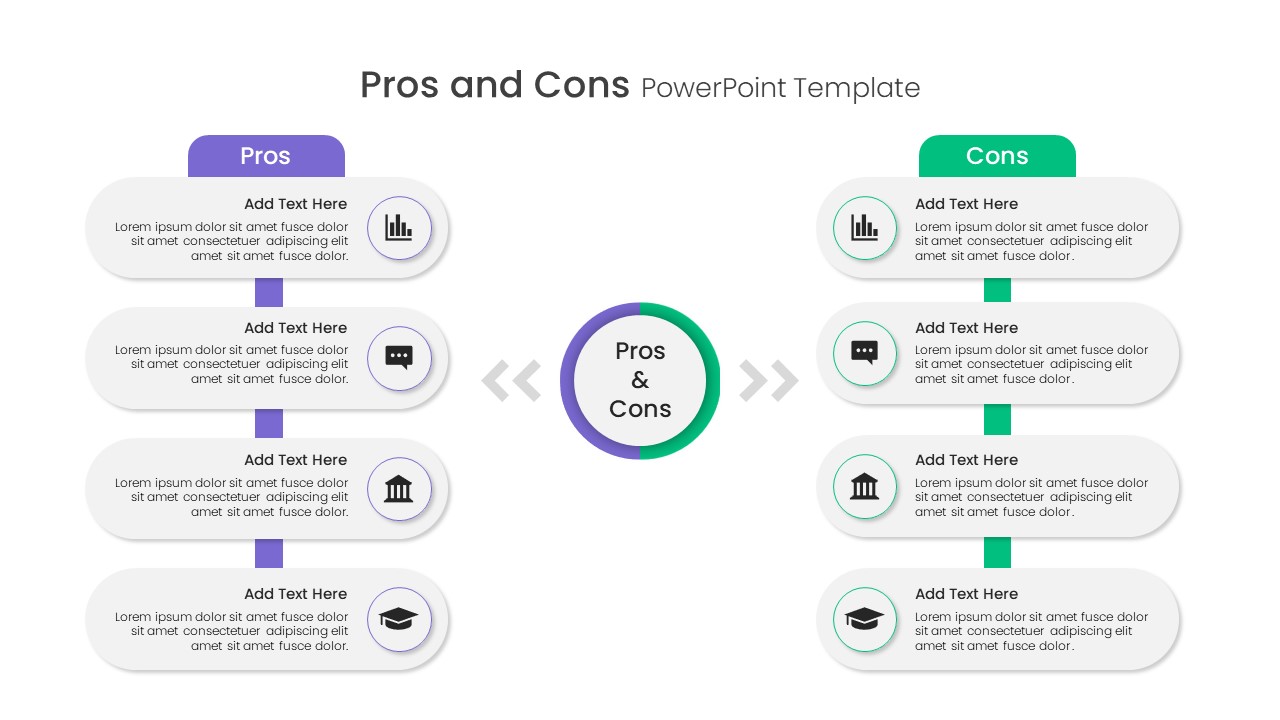
Pros and Cons Comparison Slide Template for PowerPoint & Google Slides
Comparison
Two-Column Comparison Infographic Slide Template for PowerPoint & Google Slides
Comparison
Seller Portals Comparison Infographic Template for PowerPoint & Google Slides
Process
Fact and Figures Comparison Slide Template for PowerPoint & Google Slides
Business Report

BMI Category Comparison Chart Template for PowerPoint & Google Slides
Comparison
Isometric 3D Block Comparison Diagram Template for PowerPoint & Google Slides
Comparison
Generations Comparison Infographic Template for PowerPoint & Google Slides
Timeline
Circular Product Comparison Chart Template for PowerPoint & Google Slides
Comparison Chart
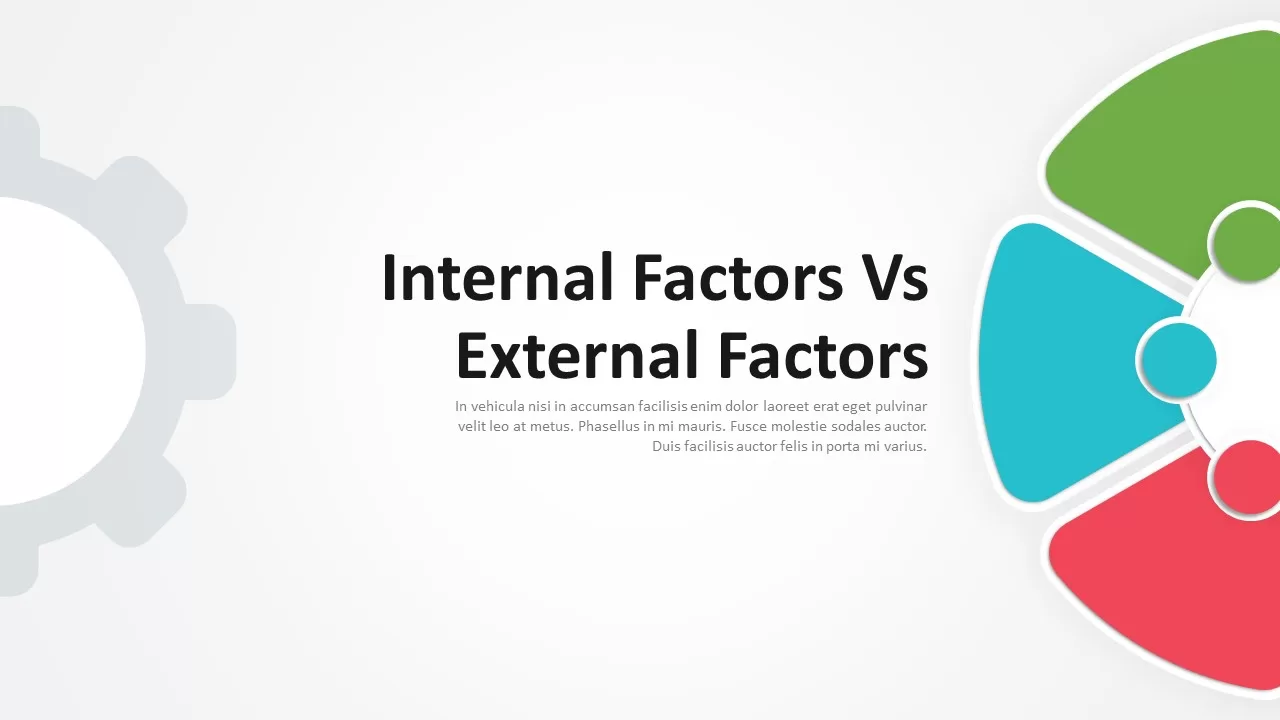
Internal vs External Factors Comparison Template for PowerPoint & Google Slides
Comparison
RAG Status Infographic Comparison Template for PowerPoint & Google Slides
Project
Theory X and Theory Y Comparison Template for PowerPoint & Google Slides
Comparison
Competitive Landscape Comparison Template Pack for PowerPoint & Google Slides
Comparison
Before and After Comparison Infographics Template for PowerPoint & Google Slides
Comparison
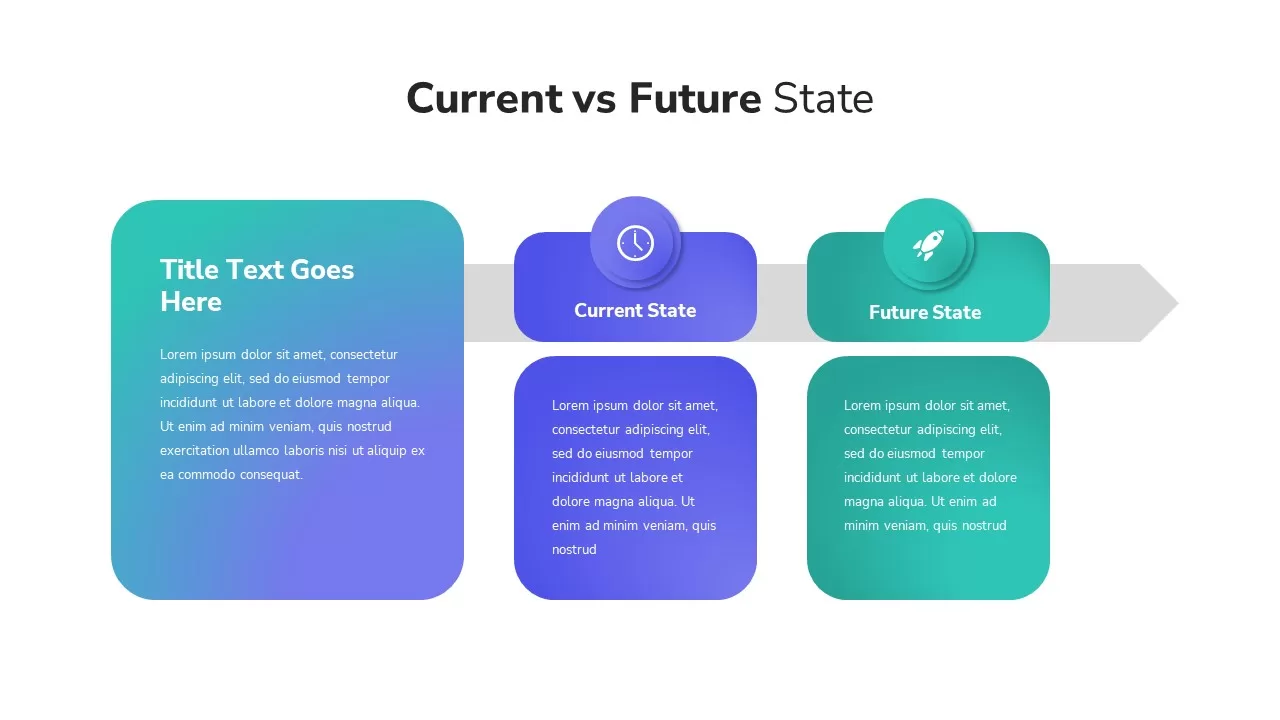
Current vs Future State Comparison Slide Template for PowerPoint & Google Slides
Comparison Chart
Current vs Future State Comparison Template for PowerPoint & Google Slides
Comparison Chart
Before and After Comparison Infographic Template for PowerPoint & Google Slides
Comparison
Free
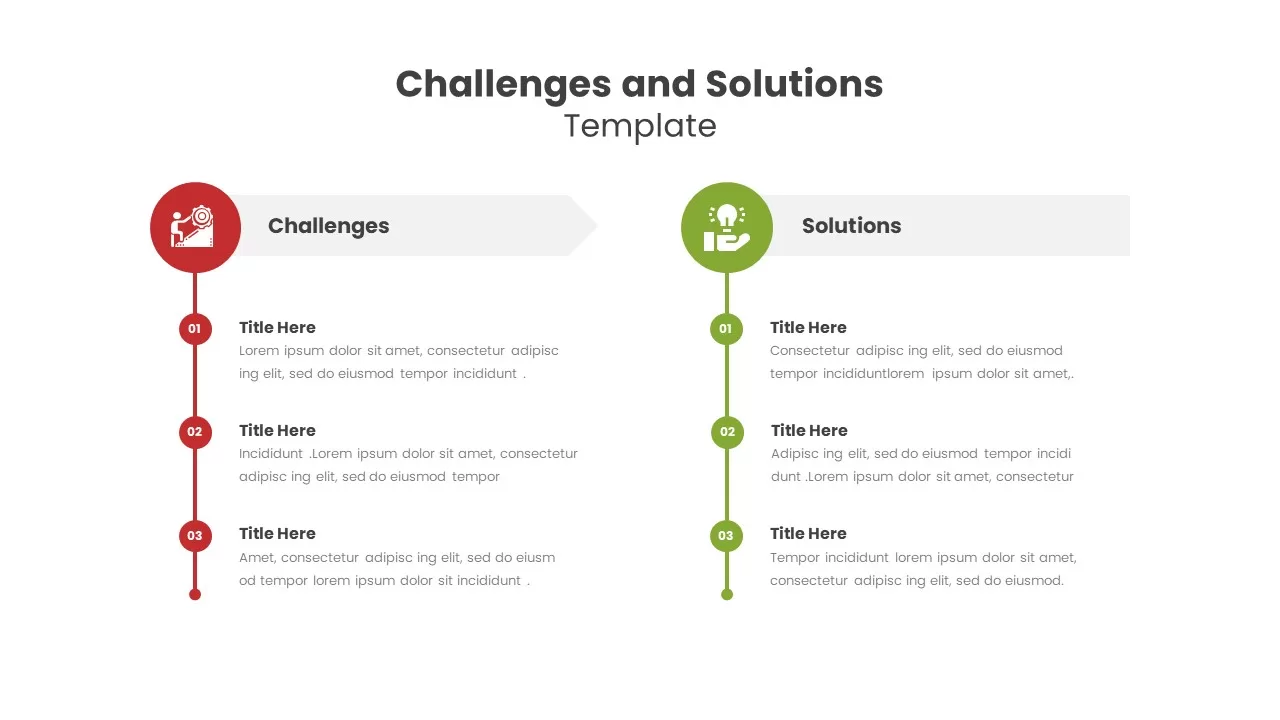
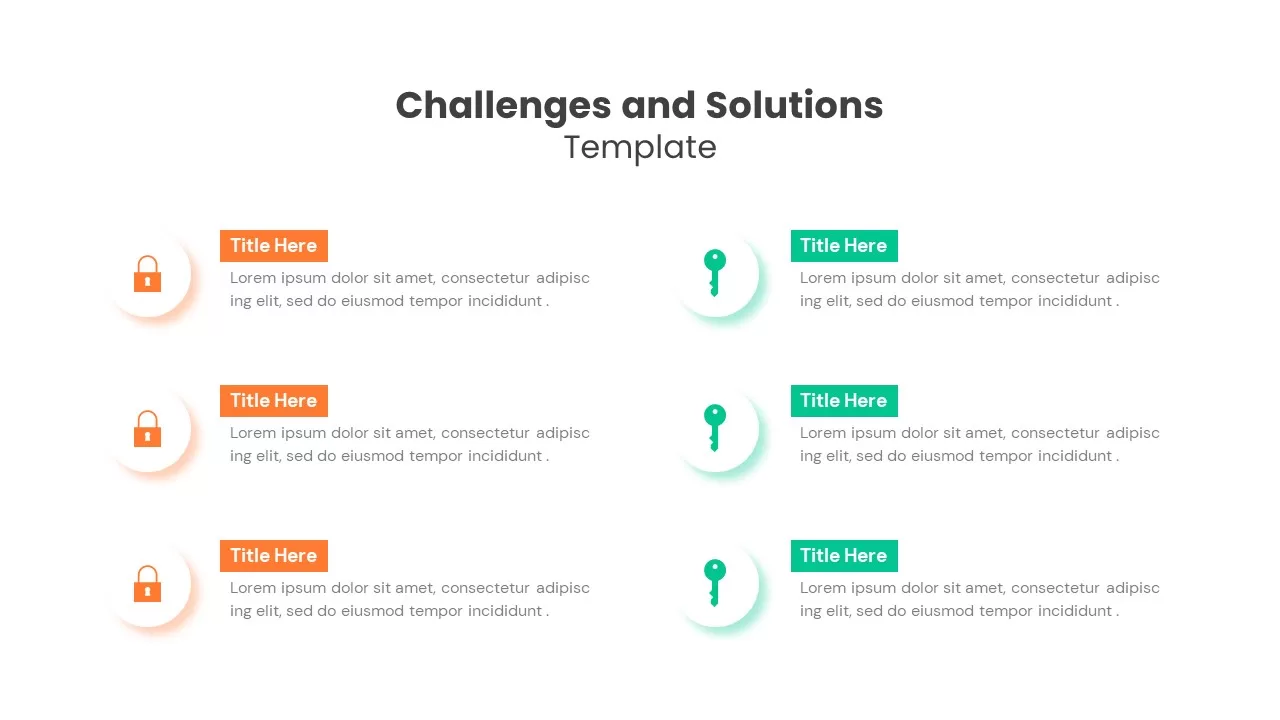
Challenges and Solutions Comparison Template for PowerPoint & Google Slides
Opportunities Challenges
Dynamic Benchmarking Comparison Chart Template for PowerPoint & Google Slides
Comparison Chart
Challenges & Solutions Comparison Template for PowerPoint & Google Slides
Opportunities Challenges
Cost Benefit Analysis Comparison Template for PowerPoint & Google Slides
Comparison
Adam’s Equity Theory Scale Comparison Template for PowerPoint & Google Slides
Comparison
Risk Heatmap Comparison Template for PowerPoint & Google Slides
Maps
Heatmap Comparison Template for PowerPoint & Google Slides
Maps
Vendor Comparison Analysis template for PowerPoint & Google Slides
Comparison Chart
Vendor Comparison Matrix with High-Level Requirements template for PowerPoint & Google Slides
Comparison Chart
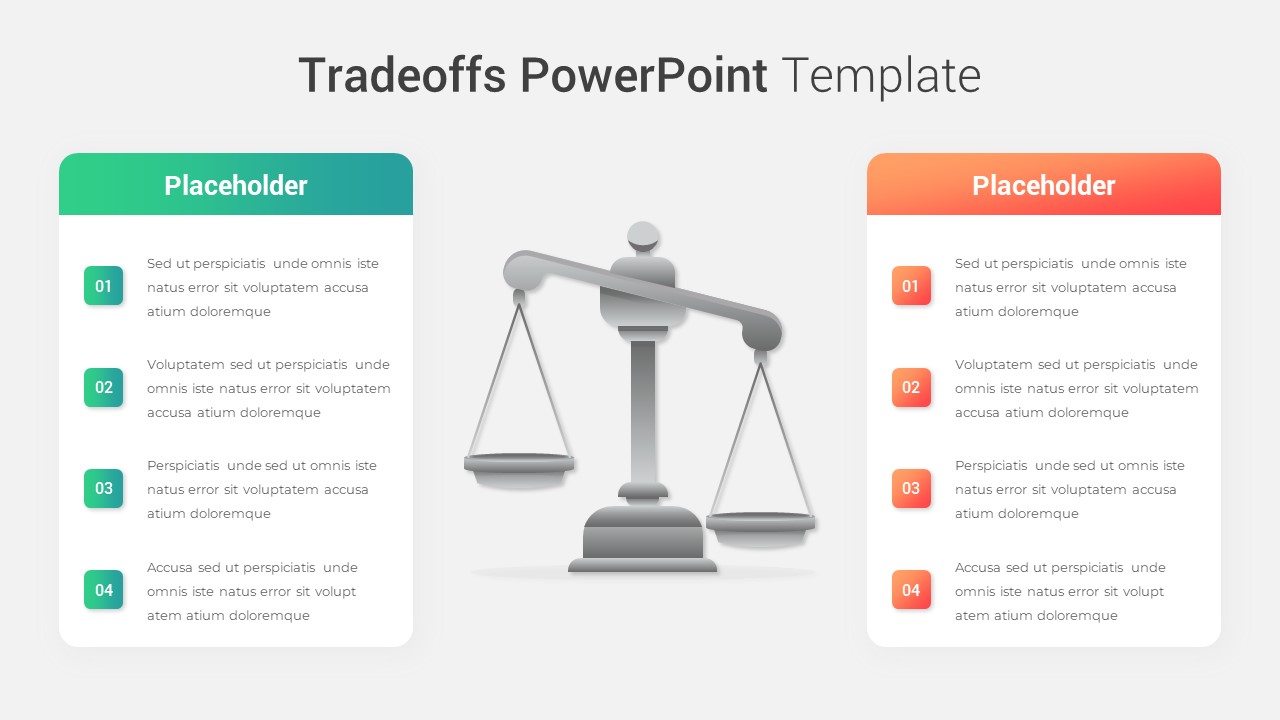
Modern Tradeoffs Comparison Slide Template for PowerPoint & Google Slides
Comparison
Popular Social Media Comparison Grid Template for PowerPoint & Google Slides
Digital Marketing
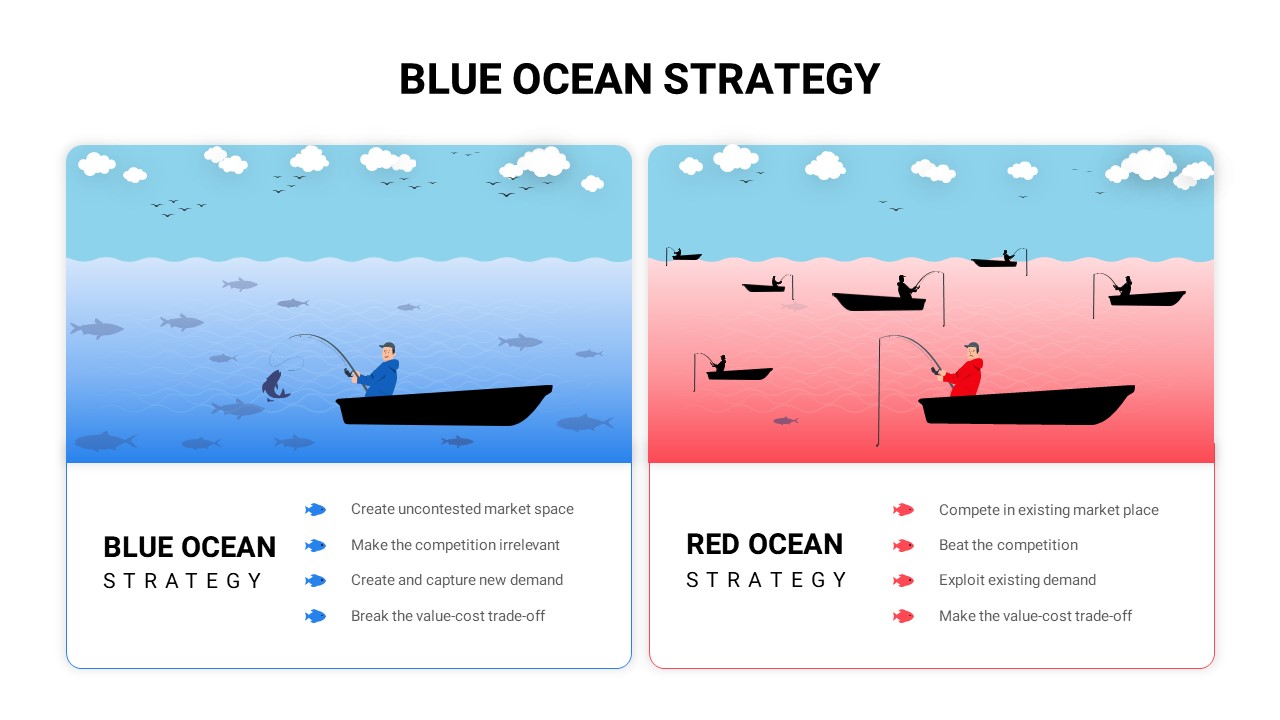
Blue vs Red Ocean Strategy Comparison Template for PowerPoint & Google Slides
Business Strategy
Hits and Misses Performance Comparison Template for PowerPoint & Google Slides
Comparison
People Demographic Comparison Chart Template for PowerPoint & Google Slides
Comparison
Conflict Infographics Comparison Template for PowerPoint & Google Slides
Infographics
Clustered Bar Chart Comparison Template for PowerPoint & Google Slides
Bar/Column
Business Timeline Comparison Bar Chart Template for PowerPoint & Google Slides
Comparison Chart
Grouped Column Chart Comparison Template for PowerPoint & Google Slides
Bar/Column
Multiple Line Chart Comparison Template for PowerPoint & Google Slides
Comparison Chart
Interactive Multi-Use Cost Comparison Template for PowerPoint & Google Slides
Comparison
Free Pros and Cons Comparison Template for PowerPoint & Google Slides
Comparison
Free
Free Versatile Product Comparison Chart Template for PowerPoint & Google Slides
Charts
Free
Free Global Warming Infographic Comparison Template for PowerPoint & Google Slides
Comparison Chart
Free
Dynamic Bar-of-Pie Chart Comparison Template for PowerPoint & Google Slides
Pie/Donut
Types of AI Comparison Infographic Template for PowerPoint & Google Slides
AI
AI vs. Human Intelligence Comparison Template for PowerPoint & Google Slides
Comparison
ESG Initiatives Comparison Chart Template for PowerPoint & Google Slides
Business
Quarterly Revenue Comparison Bar Chart Template for PowerPoint & Google Slides
Bar/Column
Regional Revenue Comparison Overview Template for PowerPoint & Google Slides
Comparison
Pricing Model Types Comparison Infographic Template for PowerPoint & Google Slides
Pitch Deck
Project Comparison Timeline Roadmap Template for PowerPoint & Google Slides
Comparison
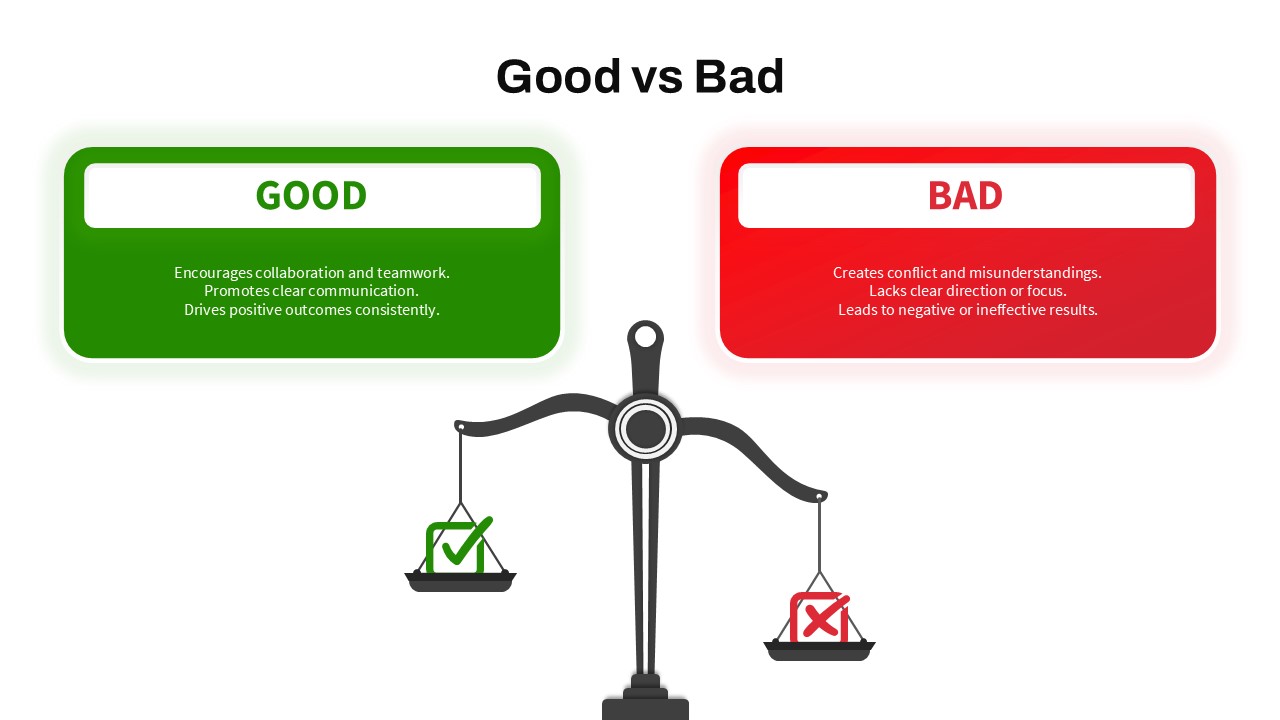
Good vs Bad Comparison with Scale Template for PowerPoint & Google Slides
Comparison
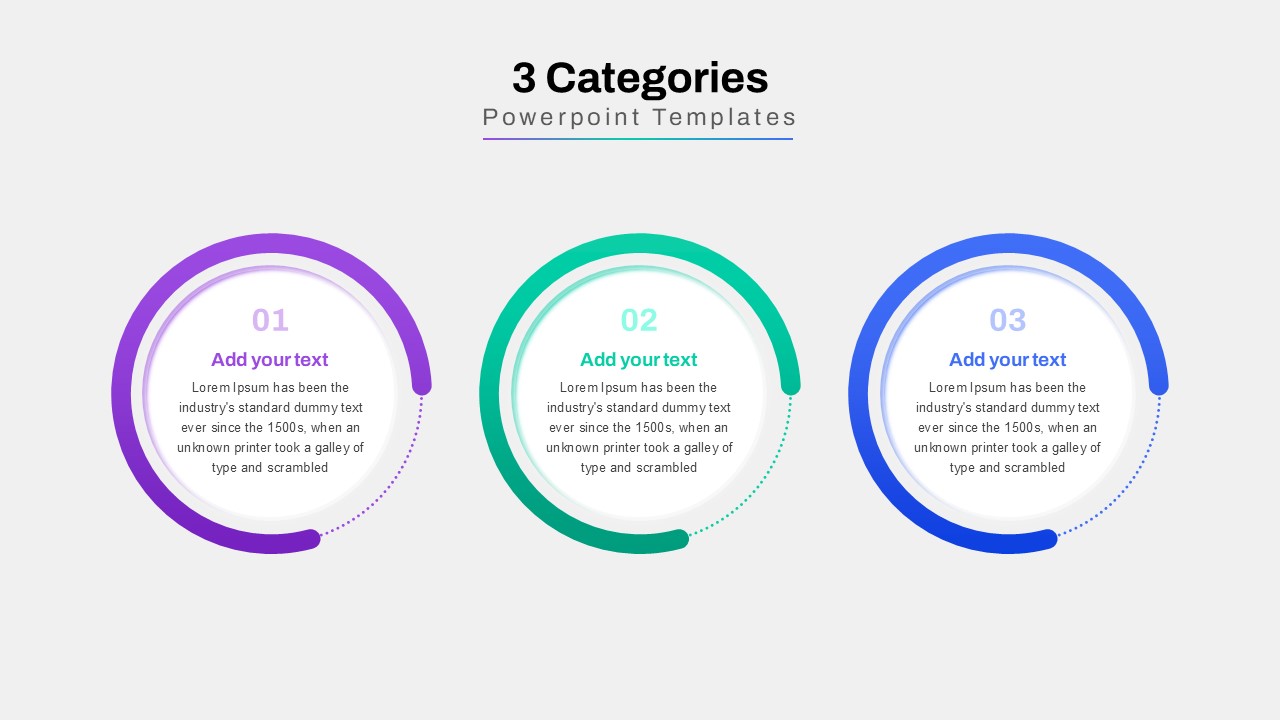
Three-Category Comparison Template for PowerPoint & Google Slides
Comparison
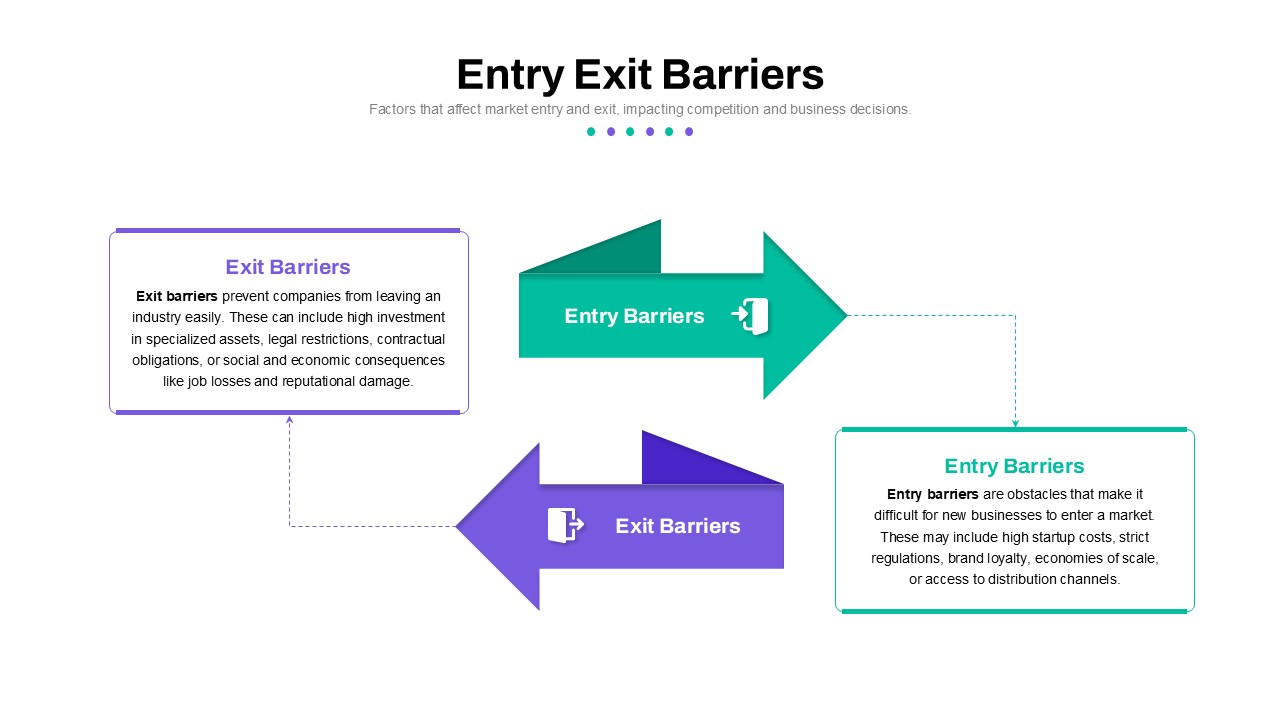
Entry and Exit Barriers Comparison Template for PowerPoint & Google Slides
Comparison
Competitor Comparison Chart Design Template for PowerPoint & Google Slides
Comparison
Two-Option Bar Chart Comparison Table Template for PowerPoint & Google Slides
Comparison
Profile Comparison Chart template for PowerPoint & Google Slides
Comparison Chart
Cross Sell & Up Sell Strategy Comparison template for PowerPoint & Google Slides
Comparison
Integrative Thinking Comparison Diagram Template for PowerPoint & Google Slides
Comparison
Product Feature Comparison Table Template for PowerPoint & Google Slides
Comparison Chart
Market Share Comparison Diagram Template for PowerPoint & Google Slides
Comparison Chart
Competitor Profile Matrix Comparison Template for PowerPoint & Google Slides
Comparison Chart
Two-Sided Coin Comparison Diagram Template for PowerPoint & Google Slides
Comparison
Sales Growth Comparison Chart & Table Template for PowerPoint & Google Slides
Bar/Column
Two-Box Analysis & Target Comparison Template for PowerPoint & Google Slides
Comparison
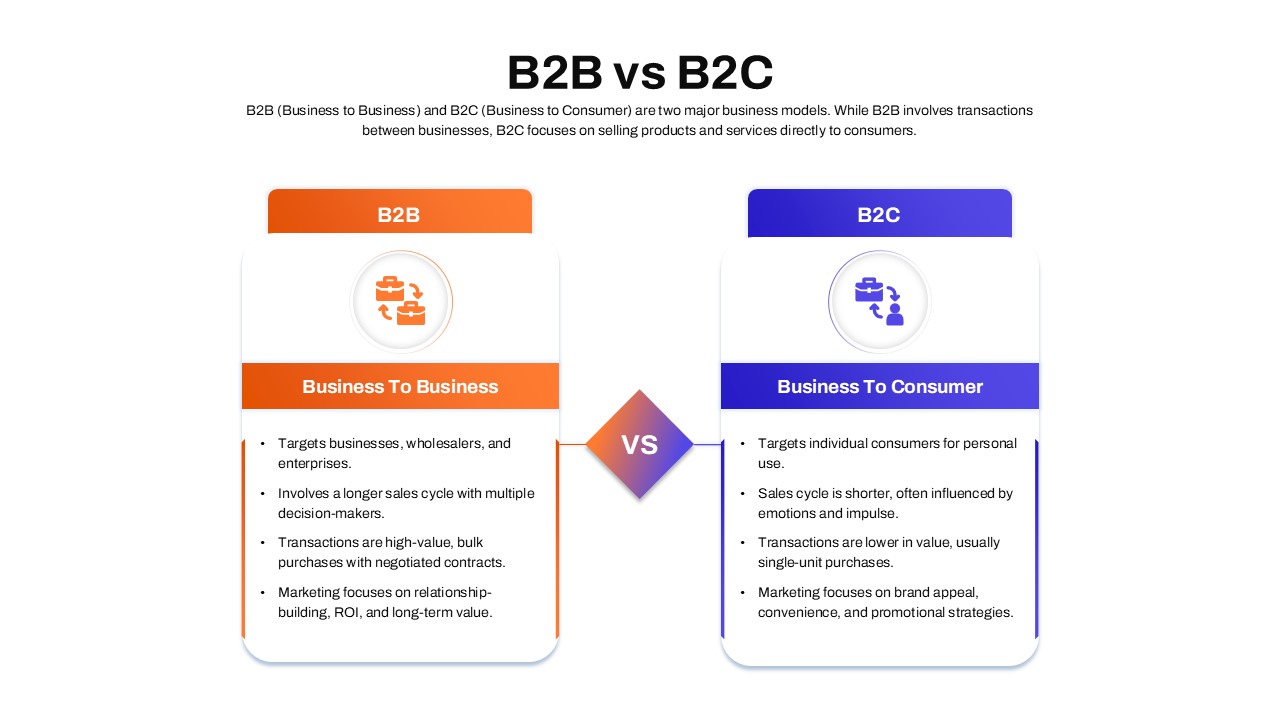
B2B vs B2C Comparison template for PowerPoint & Google Slides
Business Models
VUCA vs BANI Comparison Infographic Template for PowerPoint & Google Slides
Comparison
Skills Gap Analysis Comparison Chart Template for PowerPoint & Google Slides
Gap
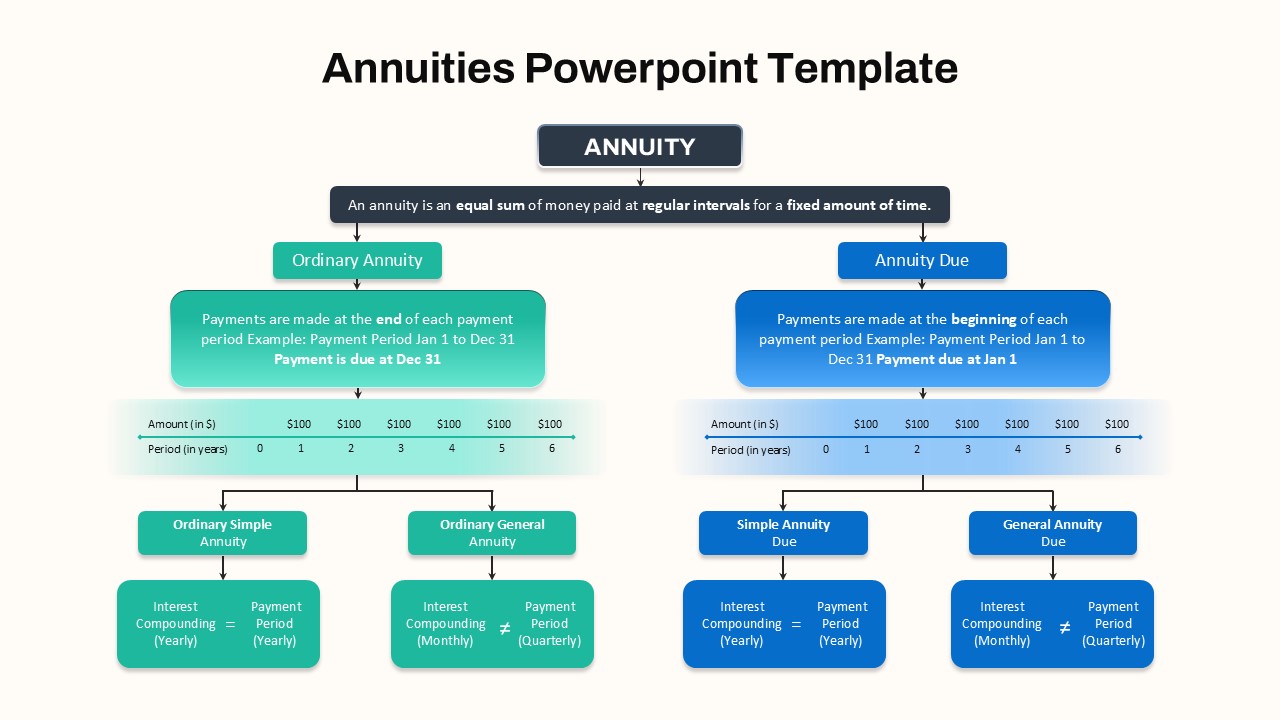
Hierarchical Annuity Comparison Flowchart Template for PowerPoint & Google Slides
Business Report
Feasibility Matrix Comparison Chart Template for PowerPoint & Google Slides
Comparison Chart
Attribution Models Comparison Diagram Template for PowerPoint & Google Slides
Comparison
Funnel and Flywheel Thinking Comparison template for PowerPoint & Google Slides
Infographics
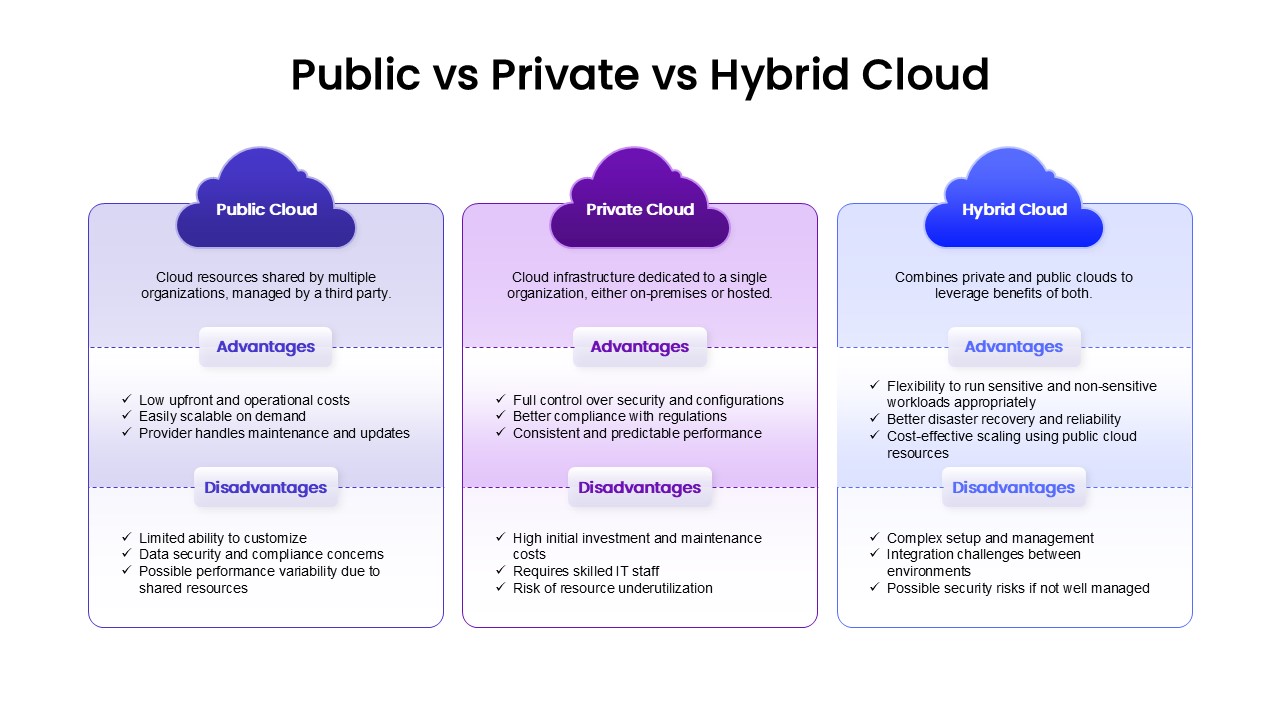
Public, Private & Hybrid Cloud Comparison Template for PowerPoint & Google Slides
Cloud Computing
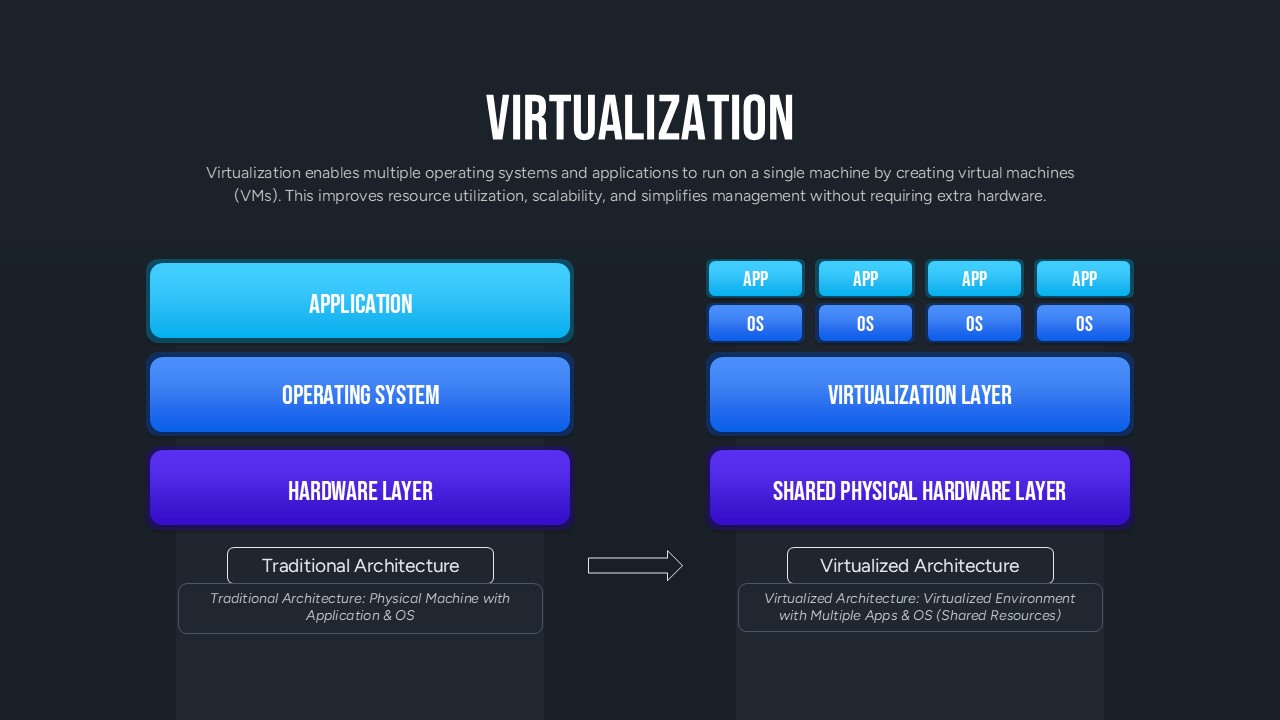
Virtualization Architecture Comparison Template for PowerPoint & Google Slides
Comparison Chart
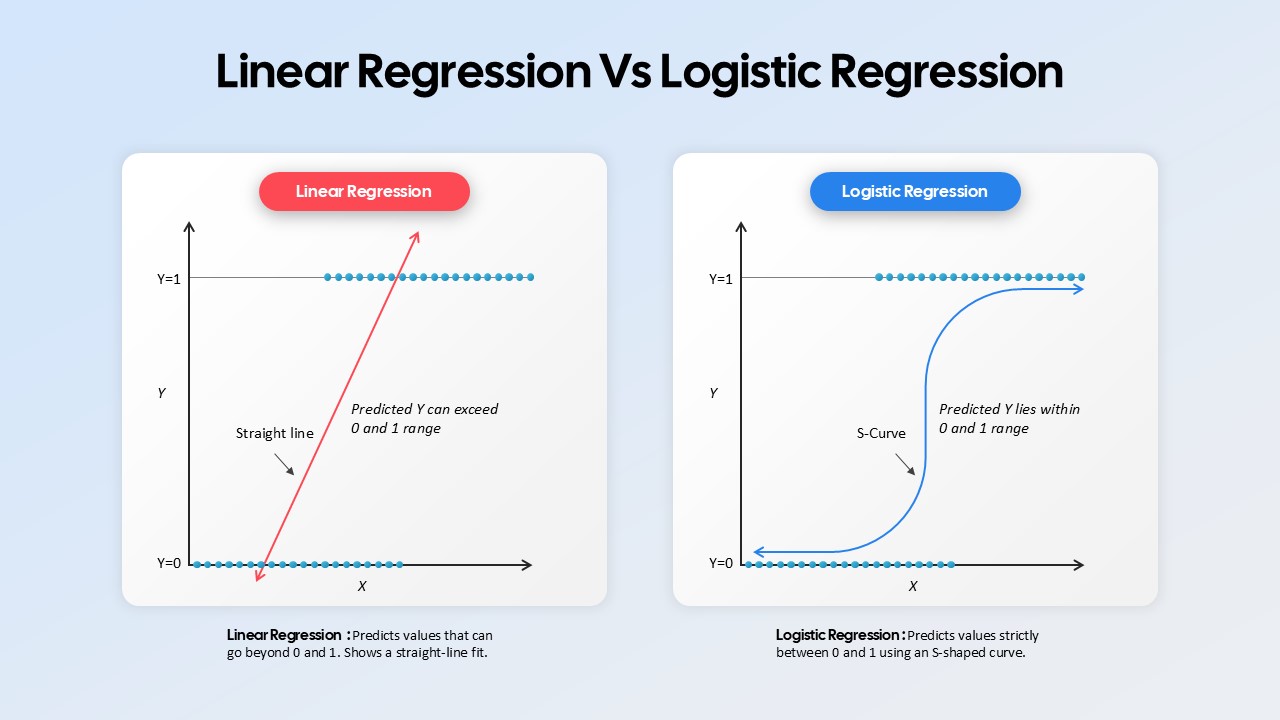
Linear Regression vs Logistic Regression Comparison template for PowerPoint & Google Slides
Comparison
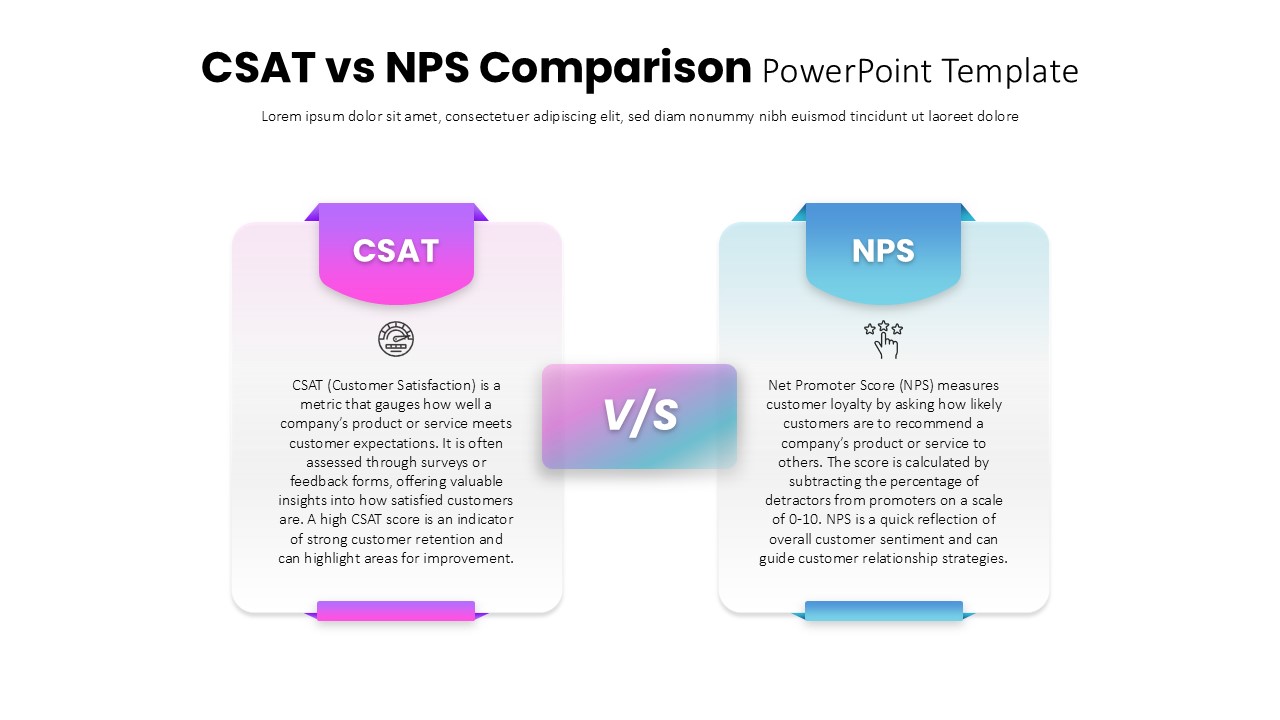
CSAT vs NPS Comparison template for PowerPoint & Google Slides
Business Strategy
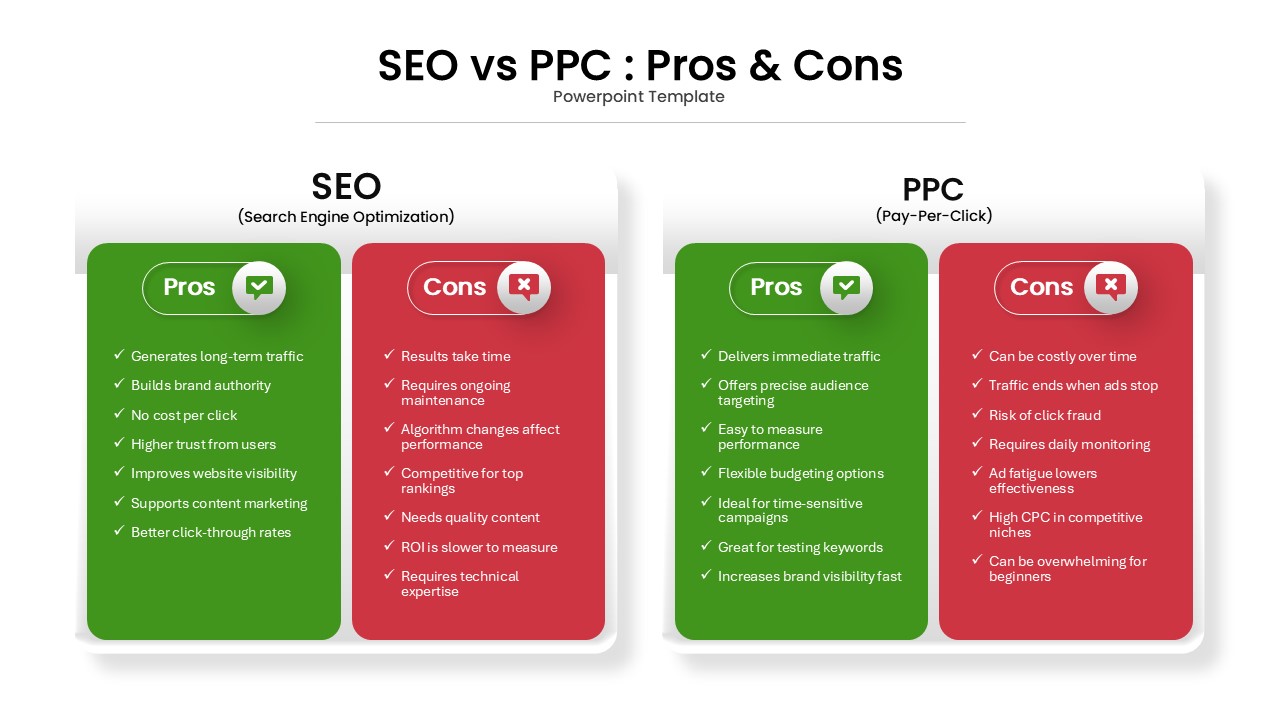
SEO vs PPC: Pros & Cons Comparison Template for PowerPoint & Google Slides
Comparison
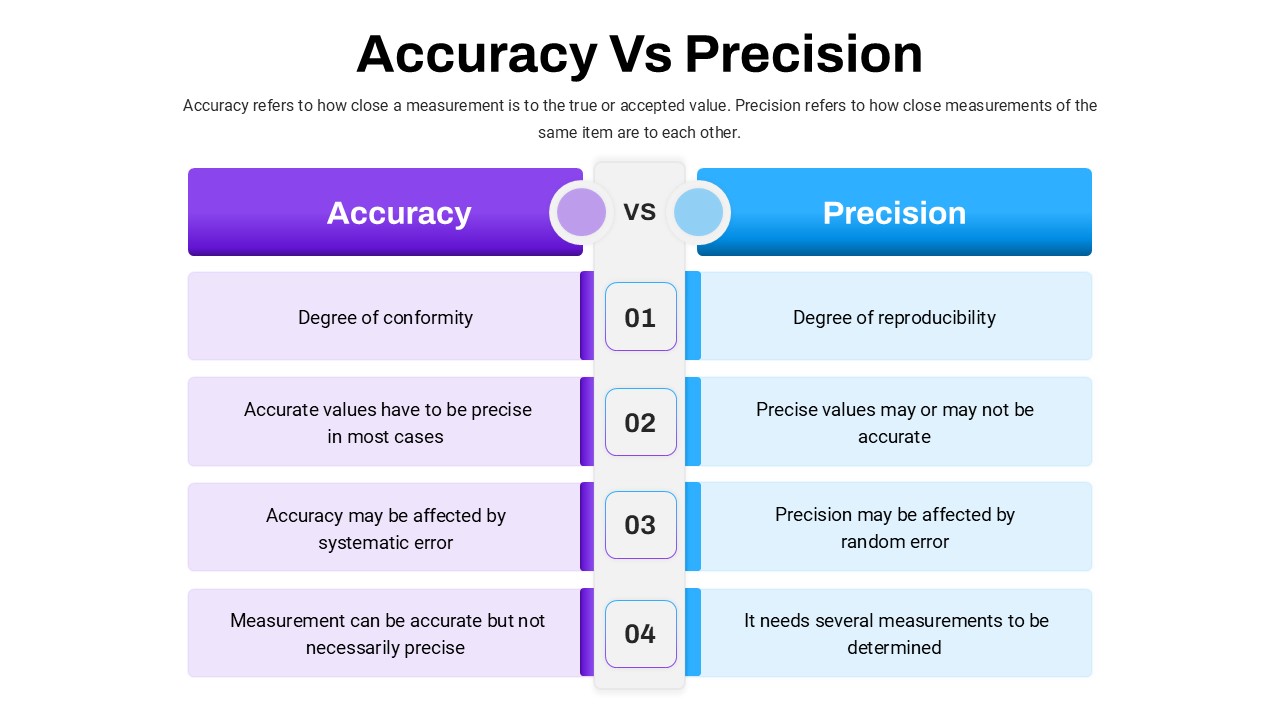
Accuracy Vs Precision Comparison Template for PowerPoint & Google Slides
Comparison Chart
Risk vs Reward Comparison Template for PowerPoint & Google Slides
Opportunities Challenges
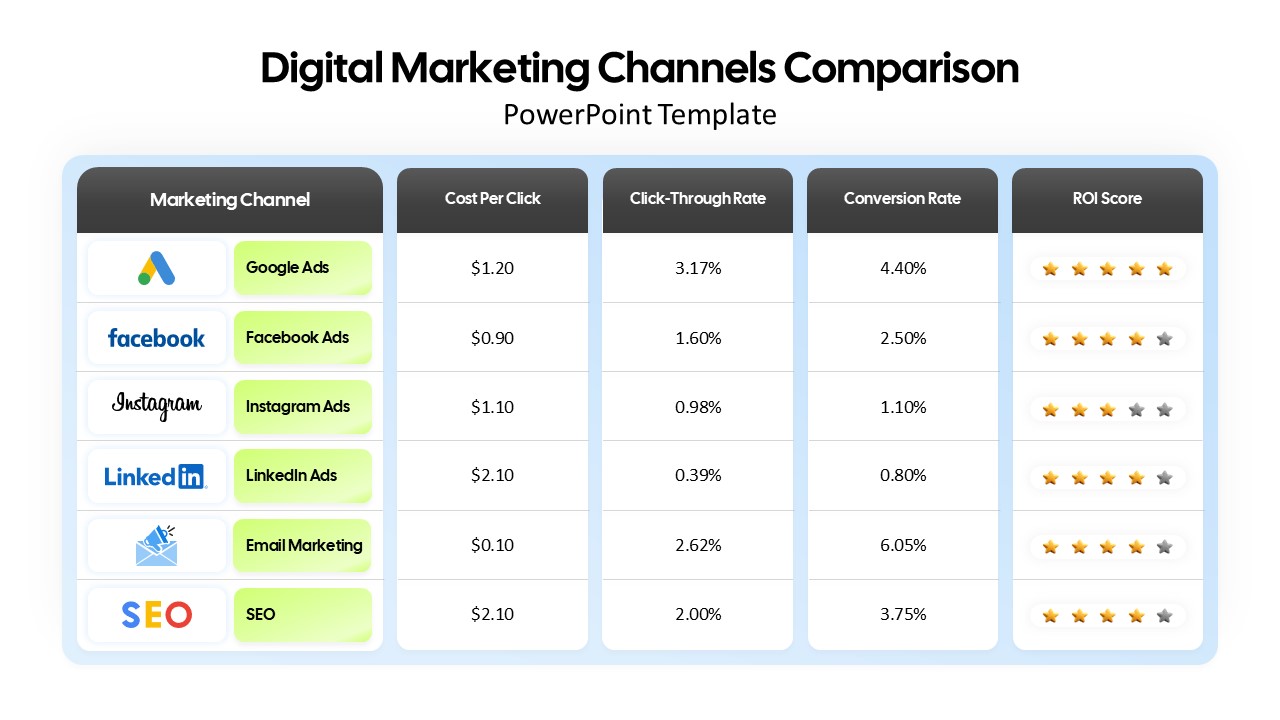
Digital Marketing Channels Comparison template for PowerPoint & Google Slides
Business
Comparison Table Presentation Template for PowerPoint & Google Slides
Table
Colorful Comparison Table Presentation Template for PowerPoint & Google Slides
Table
Colorful Business Data Comparison Table Template for PowerPoint & Google Slides
Table
Operating Channels Comparison Diagram Template for PowerPoint & Google Slides
Business Models
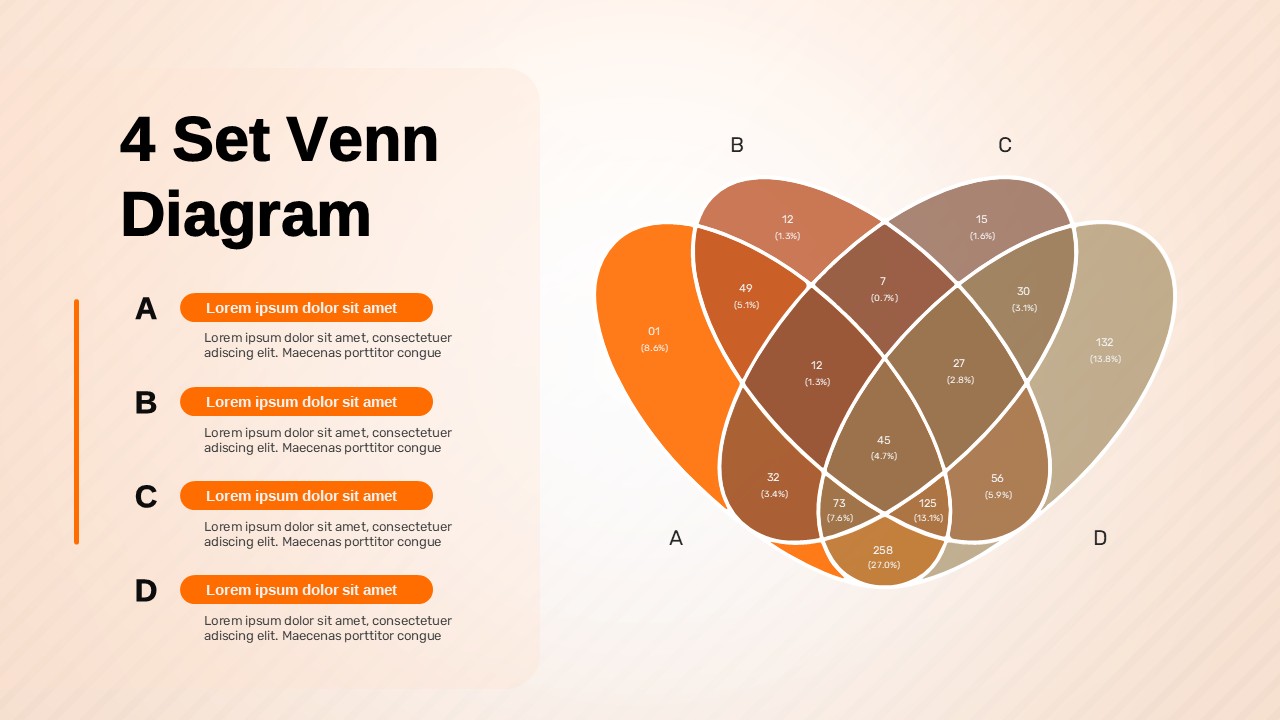
4 Set Venn Diagram Comparison Template for PowerPoint & Google Slides
Comparison
Year-over-Year Performance Comparison Template for PowerPoint & Google Slides
Comparison Chart