Gender Comparison People Infographic Template for PowerPoint & Google Slides

Description
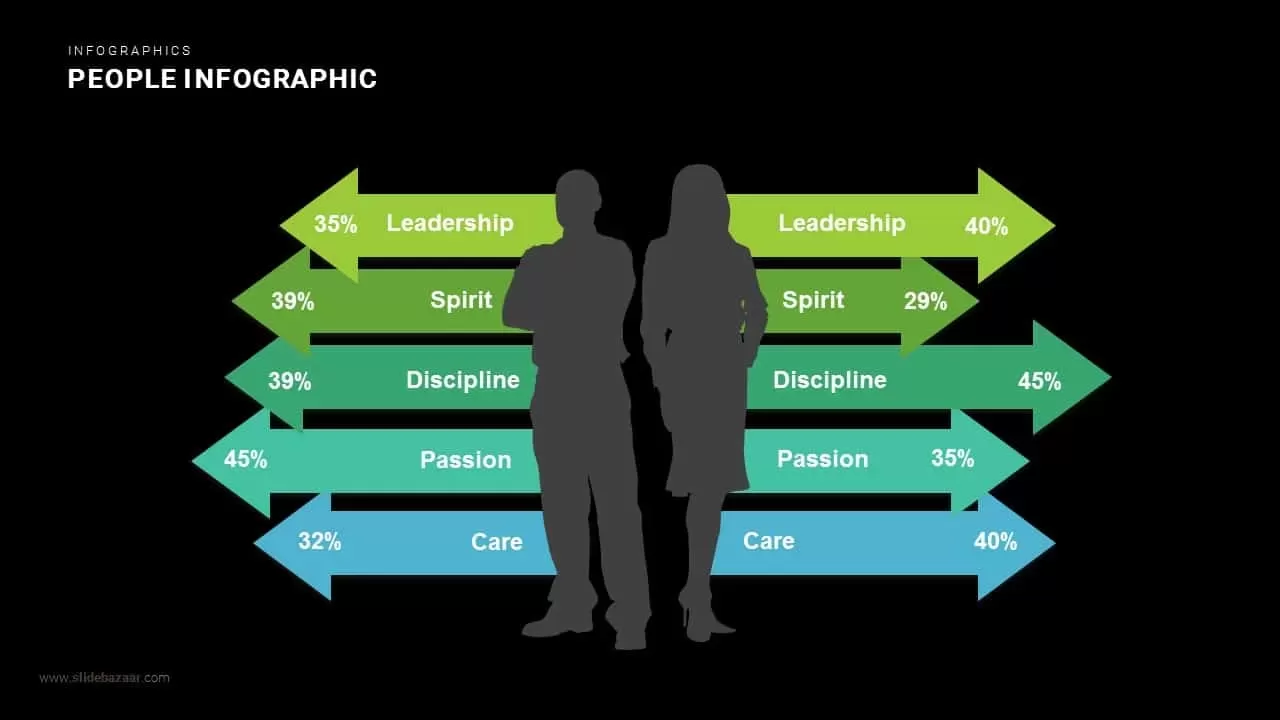
Download this people infographic slide to compare gender metrics across five attributes—Leadership, Spirit, Discipline, Passion, and Care—using colored directional arrows flanking male and female silhouettes. Each arrow displays a percentage value and label, clearly illustrating side-by-side differences. The left-aligned arrows point right for one group, mirrored by right-aligned arrows for the other, creating a balanced, professional layout on a clean white background.
Who is it for
HR professionals, diversity and inclusion teams, talent managers, consultants, and business analysts who need to showcase comparative people metrics or demographic insights in corporate presentations, training sessions, and strategy workshops.
Other Uses
Repurpose this slide to display side-by-side product comparisons, customer segment analyses, performance benchmarks, or before-and-after metrics in boardroom decks, sales pitches, and educational seminars.
Login to download this file

Item ID
SB00628
Related Templates

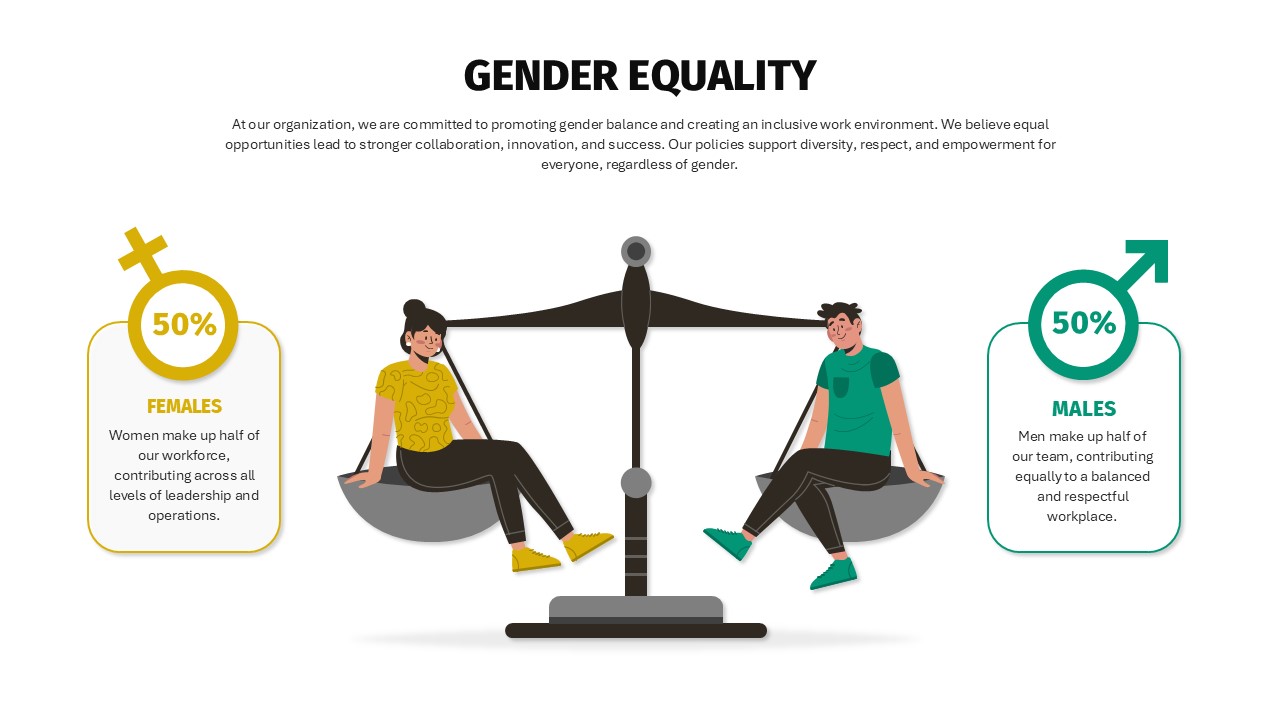
Balanced Gender Equality Scale Infographic Template for PowerPoint & Google Slides
Comparison
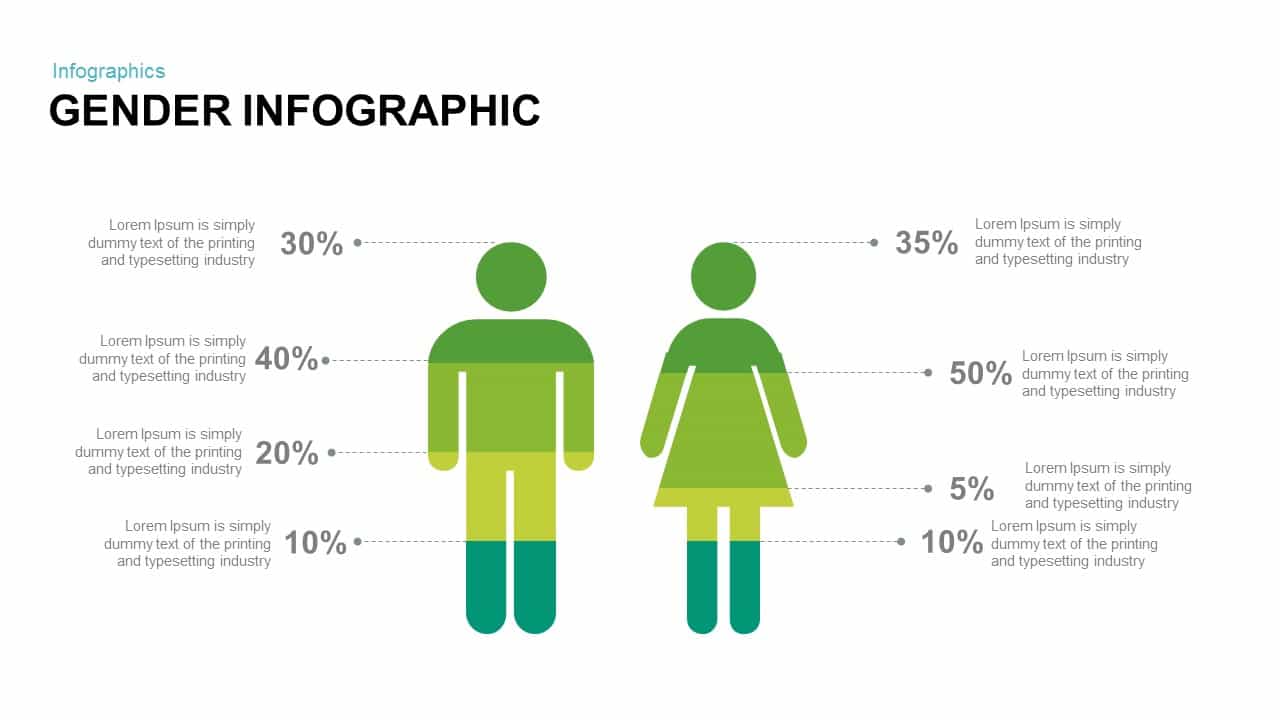
Gender Infographic for PowerPoint & Google Slides
Infographics
Year-over-Year Stacked Gender Bar Chart Template for PowerPoint & Google Slides
Bar/Column
People Demographic Comparison Chart Template for PowerPoint & Google Slides
Comparison
Five-Stage People Infographic Chart template for PowerPoint & Google Slides
Process
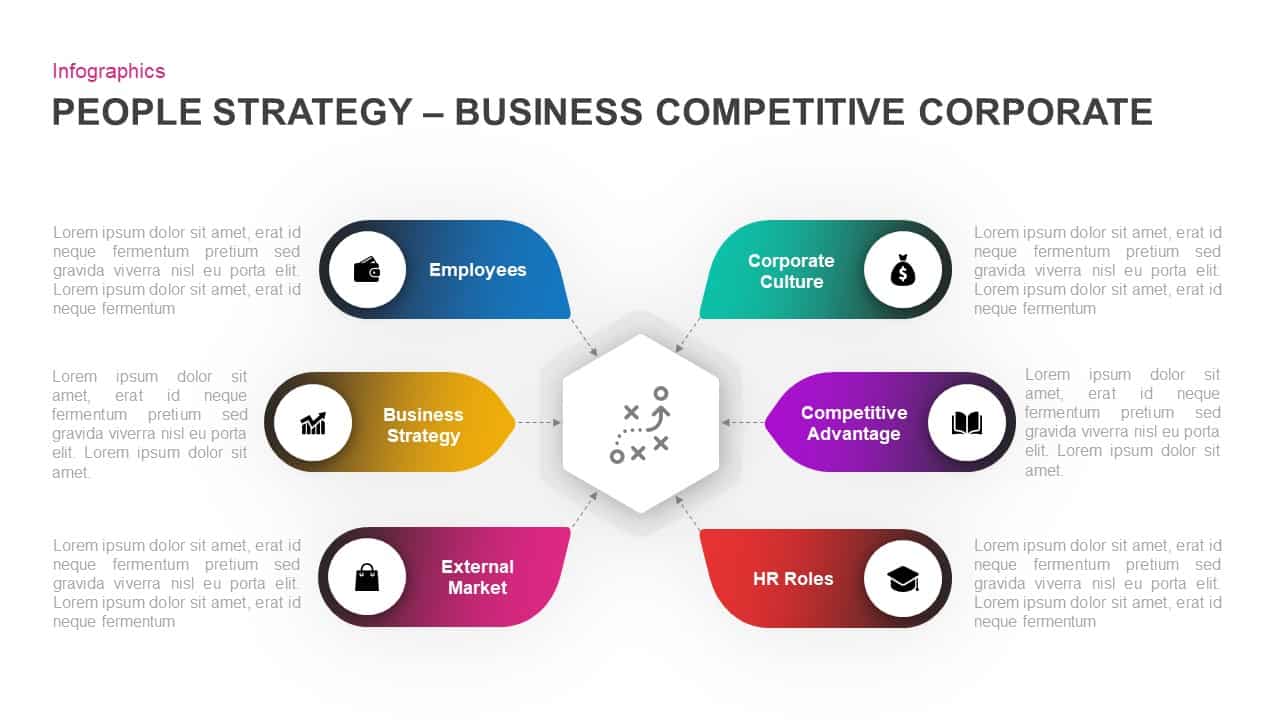
Corporate People Strategy Infographic Template for PowerPoint & Google Slides
Process
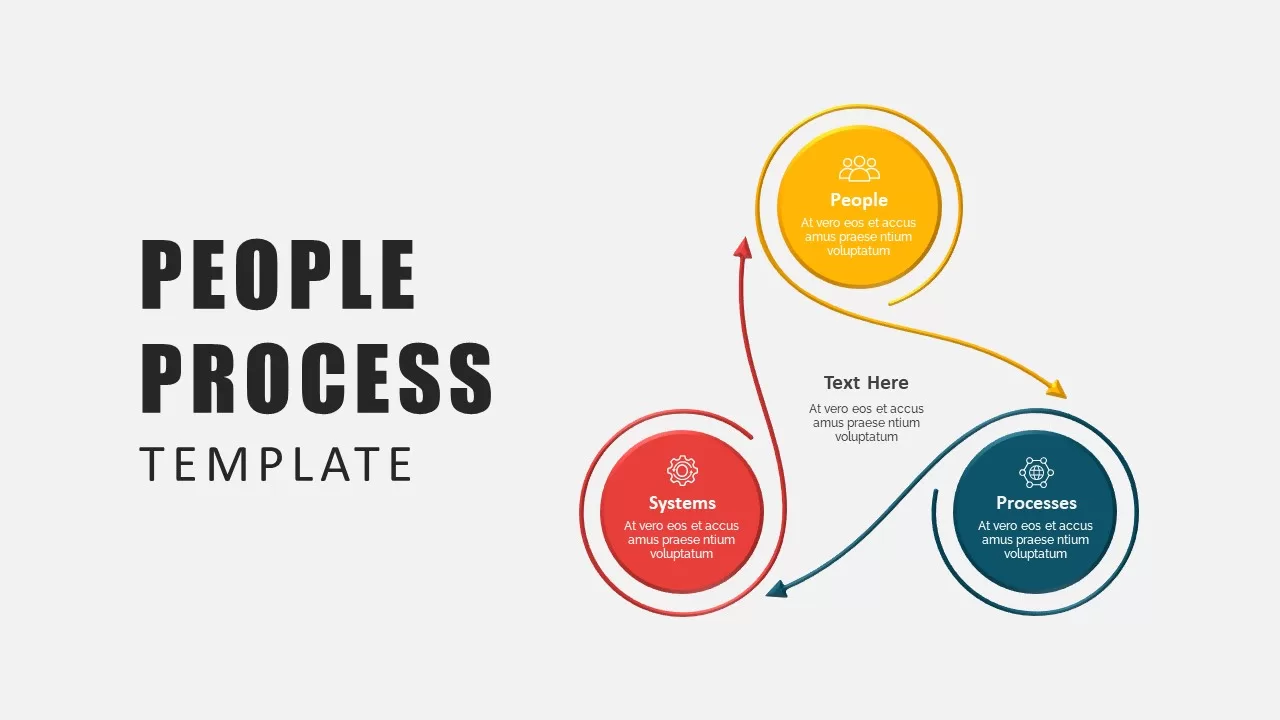
People-Process-Technology Infographic Template for PowerPoint & Google Slides
Process
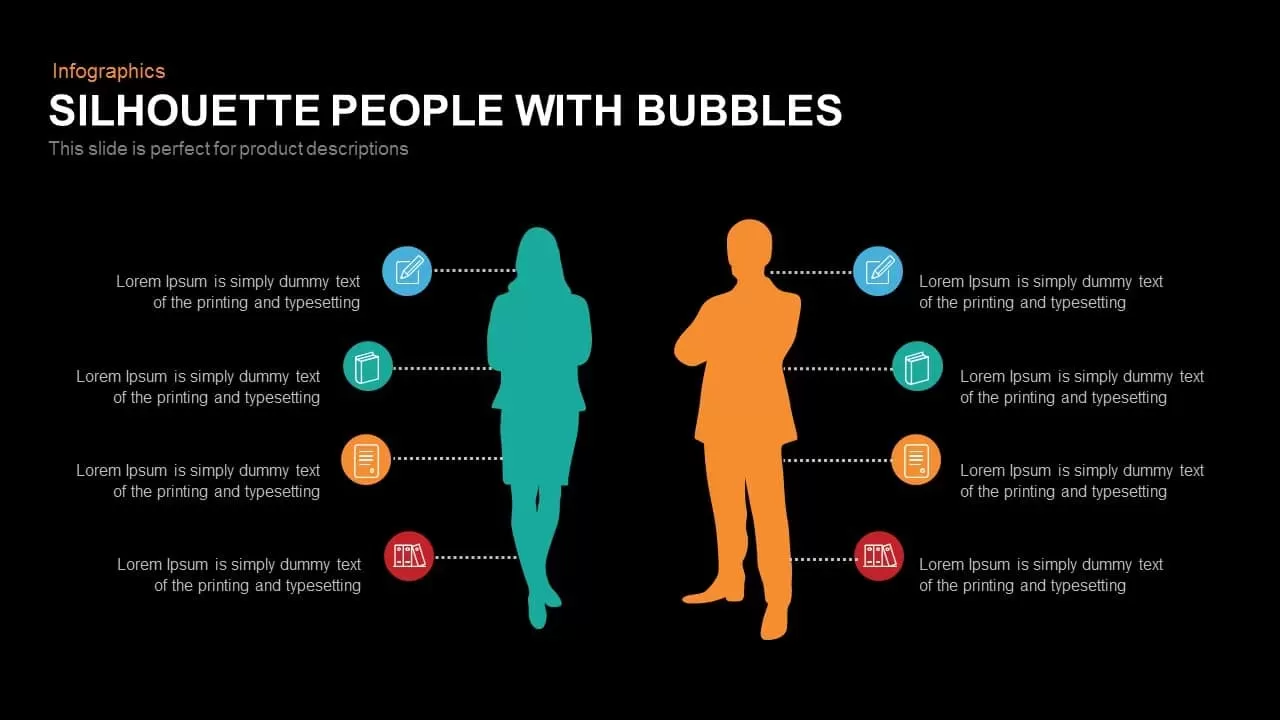
People with Bubbles template for PowerPoint & Google Slides
Comparison
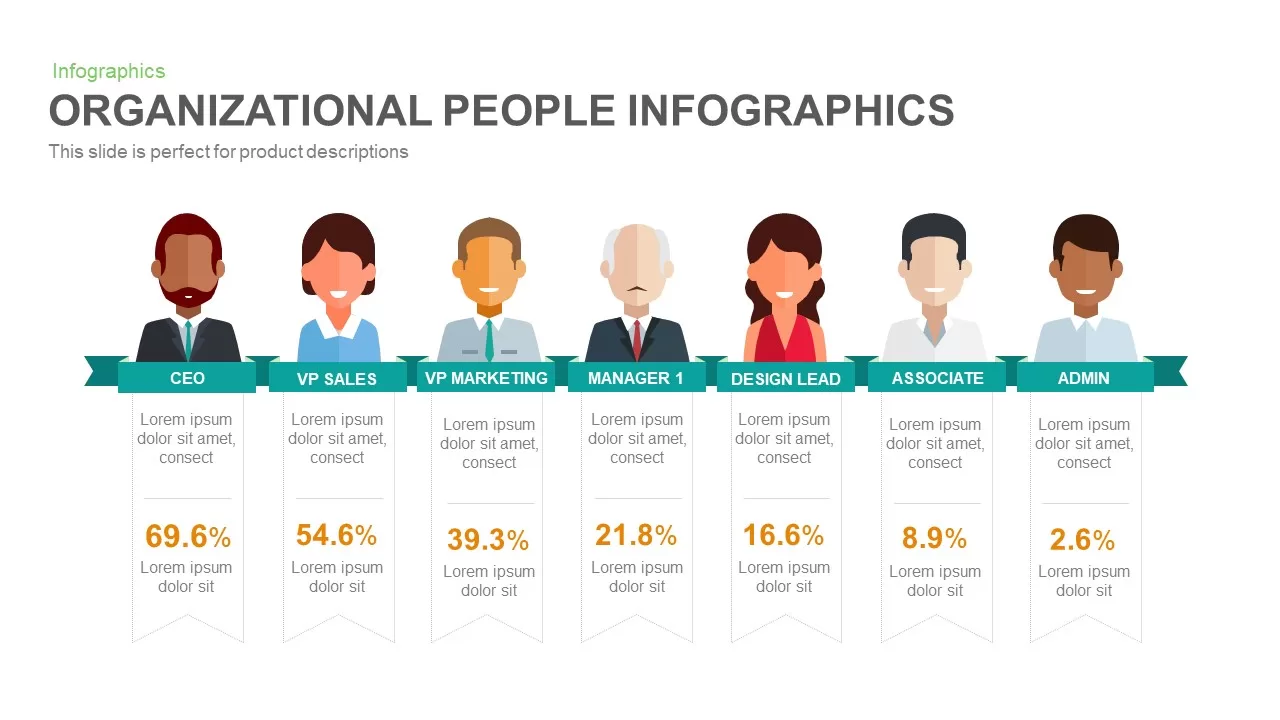
Organizational People Percentage Chart template for PowerPoint & Google Slides
Org Chart

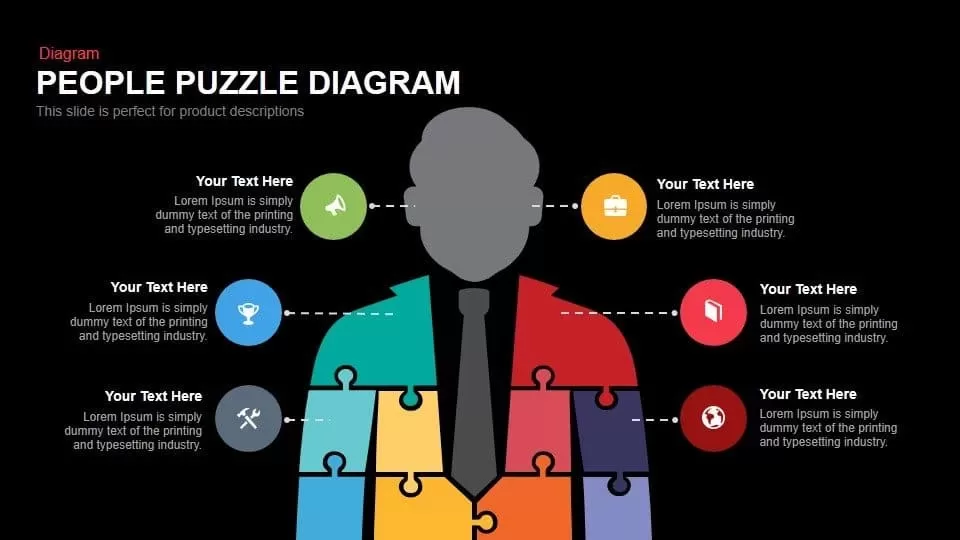
People Puzzle Diagram for Team Roles Template for PowerPoint & Google Slides
Org Chart
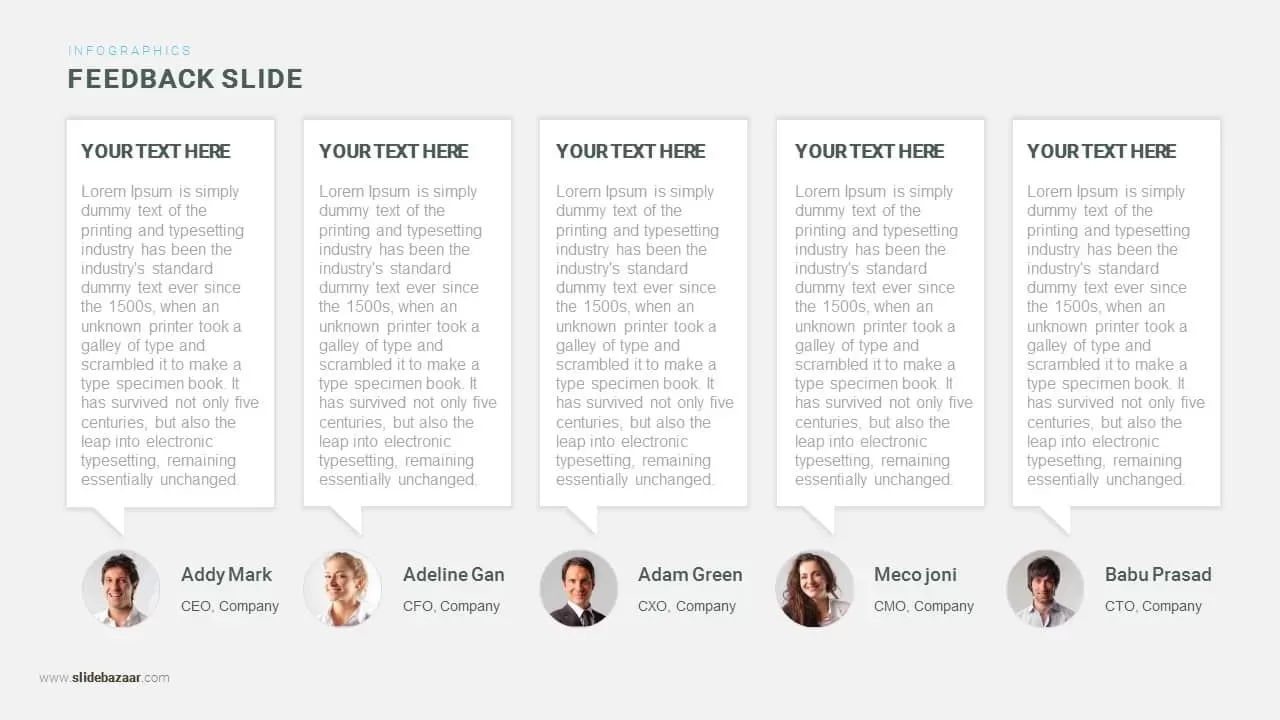
People Feedback and Testimonial Template for PowerPoint & Google Slides
Our Team
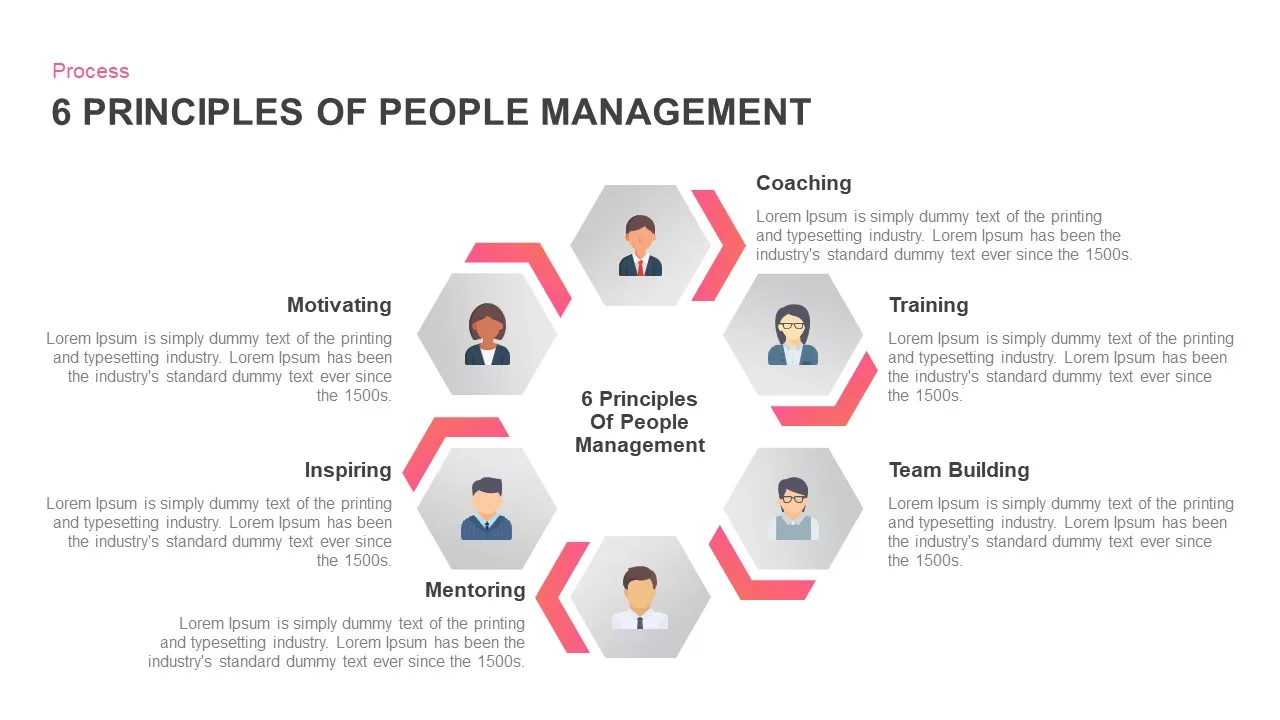
Six Principles of People Management Template for PowerPoint & Google Slides
HR
People-Centered Implementation Process Template for PowerPoint & Google Slides
Process
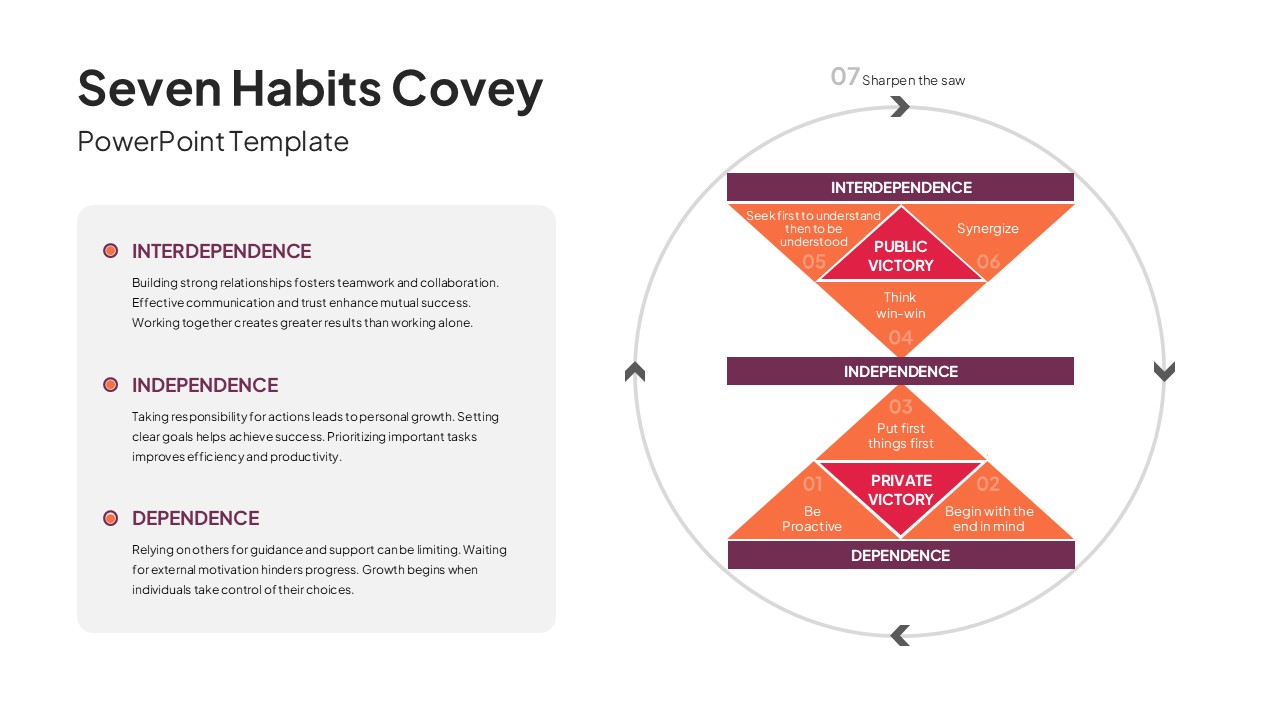
7 Habits of Highly Effective People Covey Model Template for PowerPoint & Google Slides
Leadership
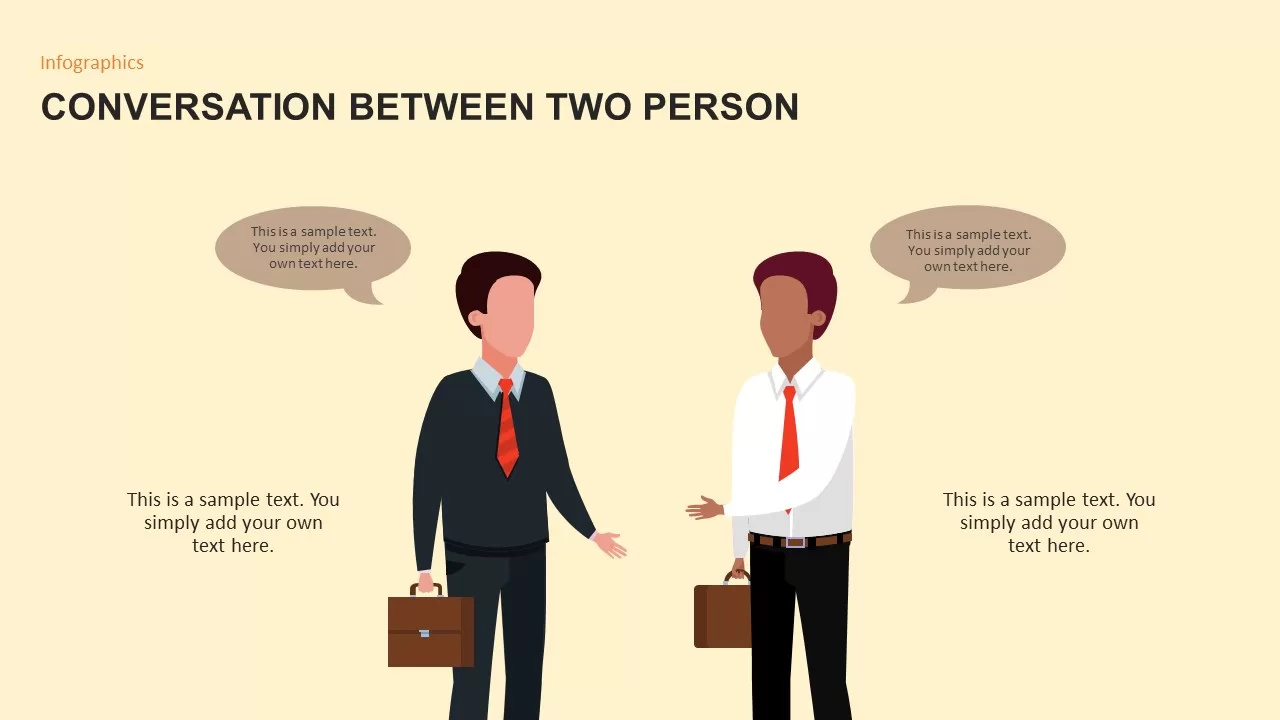
Conversation Between Two People template for PowerPoint & Google Slides
Graphics
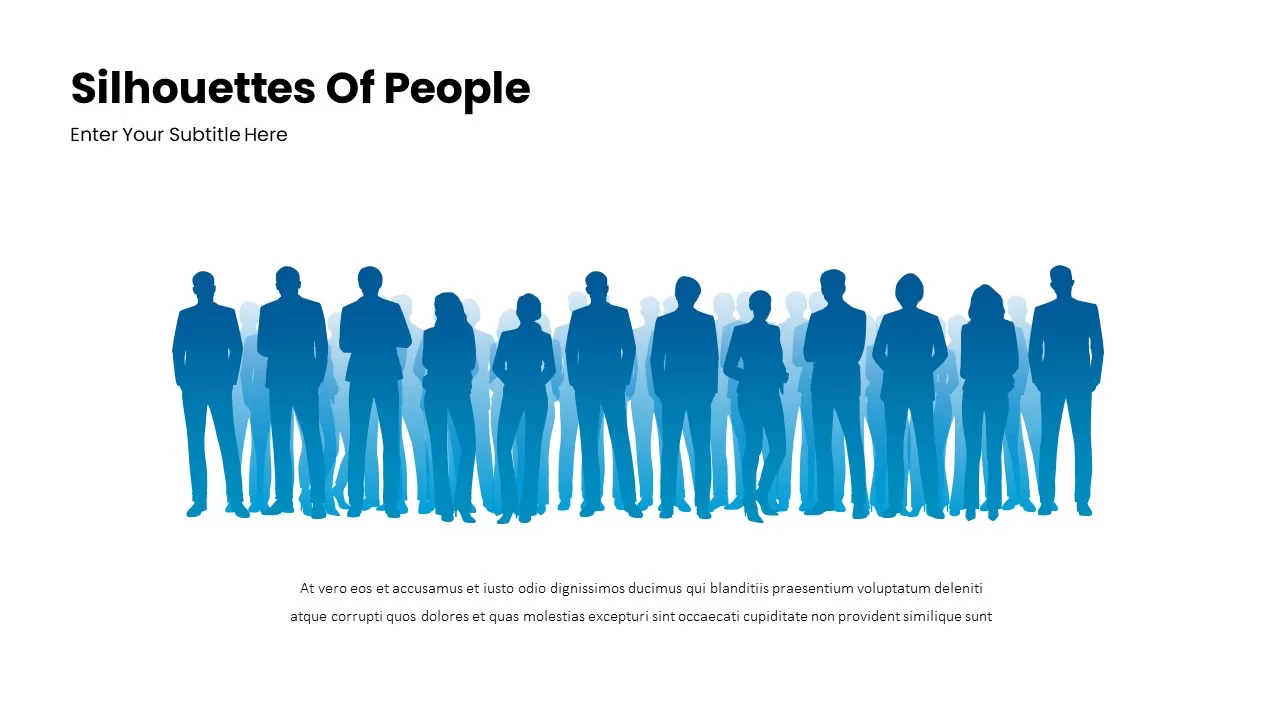
Blue Silhouettes of People Crowd Slide Template for PowerPoint & Google Slides
Our Team
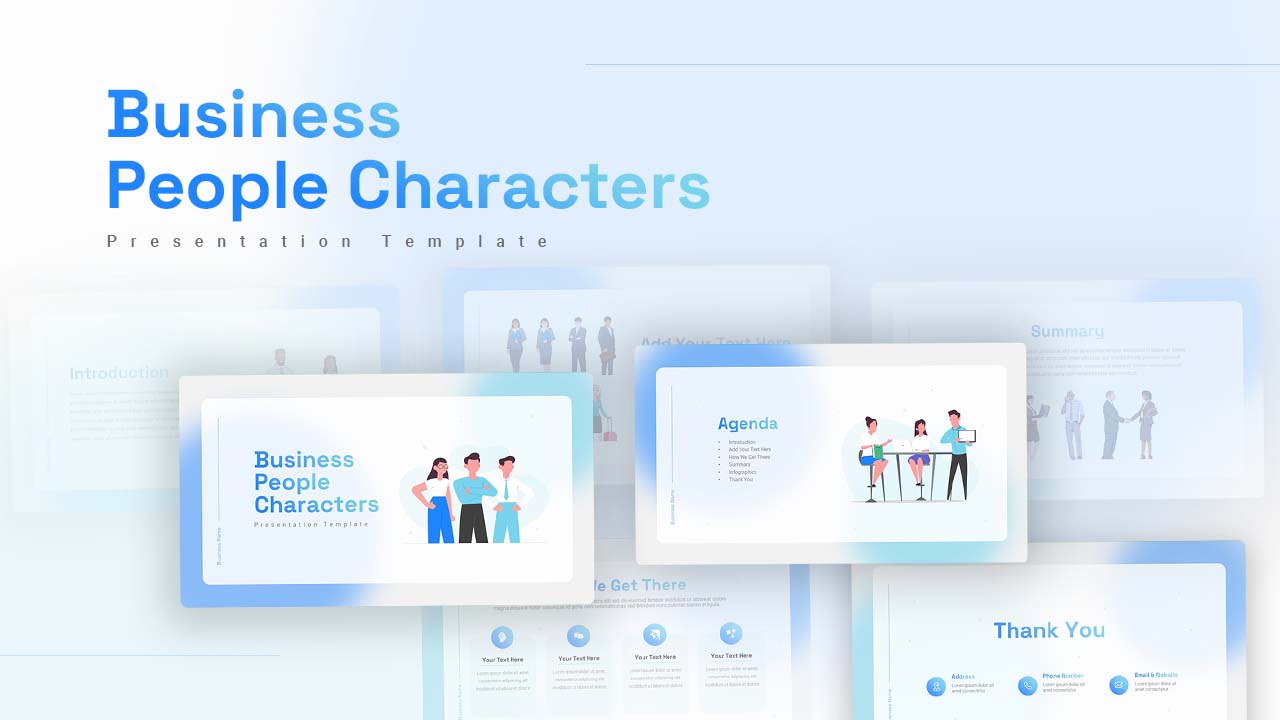
Business People Characters Presentation Template for PowerPoint & Google Slides
Decks
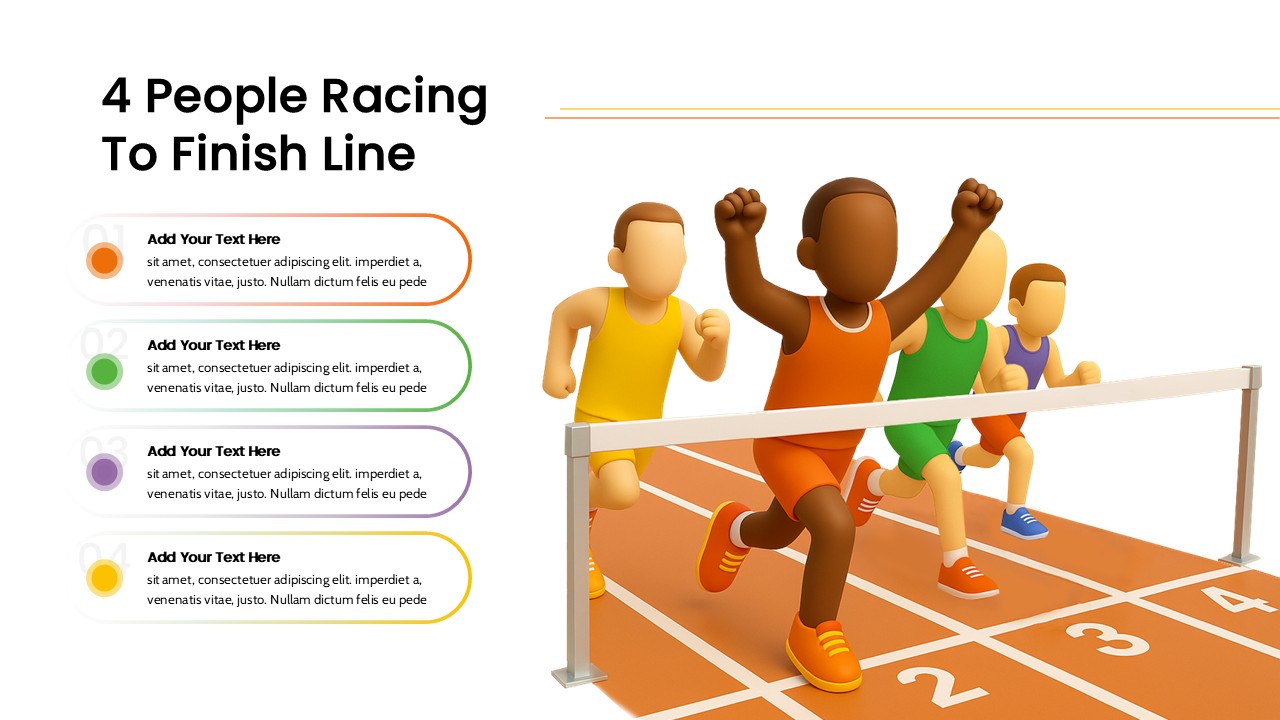
4 People Racing to Finish Line Template for PowerPoint & Google Slides
Accomplishment
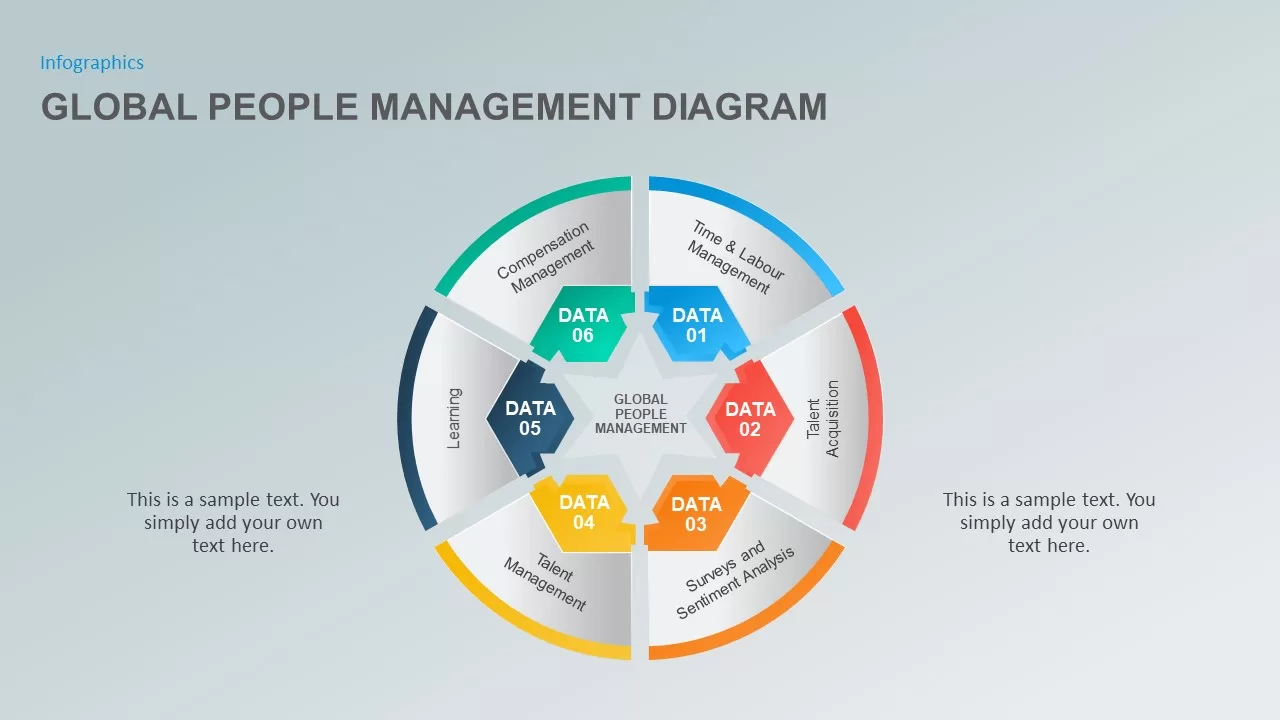
The Global People Management Diagram for PowerPoint & Google Slides
Business Models
Speedometer Infographic Gauge Comparison Template for PowerPoint & Google Slides
Comparison

A/B Testing Comparison Infographic template for PowerPoint & Google Slides
Comparison

Comparison Pricing Table Infographic Template for PowerPoint & Google Slides
Comparison Chart
Two-Column Comparison Infographic Slide Template for PowerPoint & Google Slides
Comparison
Seller Portals Comparison Infographic Template for PowerPoint & Google Slides
Process
Generations Comparison Infographic Template for PowerPoint & Google Slides
Timeline
RAG Status Infographic Comparison Template for PowerPoint & Google Slides
Project
Comparison Infographic Overview template for PowerPoint & Google Slides
Business
Before and After Comparison Infographic Template for PowerPoint & Google Slides
Comparison
Free
Free Global Warming Infographic Comparison Template for PowerPoint & Google Slides
Comparison Chart
Free
Types of AI Comparison Infographic Template for PowerPoint & Google Slides
AI
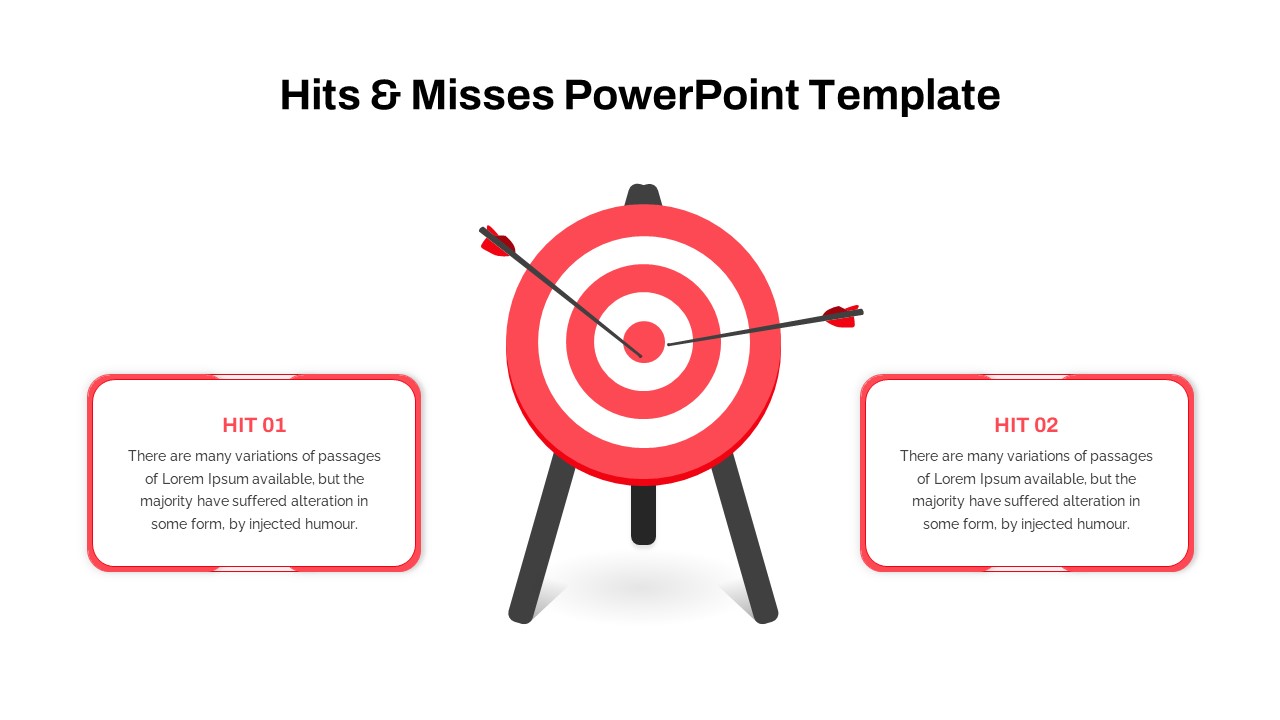
Hits & Misses Comparison Infographic Template for PowerPoint & Google Slides
Pitch Deck
Pricing Model Types Comparison Infographic Template for PowerPoint & Google Slides
Pitch Deck
VUCA vs BANI Comparison Infographic Template for PowerPoint & Google Slides
Comparison
Category Analysis Comparison Infographic Template for PowerPoint & Google Slides
Comparison
Service Zoom Feature Slides Comparison template for PowerPoint & Google Slides
Process
Comparison Bar Chart template for PowerPoint & Google Slides
Comparison Chart
Four Section Comparison Chart Diagram Template for PowerPoint & Google Slides
Infographics
Clean Mobile Service Comparison Slide Template for PowerPoint & Google Slides
Comparison
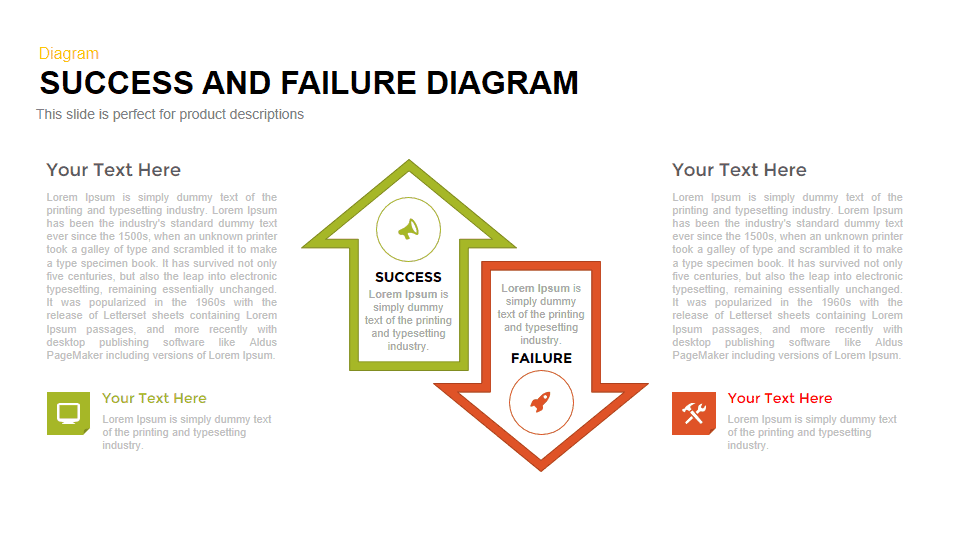
Success vs Failure Comparison Diagram Template for PowerPoint & Google Slides
Comparison
Scale Metaphor Metrics Comparison Template for PowerPoint & Google Slides
Charts
Dual Percentage Comparison Metaphor Template for PowerPoint & Google Slides
Comparison
Comparison Chart Overview template for PowerPoint & Google Slides
Comparison Chart
Dynamic Multicolor Comparison Table Template for PowerPoint & Google Slides
Comparison
Interactive Pricing Plan Comparison Template for PowerPoint & Google Slides
Comparison
Five-Option Text Boxes Table Comparison Template for PowerPoint & Google Slides
Business Report
Radar Chart Product Comparison Template for PowerPoint & Google Slides
Comparison Chart
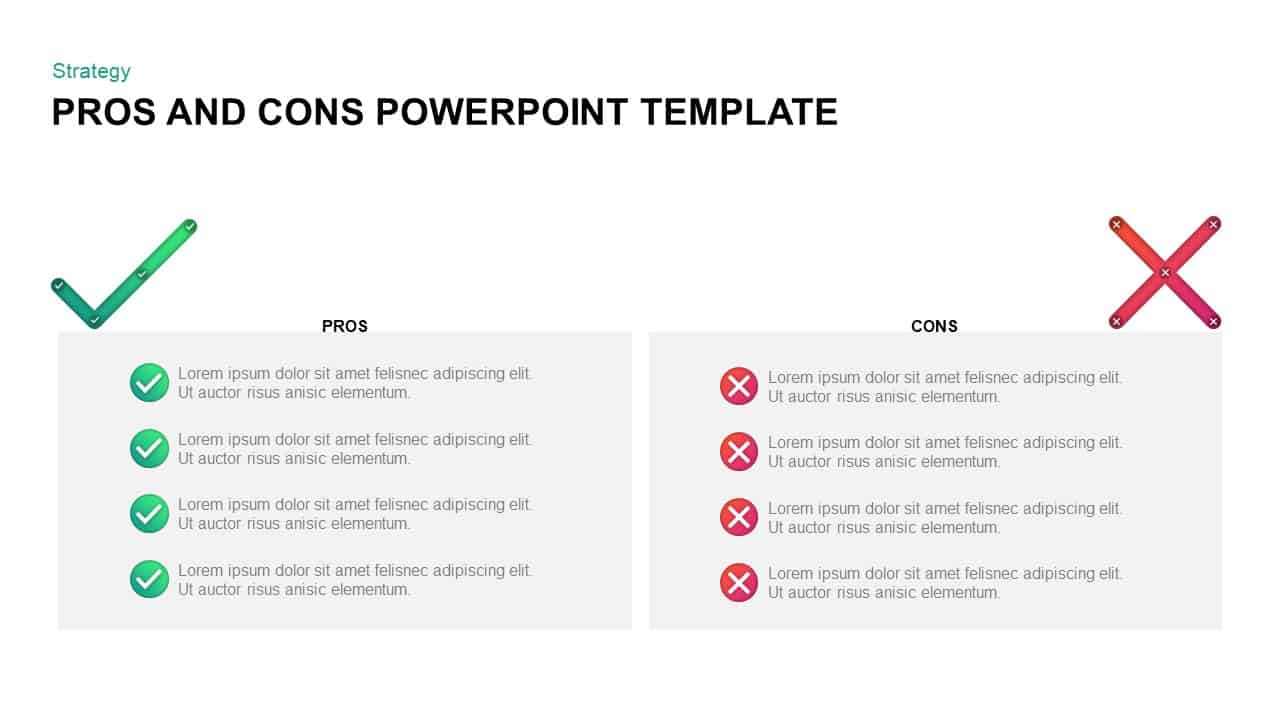
Pros and Cons Comparison Slide Template for PowerPoint & Google Slides
Comparison
Fact and Figures Comparison Slide Template for PowerPoint & Google Slides
Business Report
Four Business Structure Types Comparison Diagram Template for PowerPoint & Google Slides
Business Strategy

BMI Category Comparison Chart Template for PowerPoint & Google Slides
Comparison
Isometric 3D Block Comparison Diagram Template for PowerPoint & Google Slides
Comparison
Circular Product Comparison Chart Template for PowerPoint & Google Slides
Comparison Chart
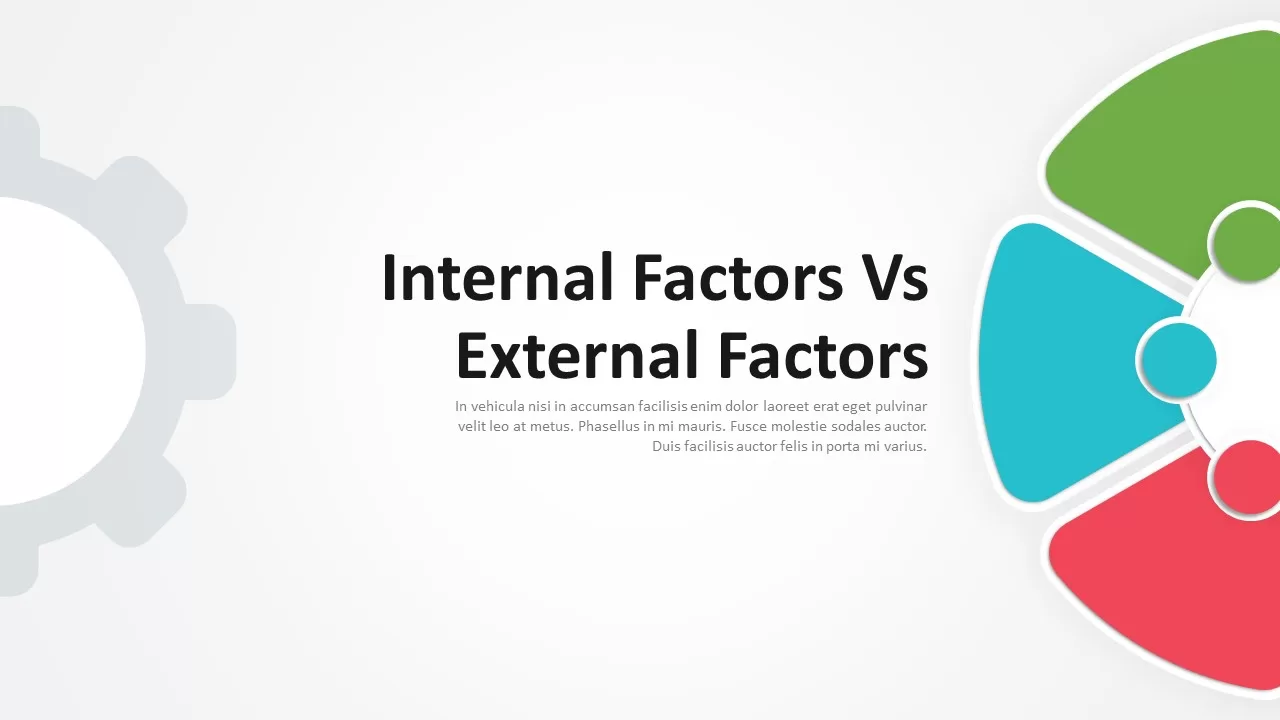
Internal vs External Factors Comparison Template for PowerPoint & Google Slides
Comparison
Theory X and Theory Y Comparison Template for PowerPoint & Google Slides
Comparison
Competitive Landscape Comparison Template Pack for PowerPoint & Google Slides
Comparison
Before and After Comparison Infographics Template for PowerPoint & Google Slides
Comparison
Current vs Future State Comparison Slide Template for PowerPoint & Google Slides
Comparison Chart
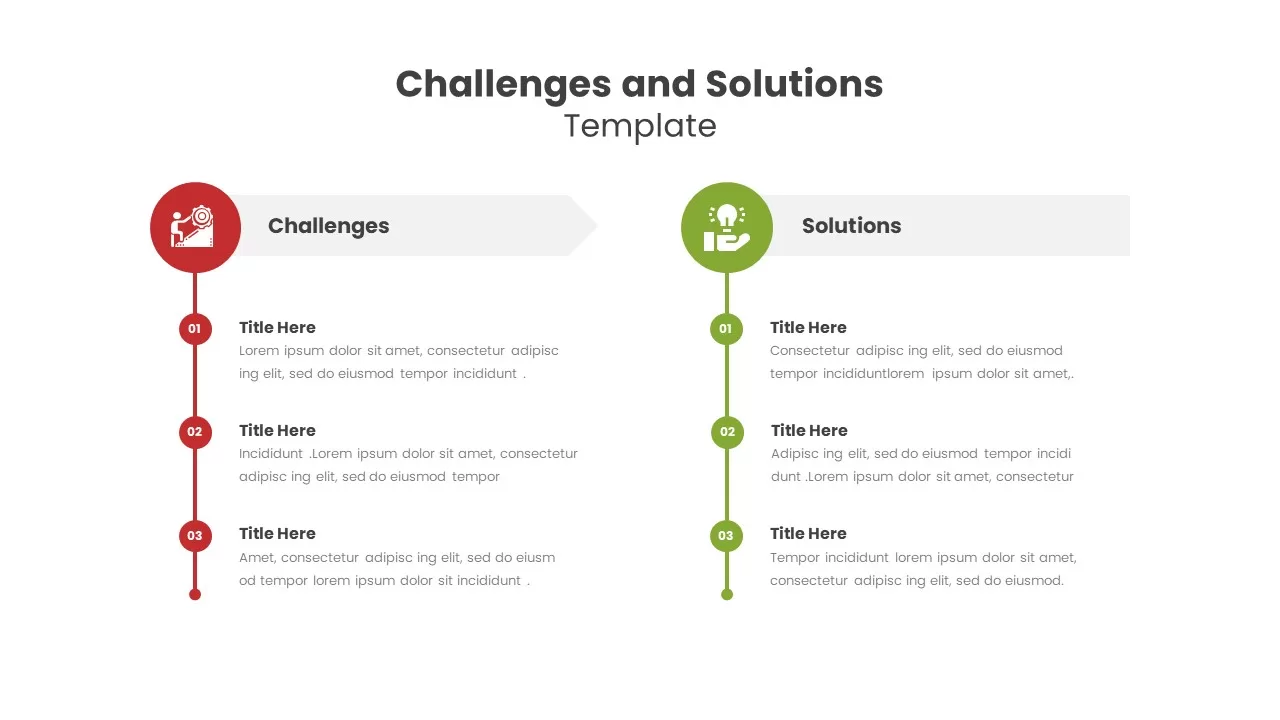
Challenges and Solutions Comparison Template for PowerPoint & Google Slides
Opportunities Challenges
Dynamic Benchmarking Comparison Chart Template for PowerPoint & Google Slides
Comparison Chart
Cost Benefit Analysis Comparison Template for PowerPoint & Google Slides
Comparison
Risk Heatmap Comparison Template for PowerPoint & Google Slides
Maps
Heatmap Comparison Template for PowerPoint & Google Slides
Maps
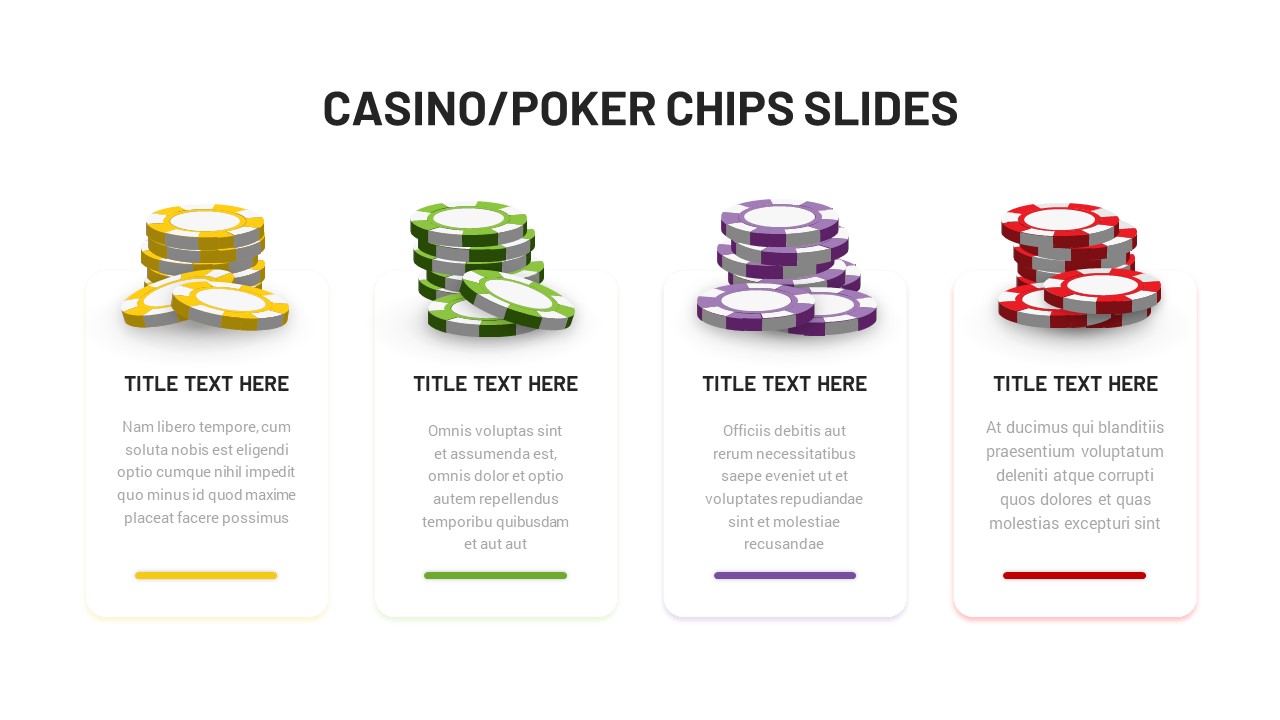
Casino Poker Chips Comparison Slide Template for PowerPoint & Google Slides
Comparison
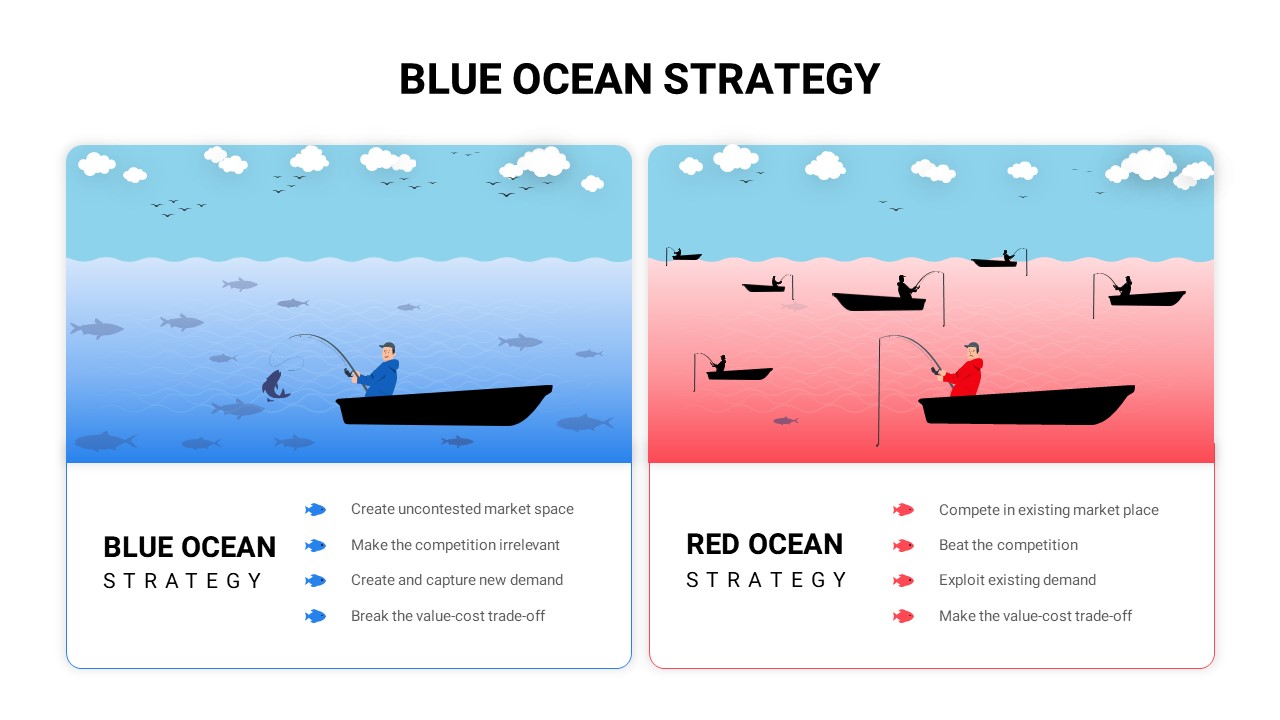
Blue vs Red Ocean Strategy Comparison Template for PowerPoint & Google Slides
Business Strategy
Conflict Infographics Comparison Template for PowerPoint & Google Slides
Infographics
Surgery Infographics Comparison Template for PowerPoint & Google Slides
Health
Clustered Bar Chart Comparison Template for PowerPoint & Google Slides
Bar/Column
Mirror Bar Chart Comparison Template for PowerPoint & Google Slides
Bar/Column
Dynamic Bar-of-Pie Chart Comparison Template for PowerPoint & Google Slides
Pie/Donut
ESG Initiatives Comparison Chart Template for PowerPoint & Google Slides
Business
Economies of Scale Cost Curve Comparison Template for PowerPoint & Google Slides
Comparison Chart
Regional Revenue Comparison Overview Template for PowerPoint & Google Slides
Comparison
Risk Level Gauge Comparison Dashboard Template for PowerPoint & Google Slides
Comparison
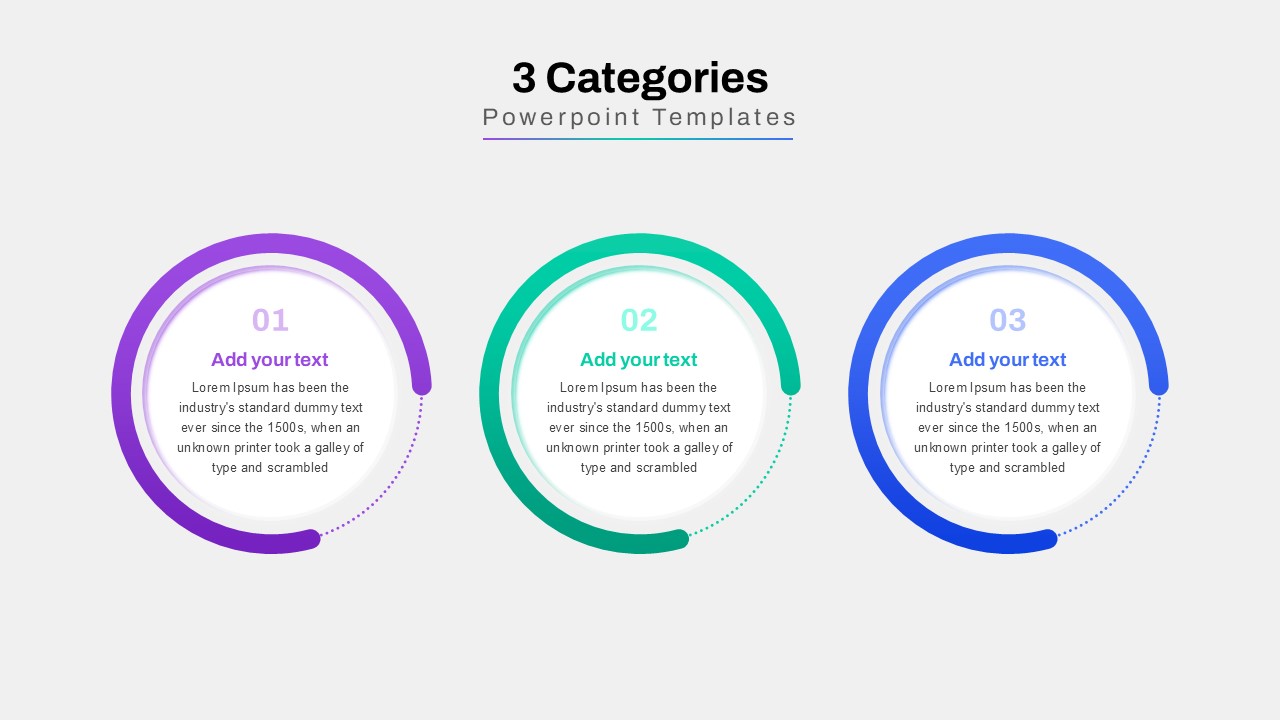
Three-Category Comparison Template for PowerPoint & Google Slides
Comparison
Profile Comparison Chart template for PowerPoint & Google Slides
Comparison Chart
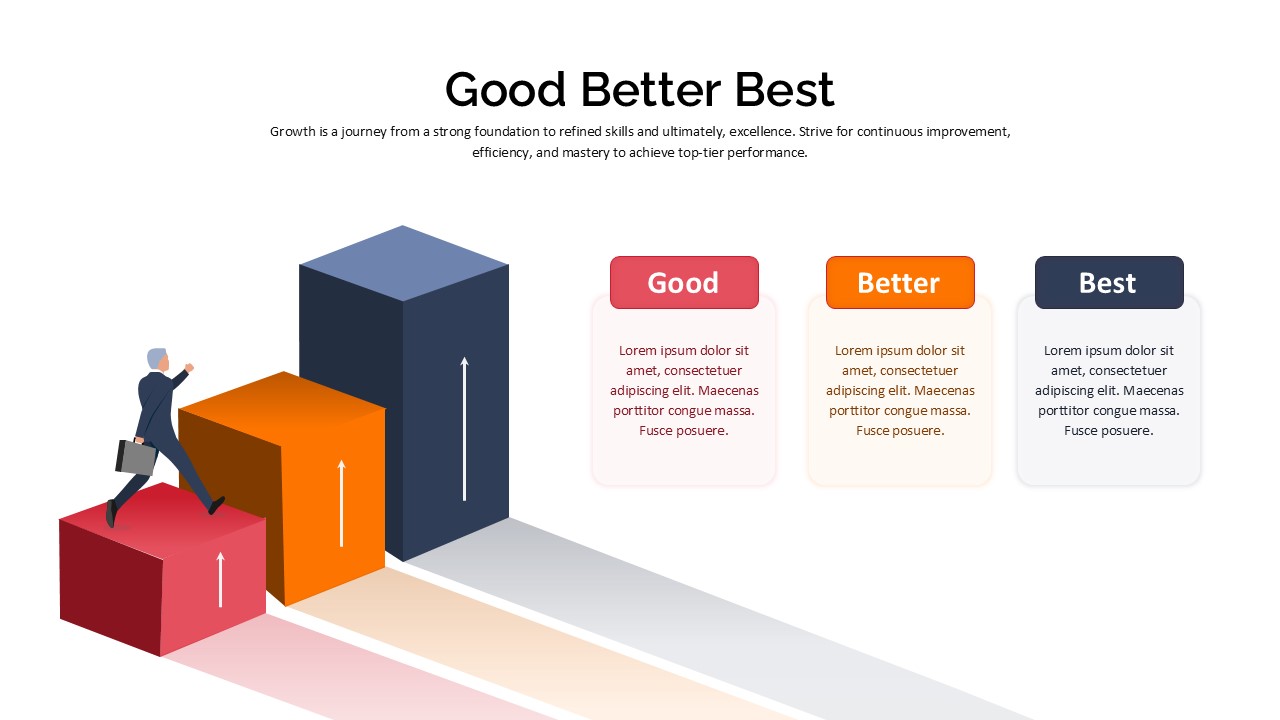
Good Better Best Comparison template for PowerPoint & Google Slides
Comparison
Integrative Thinking Comparison Diagram Template for PowerPoint & Google Slides
Comparison
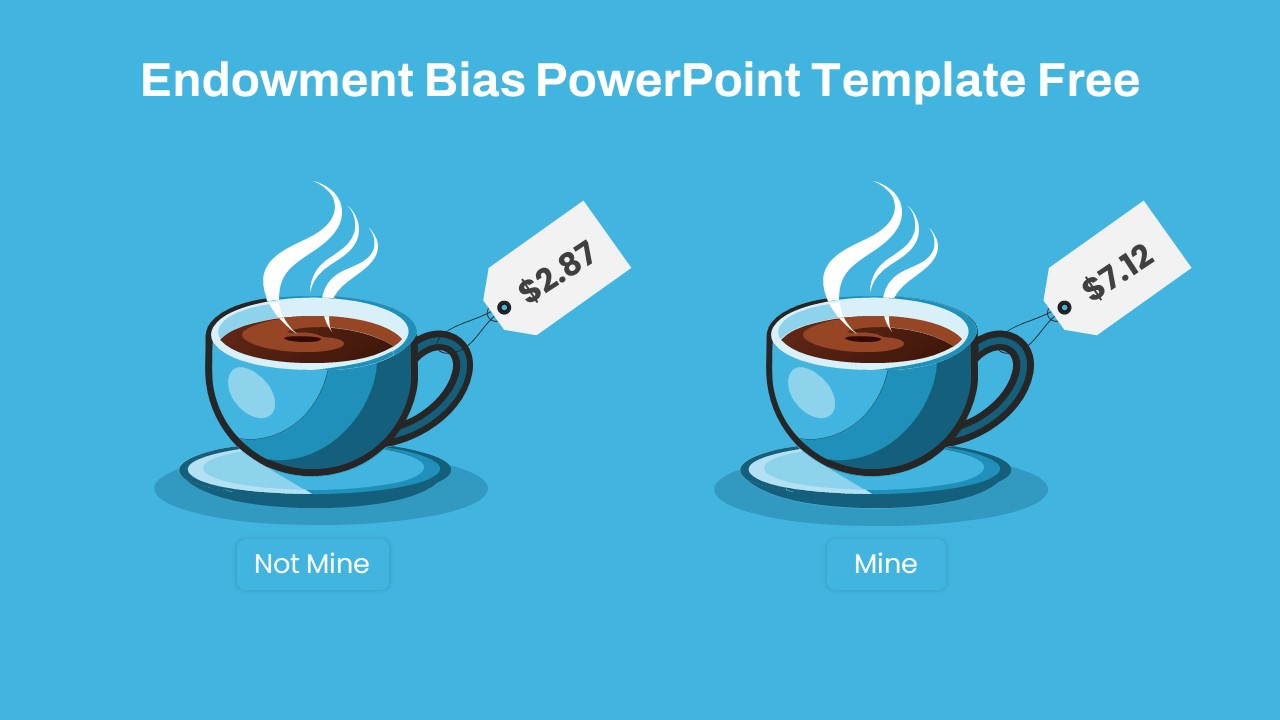
Endowment Bias Coffee Price Comparison Template for PowerPoint & Google Slides
Comparison
Free
Sales Growth Comparison Chart & Table Template for PowerPoint & Google Slides
Bar/Column
Two-Box Analysis & Target Comparison Template for PowerPoint & Google Slides
Comparison
Two Section Comparison template for PowerPoint & Google Slides
Business Proposal
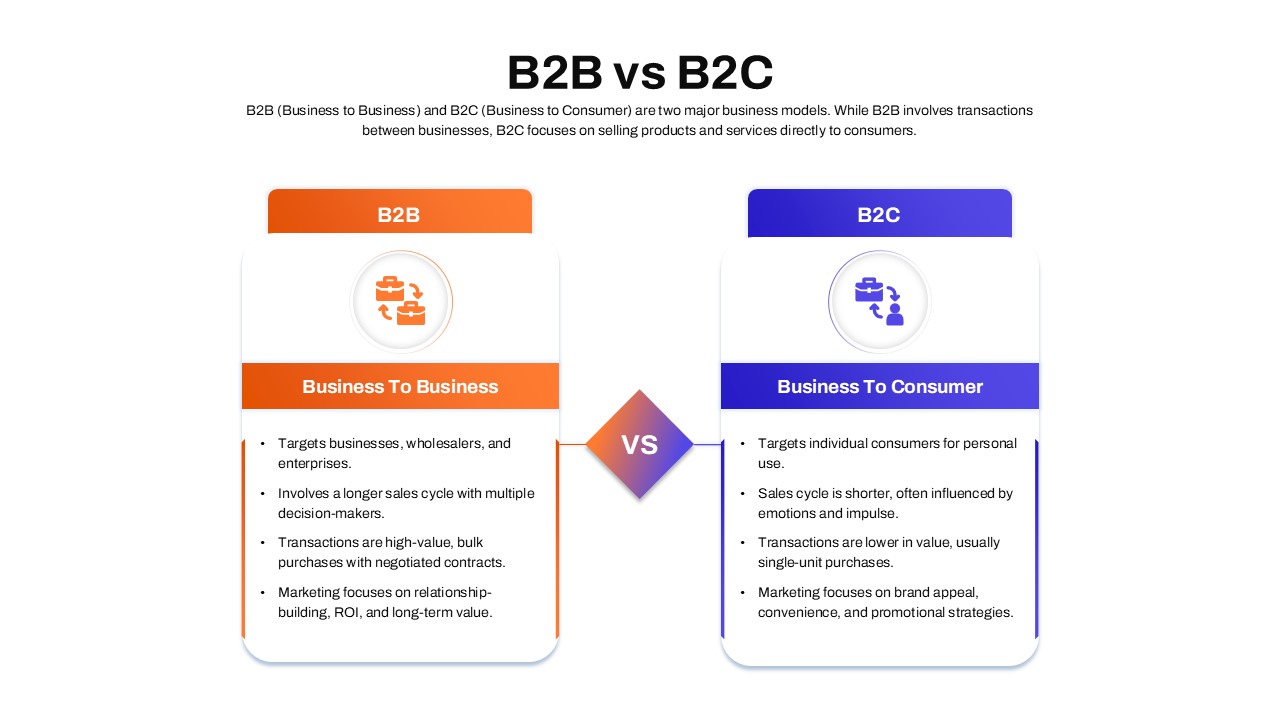
B2B vs B2C Comparison template for PowerPoint & Google Slides
Business Models
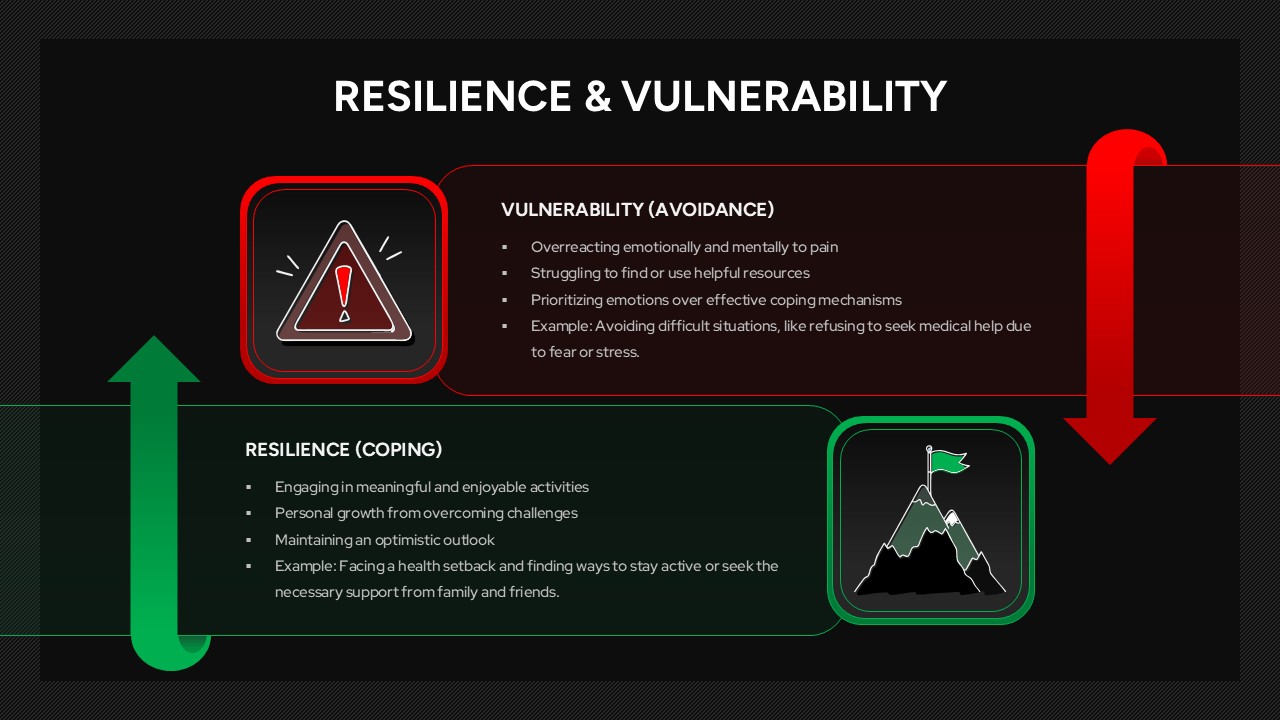
Resilience & Vulnerability Comparison Template for PowerPoint & Google Slides
Comparison
Skills Gap Analysis Comparison Chart Template for PowerPoint & Google Slides
Gap
Attribution Models Comparison Diagram Template for PowerPoint & Google Slides
Comparison
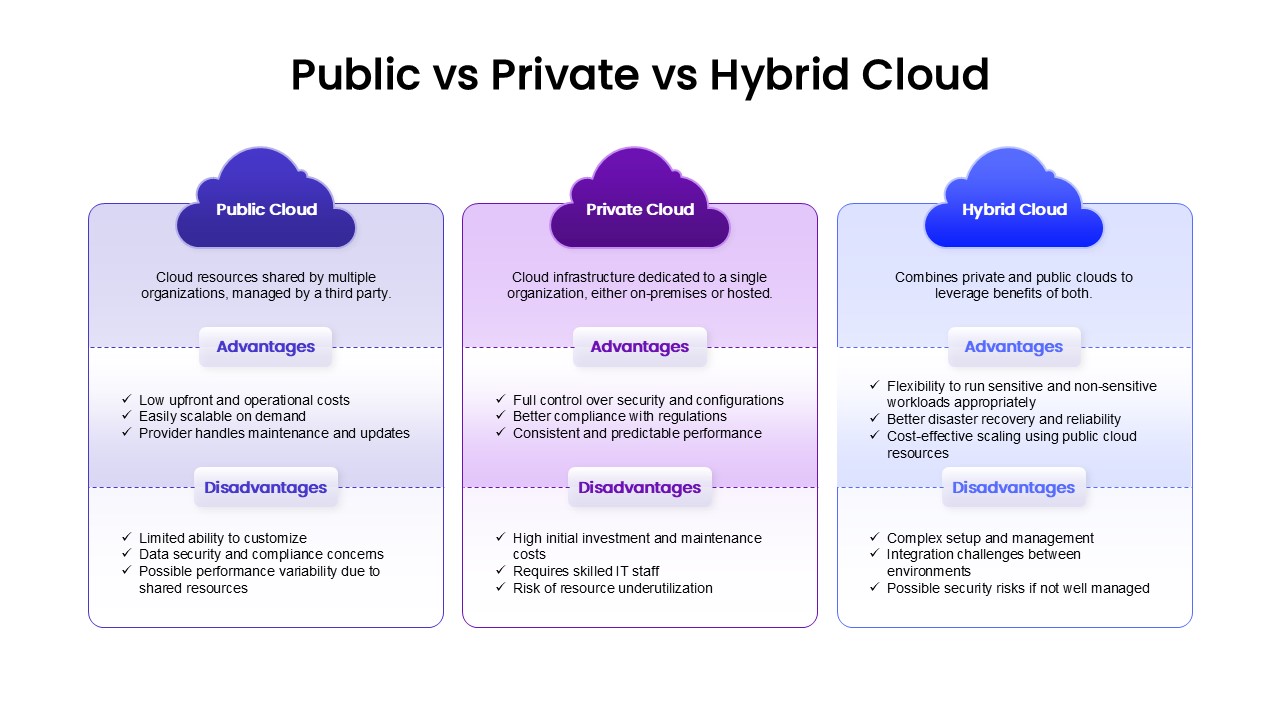
Public, Private & Hybrid Cloud Comparison Template for PowerPoint & Google Slides
Cloud Computing
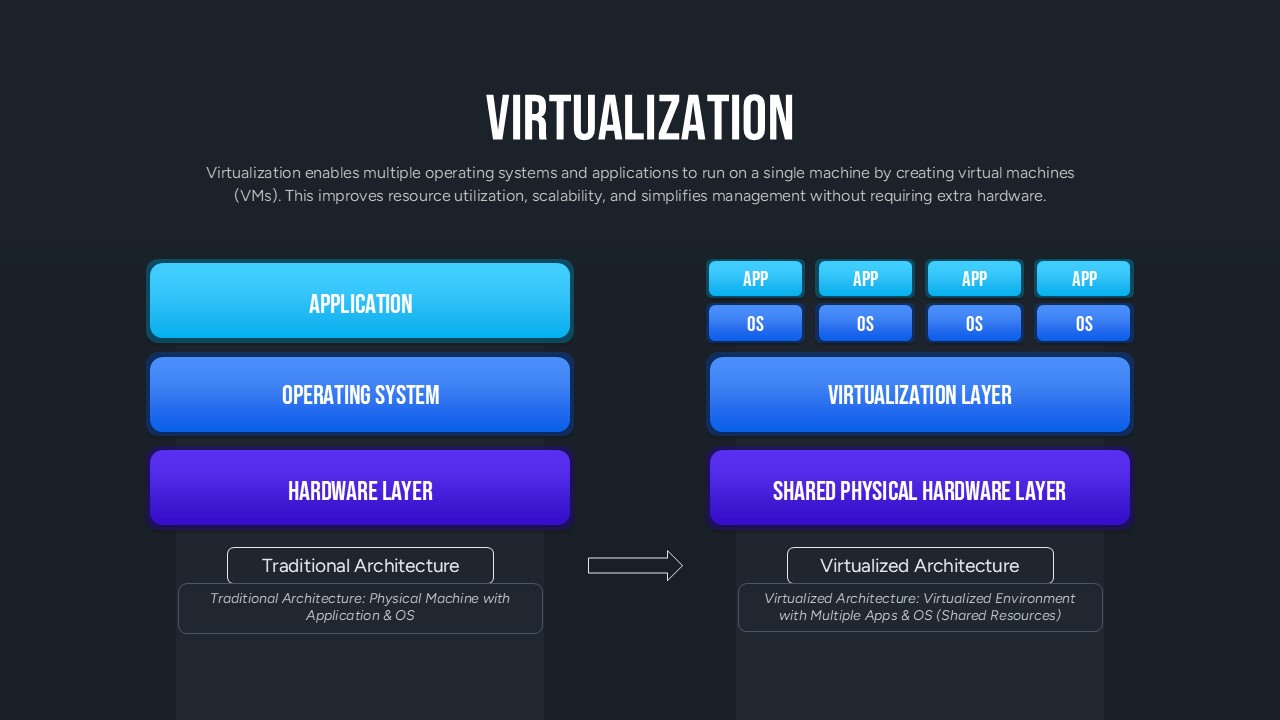
Virtualization Architecture Comparison Template for PowerPoint & Google Slides
Comparison Chart
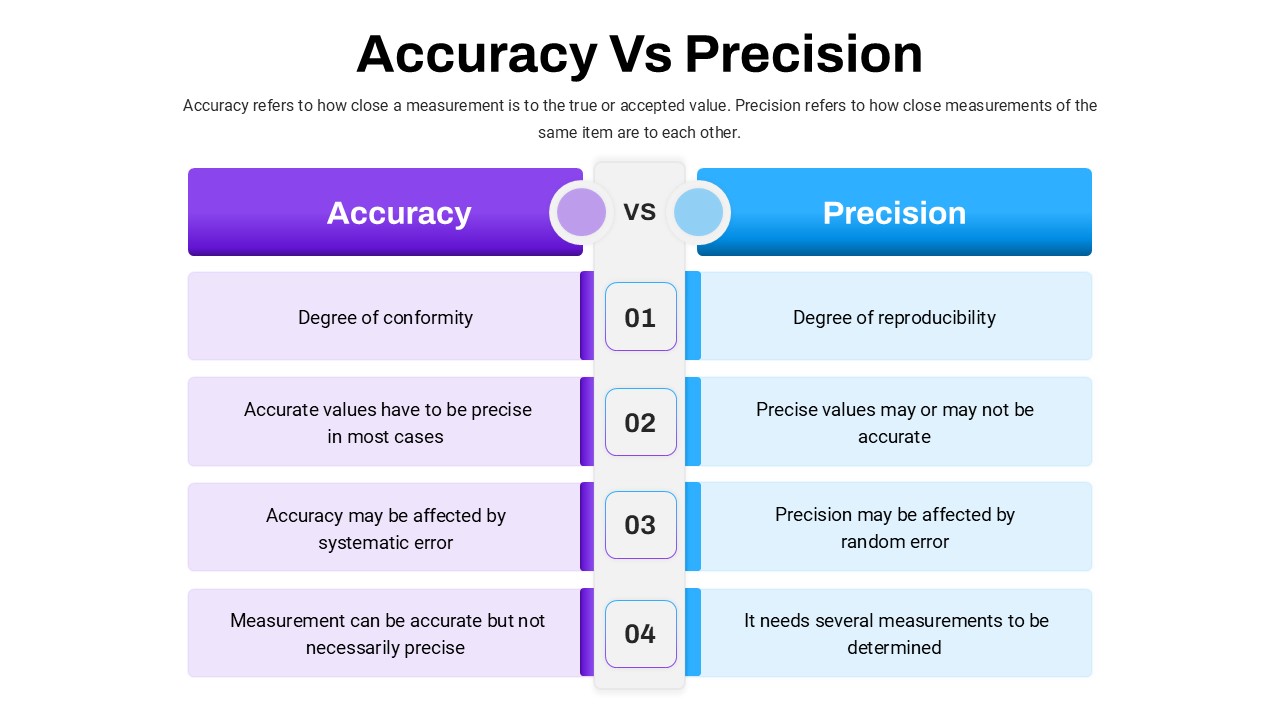
Accuracy Vs Precision Comparison Template for PowerPoint & Google Slides
Comparison Chart
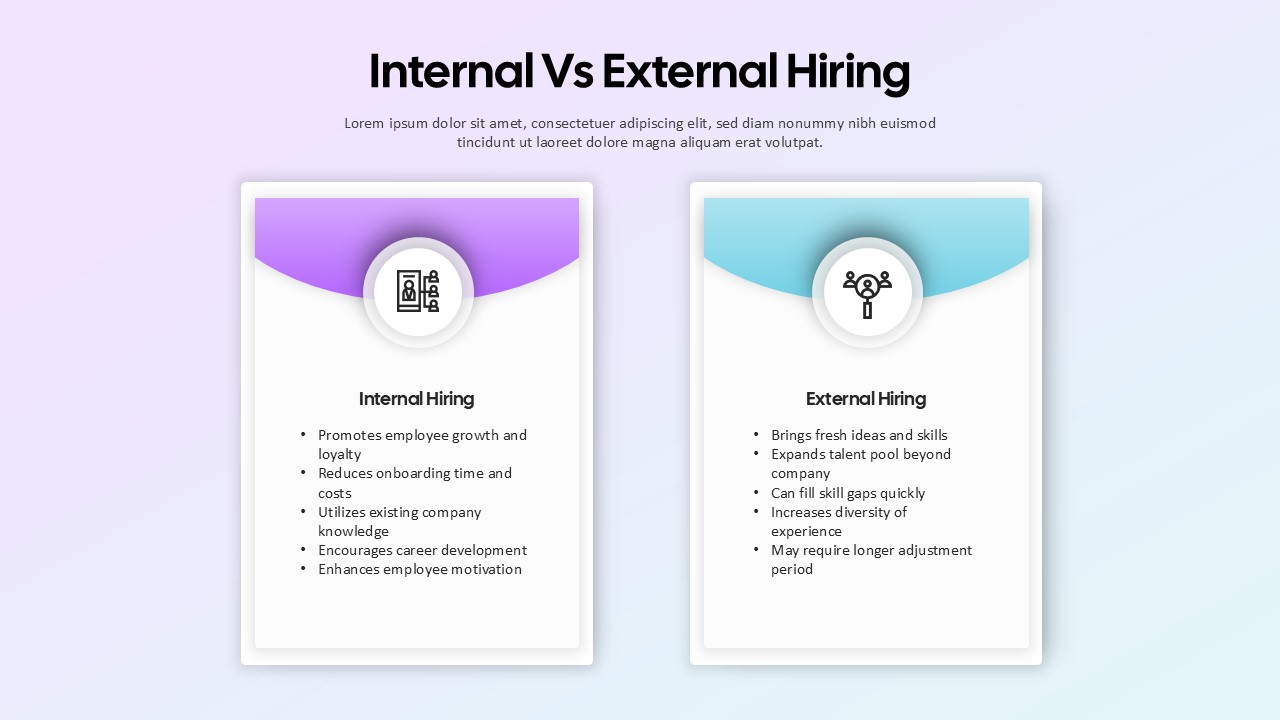
Internal vs External Hiring Comparison Template for PowerPoint & Google Slides
Comparison
Comparison Table Presentation Template for PowerPoint & Google Slides
Table
Colorful Comparison Table Presentation Template for PowerPoint & Google Slides
Table
Five Column Comparison Table Layout Template for PowerPoint & Google Slides
Comparison
Quarterly Comparison Pie Chart Template for PowerPoint & Google Slides
Pie/Donut
Pros and Cons Comparison Table Template for PowerPoint & Google Slides
Comparison Chart
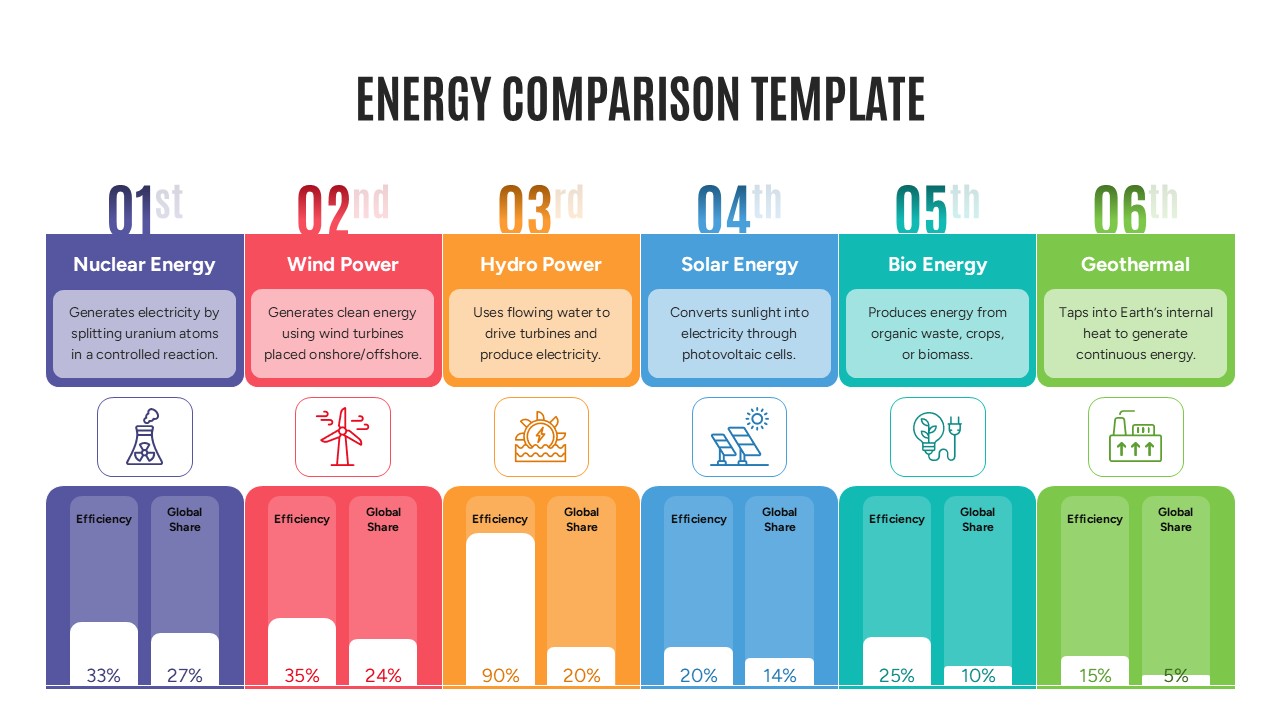
Energy Comparison Template for PowerPoint & Google Slides
Comparison
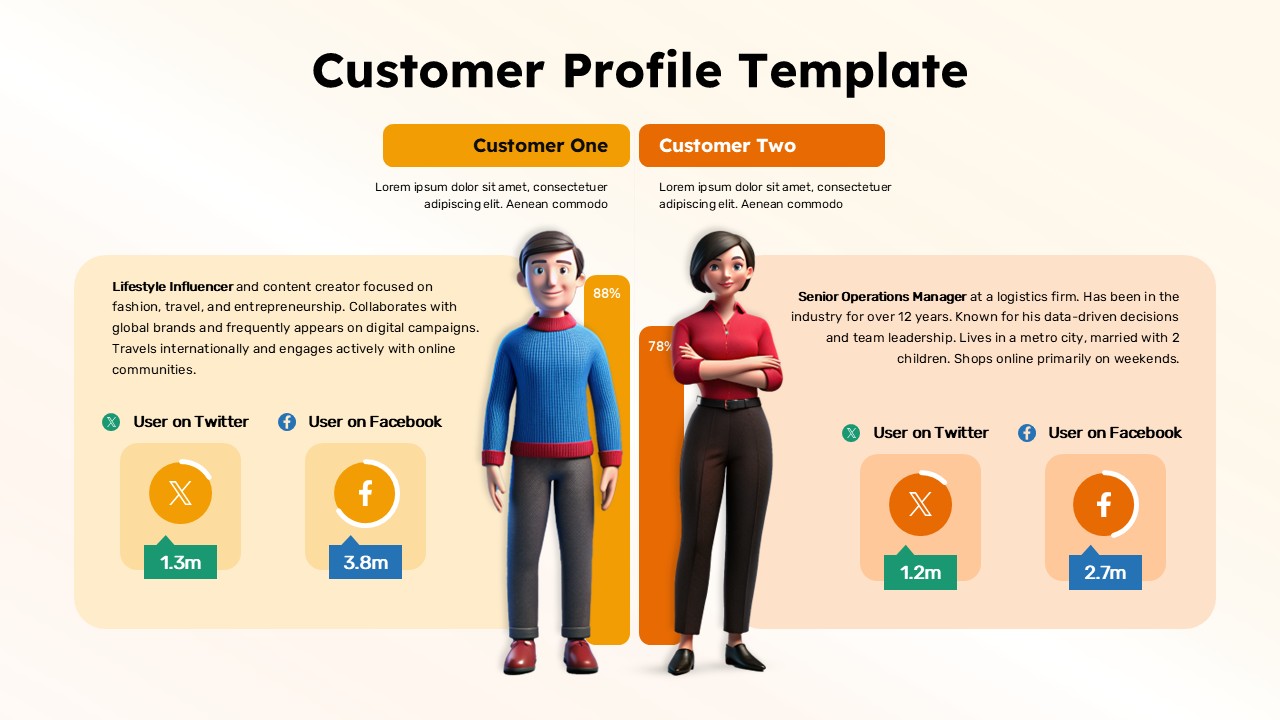
Customer Persona Comparison Profile Template for PowerPoint & Google Slides
Business
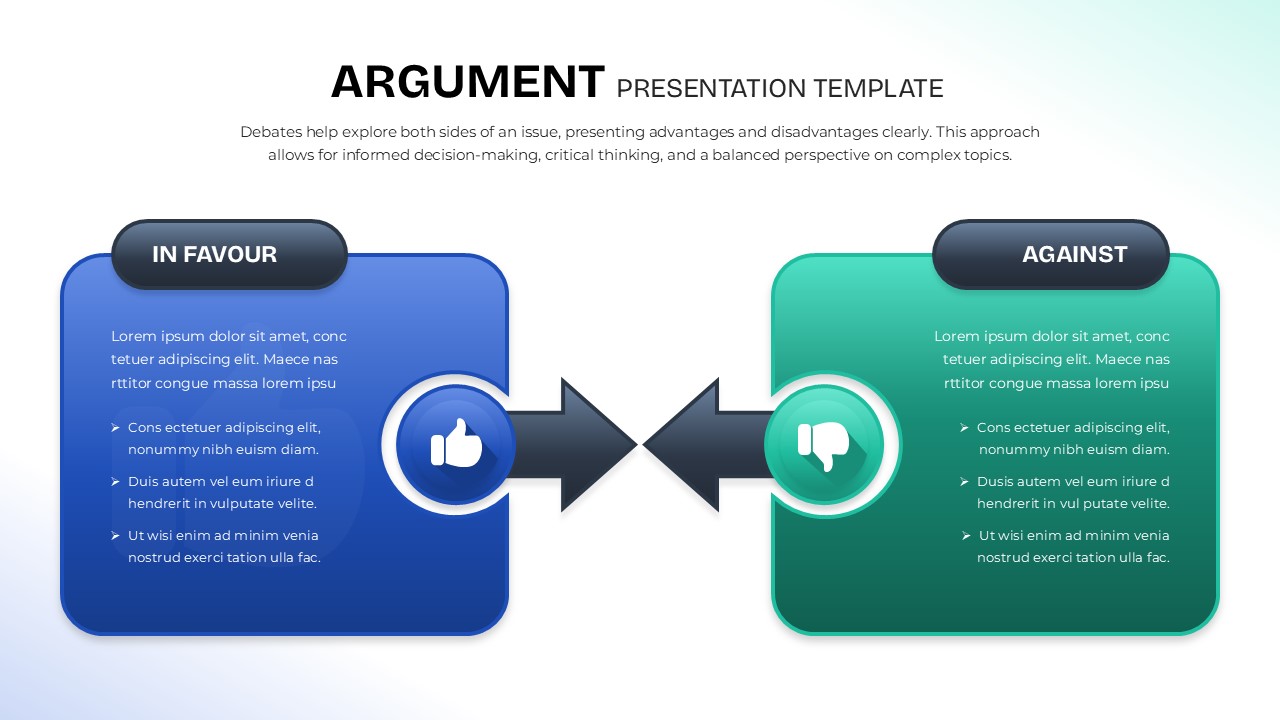
Argument Comparison Template for PowerPoint & Google Slides
Comparison
Operating Channels Comparison Diagram Template for PowerPoint & Google Slides
Business Models
Year-over-Year Performance Comparison Template for PowerPoint & Google Slides
Comparison Chart
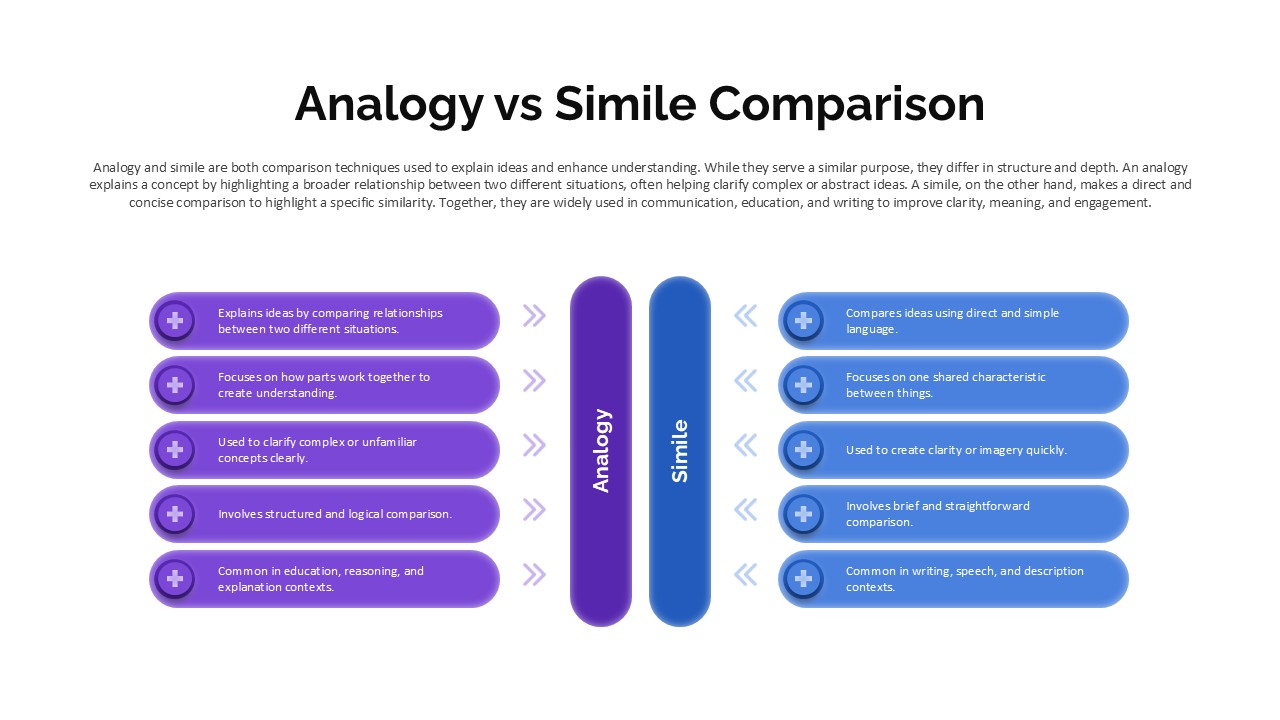
Analogy vs Simile Comparison Template for PowerPoint & Google Slides
Comparison