Gear Diagram template for PowerPoint & Google Slides

Description
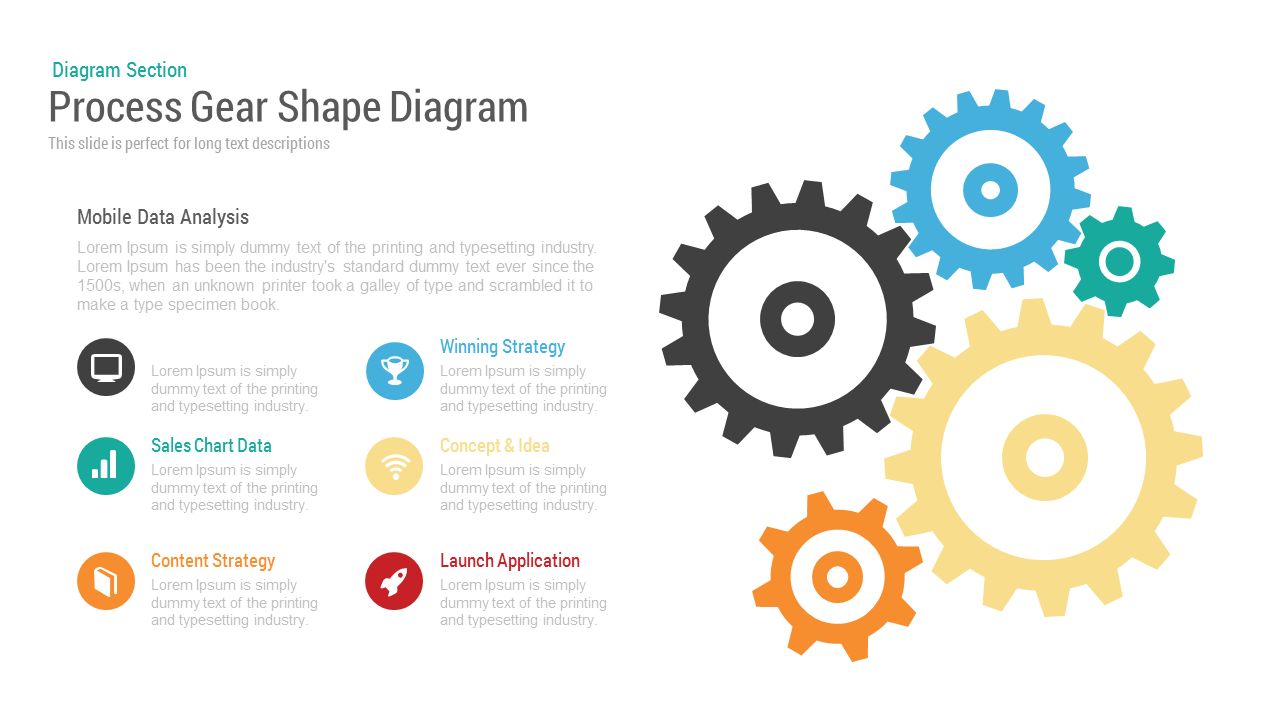
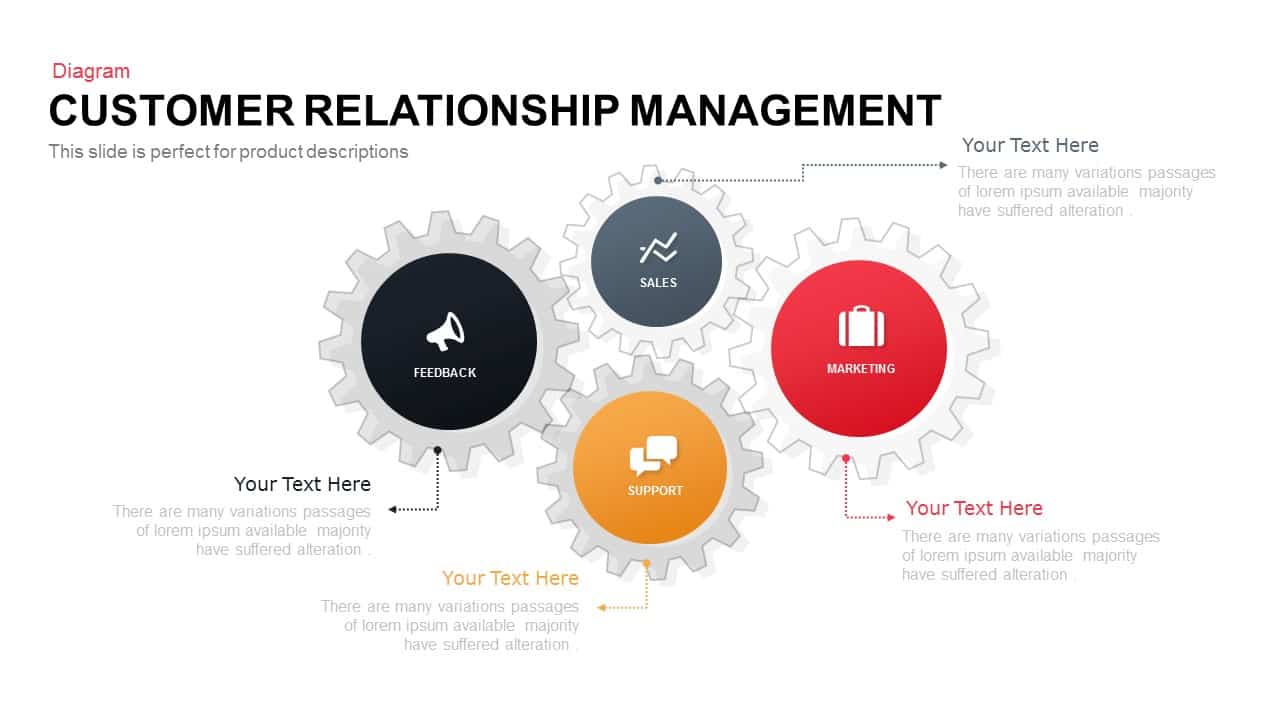
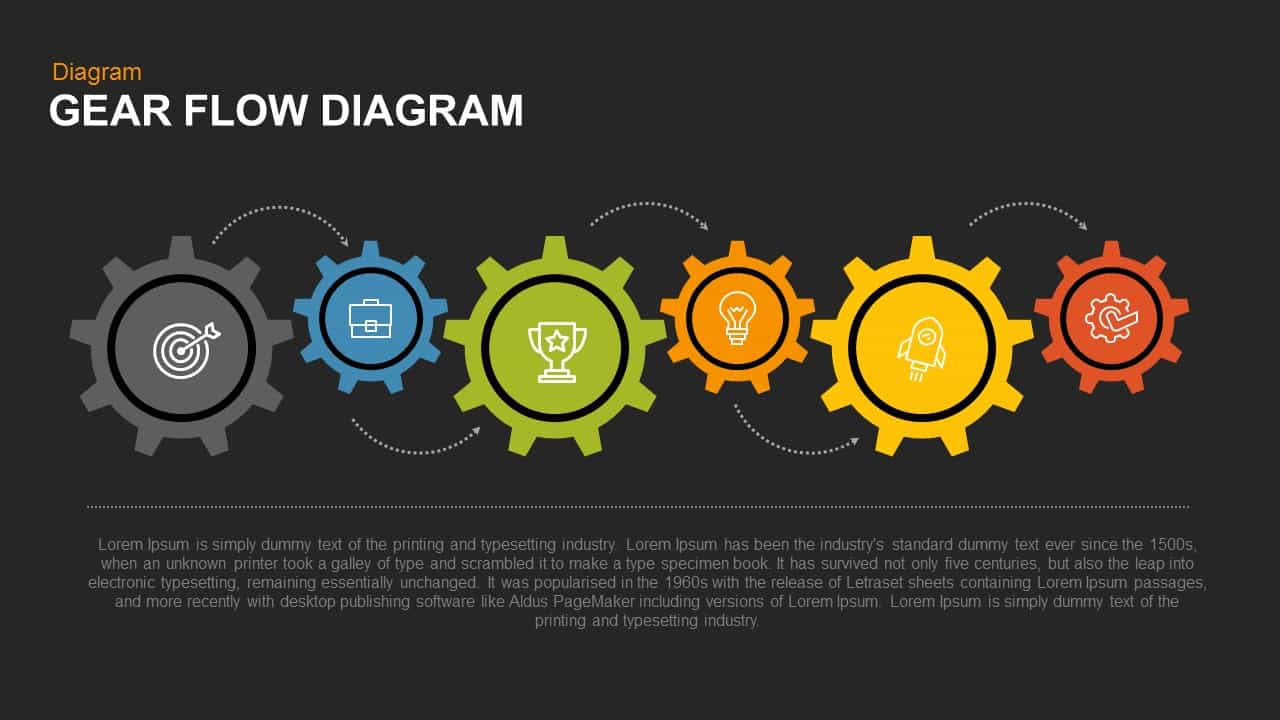
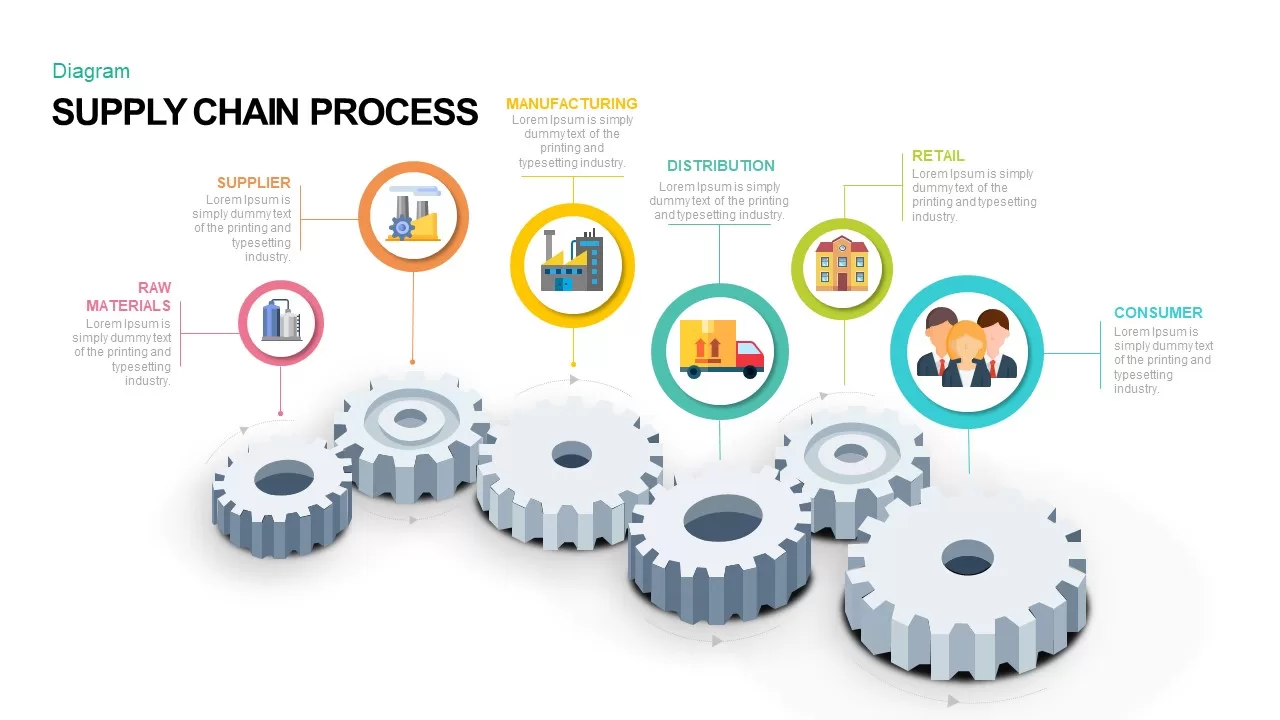
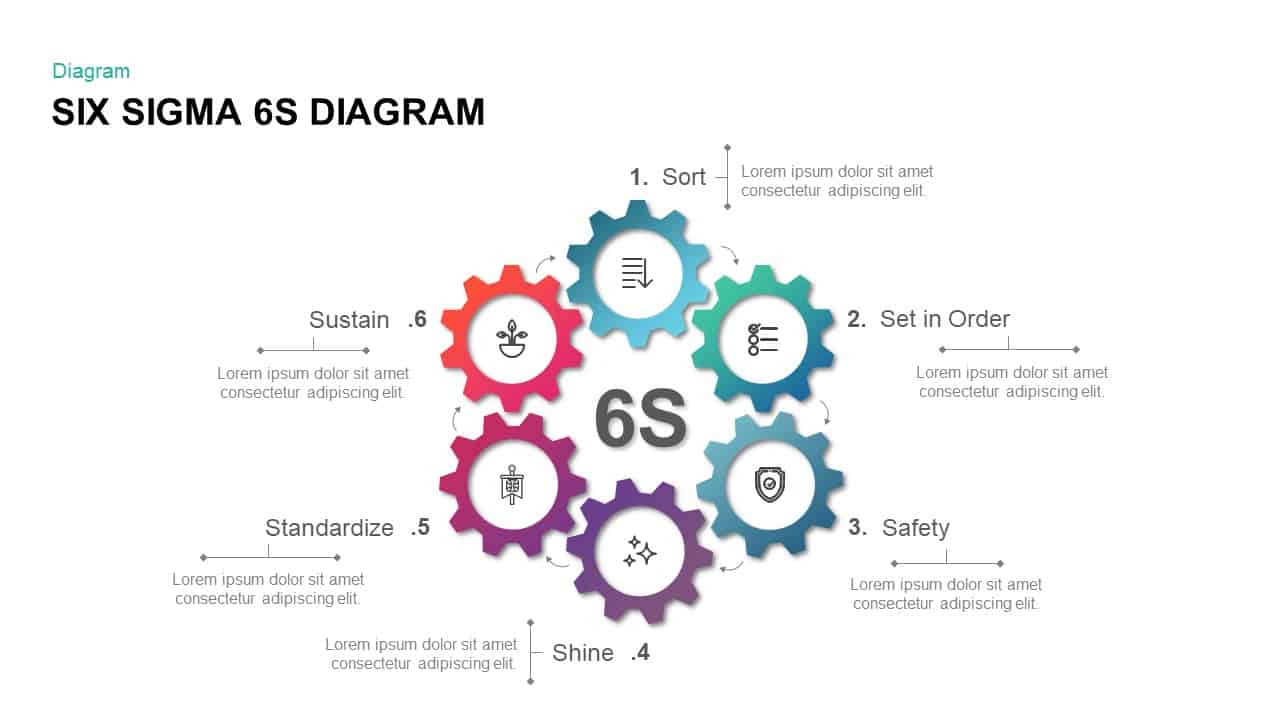
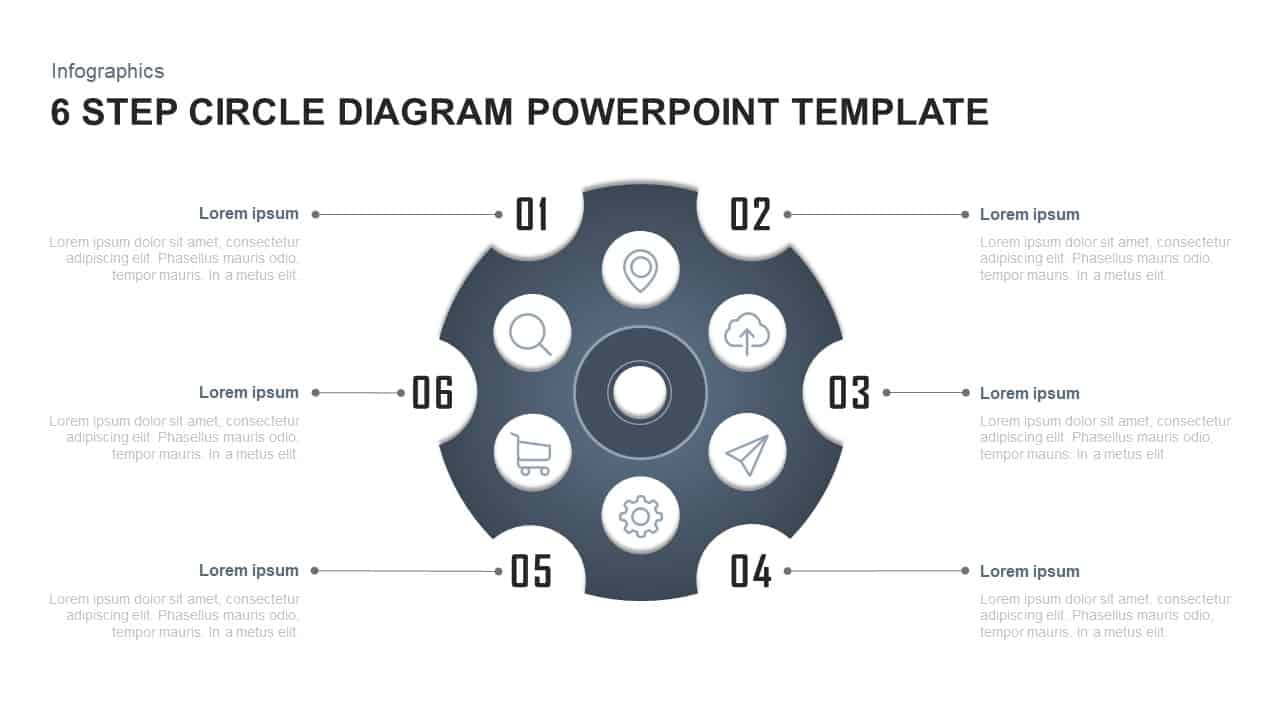
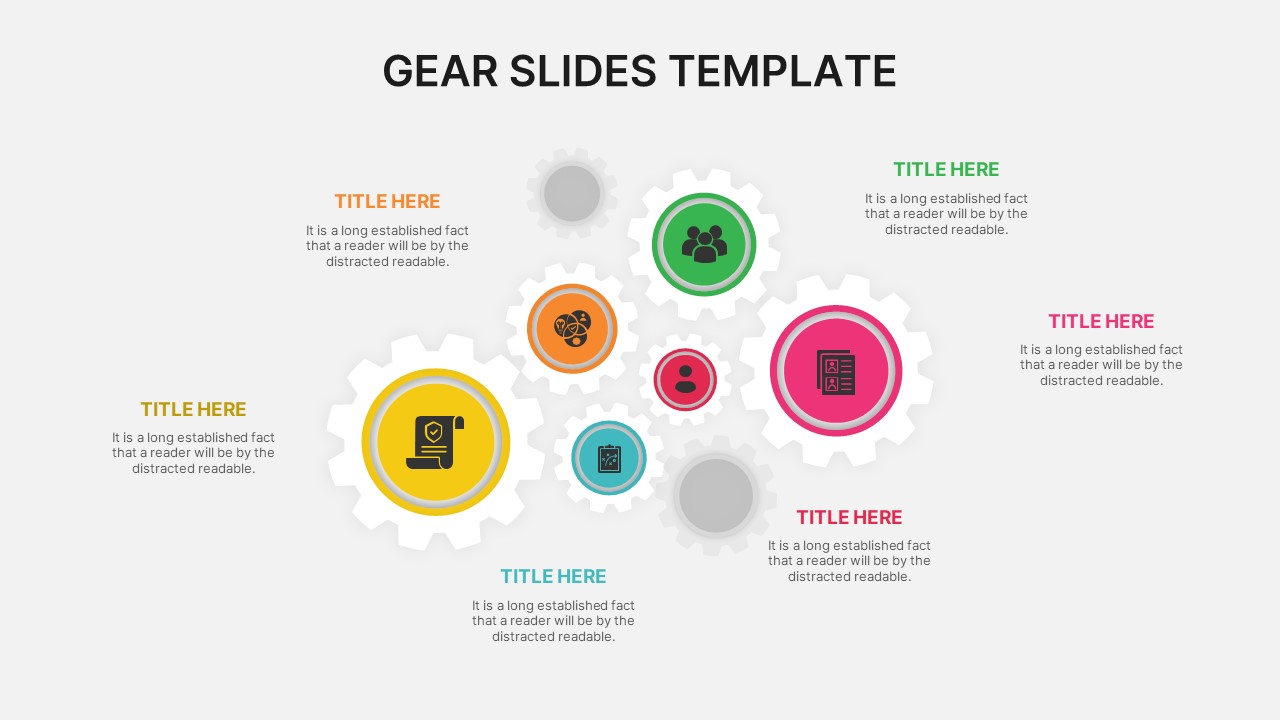
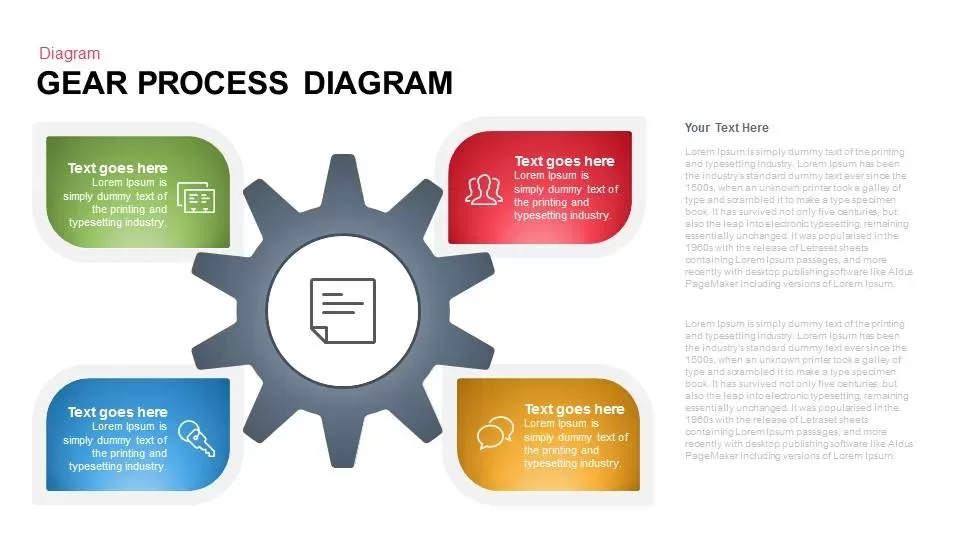
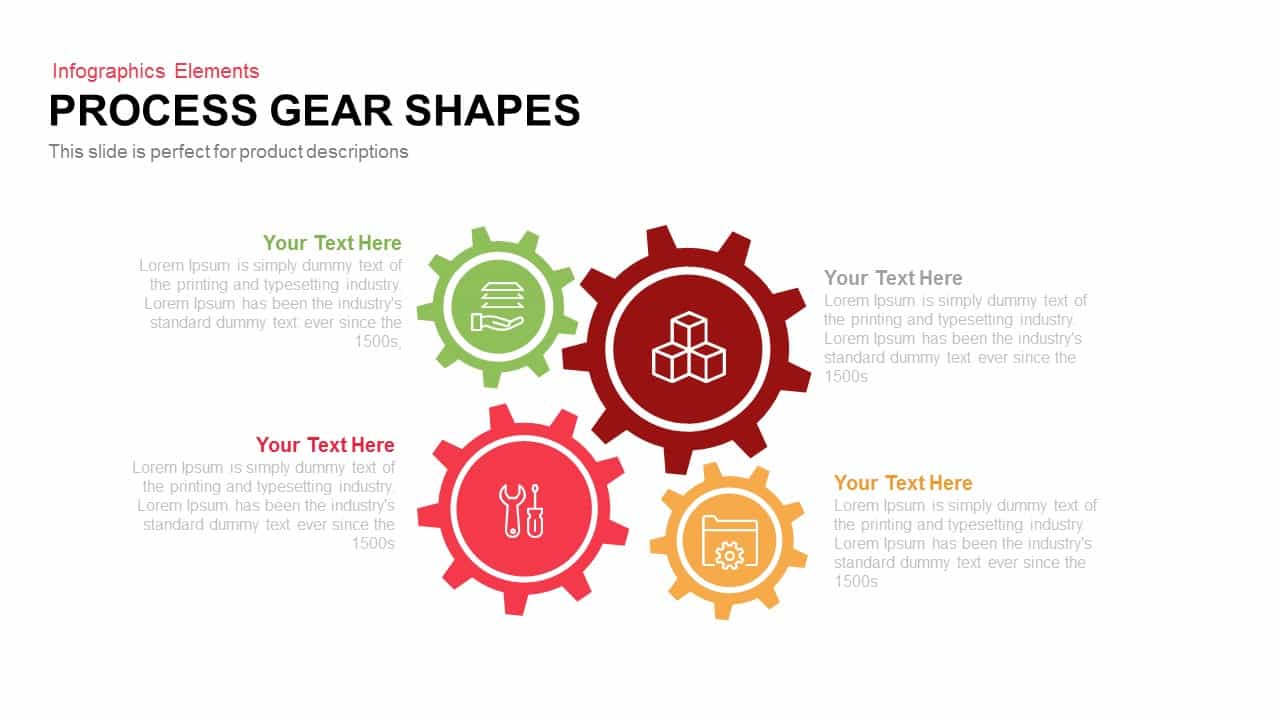
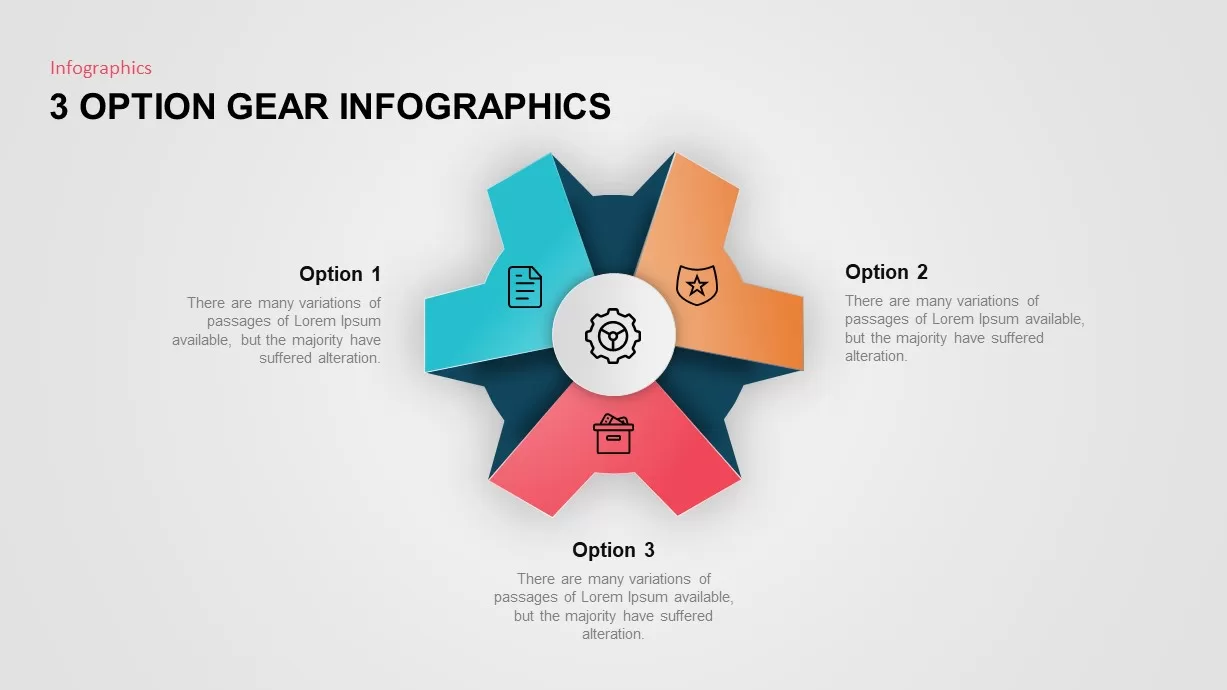
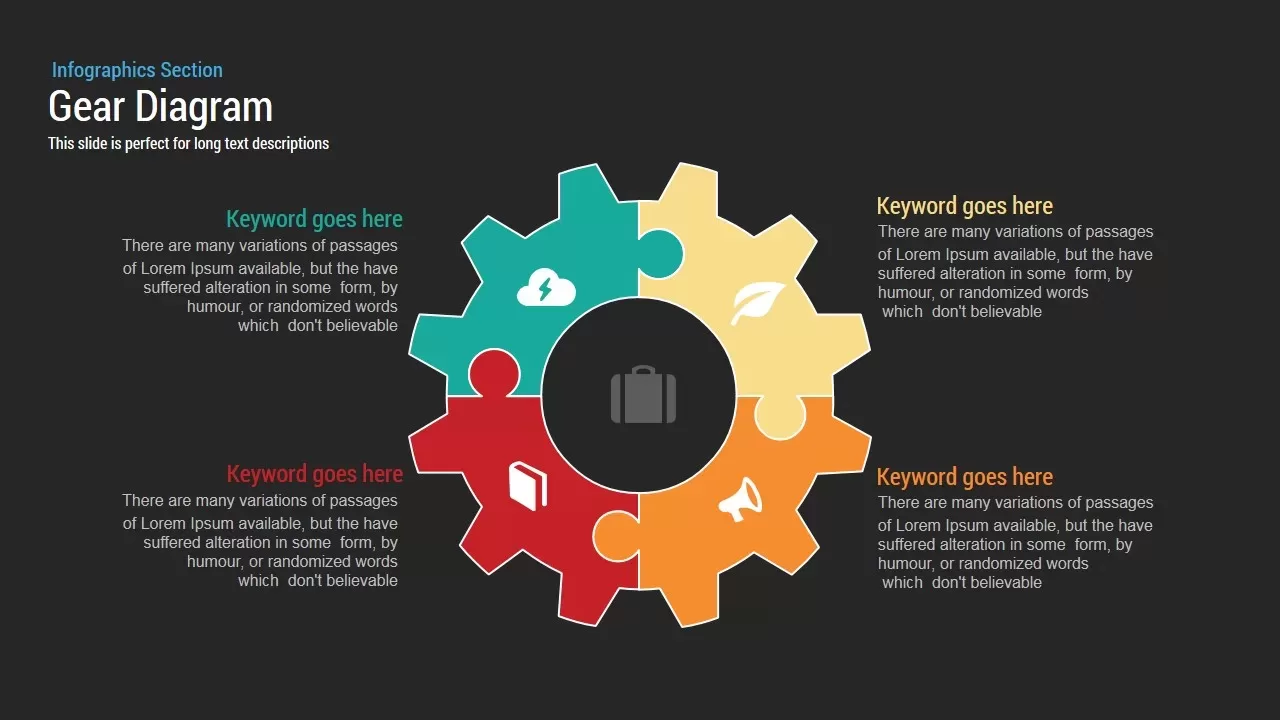
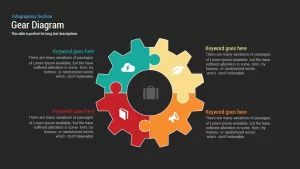
This Gear Diagram template slide presents a dynamic circular infographic in the form of an isometric gear comprised of five interlocking segments, each rendered in vibrant hues and bearing a vector icon placeholder for custom symbols. The central hub accommodates a key motif or core value, while each gear tooth features a clear text placeholder at its midpoint. Dotted connector lines extend from individual segments to adjacent callout areas, providing space for concise descriptions of processes, categories, or metrics. Subtle gradient shading and soft drop shadows enhance depth and visual interest without overwhelming the flat-design aesthetic.
Built on master slide layouts for both PowerPoint and Google Slides, the template seamlessly supports widescreen (16:9) and standard (4:3) aspect ratios. All components are fully customizable—drag-and-drop your own icons, recolor segments to match brand guidelines, adjust segment order, or resize the entire diagram without any loss of resolution. Intuitive grouping of vector shapes and predefined placeholders streamlines editing, allowing even non-designers to produce professional, polished slides in minutes.
Whether you are illustrating multistage workflows, department functions, cyclical processes, or strategic roadmaps, this gear diagram accelerates slide creation by eliminating manual alignment and formatting tasks. The balanced color palette directs audience focus toward key insights, while the central icon hub underscores your core message. Perfect for boardroom presentations, marketing reviews, operational briefs, and client pitches, this versatile template empowers presenters to communicate complex information with clarity and impact. Use the modular segments to highlight milestones, resource allocations, or dependencies in any industry context. Pre-built animations and theme variants further enhance storytelling and consistency across your deck, making this gear diagram a must-have tool for any high-stakes presentation.
Who is it for
Marketing teams, project managers, operations leads, business analysts, and strategy consultants will benefit from this template when visualizing cyclical processes, functional breakdowns, or multistage workflows in stakeholder presentations and executive briefings.
Other Uses
Repurpose this layout to map lifecycle stages, feature release cycles, support escalations, risk assessment phases, or any scenario where a clear, segmented cycle enhances audience engagement.
Login to download this file

Item ID
SB00034
Related Templates

Gear Process Diagram PowerPoint Template for PowerPoint & Google Slides
Process
Gear Process Diagram template for PowerPoint & Google Slides
Process
Professional 3D Gear Process Diagram Template for PowerPoint & Google Slides
Process
Gear Process Phase Diagram template for PowerPoint & Google Slides
Process

Five-Step Gear Process Diagram Template for PowerPoint & Google Slides
Process
Four Gear Section Diagram Template for PowerPoint & Google Slides
Circular

4 Step Gear Diagram Template for PowerPoint & Google Slides
Process

Dynamic 4 Gear Process Diagram Template for PowerPoint & Google Slides
Process
Colorful Modern CRM Gear Diagram Template for PowerPoint & Google Slides
Customer Experience
Gear Pie Diagram Data Visualization Template for PowerPoint & Google Slides
Pie/Donut
Six-Staged Gear Diagram Framework Template for PowerPoint & Google Slides
Process
Gear Flow Diagram template for PowerPoint & Google Slides
Process

Modern Four Stage Gear Diagram Template for PowerPoint & Google Slides
Process
Artificial Intelligence Gear Diagram Template for PowerPoint & Google Slides
Process
Marketing Risk Management Gear Diagram Template for PowerPoint & Google Slides
Risk Management
SWOT Analysis Gear Diagram Slide Template for PowerPoint & Google Slides
SWOT
Supply Chain Process Gear Diagram Template for PowerPoint & Google Slides
Process
Six Sigma Gear Process Diagram Template for PowerPoint & Google Slides
Process
Six-Stage Gear Wheel Diagram Template for PowerPoint & Google Slides
Circular
Four-Stage Gear Process Diagram Template for PowerPoint & Google Slides
Process
5-Stage Gear Process Flow Diagram Template for PowerPoint & Google Slides
Process
Sales Process Improvement Gear Diagram Template for PowerPoint & Google Slides
Process
8-Step Circular Gear Infographic Diagram Template for PowerPoint & Google Slides
Circular
Eight-Stage Gear Diagram Process Template for PowerPoint & Google Slides
Process
Modern Gear Venn Diagram Infographic Template for PowerPoint & Google Slides
Comparison
6-Part Circular Gear Infographic Diagram Template for PowerPoint & Google Slides
Process

Three-Step Triangular Gear Diagram Template for PowerPoint & Google Slides
Process
Dynamic Gear Diagram Infographics Template for PowerPoint & Google Slides
Process
Six-Option Gear Diagram Slide Template for PowerPoint & Google Slides
Circular
Gear Process Diagram Template for PowerPoint & Google Slides
Process
Gear Process Diagram Template for PowerPoint & Google Slides
Process
Cloud Gear Automation Diagram Template for PowerPoint & Google Slides
Cloud Computing
Gear Process Diagram for PowerPoint & Google Slides
Process
8-Step Circular Gear Infographics Diagram for PowerPoint & Google Slides
Process
Gear Slides for PowerPoint & Google Slides
Infographics
Free Gear Infographics template for PowerPoint & Google Slides
Process
Free
Process Gear Shapes Template for PowerPoint & Google Slides
Infographics
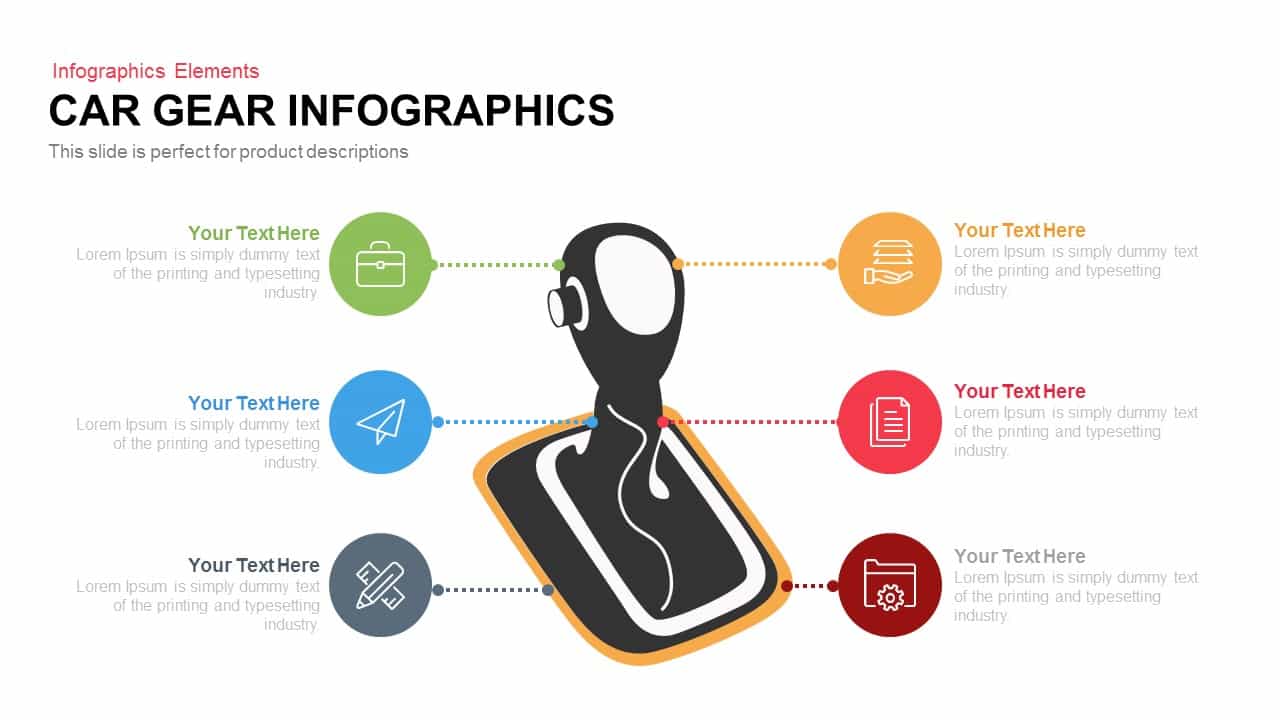
Car Gear Infographics Template for PowerPoint & Google Slides
Infographics
Brain Gear Hub-and-Spoke Infographics template for PowerPoint & Google Slides
Org Chart

Strategy Arrow and Gear Icons Template for PowerPoint & Google Slides
Infographics
Support Services Gear Infographic Template for PowerPoint & Google Slides
Business
Corporate Mission Statement Gear Slide Template for PowerPoint & Google Slides
Vision and Mission
Three-Option Gear Infographic Pro Template for PowerPoint & Google Slides
Process
Three-Phase Planning Gear Infographic Template for PowerPoint & Google Slides
Process
3, 4, and 5 Step Gear Infographics Template for PowerPoint & Google Slides
Process
Animated Gear Slide for Process Mapping Template for PowerPoint & Google Slides
Process
Animated Multi-Gear Cluster Infographic Template for PowerPoint & Google Slides
Process
Dynamic Four-Step Gear Process Template for PowerPoint & Google Slides
Process
Six Colorful Gear Shapes Infographic Template for PowerPoint & Google Slides
Process
Free
Snake Diagram Pack of 8 Slides template for PowerPoint & Google Slides
Process
Sales Process Workflow Funnel Diagram PowerPoint Template for PowerPoint & Google Slides
Funnel
Puzzle Diagram PowerPoint Template for PowerPoint & Google Slides
Process
Transportation Logistics PowerPoint Diagram template for PowerPoint & Google Slides
Process
Emoji Scale PowerPoint Diagram for PowerPoint & Google Slides
Infographics
4 Step Problem Solving PowerPoint Diagram for PowerPoint & Google Slides
Process
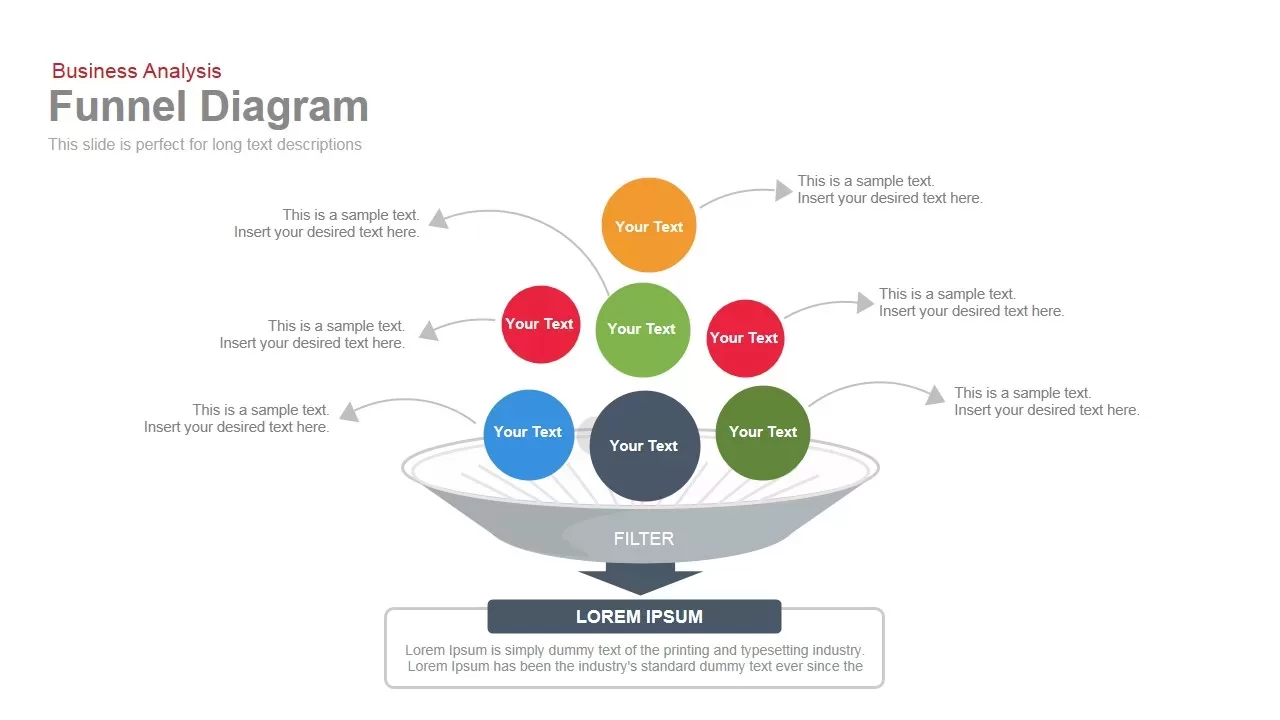
Business Funnel Diagram template for PowerPoint & Google Slides
Funnel
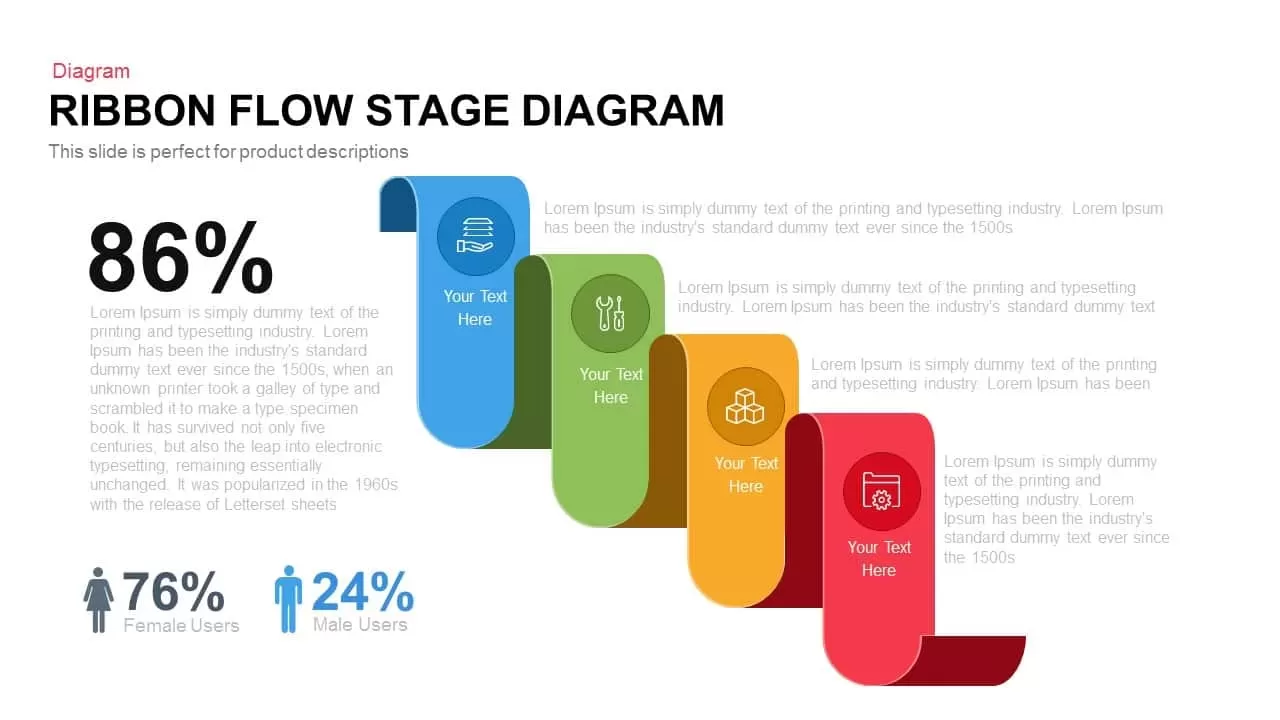
Ribbon Flow Diagram template for PowerPoint & Google Slides
Process
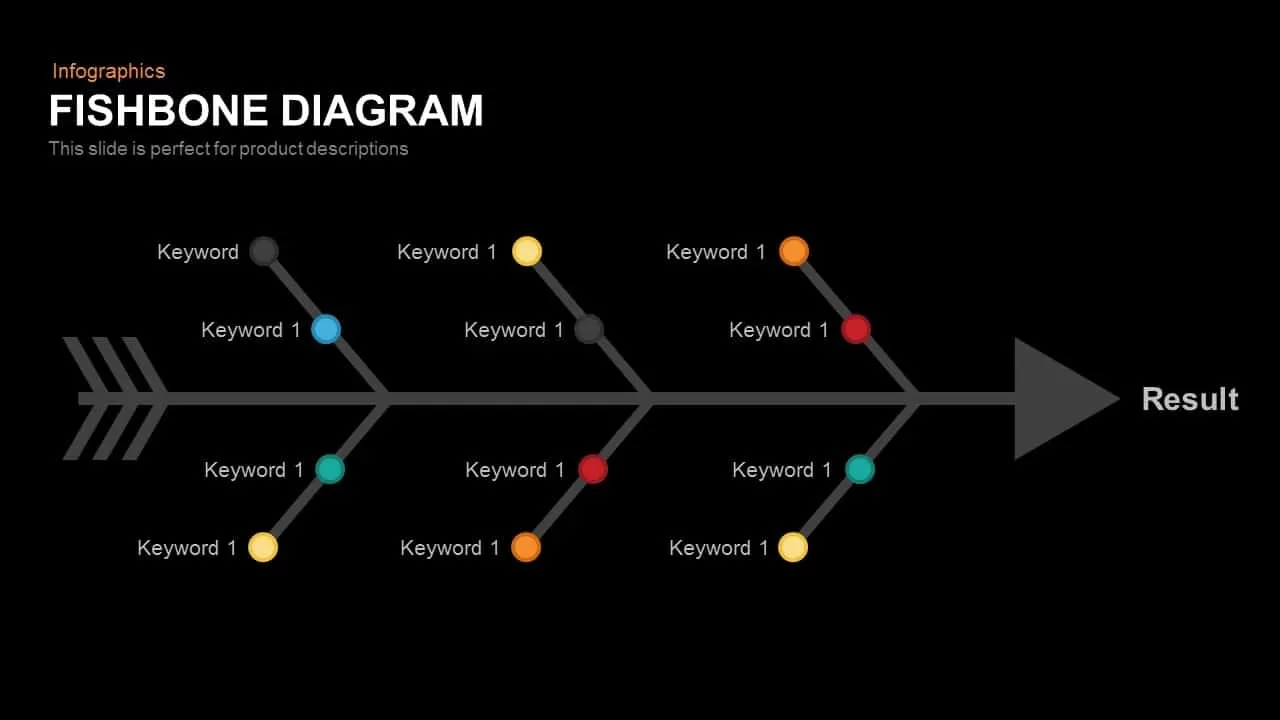
Fishbone RCA Diagram Template for PowerPoint & Google Slides
Business Strategy
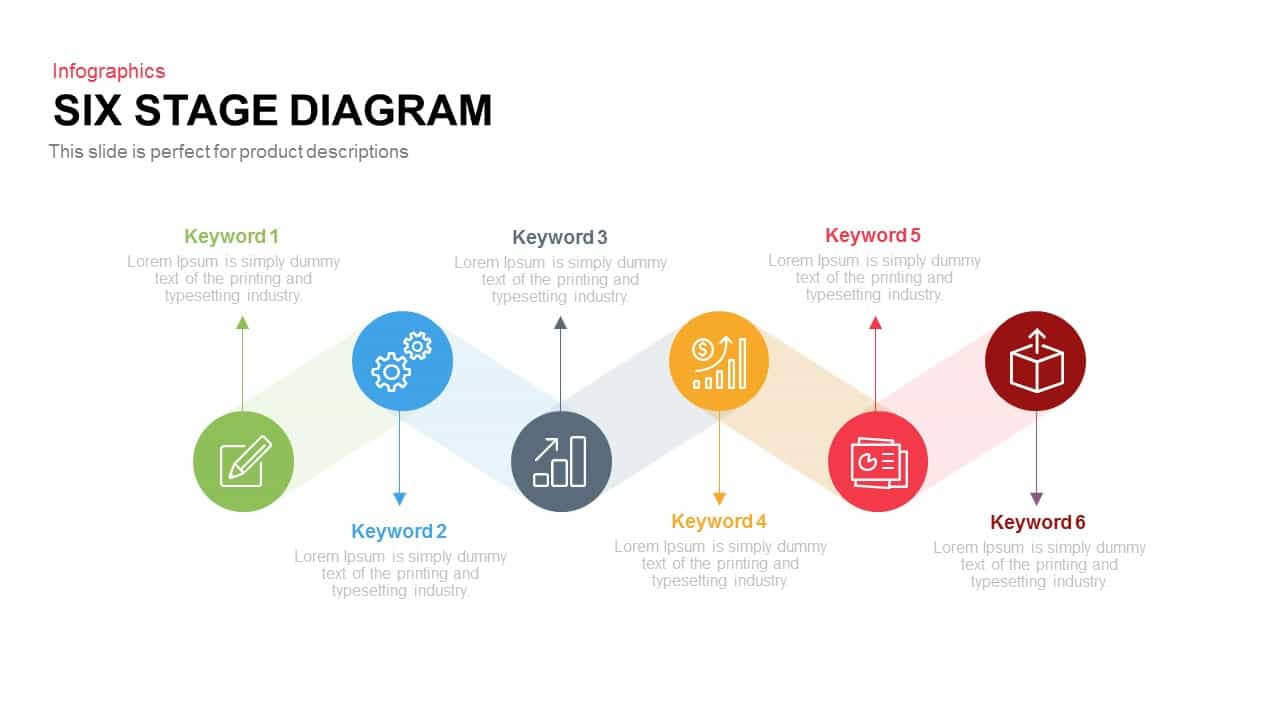
Six Stage Zigzag Process Diagram Template for PowerPoint & Google Slides
Process
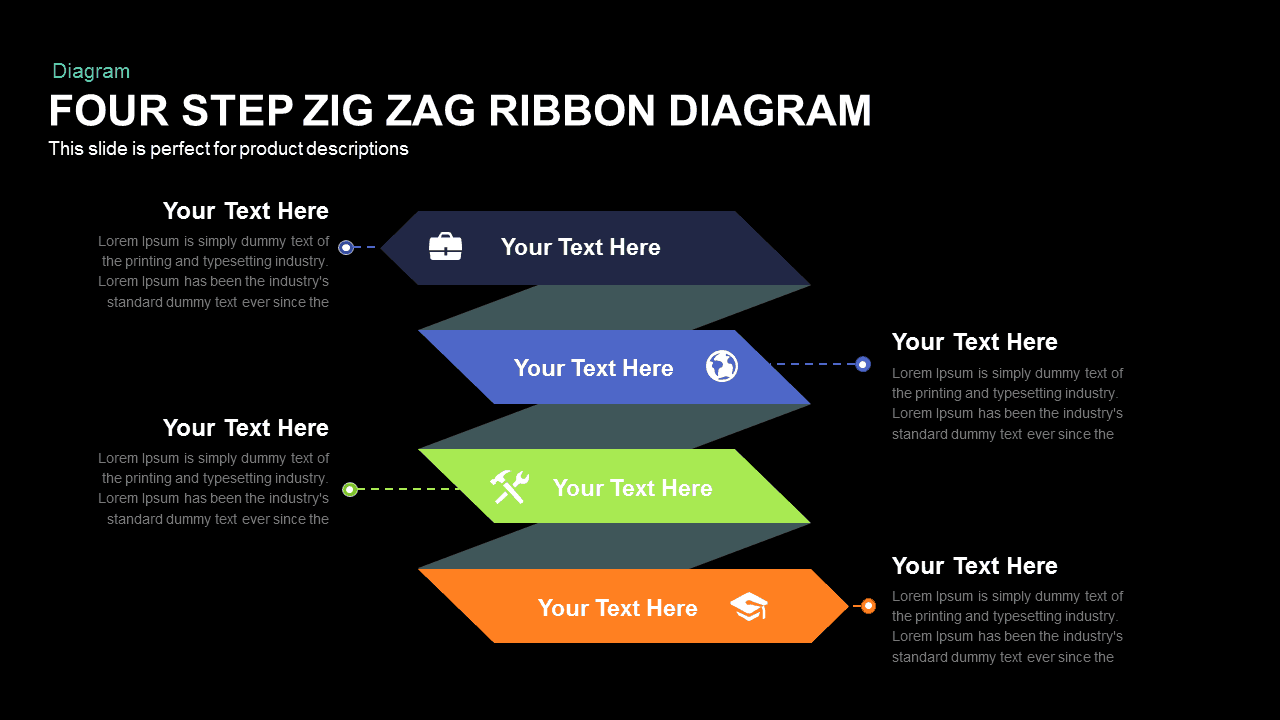
Four-Step Zigzag Ribbon Diagram template for PowerPoint & Google Slides
Arrow
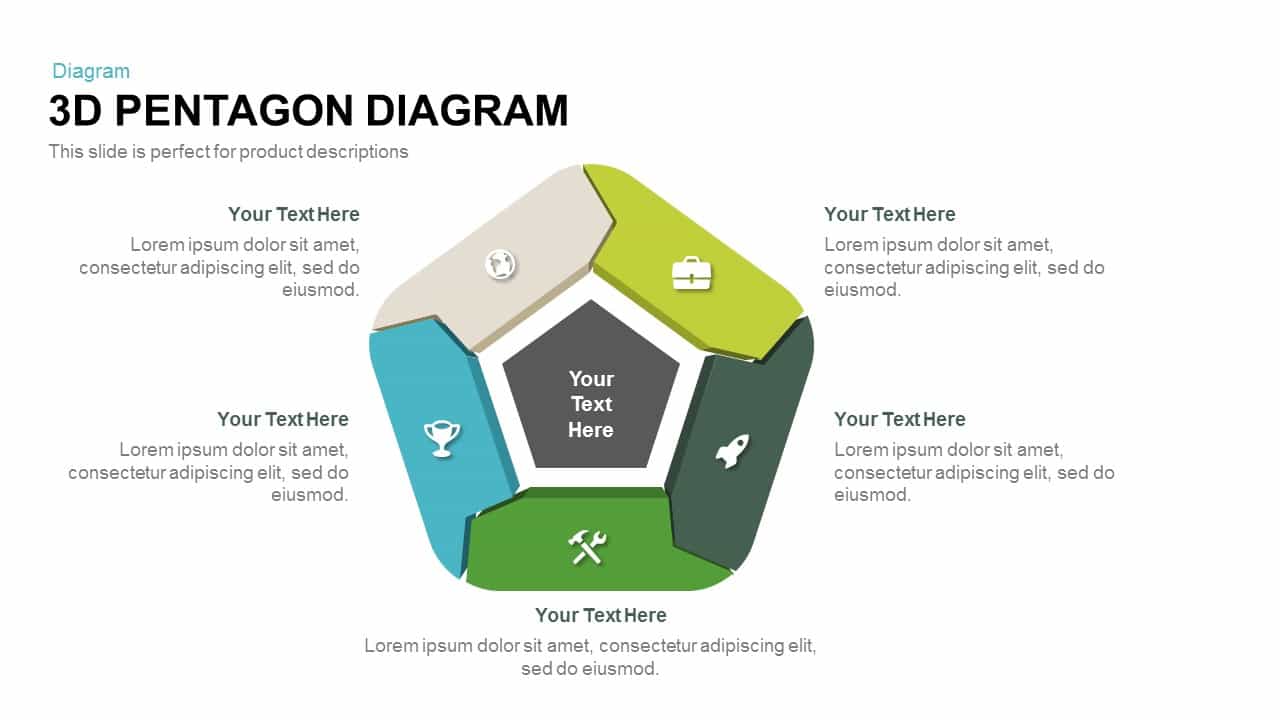
3D Pentagon Diagram template for PowerPoint & Google Slides
Process
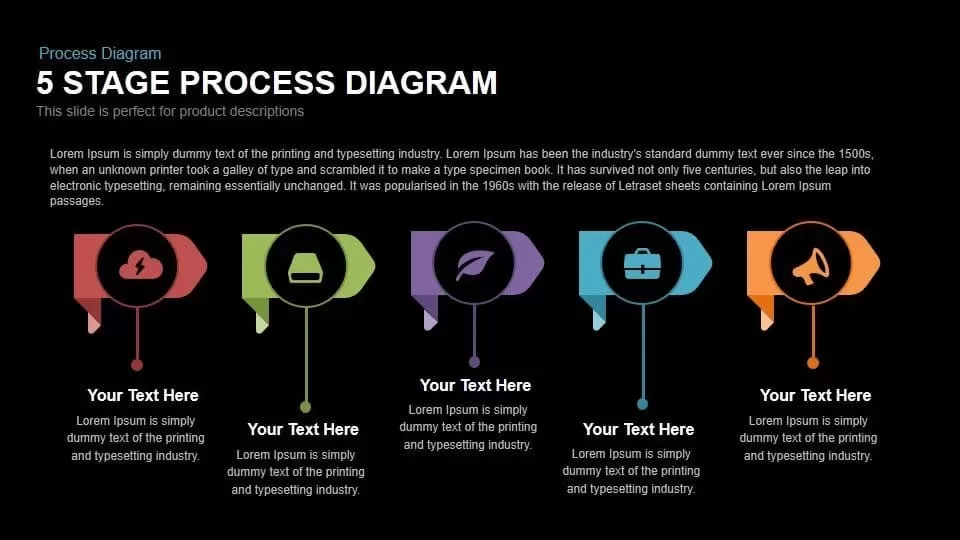
5 Stage Process Diagram Slide Overview Template for PowerPoint & Google Slides
Process
Four Directional Arrow Diagram Template for PowerPoint & Google Slides
Arrow
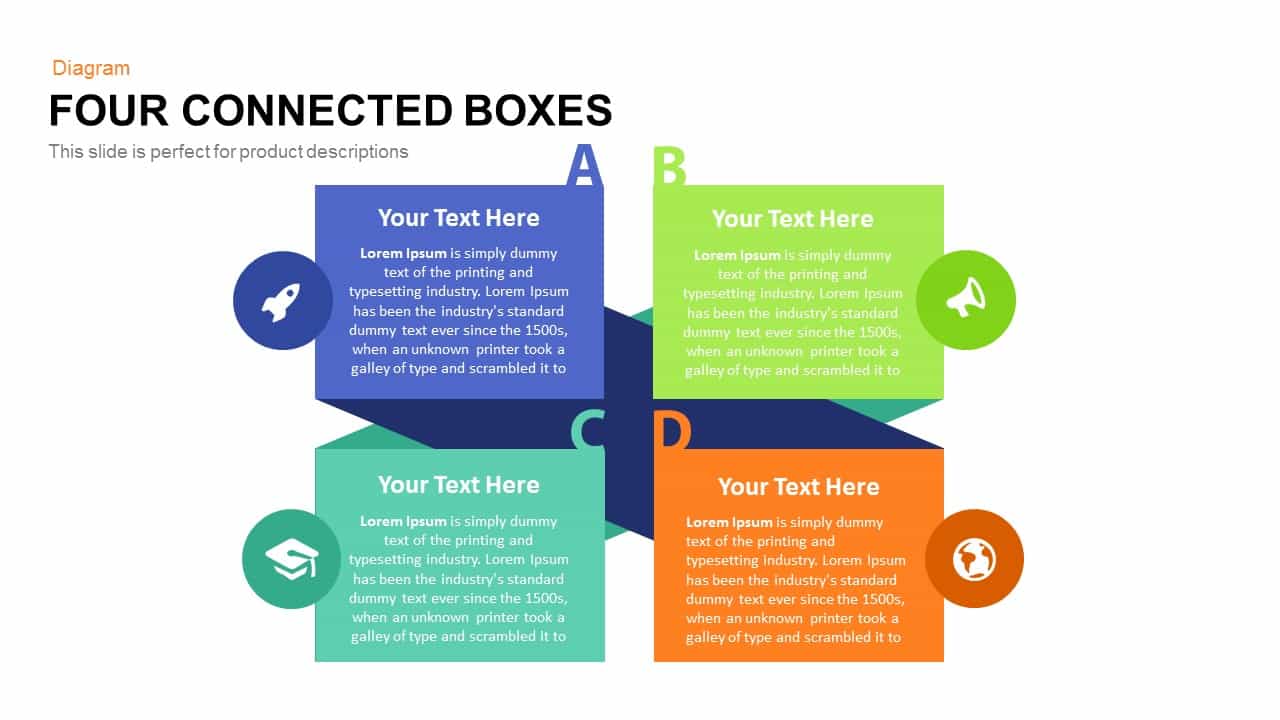
Simple Four Connected Boxes Diagram Template for PowerPoint & Google Slides
Business Models
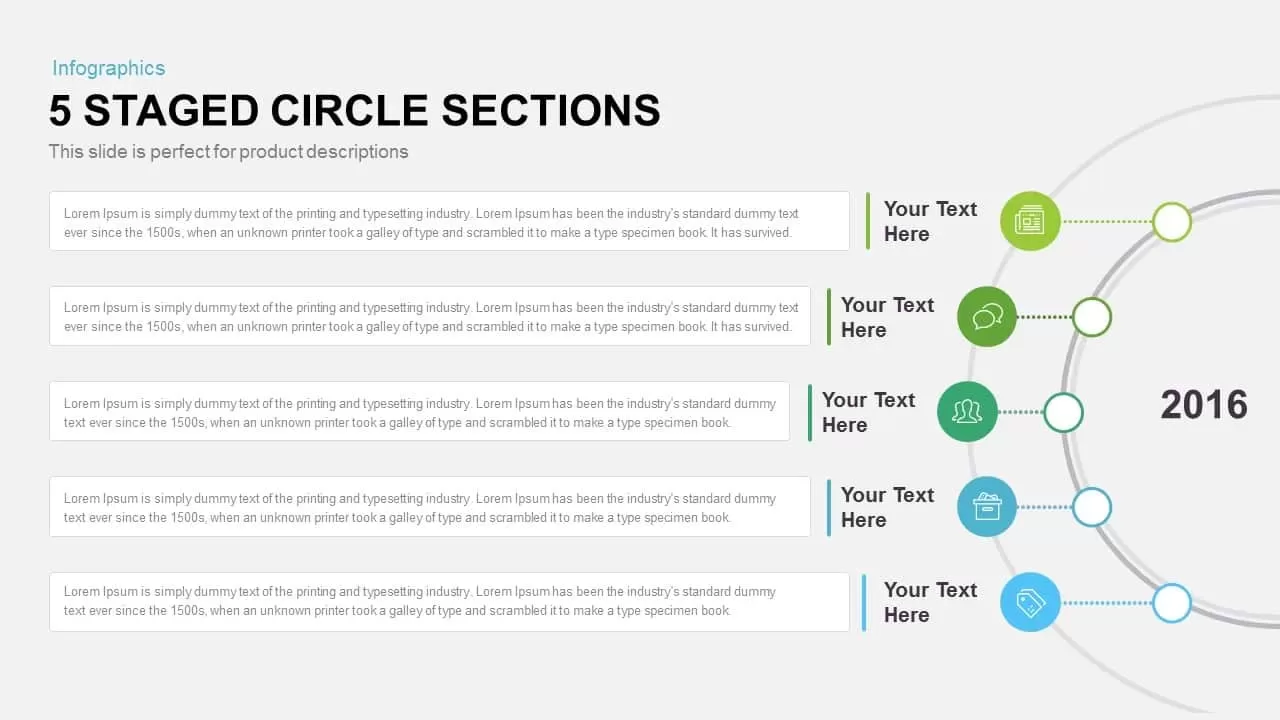
Five-Staged Circle Sections Diagram Template for PowerPoint & Google Slides
Circular
8-Step Circular Arrow Diagram Template for PowerPoint & Google Slides
Arrow
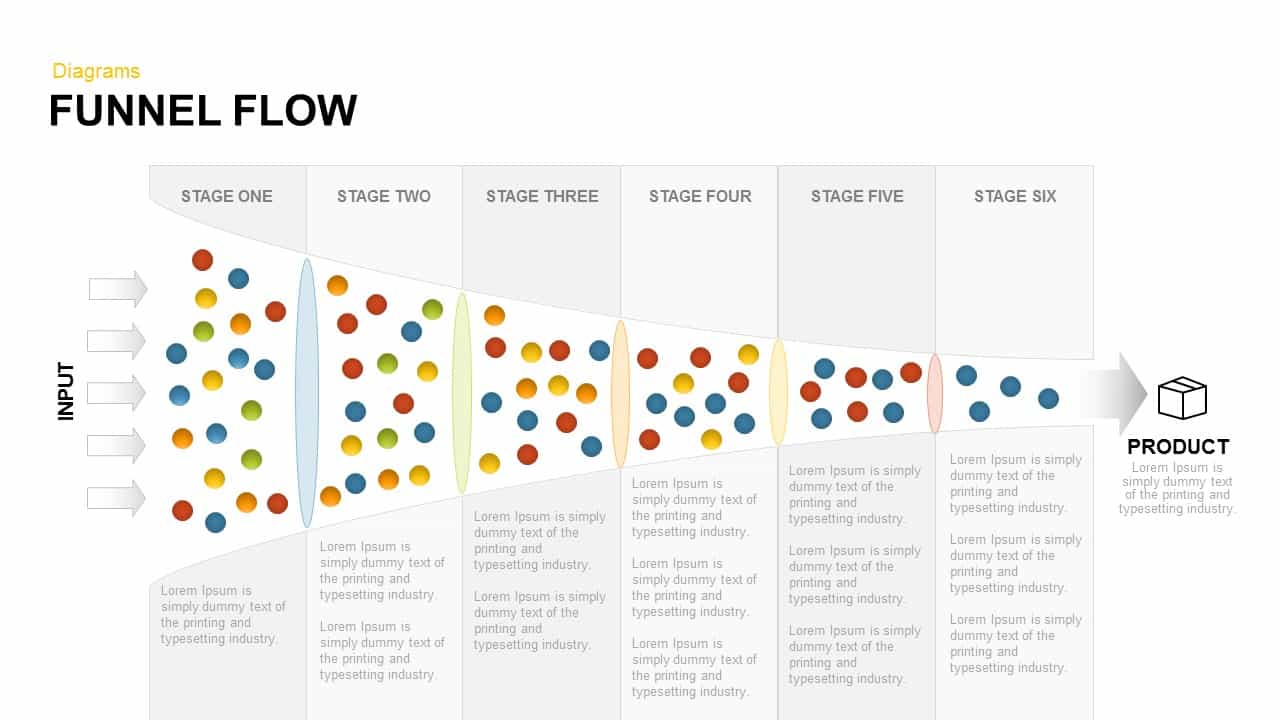
Funnel Flow Diagram template for PowerPoint & Google Slides
Funnel
Six-Step Two-Sided Arrow Diagram Template for PowerPoint & Google Slides
Process
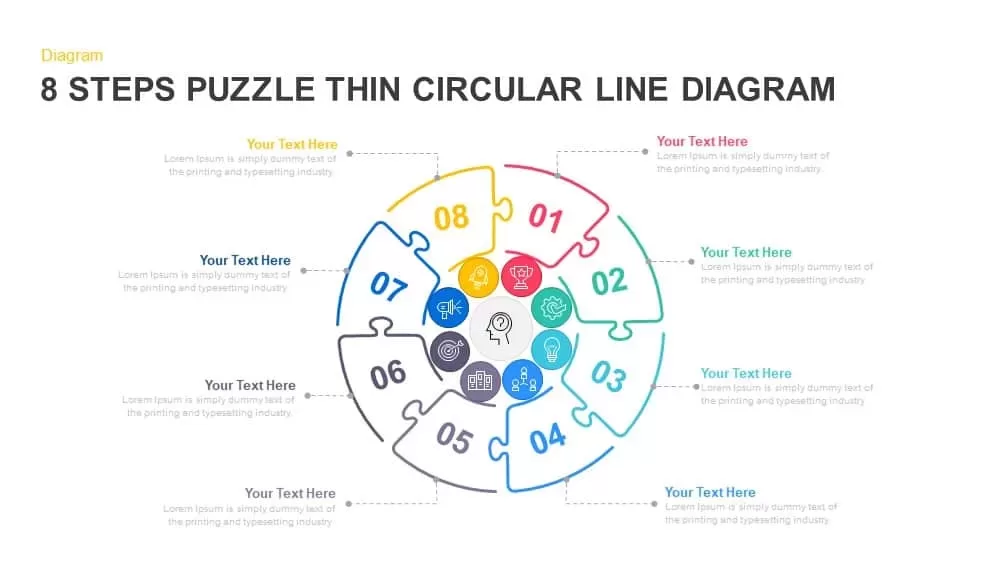
8-Step Puzzle Circular Diagram Template for PowerPoint & Google Slides
Circular
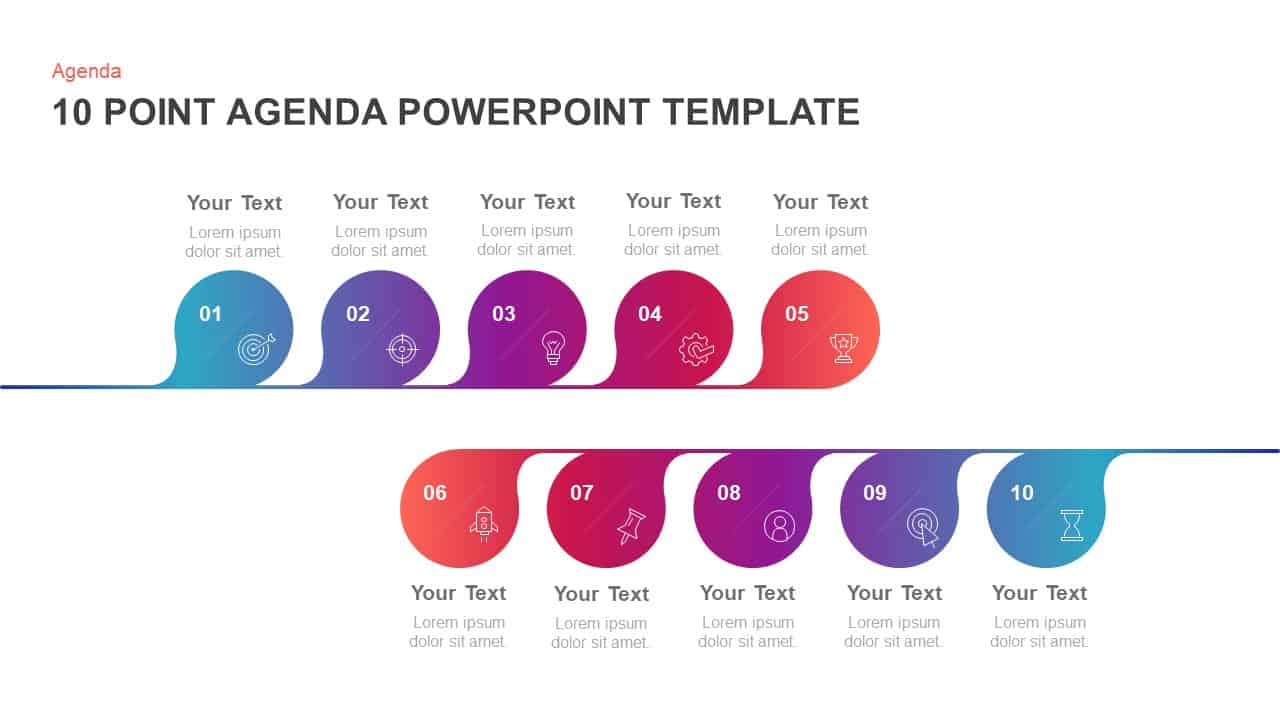
10-Point Gradient Agenda Flow Diagram Template for PowerPoint & Google Slides
Agenda
Four-Quadrant SWOT Analysis Diagram Template for PowerPoint & Google Slides
SWOT
Six-Stage Clockwise Circular Diagram Template for PowerPoint & Google Slides
Circular
Circular Three-Step Infographic Diagram Template for PowerPoint & Google Slides
Circular
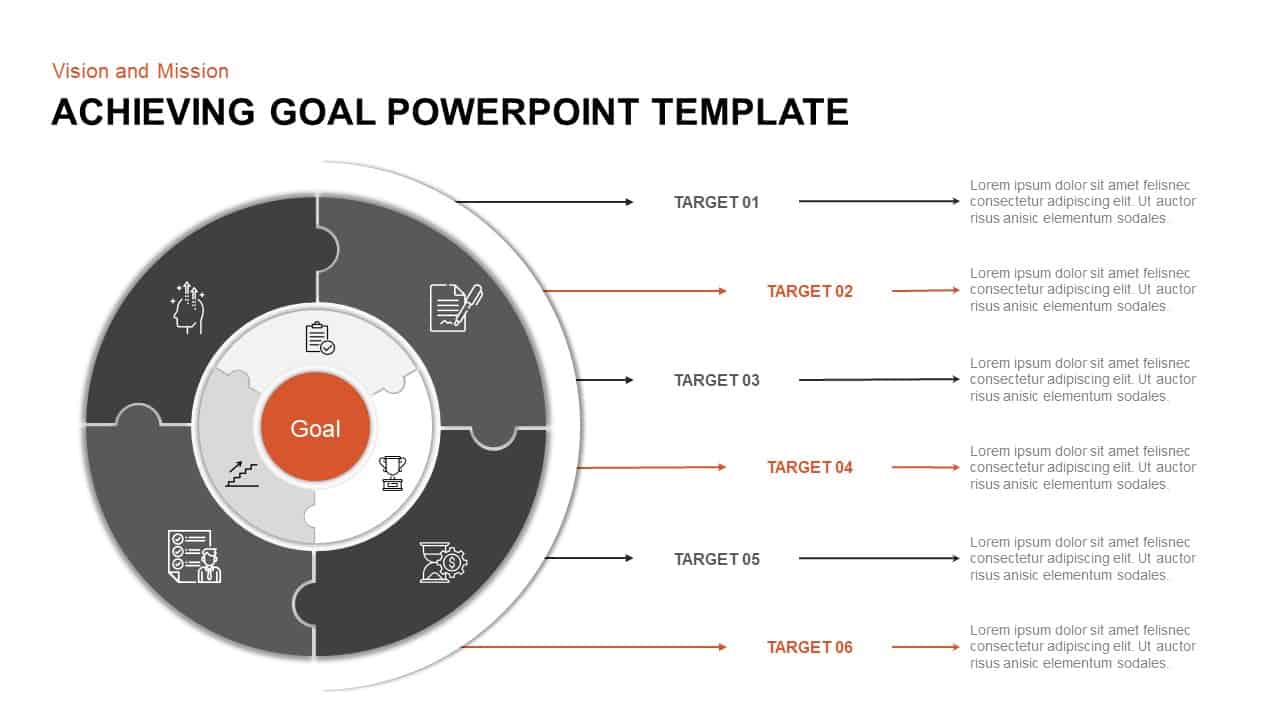
Puzzle Diagram for Goal Achievement Template for PowerPoint & Google Slides
Circular
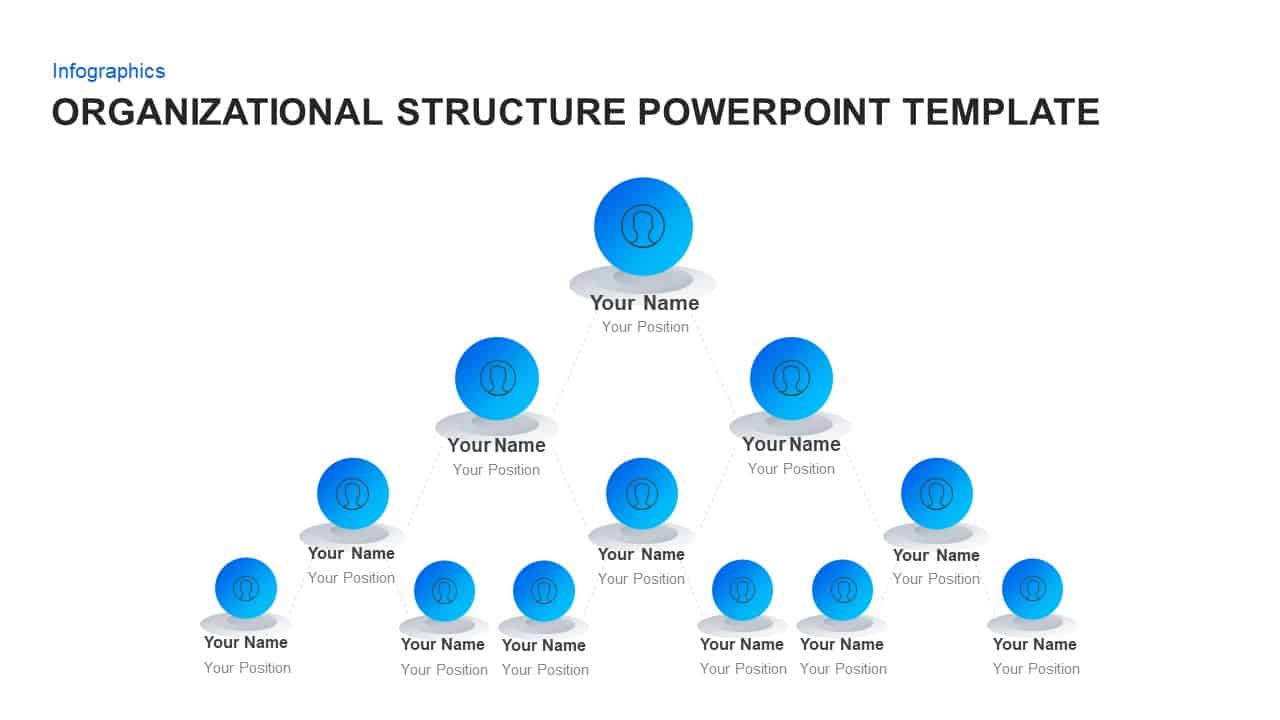
Organizational Structure Diagram Template for PowerPoint & Google Slides
Org Chart
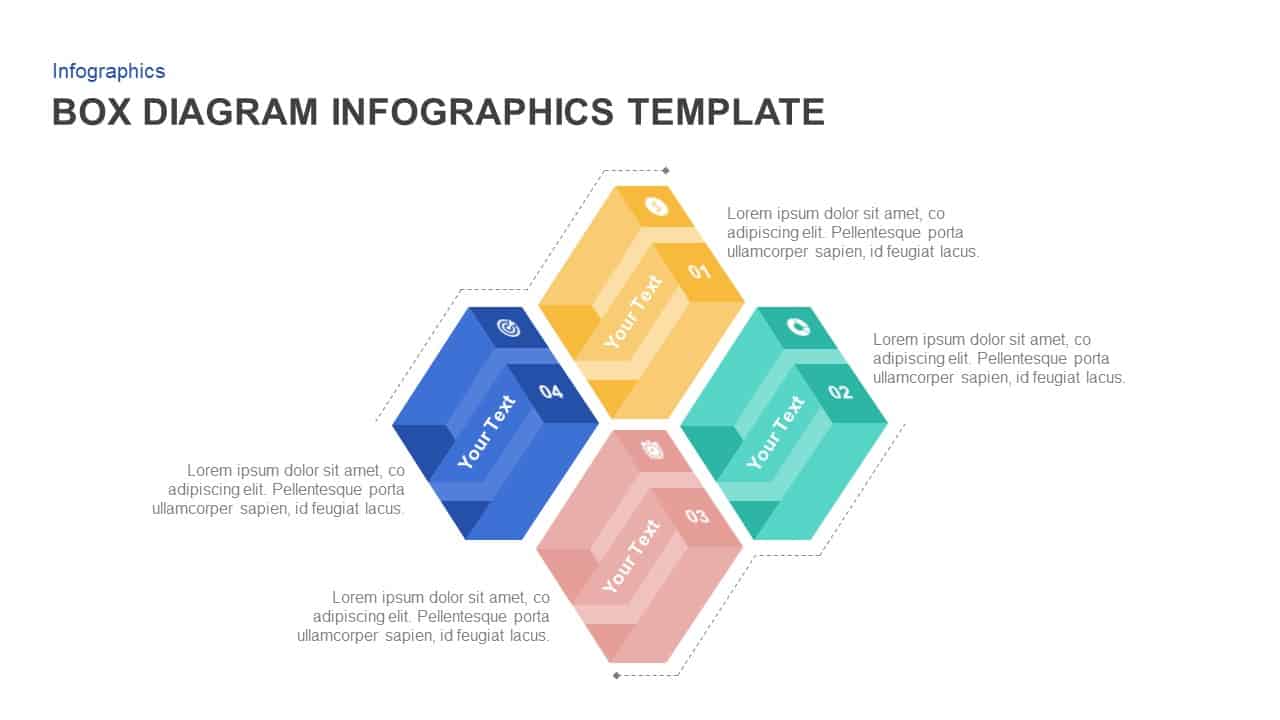
Box Diagram Infographics template for PowerPoint & Google Slides
Business
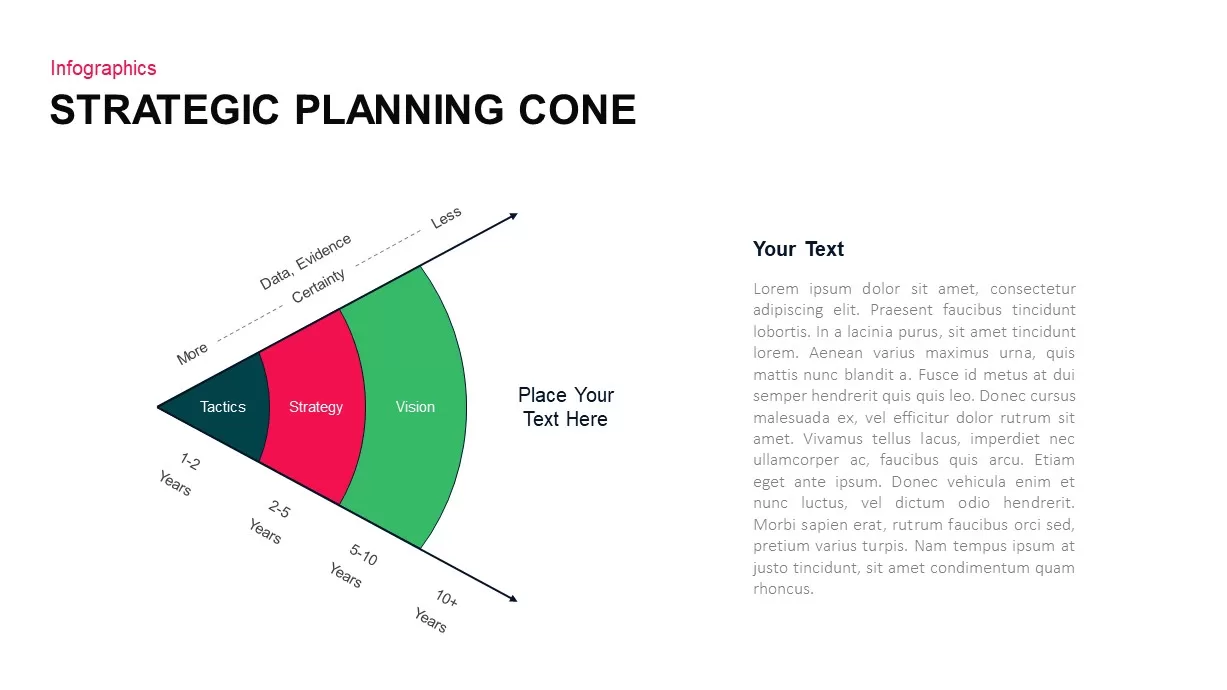
3-Part Strategic Planning Cone Diagram Template for PowerPoint & Google Slides
Process
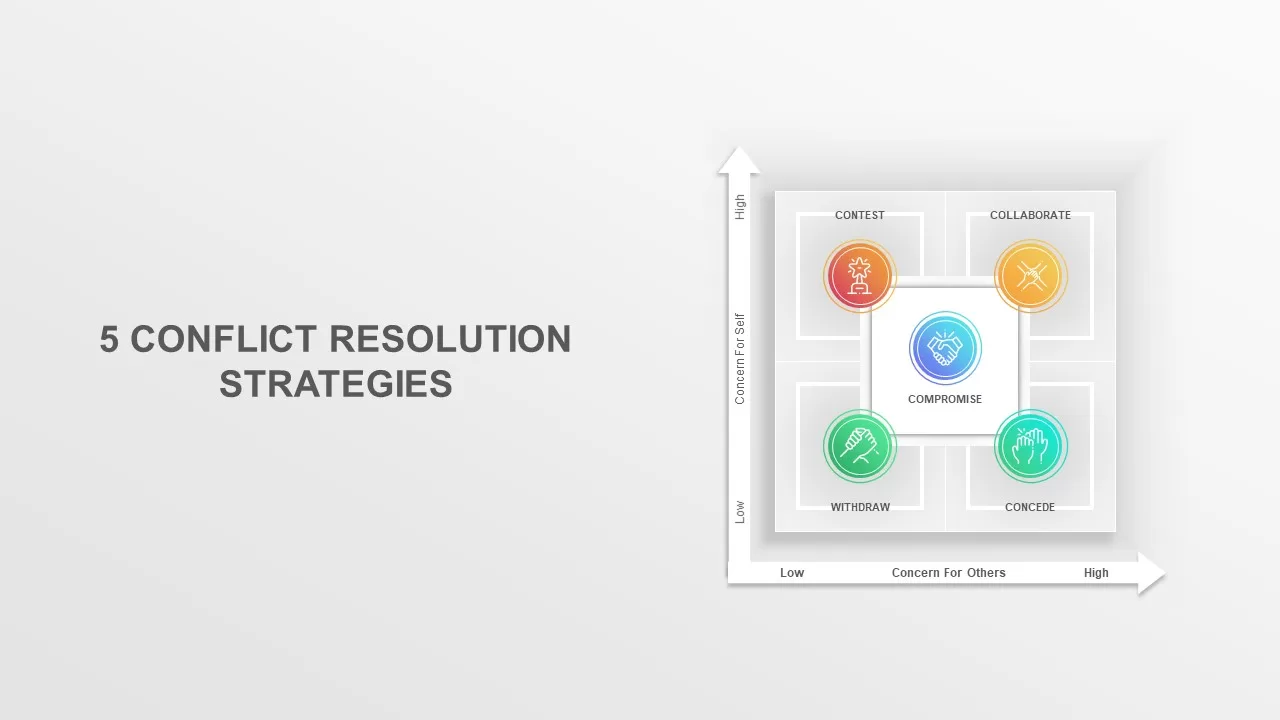
Conflict Resolution Strategies Diagram Template for PowerPoint & Google Slides
Infographics
Underwater Fishbone Cause-Effect Diagram Template for PowerPoint & Google Slides
Process
Circular Arrow Process Diagram Template for PowerPoint & Google Slides
Circular
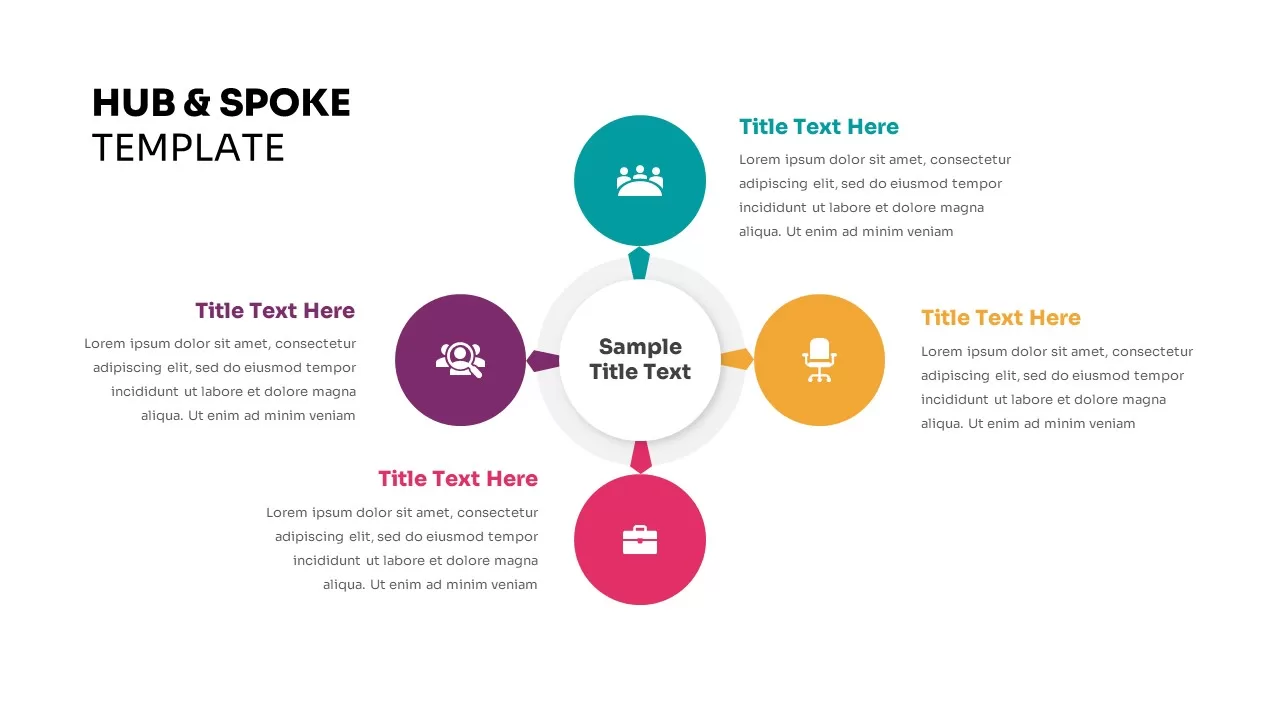
Four-Point Hub and Spoke Diagram Template for PowerPoint & Google Slides
Business Strategy
Incentive Theory of Motivation Diagram Template for PowerPoint & Google Slides
Employee Performance
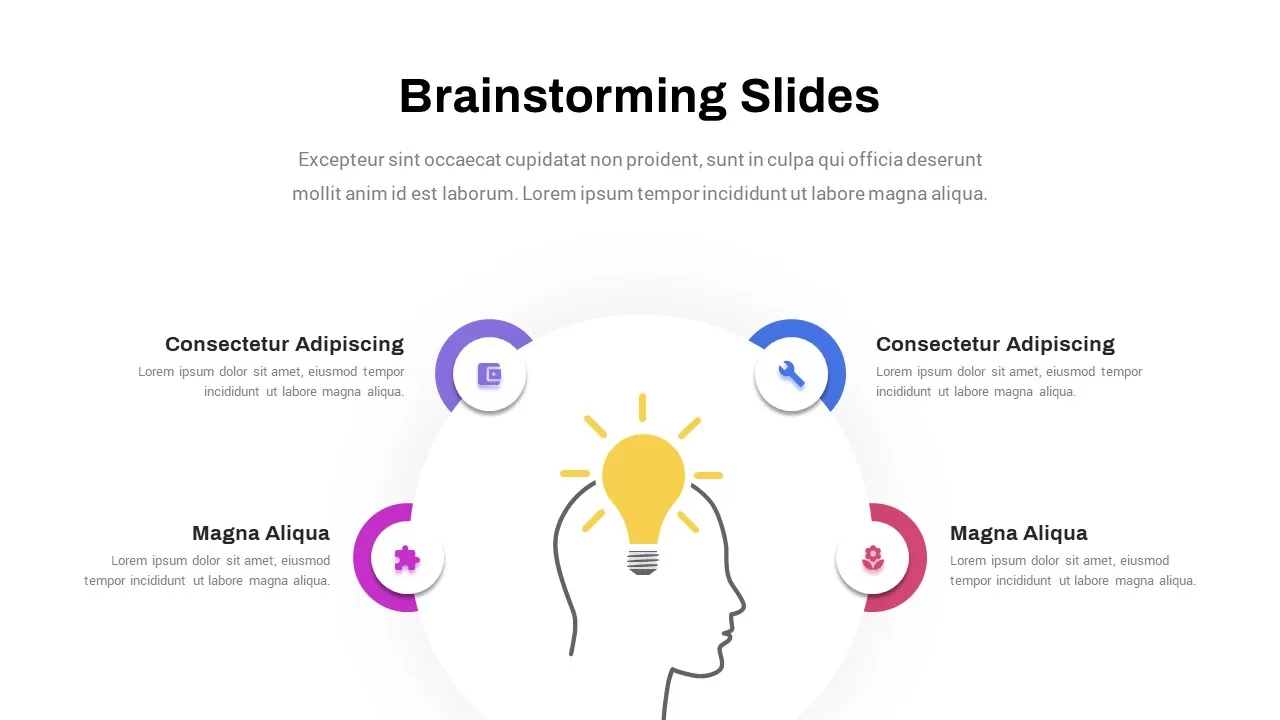
Creative Brainstorming Process Diagram Template for PowerPoint & Google Slides
Process
Six-Step Colorful Flywheel Diagram Template for PowerPoint & Google Slides
Circular
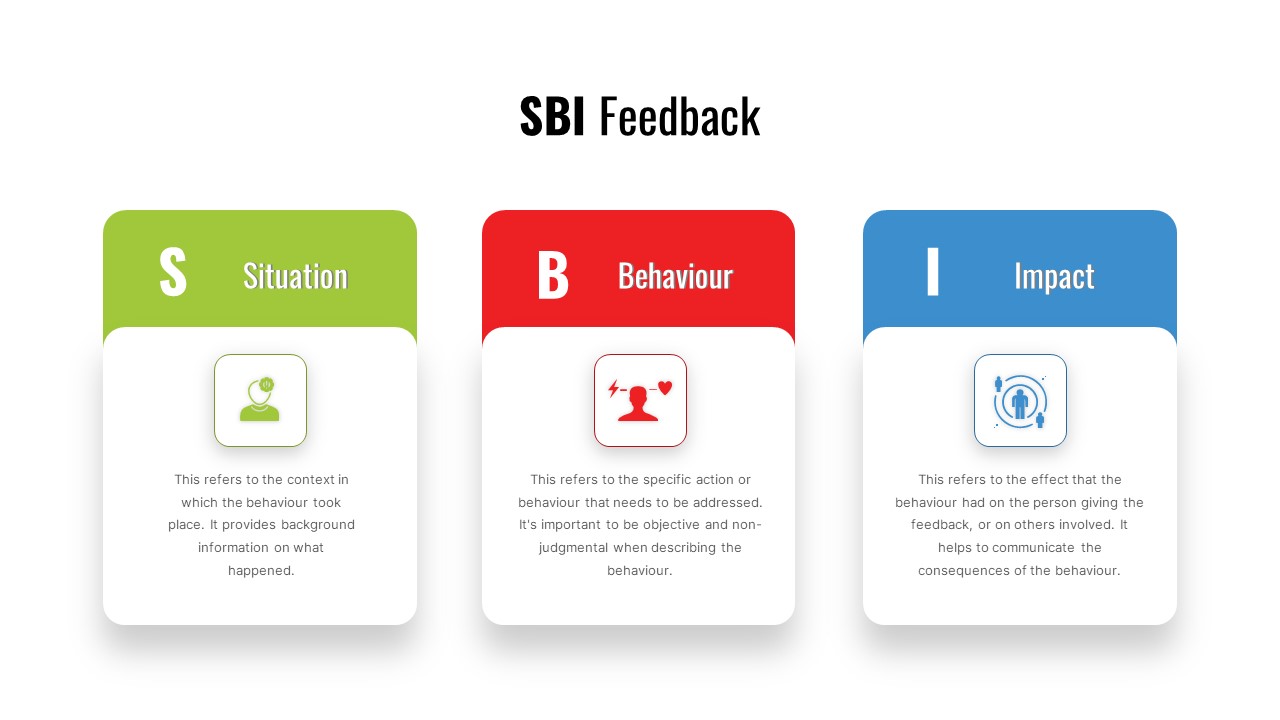
SBI Feedback Model Process Diagram Template for PowerPoint & Google Slides
Process
Simple Flowchart Process Diagram Template for PowerPoint & Google Slides
Flow Charts
Colorful Snake Process Diagram Template for PowerPoint & Google Slides
Process
Split Framework Hexagon Diagram Slide Template for PowerPoint & Google Slides
Process
Cost-Volume-Profit Analysis Diagram Template for PowerPoint & Google Slides
Finance
VTDF Business Model Framework Diagram Template for PowerPoint & Google Slides
Business Models
Linking Business HR Strategy Circular Diagram Template for PowerPoint & Google Slides
Business Strategy
ETL Data Pipeline Workflow Diagram Template for PowerPoint & Google Slides
Process
ML Development Life Cycle Diagram Template for PowerPoint & Google Slides
Machine Learning
Engineering Efficiency Diagram Template for PowerPoint & Google Slides
Process
Free
Integrative Thinking Comparison Diagram Template for PowerPoint & Google Slides
Comparison
Infrastructure as a Service Diagram Template for PowerPoint & Google Slides
Cloud Computing
Cashflow Management Cycle Diagram Template for PowerPoint & Google Slides
Finance
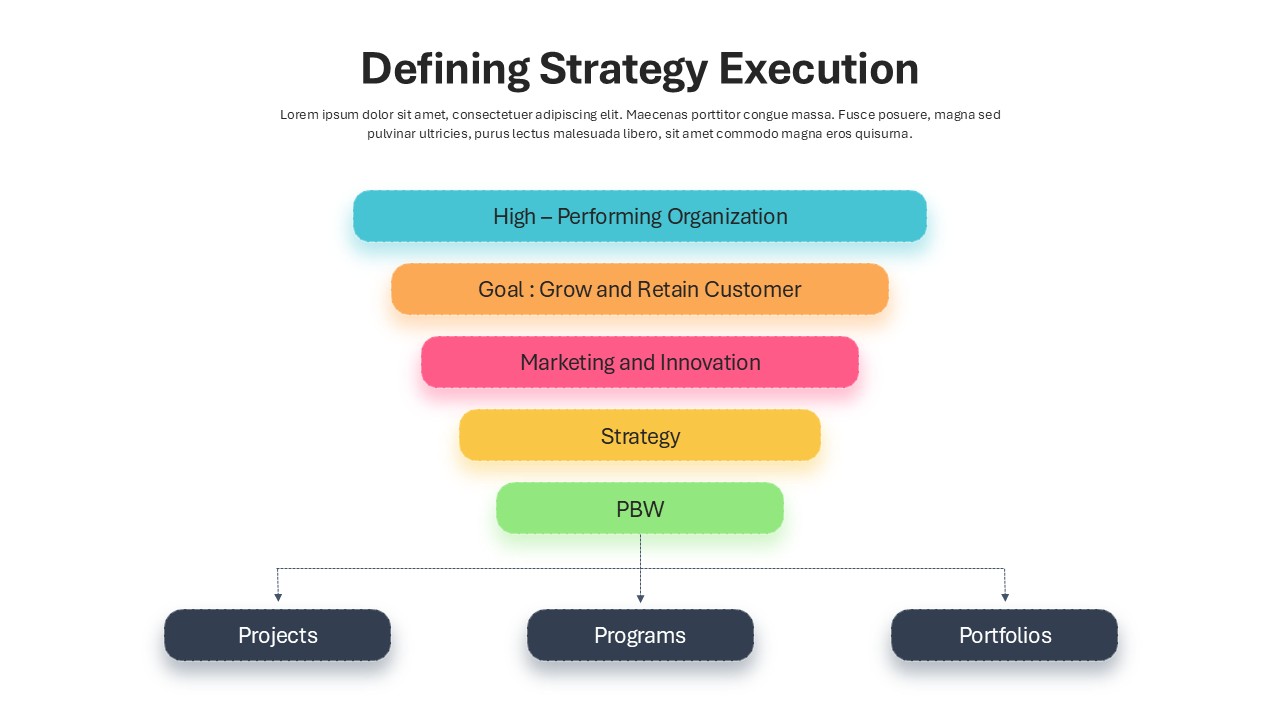
Defining Strategy Execution Diagram Template for PowerPoint & Google Slides
Funnel
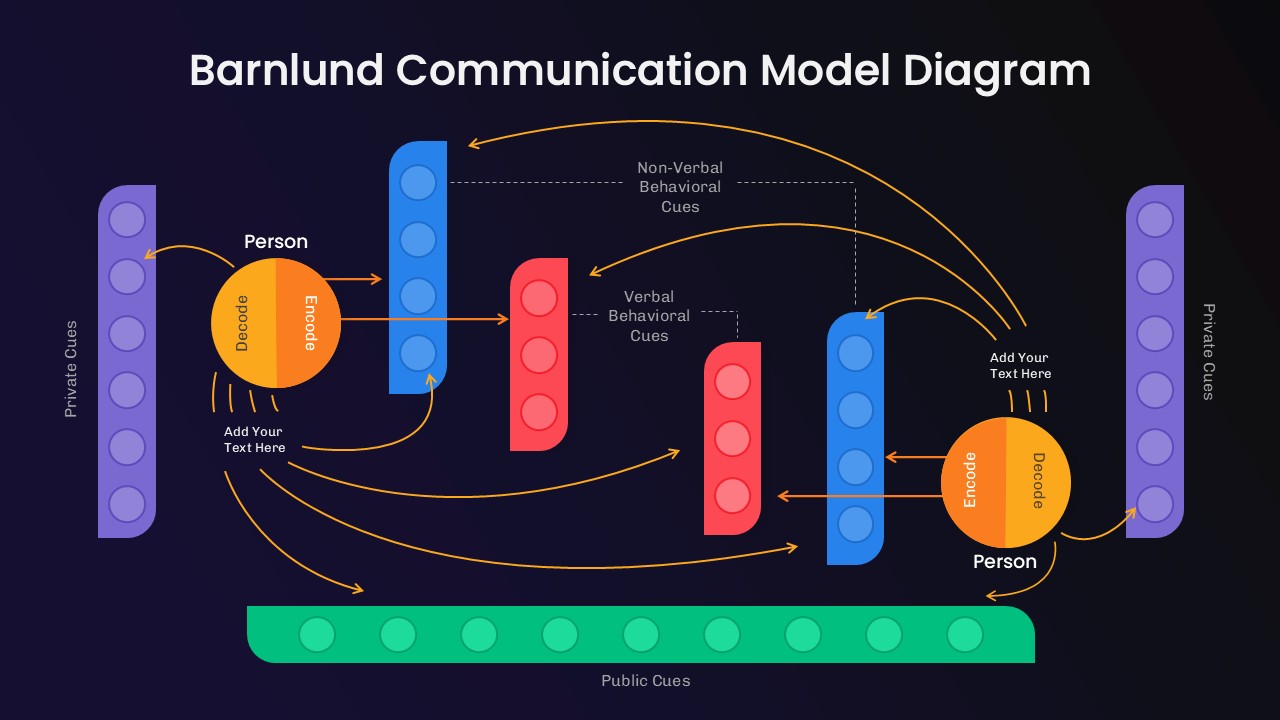
Barnlund Communication Model Diagram Template for PowerPoint & Google Slides
Process
Materiality Assessment Matrix Diagram Template for PowerPoint & Google Slides
Risk Management