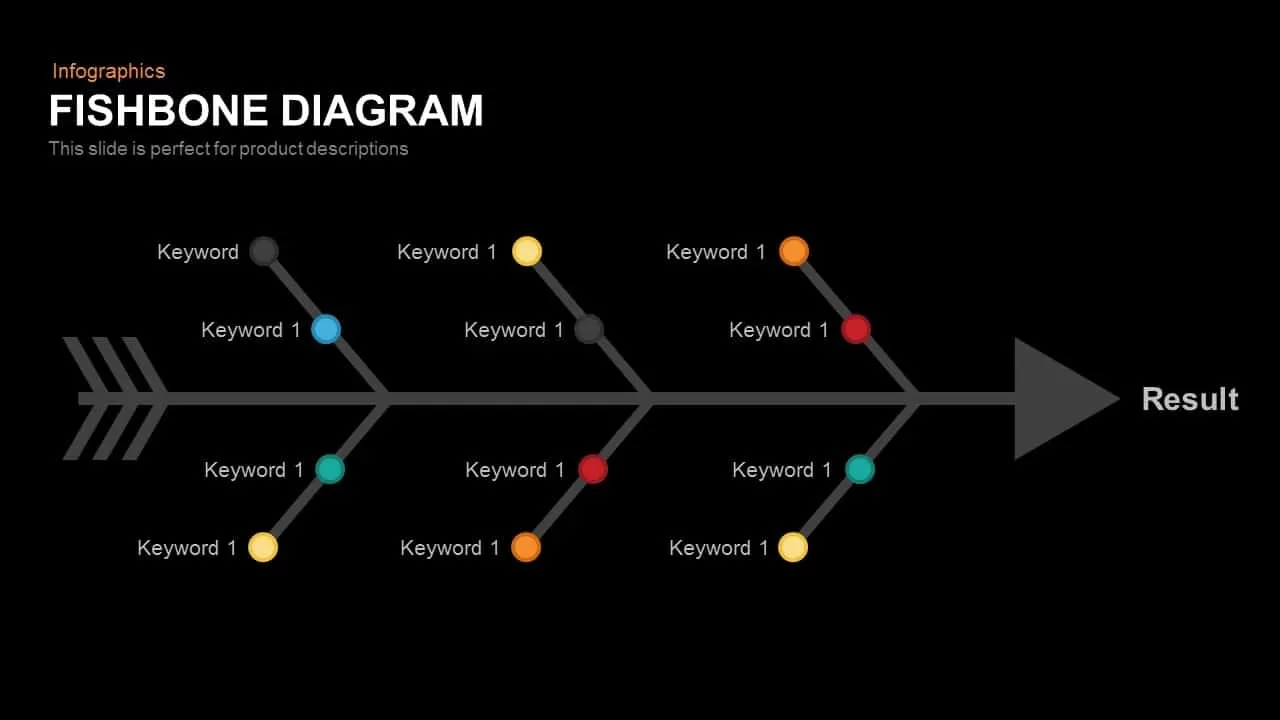
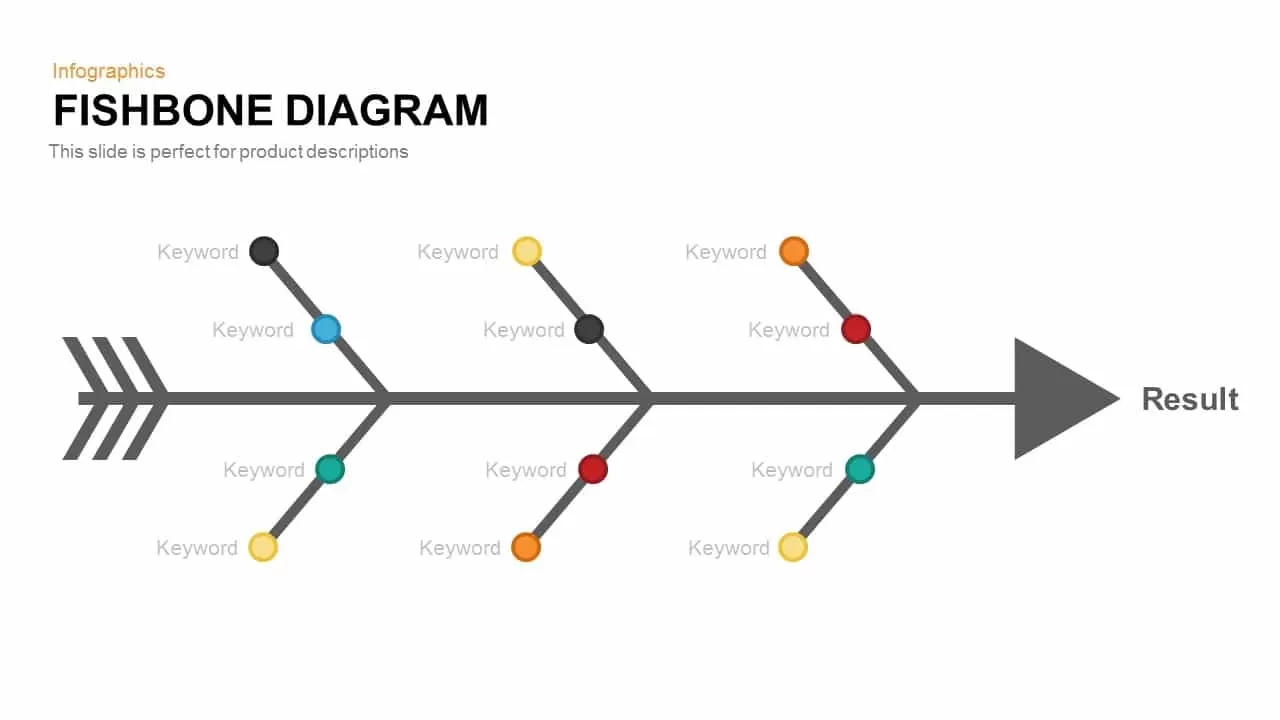
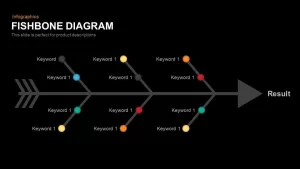
Fishbone RCA Diagram Template for PowerPoint & Google Slides
Description
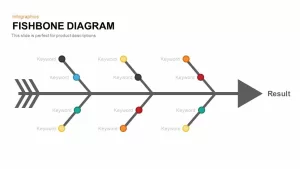
Leverage this visually engaging fishbone diagram slide to map root causes and contributing factors leading to your desired outcome. The main horizontal spine is a bold grey arrow pointing toward the result, while four sets of angled branches extend above and below to represent categories and sub-causes. Each branch terminates in a colorful, circular marker—black, cyan, yellow, orange, and red accent hues—to help differentiate factors at a glance. Fully built with vector shapes in PowerPoint and Google Slides, this slide offers master-slide support, editable connectors, and customizable text placeholders for each “Keyword” marker. Adjust branch angles, replace color palettes, or swap labels with drag-and-drop ease, ensuring alignment with your brand or presentation theme. The minimalist flat design, consistent typography, and ample white space deliver a professional look without distracting embellishments. Curved join points and uniform line weights maintain visual coherence as you add or remove factors. The vector-based construction allows infinite scalability without pixelation, and built-in alignment guides help maintain precise layouts. An optional speaker notes section enables you to outline context and discussion points for each factor, ensuring seamless delivery. Paired with a clear “Result” annotation at the arrowhead, this diagram clarifies complex cause-and-effect relationships in one compelling visual.
Who is it for
Process improvement specialists, quality assurance managers, and Six Sigma practitioners will find this fishbone diagram essential for root cause workshops. Project managers, consultants, and business analysts can also leverage it to structure brainstorming sessions and stakeholder presentations.
Other Uses
Repurpose this template for risk assessments, failure mode effect analysis (FMEA), brainstorming potential challenges, or visualizing action-plan drivers. Its adaptable layout also suits compliance audits, training modules, and strategic planning exercises.
Login to download this file

Item ID
SB00231
Related Templates

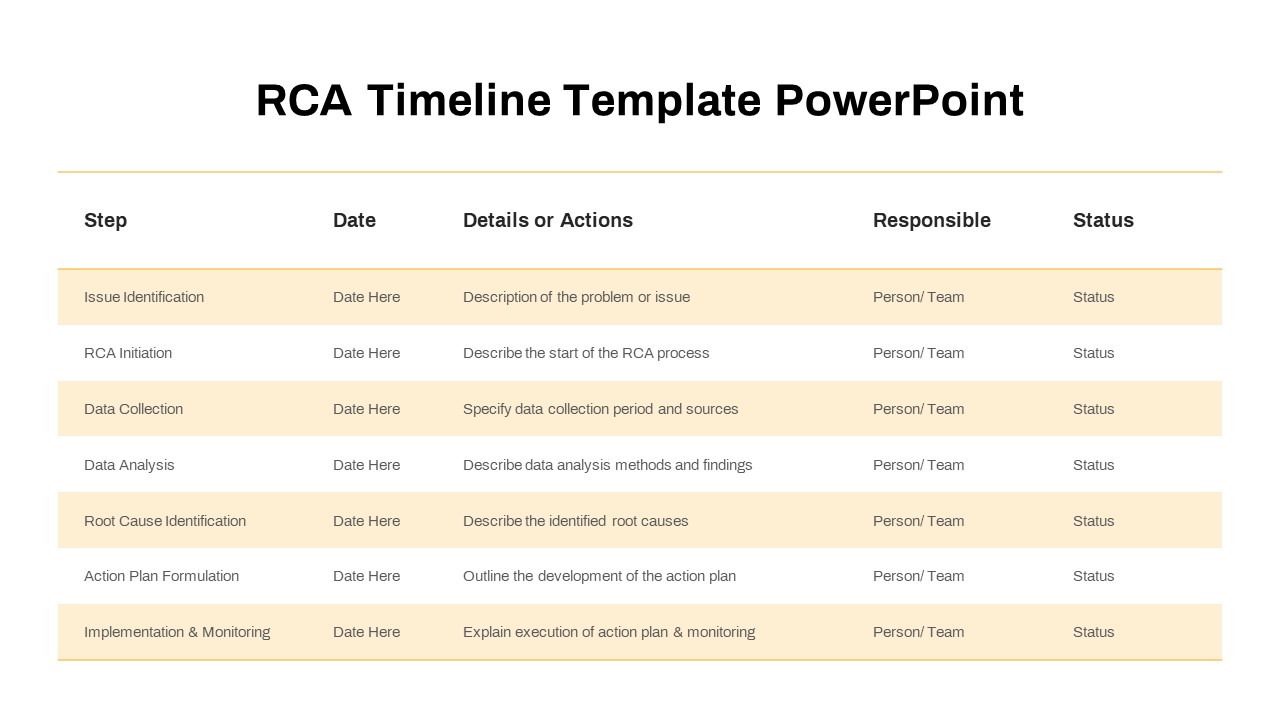
RCA Process Timeline Table Slide Template for PowerPoint & Google Slides
Timeline

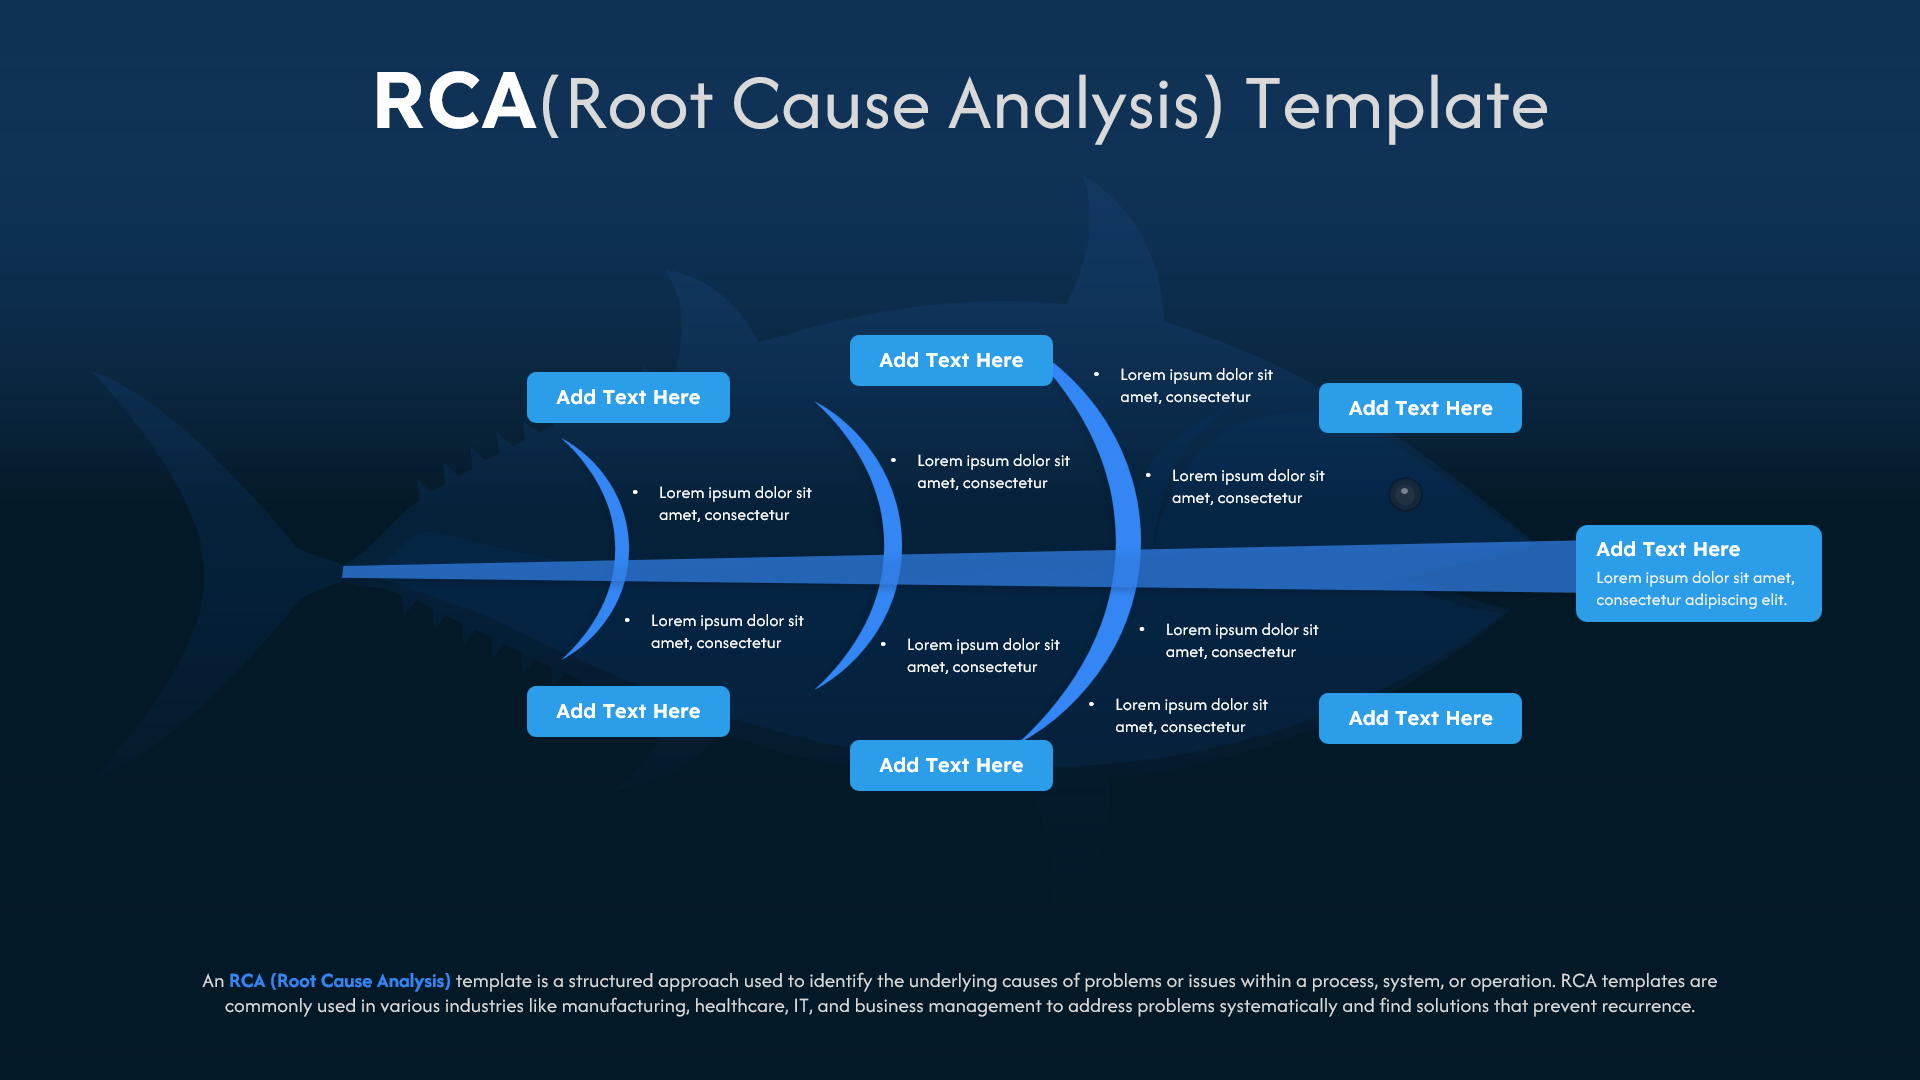
RCA Template for PowerPoint & Google Slides
Business
Three-Section Fishbone Process Diagram template for PowerPoint & Google Slides
Process
Fishbone Diagram Overview template for PowerPoint & Google Slides
Infographics
Fishbone Diagram Cause-and-Effect Template for PowerPoint & Google Slides
Process
Free Color-Coded Fishbone Diagram Template for PowerPoint & Google Slides
Project
Free
Fishbone Cause and Effect Diagram Template for PowerPoint & Google Slides
Process
Fishbone Diagram Analysis Template for PowerPoint & Google Slides
Flow Charts
Fishbone Cause Analysis Diagram Template for PowerPoint & Google Slides
Process
Underwater Fishbone Cause-Effect Diagram Template for PowerPoint & Google Slides
Process
Fishbone Process Diagram template for PowerPoint & Google Slides
Infographics
Free Root Cause Analysis Fishbone Diagram Template for PowerPoint & Google Slides
Process
Free
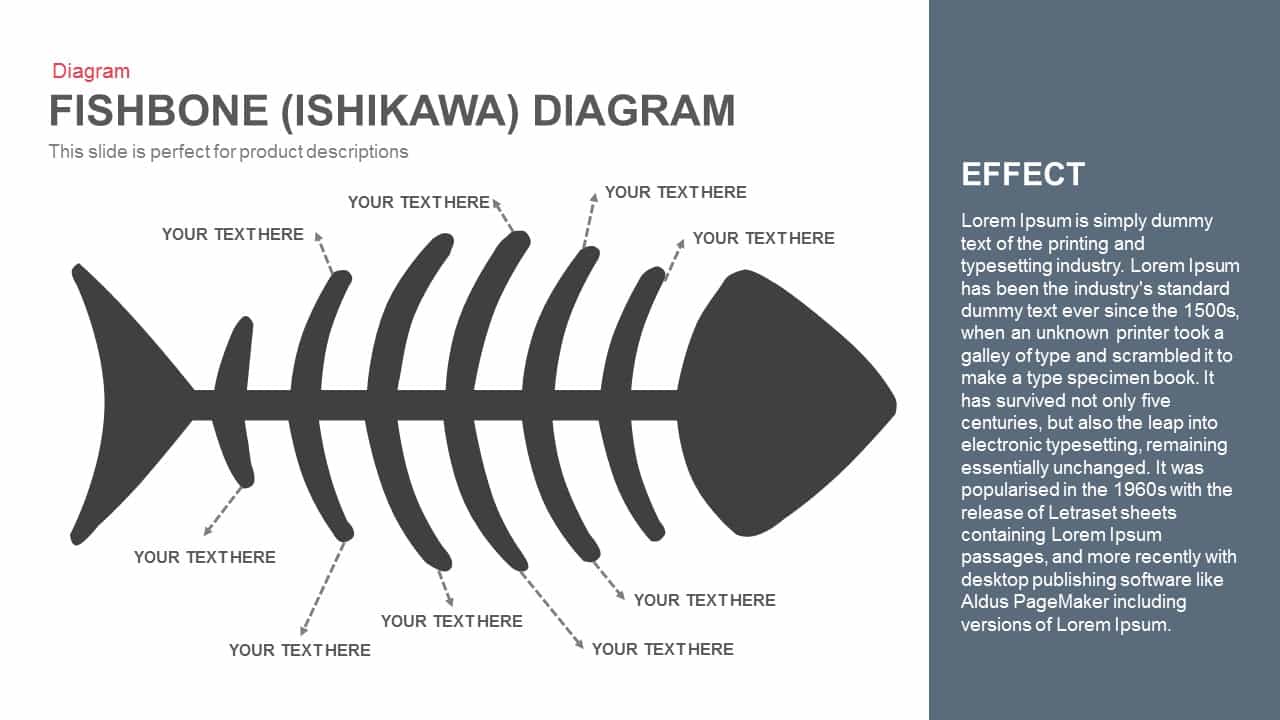
Fishbone (Ishikawa) Diagram for PowerPoint & Google Slides
Process
5 Why Fishbone Diagram for Root Cause Analysis in PowerPoint & Google Slides
Process
Fishbone Cause and Effect Infographic Template for PowerPoint & Google Slides
Infographics
Fishbone Timeline Infographic Series Template for PowerPoint & Google Slides
Manufacturing
Snake Diagram Pack of 8 Slides template for PowerPoint & Google Slides
Process
Gear Process Diagram PowerPoint Template for PowerPoint & Google Slides
Process
Sales Process Workflow Funnel Diagram PowerPoint Template for PowerPoint & Google Slides
Funnel
Puzzle Diagram PowerPoint Template for PowerPoint & Google Slides
Process
Transportation Logistics PowerPoint Diagram template for PowerPoint & Google Slides
Process
Emoji Scale PowerPoint Diagram for PowerPoint & Google Slides
Infographics
4 Step Problem Solving PowerPoint Diagram for PowerPoint & Google Slides
Process
4 Step Arrow Diagram template for PowerPoint & Google Slides
Arrow
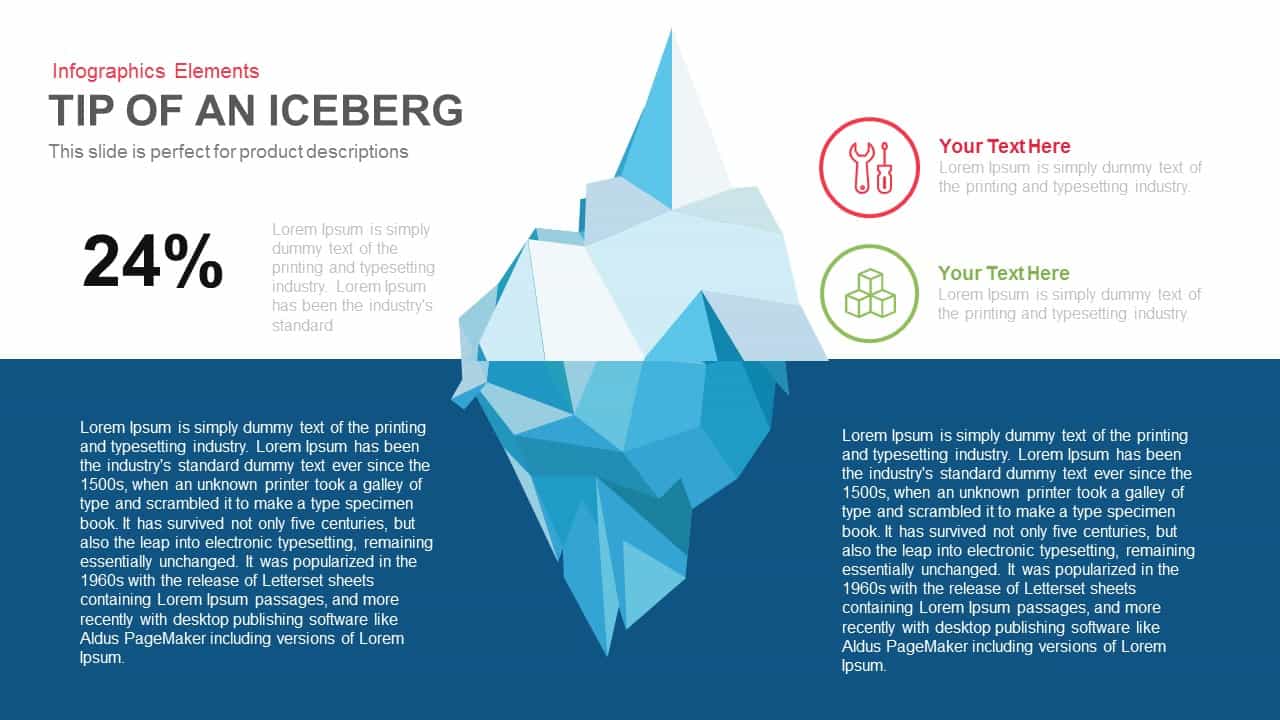
Tip of an Iceberg Infographic Diagram template for PowerPoint & Google Slides
Iceberg Charts
Five-Step Flat Ribbon Diagram Layout template for PowerPoint & Google Slides
Process
3D Cylinder Diagram Template for PowerPoint & Google Slides
Process
Growth Stage Diagram template for PowerPoint & Google Slides
Process
7-Step Workflow Process Diagram Template for PowerPoint & Google Slides
Process
Arrow Process Diagram Template for PowerPoint & Google Slides
Process
Eight Section Circular Diagram Template for PowerPoint & Google Slides
Circular
Interactive Products Tree Diagram template for PowerPoint & Google Slides
Org Chart
Dynamic Key Points Diagram Template for PowerPoint & Google Slides
Process

Product Design Process Diagram Template for PowerPoint & Google Slides
Timeline
3D Cube Problem-Solving Diagram Template for PowerPoint & Google Slides
Process
Product Development Stage Diagram Template for PowerPoint & Google Slides
Process
Editable Force Field Analysis Diagram Template for PowerPoint & Google Slides
Business Plan
Six-Stage Zig-Zag Process Flow Diagram Template for PowerPoint & Google Slides
Process
Five-Stage Circle Arrow Diagram Template for PowerPoint & Google Slides
Circular
Clean Four-Section Review Diagram Template for PowerPoint & Google Slides
Agenda
Circular Improvement Process Diagram Template for PowerPoint & Google Slides
Process
Editable Four-Section 3D Shape Diagram Template for PowerPoint & Google Slides
Comparison
Five-Point Circle Timeline Diagram Template for PowerPoint & Google Slides
Timeline
12-Stage Zig Zag Process Diagram Template for PowerPoint & Google Slides
Process
Three Level Funnel Process Diagram Template for PowerPoint & Google Slides
Funnel
Curved Road Roadmap Timeline Diagram Template for PowerPoint & Google Slides
Roadmap
Comprehensive Cynefin Framework Diagram Template for PowerPoint & Google Slides
Opportunities Challenges
9-Step Circular Arrows Process Diagram Template for PowerPoint & Google Slides
Process
7 Stages Jigsaw Diagram template for PowerPoint & Google Slides
Process
Eight-Step Brainstorming Process Diagram Template for PowerPoint & Google Slides
Process
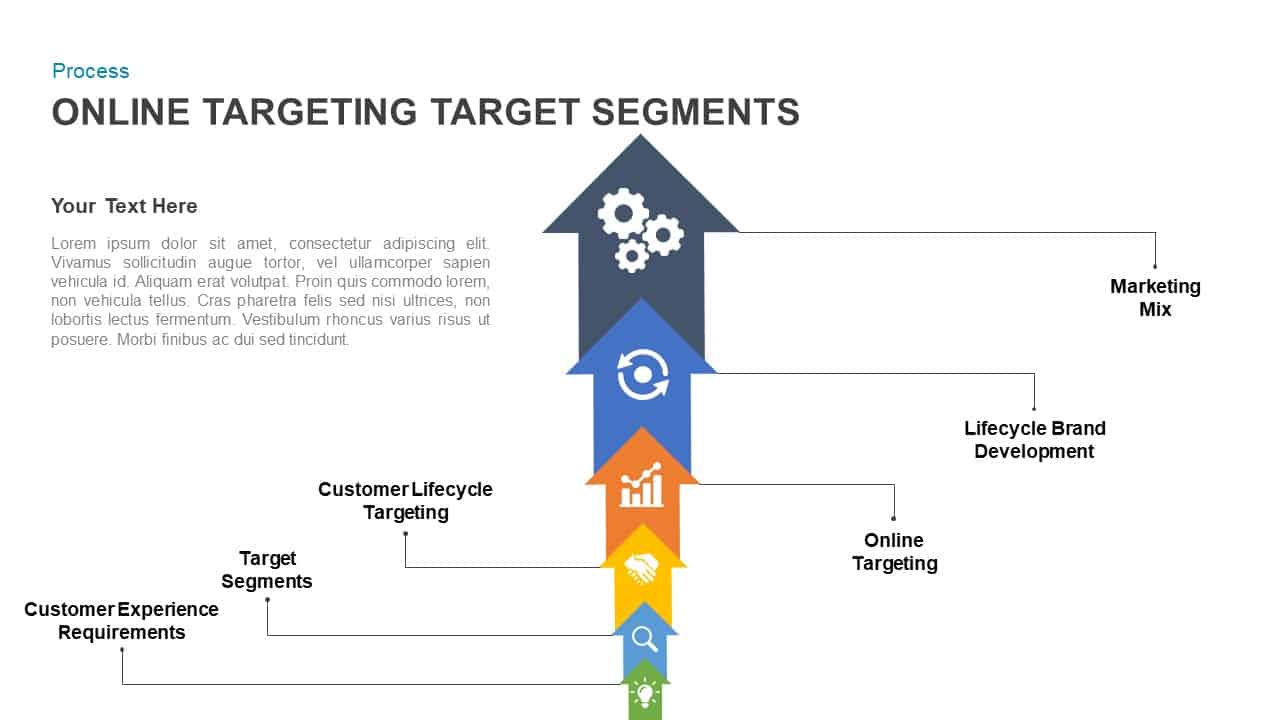
Online Targeting & Segmentation Diagram Template for PowerPoint & Google Slides
Process
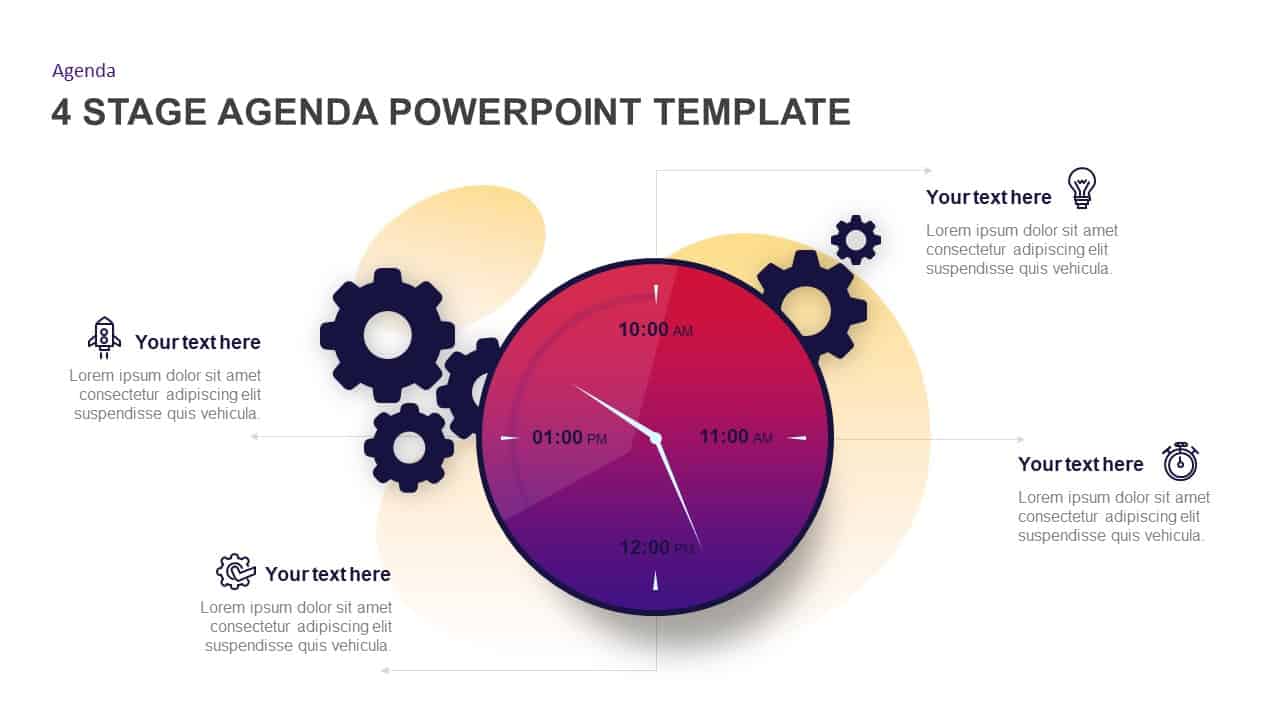
Gradient Clock Agenda Timeline Diagram Template for PowerPoint & Google Slides
Agenda
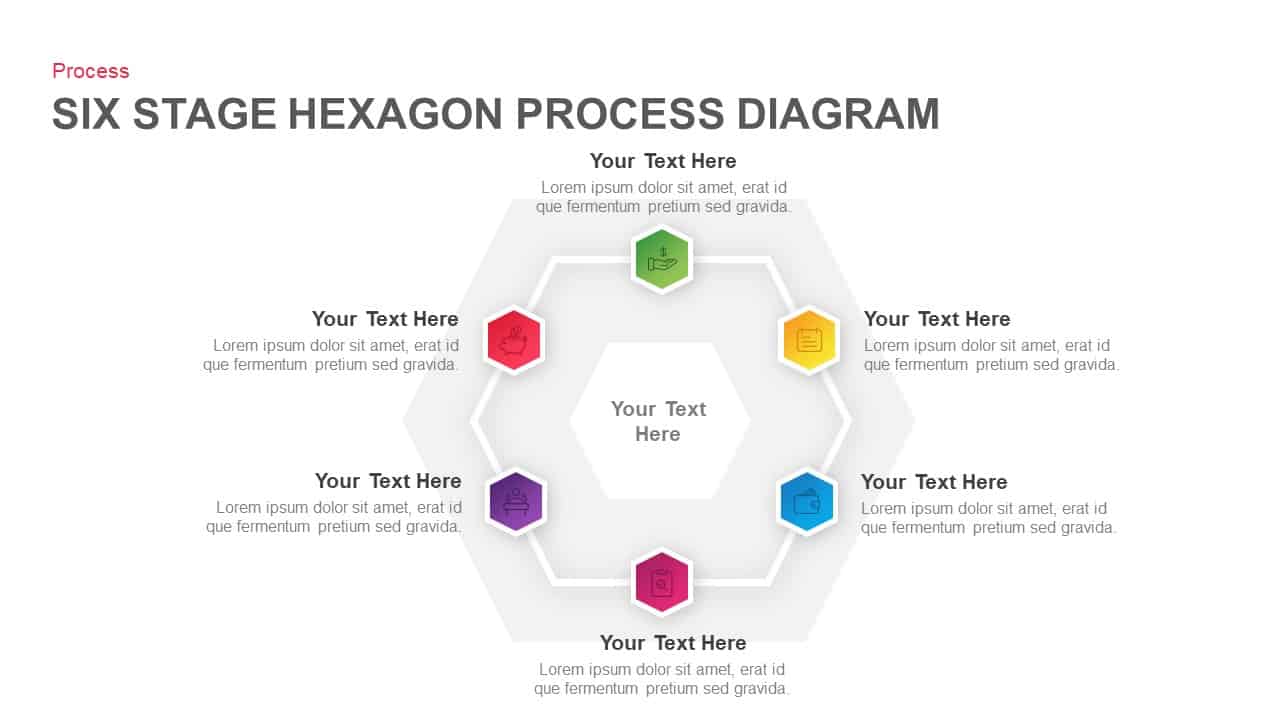
Six Stage Hexagon Process Diagram Template for PowerPoint & Google Slides
Process
Four-Stage Linear Process Flow Diagram Template for PowerPoint & Google Slides
Process
Creative Three-Circle Venn Diagram Template for PowerPoint & Google Slides
Comparison
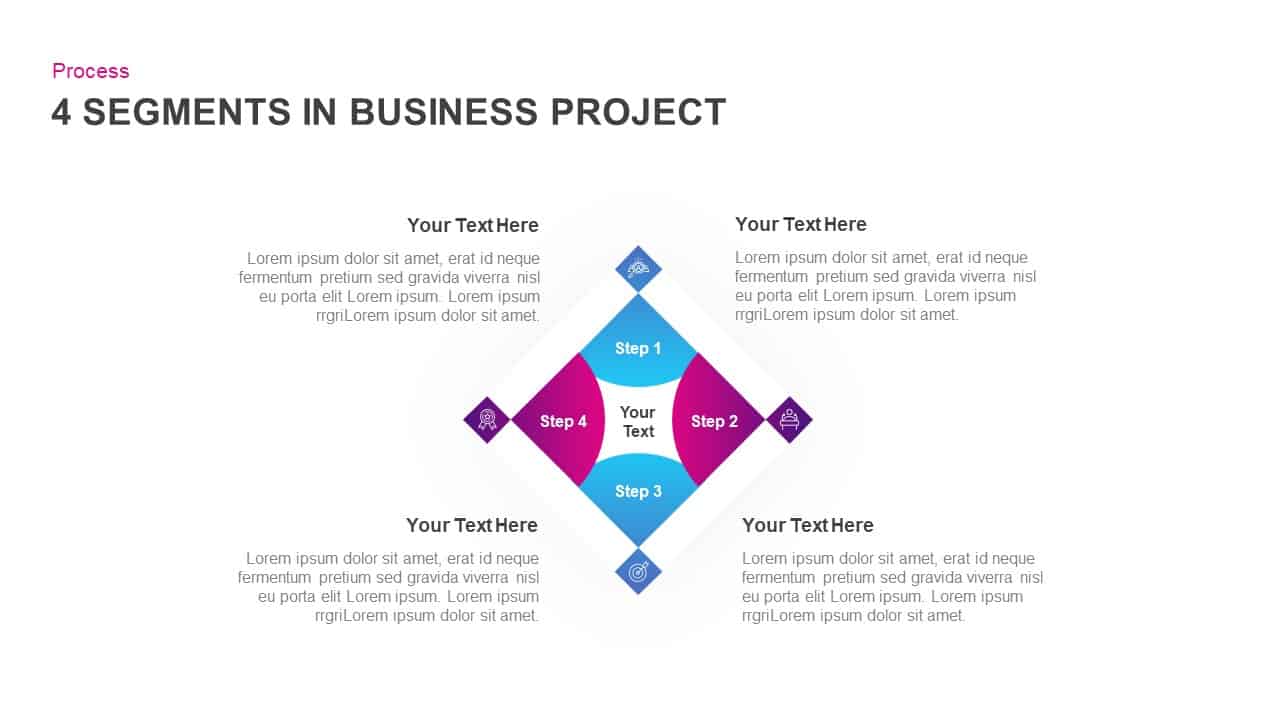
4-Segment Business Project Diamond Diagram Template for PowerPoint & Google Slides
Process
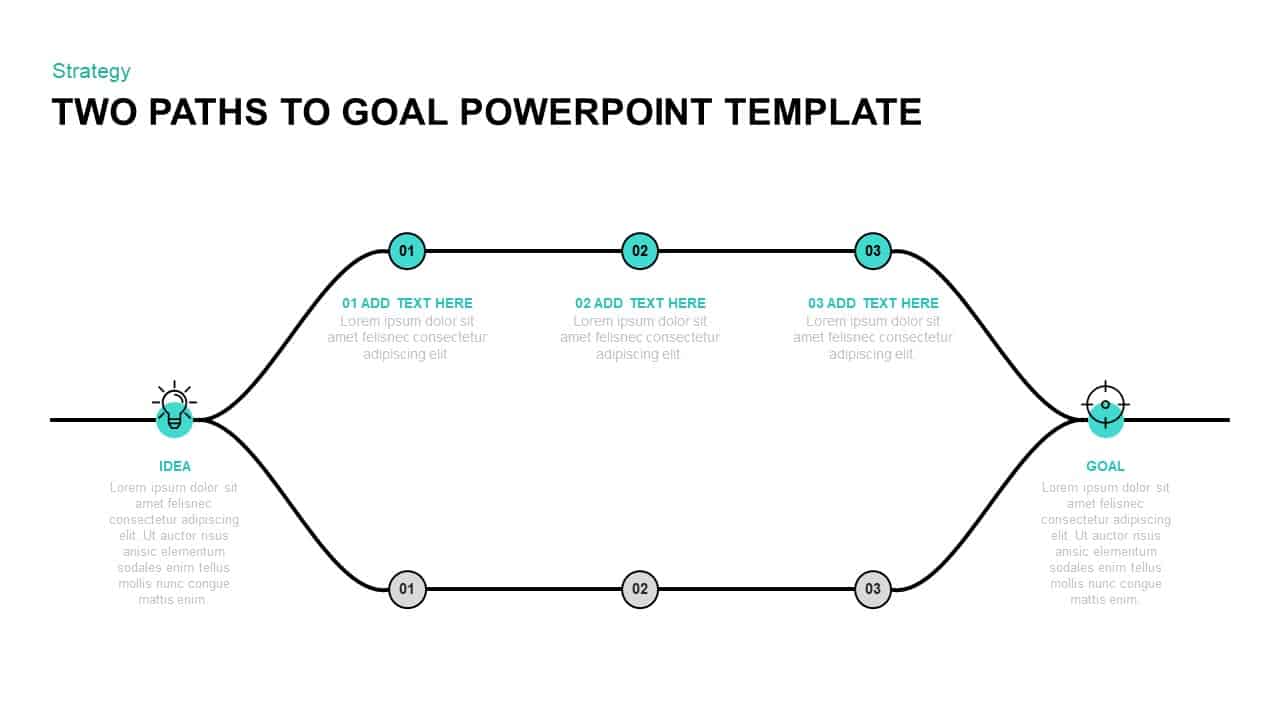
Two-Path Idea-to-Goal Process Diagram Template for PowerPoint & Google Slides
Infographics
Creative Tree Diagram Infographic Template for PowerPoint & Google Slides
Decision Tree
Four Section Diagram Infographics template for PowerPoint & Google Slides
Process

Ansoff Growth Matrix Strategy Diagram Template for PowerPoint & Google Slides
Business Strategy
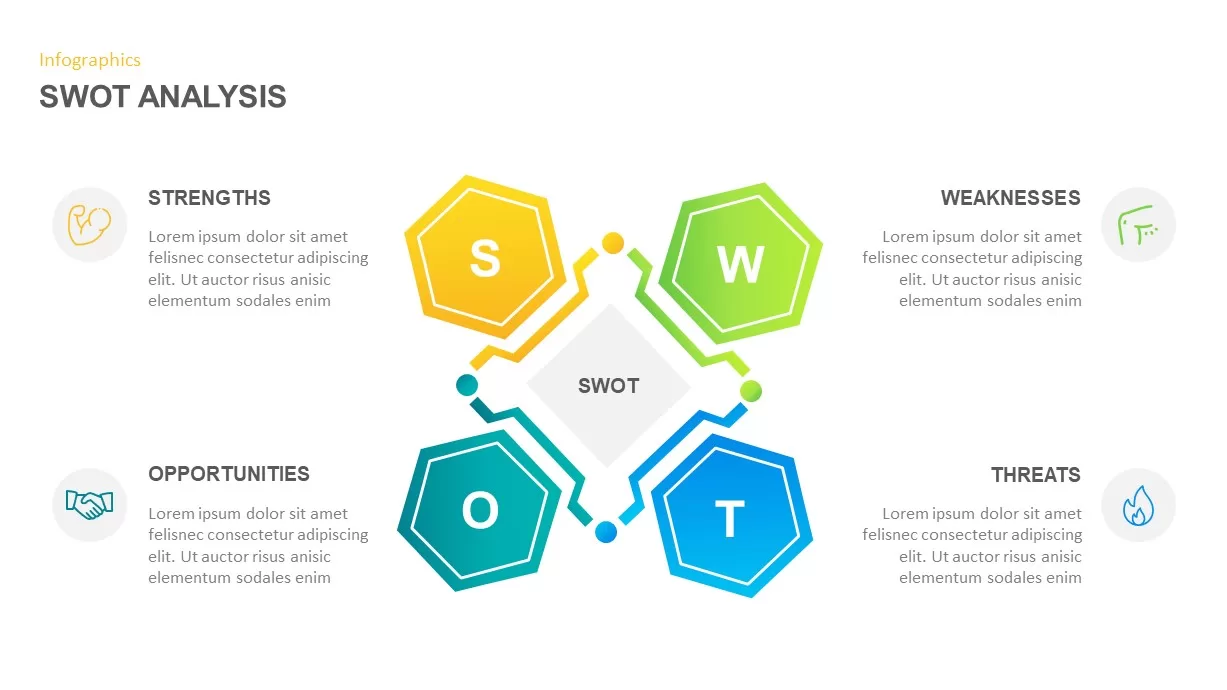
SWOT Analysis Infographic Diagram Template for PowerPoint & Google Slides
SWOT
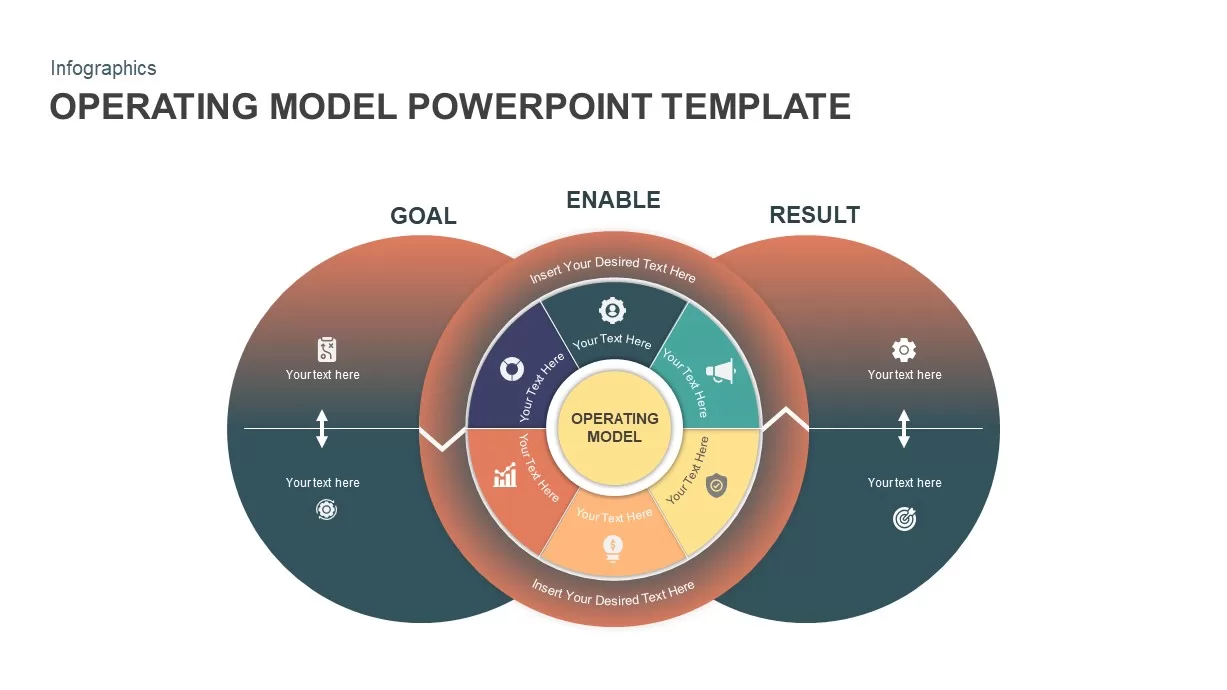
Operating Model Hub-and-Spoke Diagram Template for PowerPoint & Google Slides
Business Models
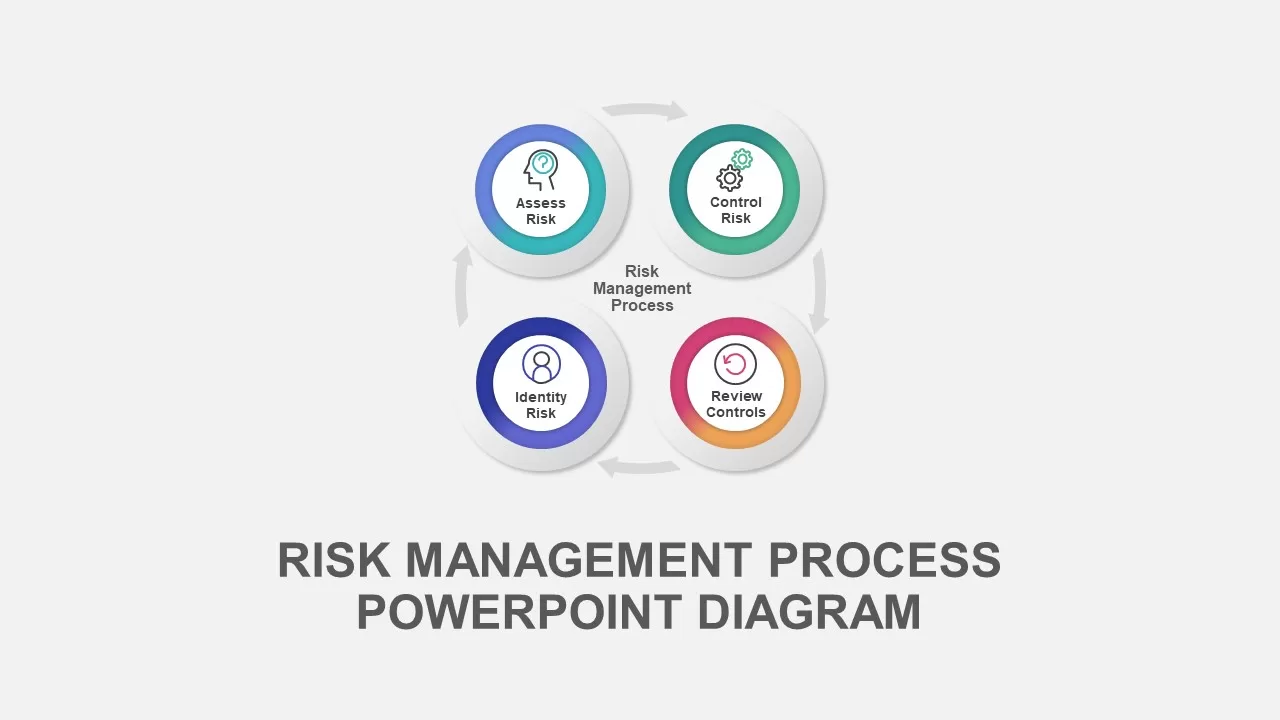
Risk Management Process Diagram Template for PowerPoint & Google Slides
Risk Management
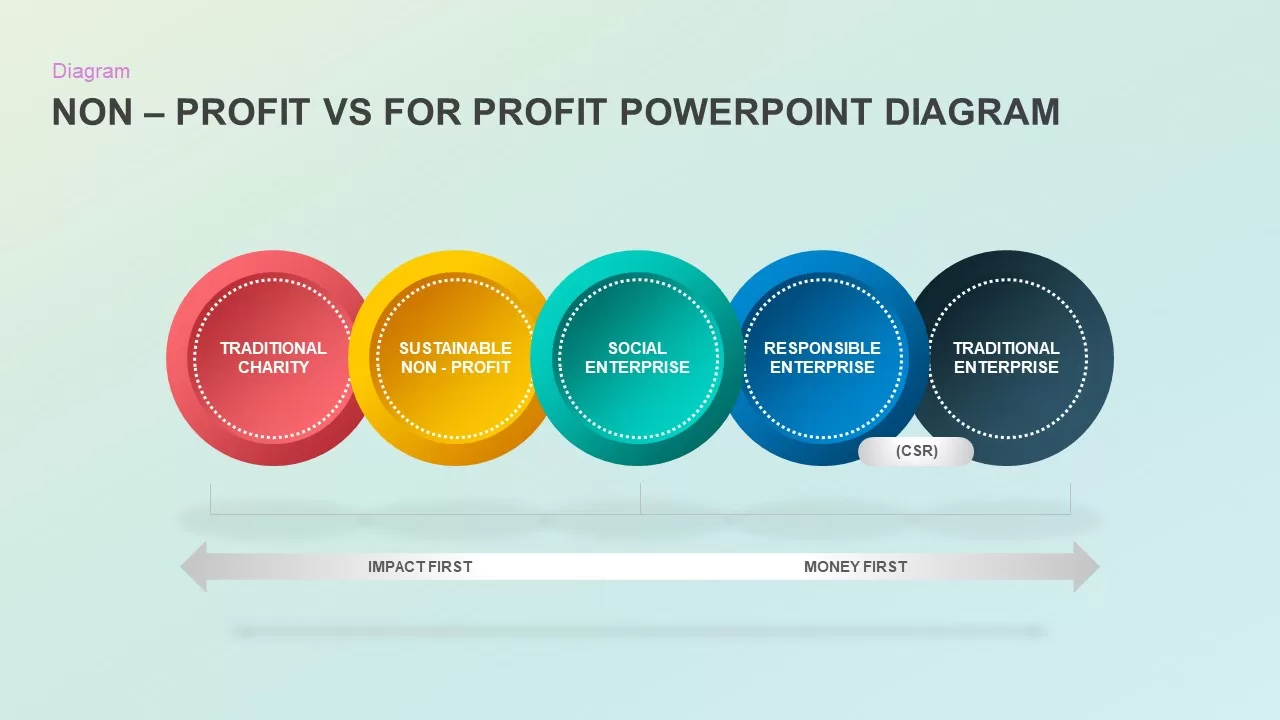
Non-Profit vs For-Profit Diagram template for PowerPoint & Google Slides
Business Models
Minimal Process Flow Diagram Infographic Template for PowerPoint & Google Slides
Process
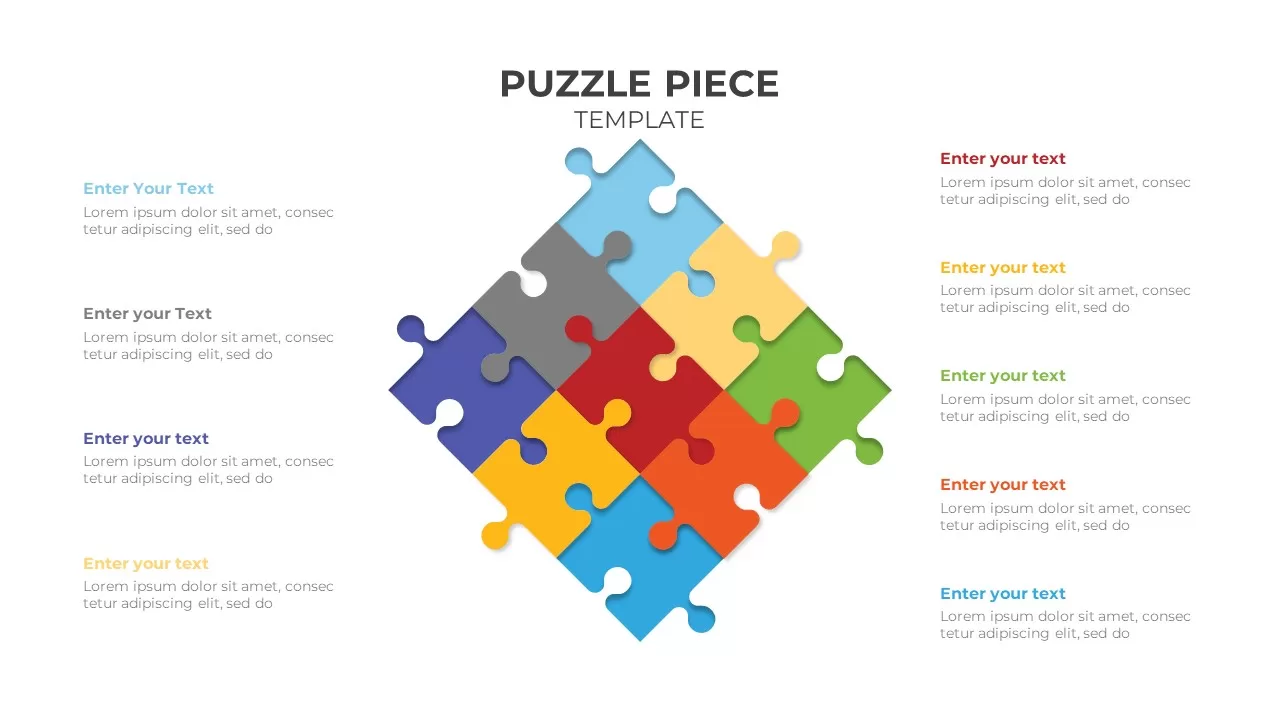
Colorful Nine-Piece Puzzle Diagram Template for PowerPoint & Google Slides
Process
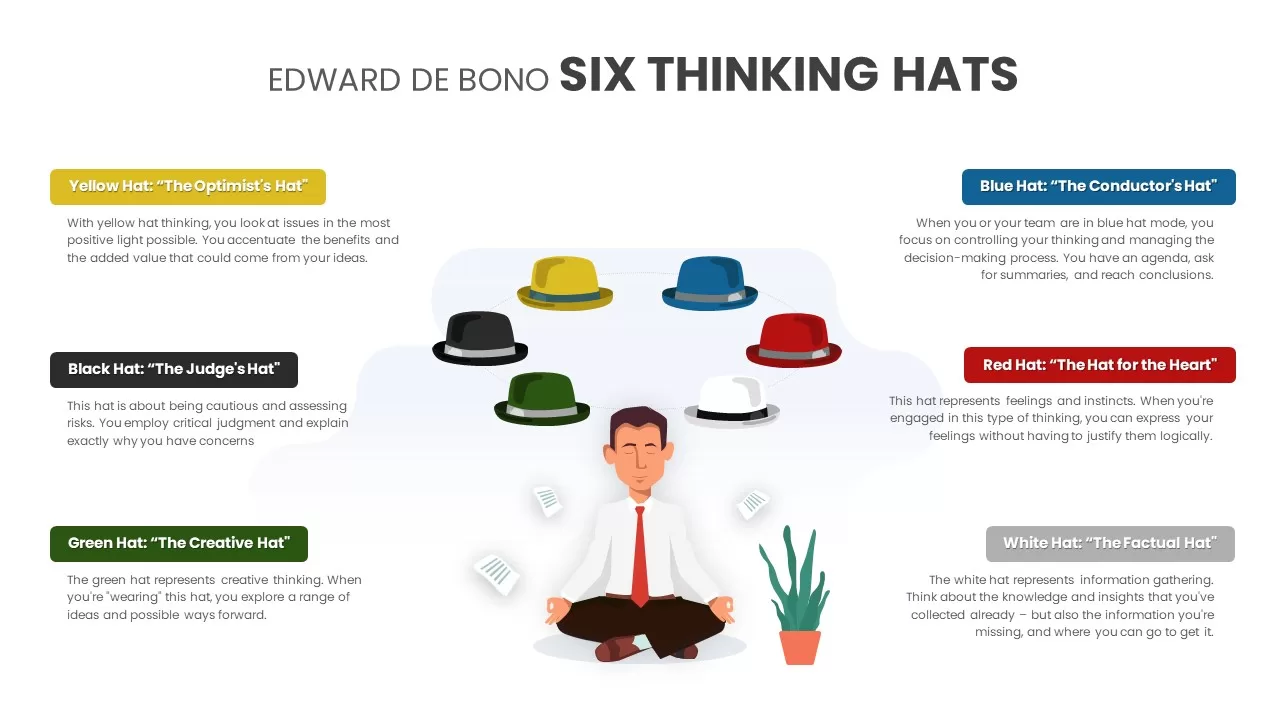
Six Thinking Hats Diagram Presentation Template for PowerPoint & Google Slides
Infographics
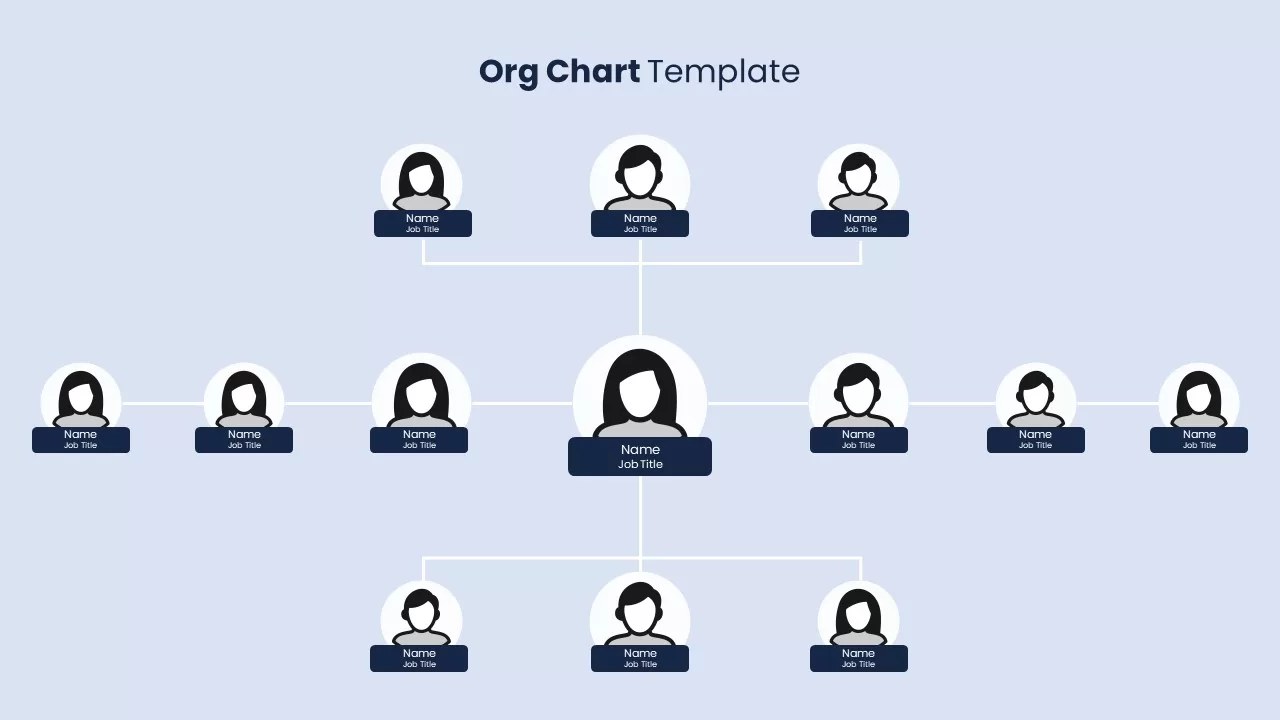
Modern Organizational Hierarchy Diagram Template for PowerPoint & Google Slides
Org Chart
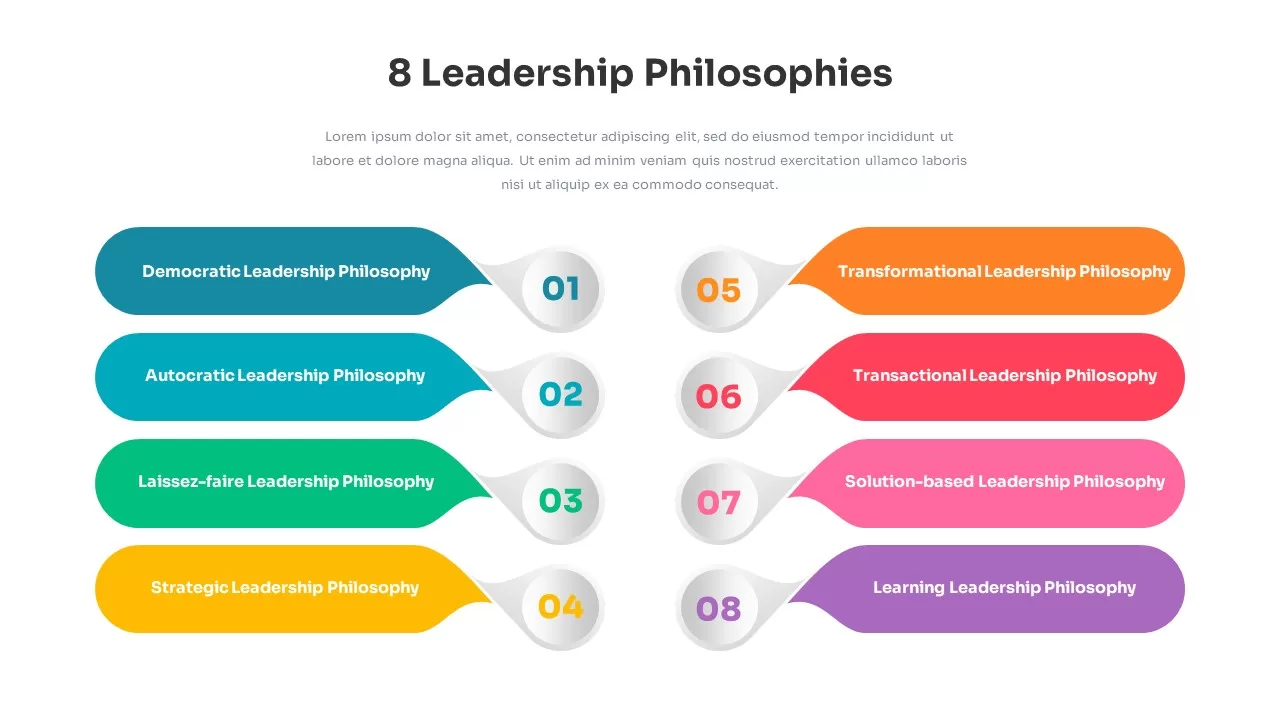
Eight Leadership Philosophies Diagram Template for PowerPoint & Google Slides
Leadership
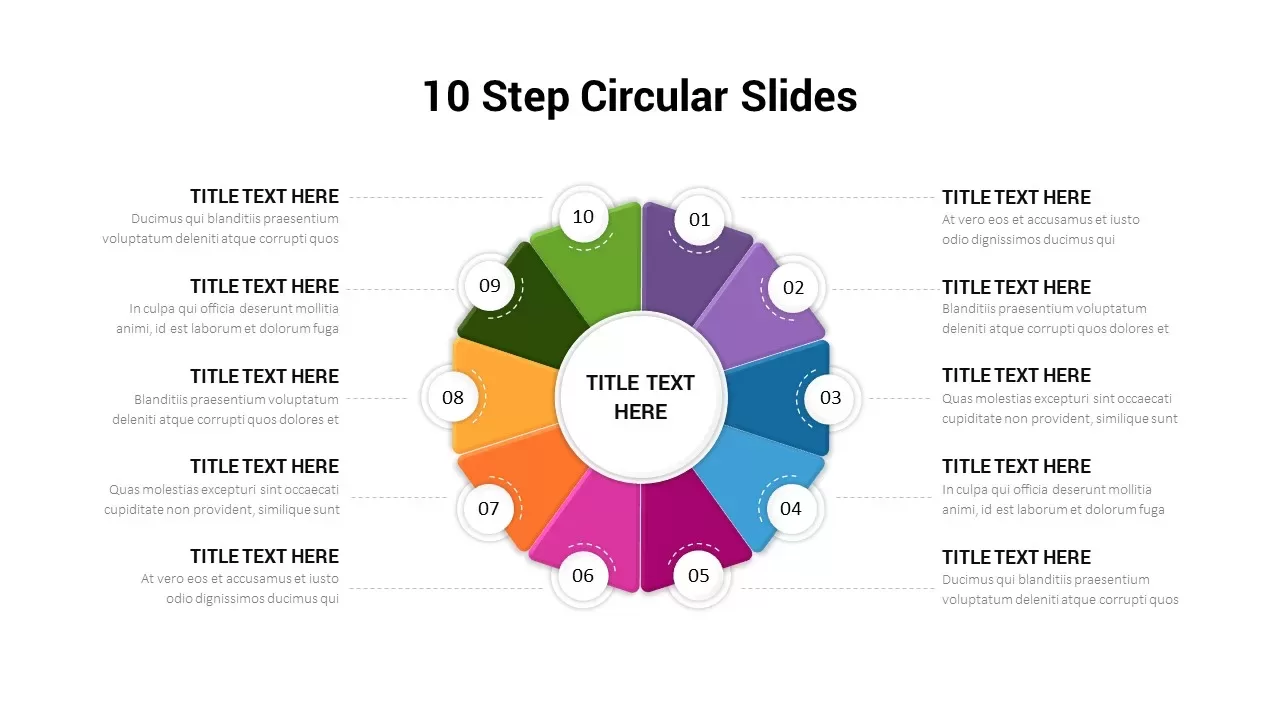
10-Step Circular Process Diagram Template for PowerPoint & Google Slides
Process
Business Strategy House Model Diagram Template for PowerPoint & Google Slides
Business Strategy
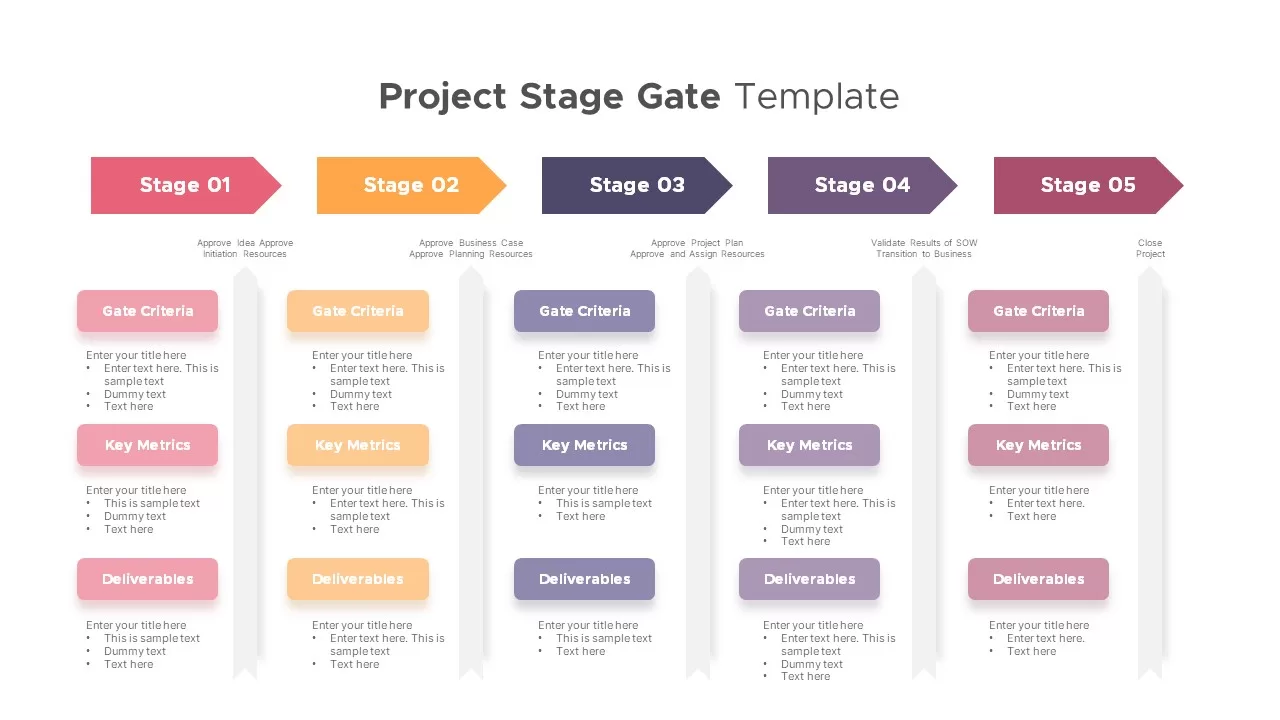
Project Stage Gate Process Diagram Template for PowerPoint & Google Slides
Process
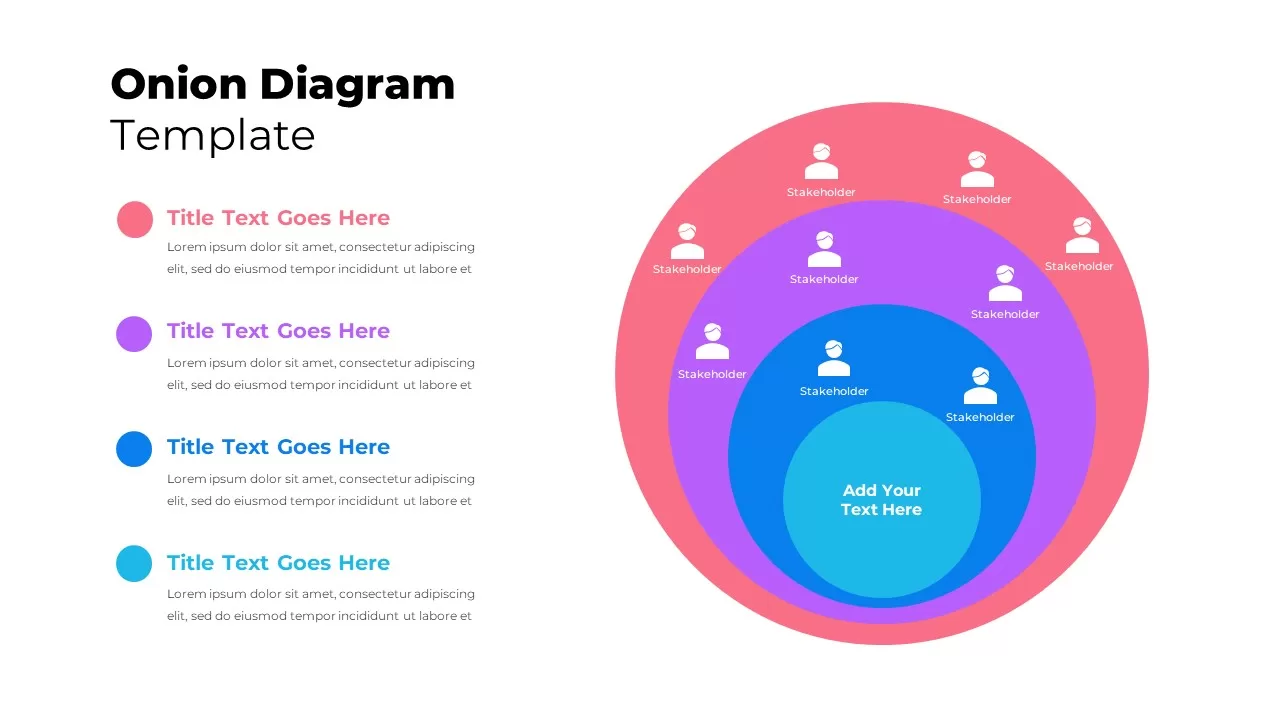
4-Layer Human-Centric Onion Diagram Template for PowerPoint & Google Slides
Process
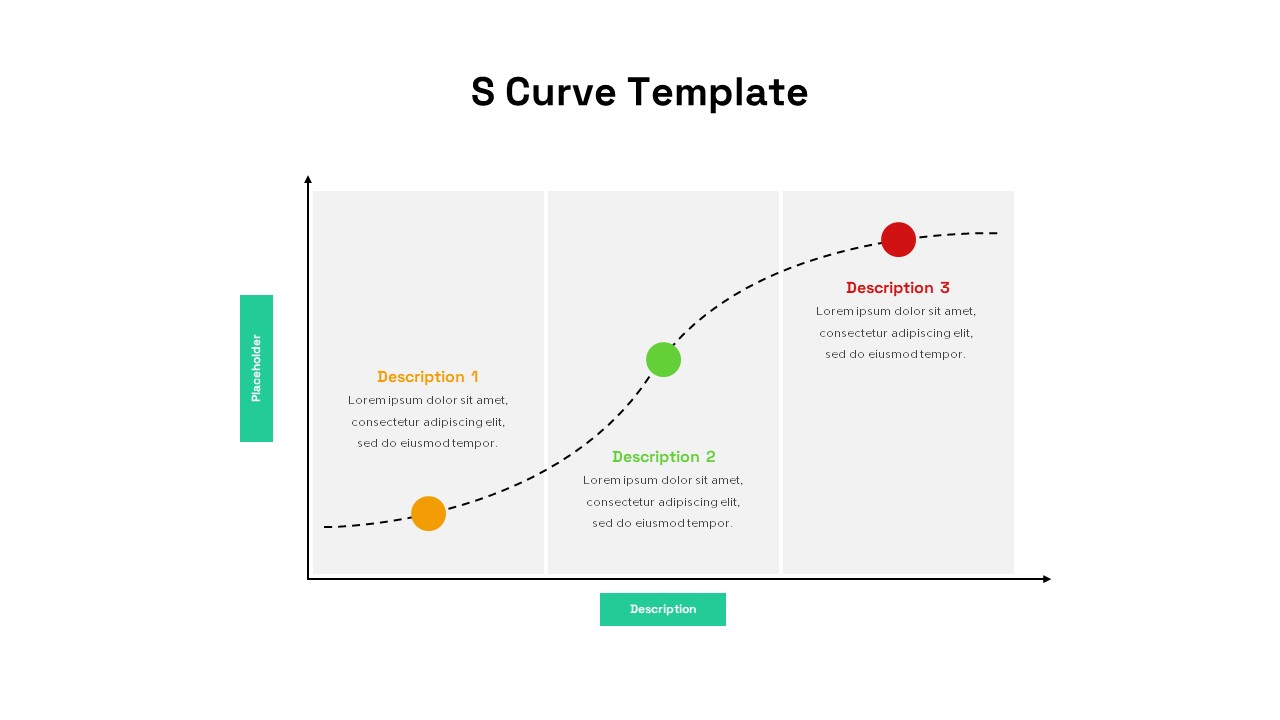
S-Curve Progression Framework Diagram Template for PowerPoint & Google Slides
Charts
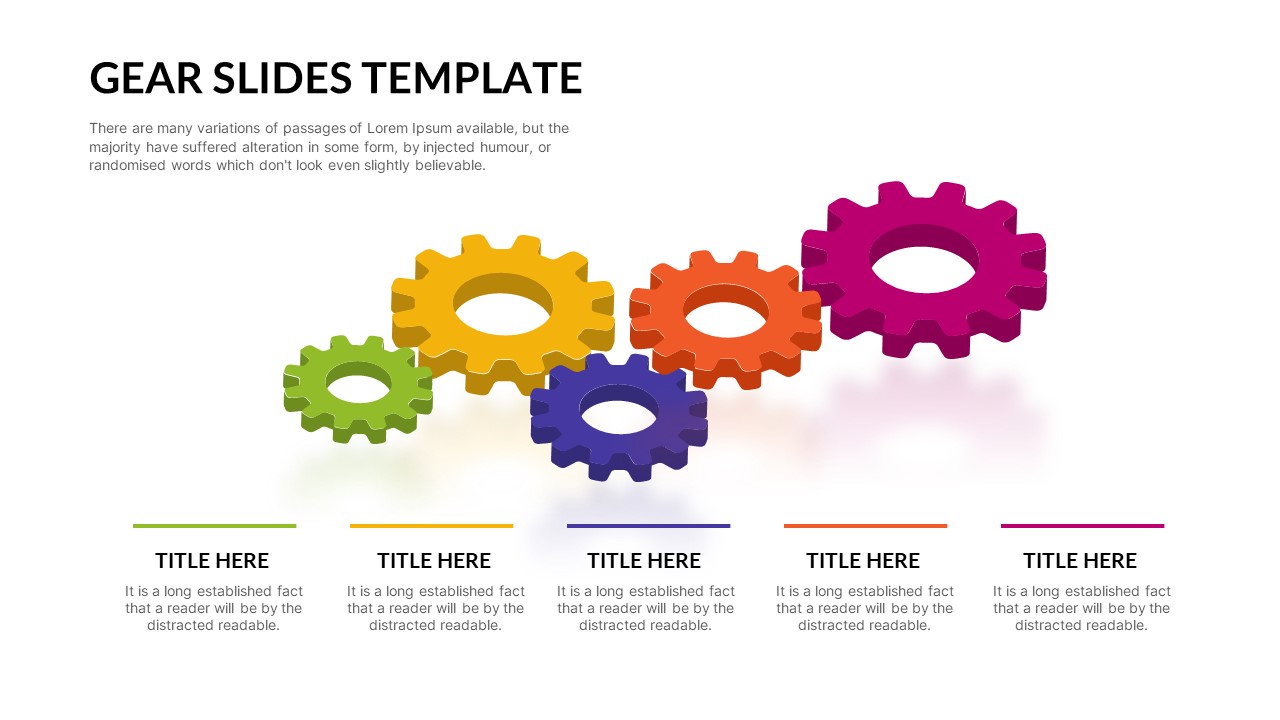
Five-Step Interlocking Gears Diagram Template for PowerPoint & Google Slides
Process
Four-Level Colorful Pyramid Diagram Template for PowerPoint & Google Slides
Pyramid
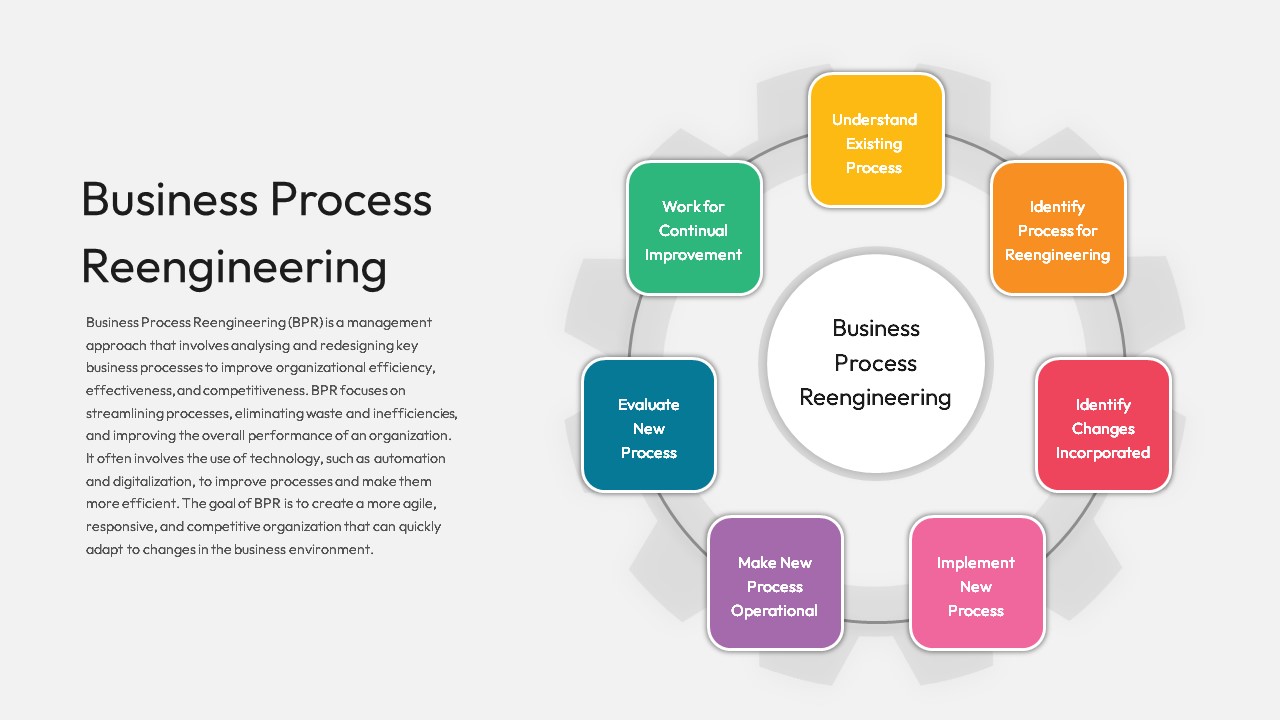
Business Process Reengineering Diagram Template for PowerPoint & Google Slides
Circular
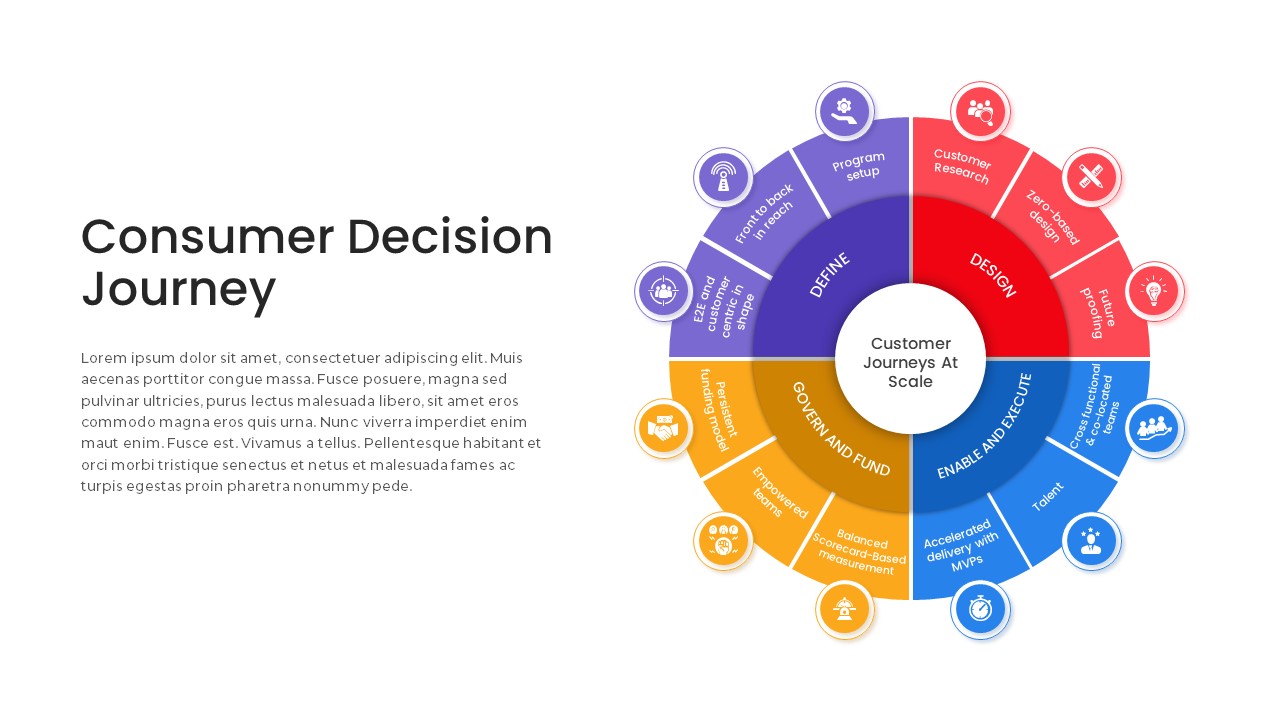
Consumer Decision Journey Radial Diagram Template for PowerPoint & Google Slides
Circular
Lessons Learned Hub and Spoke Diagram Template for PowerPoint & Google Slides
Leadership
Free
Free Business Model Canvas Diagram Slide Template for PowerPoint & Google Slides
Business Models
Free
Sustainable Growth Circular Diagram Template for PowerPoint & Google Slides
Circular
Capital Investments Process Flow Diagram Template for PowerPoint & Google Slides
Process
Order to Cash Process Flow Diagram Template for PowerPoint & Google Slides
Process
Sources of Power Circular Diagram Template for PowerPoint & Google Slides
Circular
Shingo Model Diagram Template for PowerPoint & Google Slides
Process
Cost Structure Triangle Diagram Template for PowerPoint & Google Slides
Finance
Personality Structure Hierarchy Diagram Template for PowerPoint & Google Slides
Org Chart
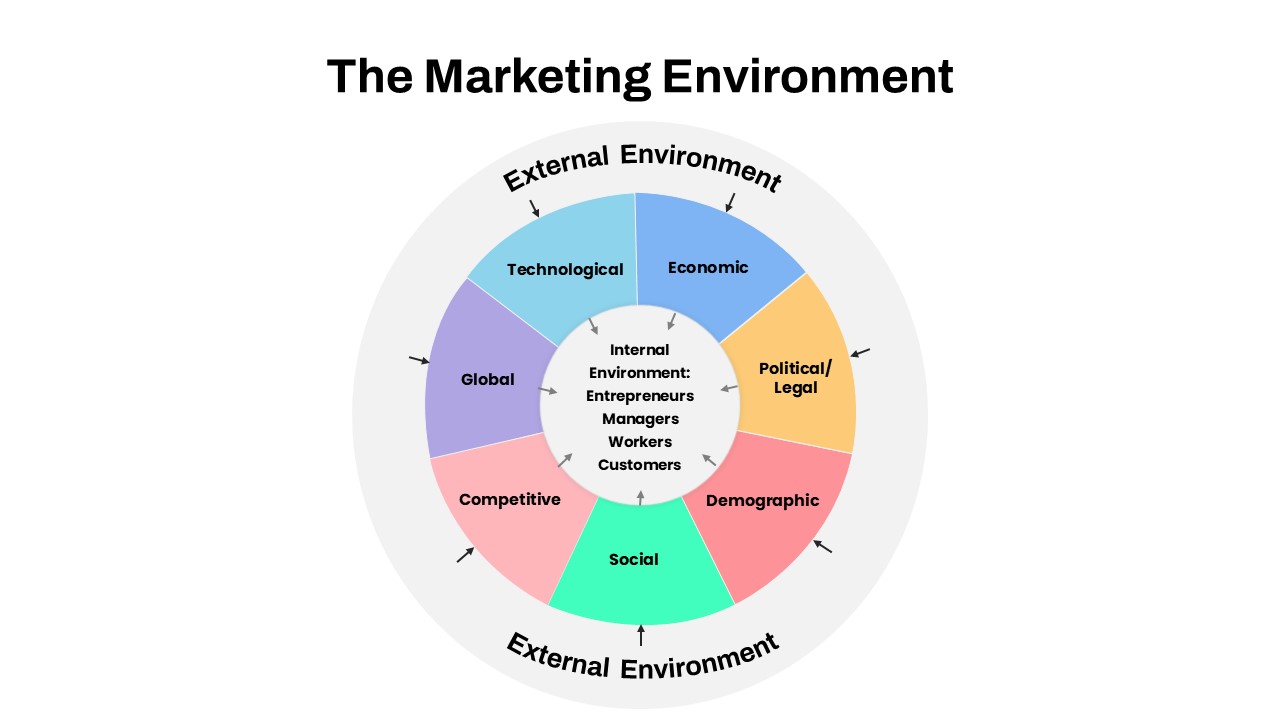
Marketing Environment Circular Diagram template for PowerPoint & Google Slides
Marketing
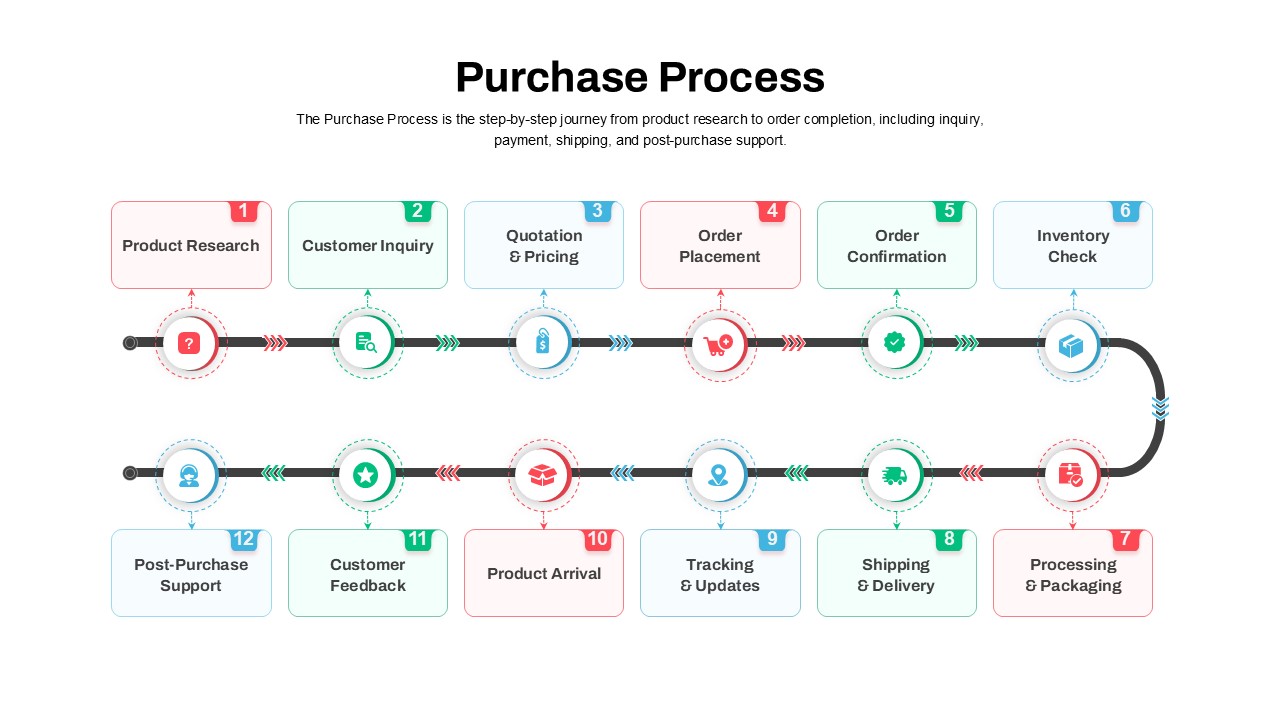
Streamlined Purchase Process Diagram Template for PowerPoint & Google Slides
Timeline
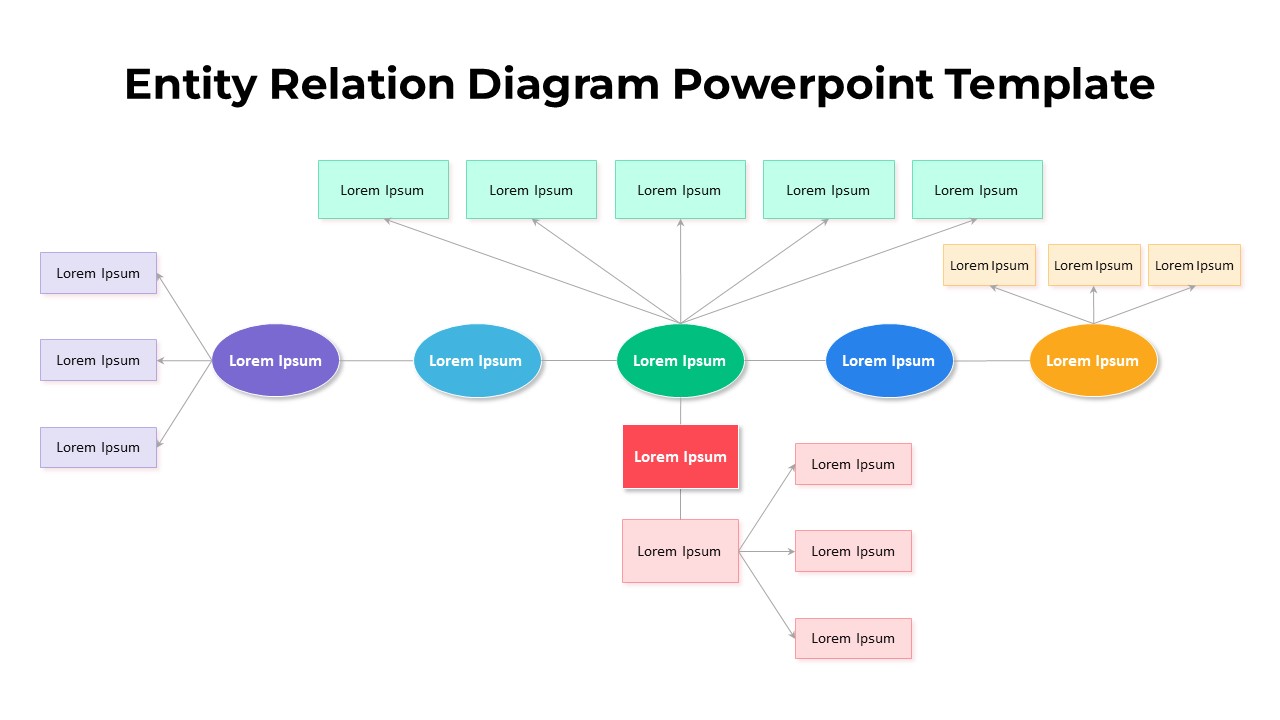
Free Entity Relation Diagram template for PowerPoint & Google Slides
Flow Charts
Free
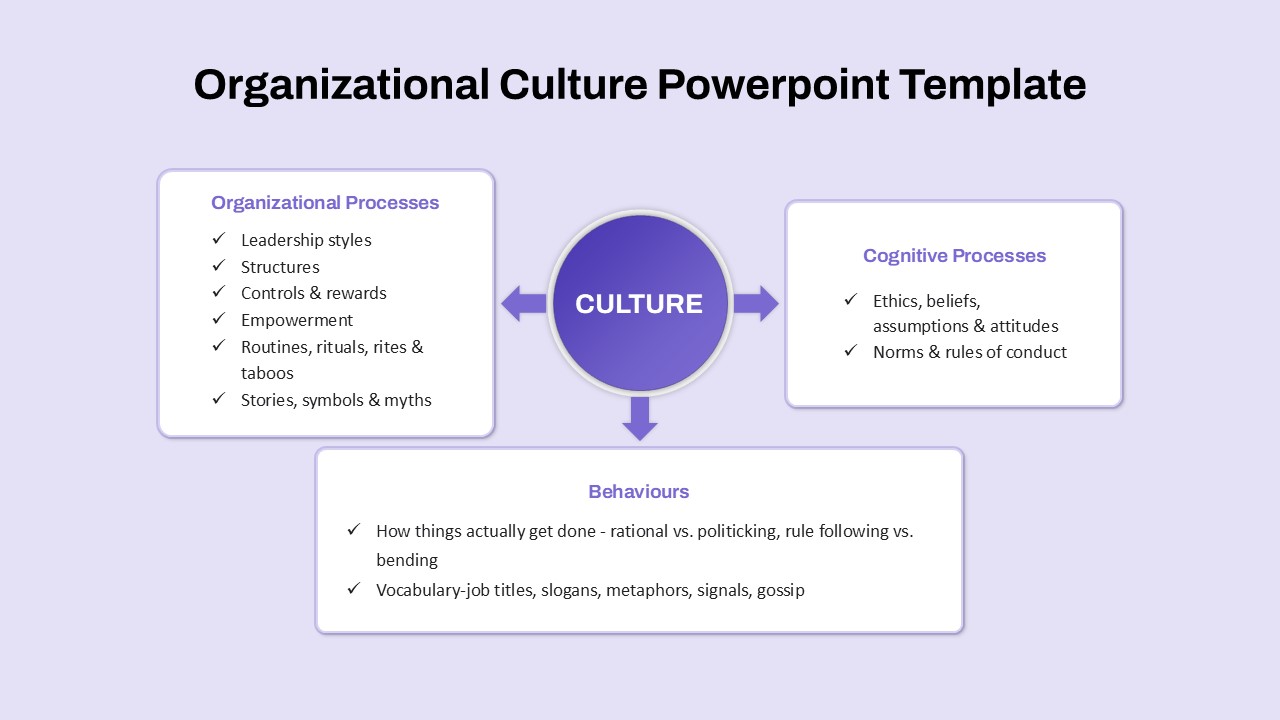
Organizational Culture Framework Diagram Template for PowerPoint & Google Slides
Arrow
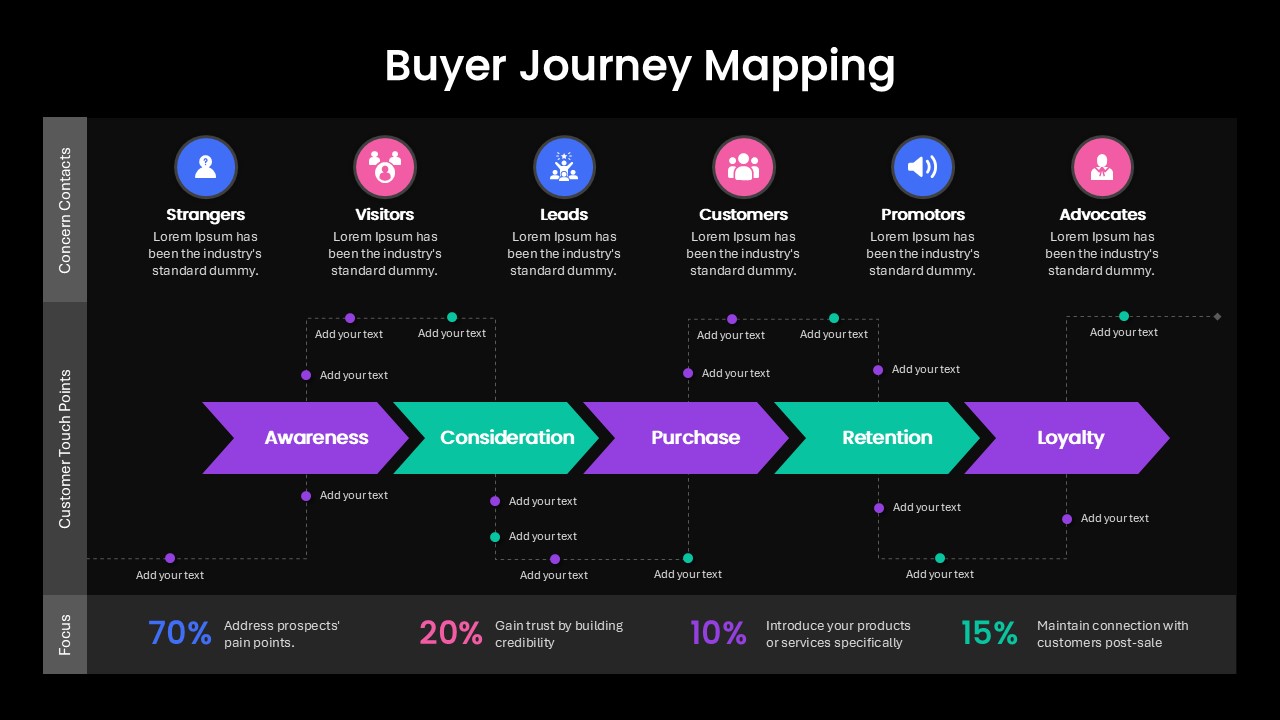
Buyer Journey Mapping Process Diagram Template for PowerPoint & Google Slides
Process
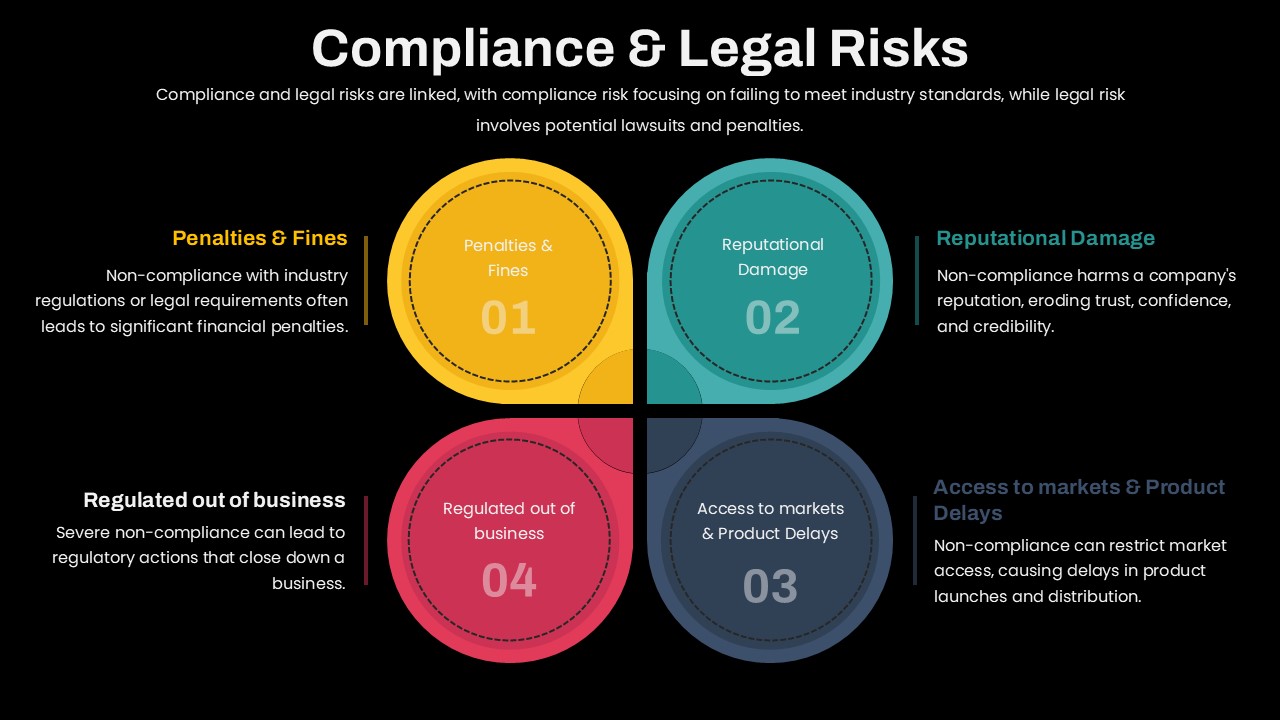
Compliance & Legal Risks Diagram Template for PowerPoint & Google Slides
Circular
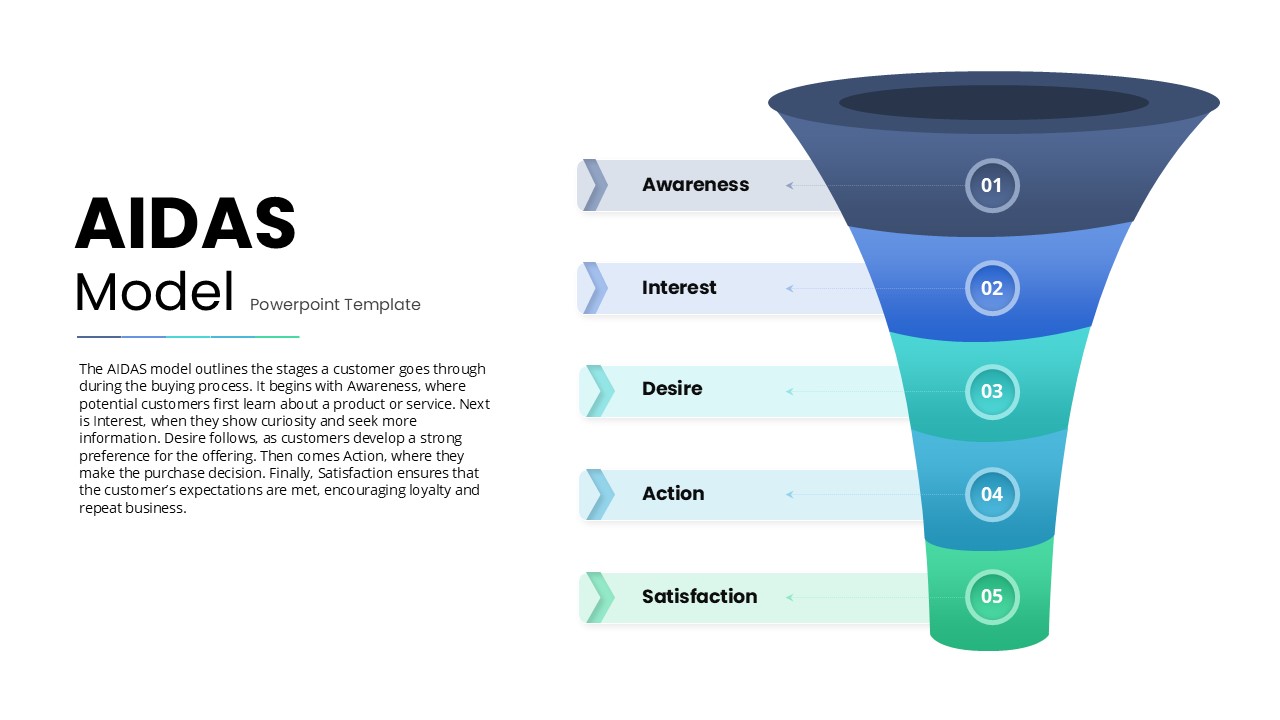
AIDAS Customer Journey Funnel Diagram Template for PowerPoint & Google Slides
Marketing Funnel
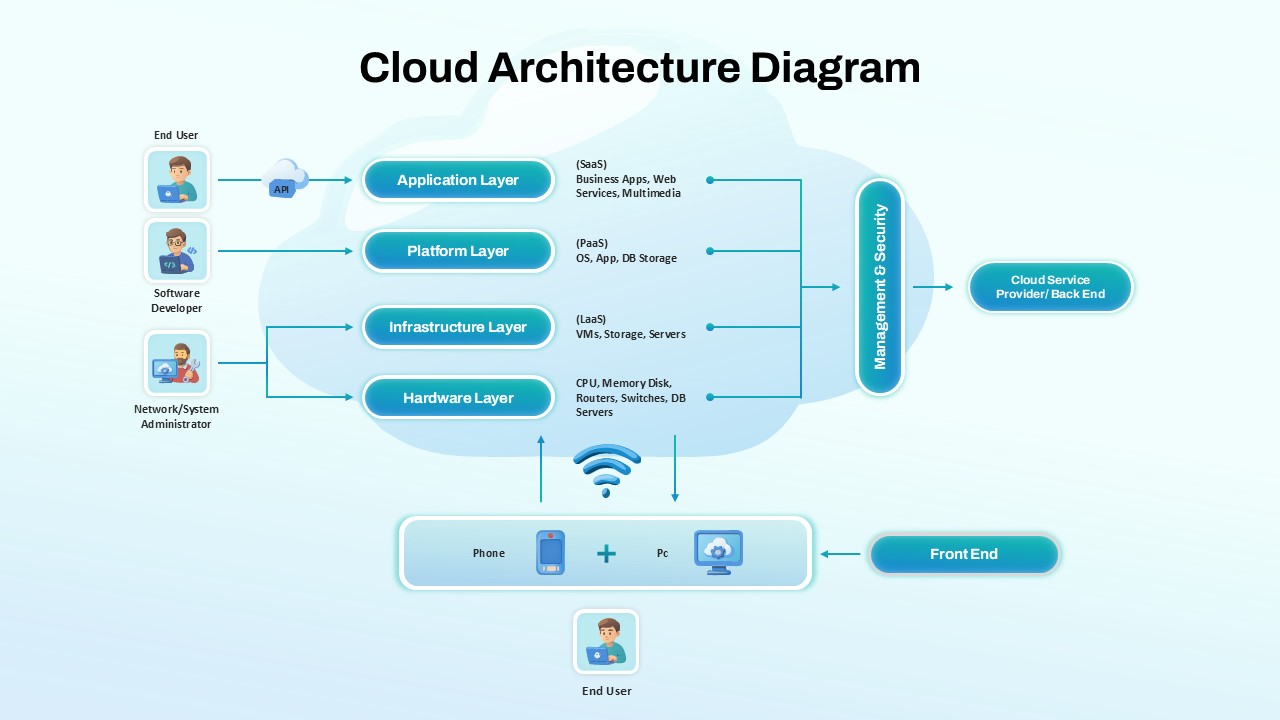
Cloud Architecture Diagram template for PowerPoint & Google Slides
Cloud Computing
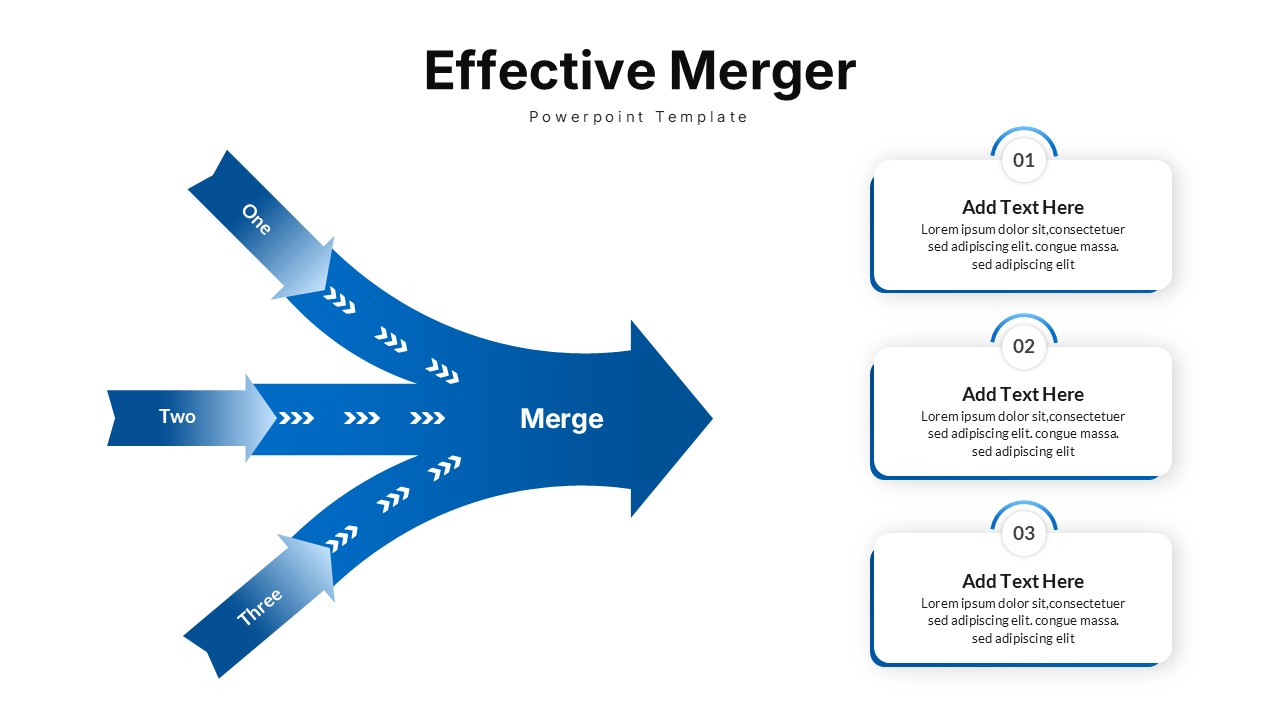
Effective Merger Arrow Diagram Template for PowerPoint & Google Slides
Arrow
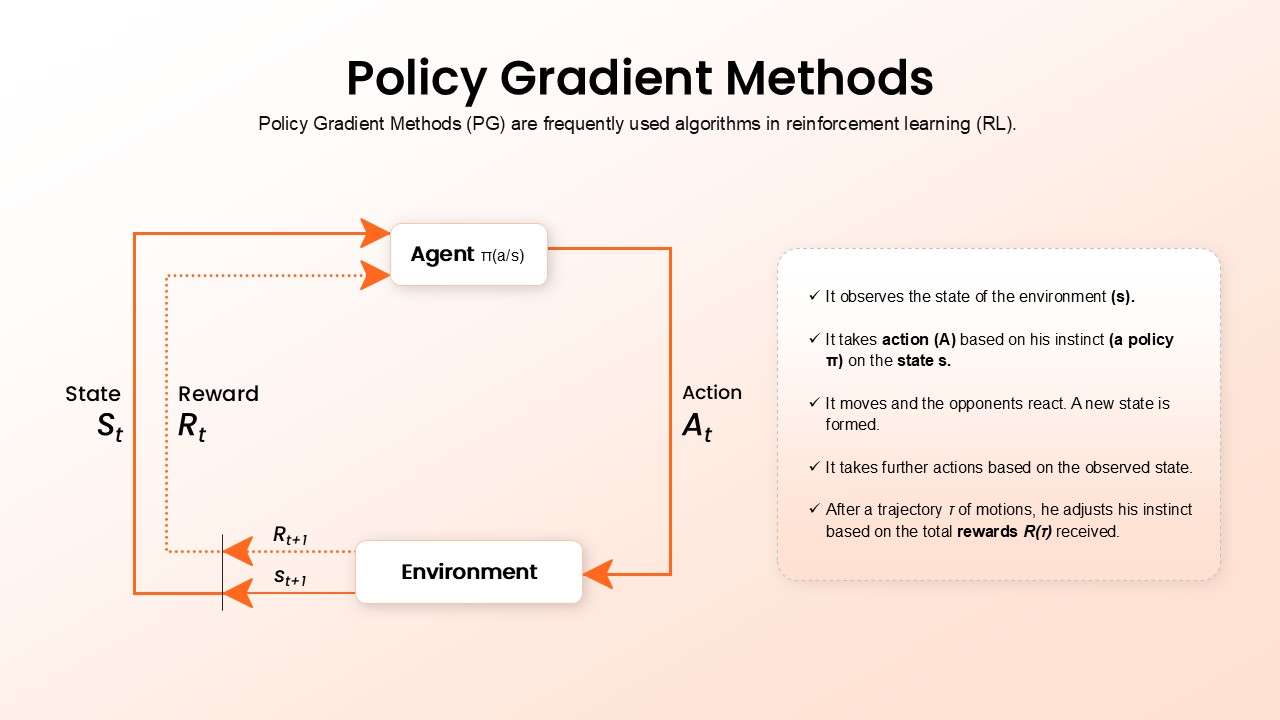
Policy Gradient Methods Flow Diagram Template for PowerPoint & Google Slides
AI
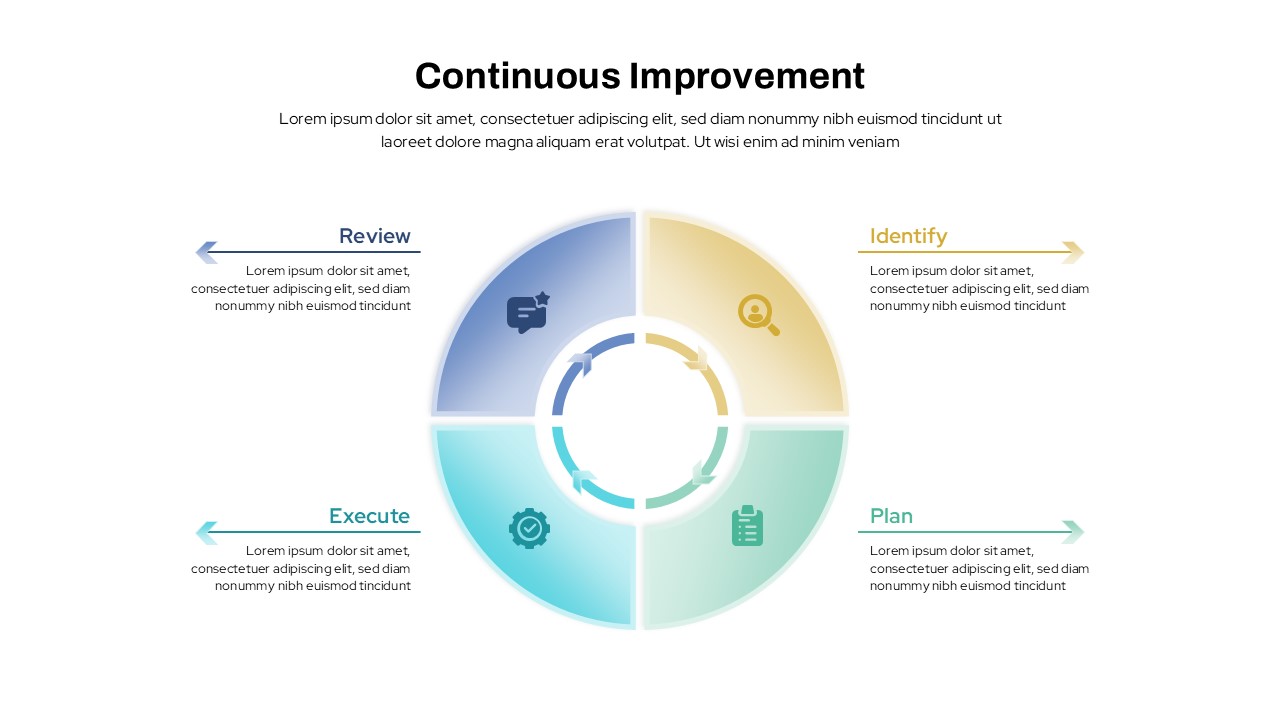
Continuous Improvement Cycle Diagram Template for PowerPoint & Google Slides
Process
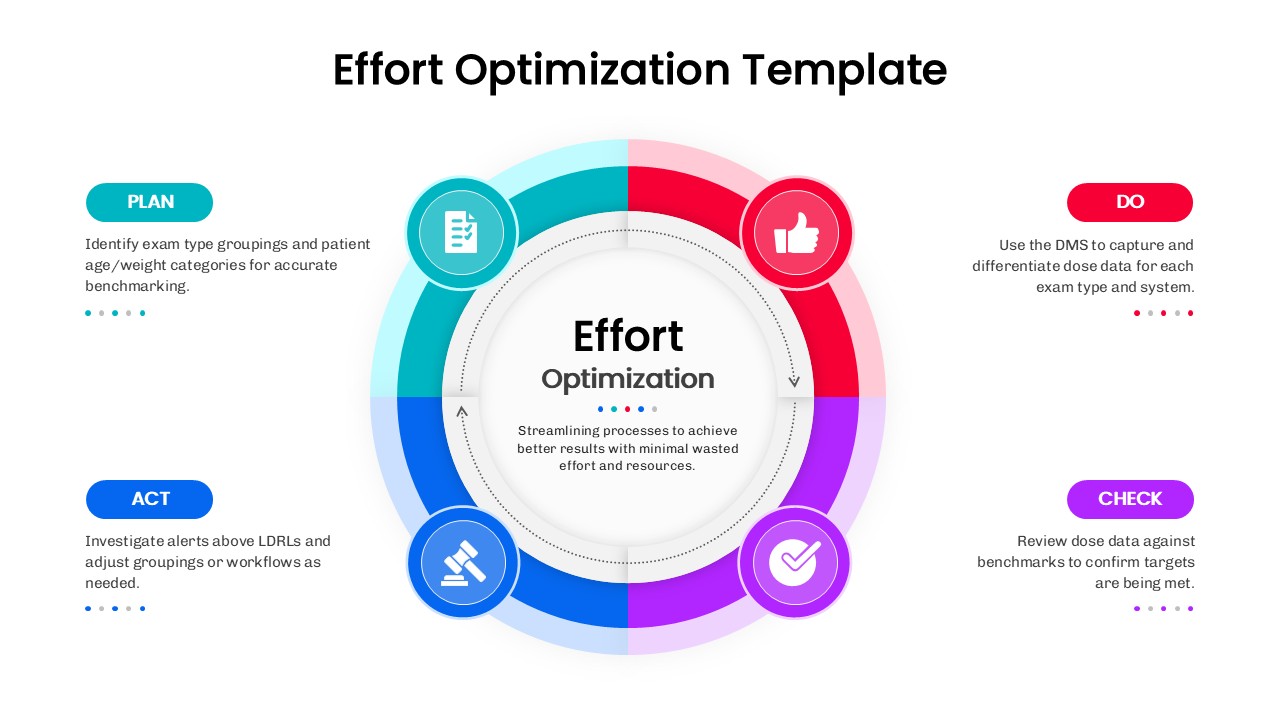
Effort Optimization PDCA Circle Diagram Template for PowerPoint & Google Slides
Circular
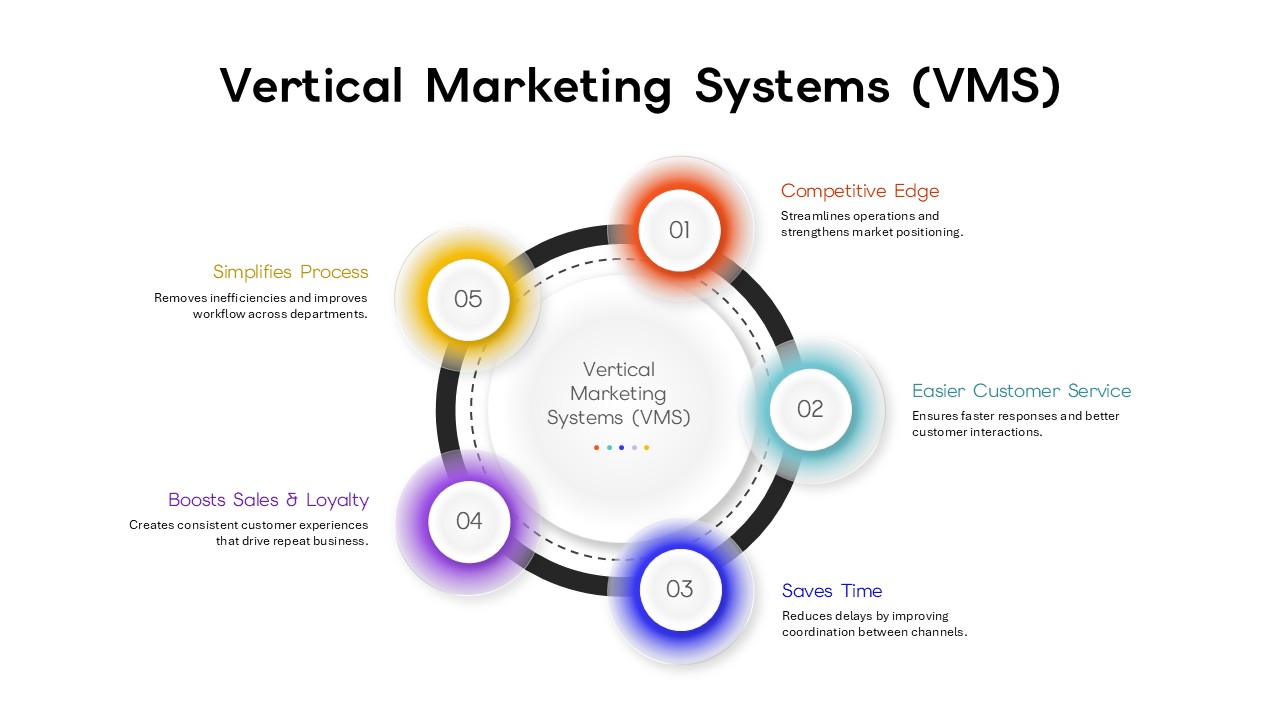
Vertical Marketing Systems (VMS) Circular Diagram Template for PowerPoint & Google Slides
Marketing