5 Why Fishbone Diagram for Root Cause Analysis in PowerPoint & Google Slides

Description
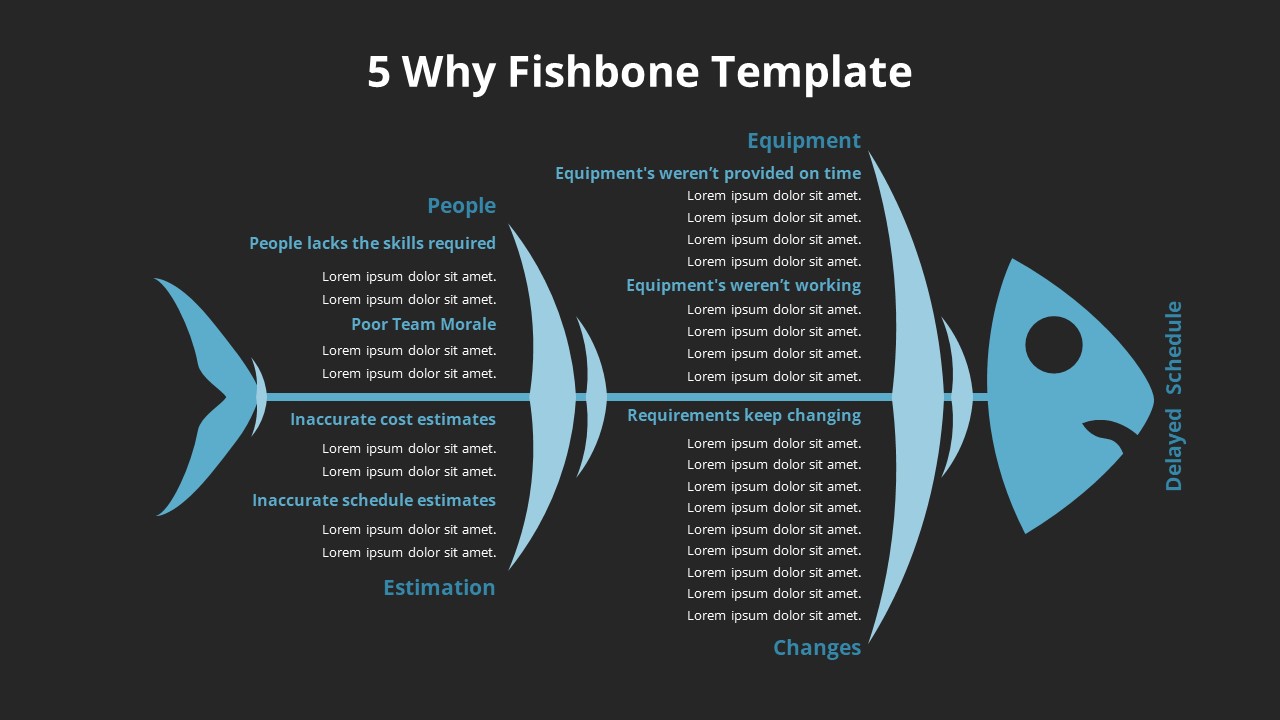
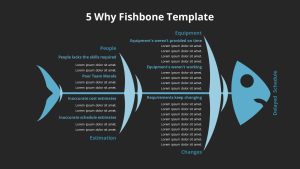
Streamline problem-solving with this 5 Why Fishbone Diagram slide, ideal for uncovering root causes in business or project challenges. Featuring a stylized fishbone layout, the template visually separates categories such as People, Equipment, Estimation, and Changes—each leading into a central spine that culminates in the core issue: Delayed Schedule. This structure encourages teams to explore contributing factors in a clear, methodical way.
Designed for quick comprehension, the diagram employs a consistent blue color scheme and legible fonts, making it presentation-ready for workshops, team reviews, and strategic planning meetings. Fully editable in both PowerPoint and Google Slides, the layout supports step-by-step analysis and can be adapted to various issues beyond time management.
Who is it for
Project managers, quality control teams, operations leads, business analysts, and consultants who need to illustrate root cause analysis processes effectively.
Other Uses
Can be repurposed for Six Sigma discussions, incident debriefs, product defect tracing, software issue mapping, or any scenario requiring visual cause-effect breakdowns.
Login to download this file

Item ID
SB04100
Related Templates

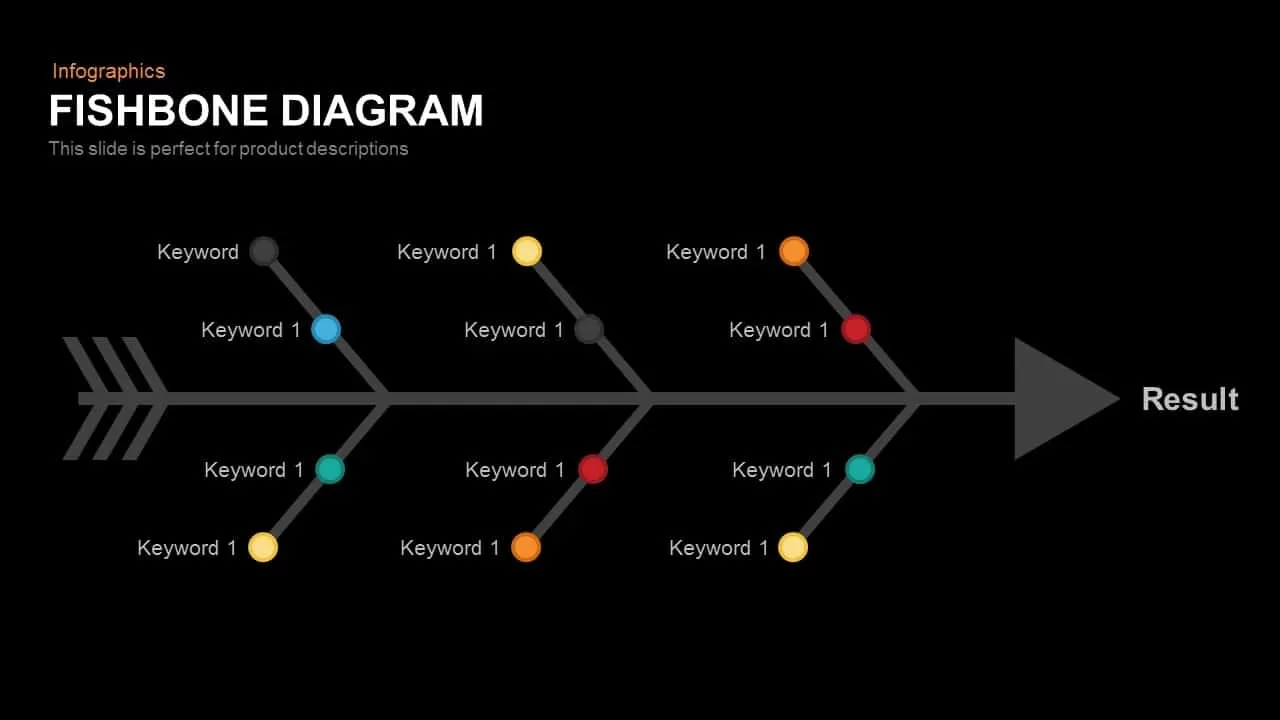
Fishbone Diagram Template
Process
Root Cause Analysis Template PowerPoint and Google Slides
Business Strategy
Sky and Tree Root Cause Analysis Deck Template for PowerPoint & Google Slides
Opportunities Challenges
Root Cause Analysis Infographic Pack Template for PowerPoint & Google Slides
Process
Free Root Cause Analysis PowerPoint Template
Process
Free
Fishbone Diagram Cause-and-Effect Template for PowerPoint & Google Slides
Process
Fishbone Cause and Effect Infographic Template for PowerPoint & Google Slides
Infographics
Fishbone Diagram Analysis Template for PowerPoint & Google Slides
Flow Charts
Three-Section Fishbone Process Diagram template for PowerPoint & Google Slides
Process
Fishbone RCA Diagram Template for PowerPoint & Google Slides
Business Strategy
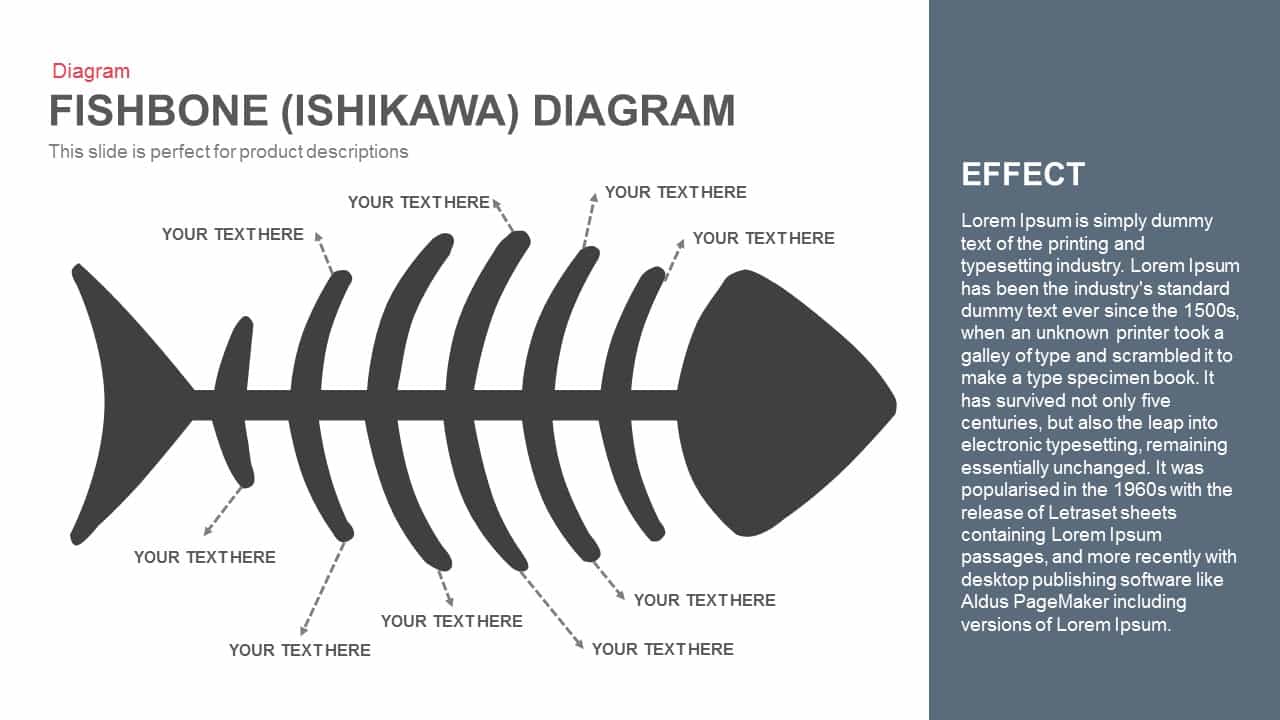
Fishbone (Ishikawa) Diagram for PowerPoint & Google Slides
Process
Fishbone Diagram Overview template for PowerPoint & Google Slides
Infographics
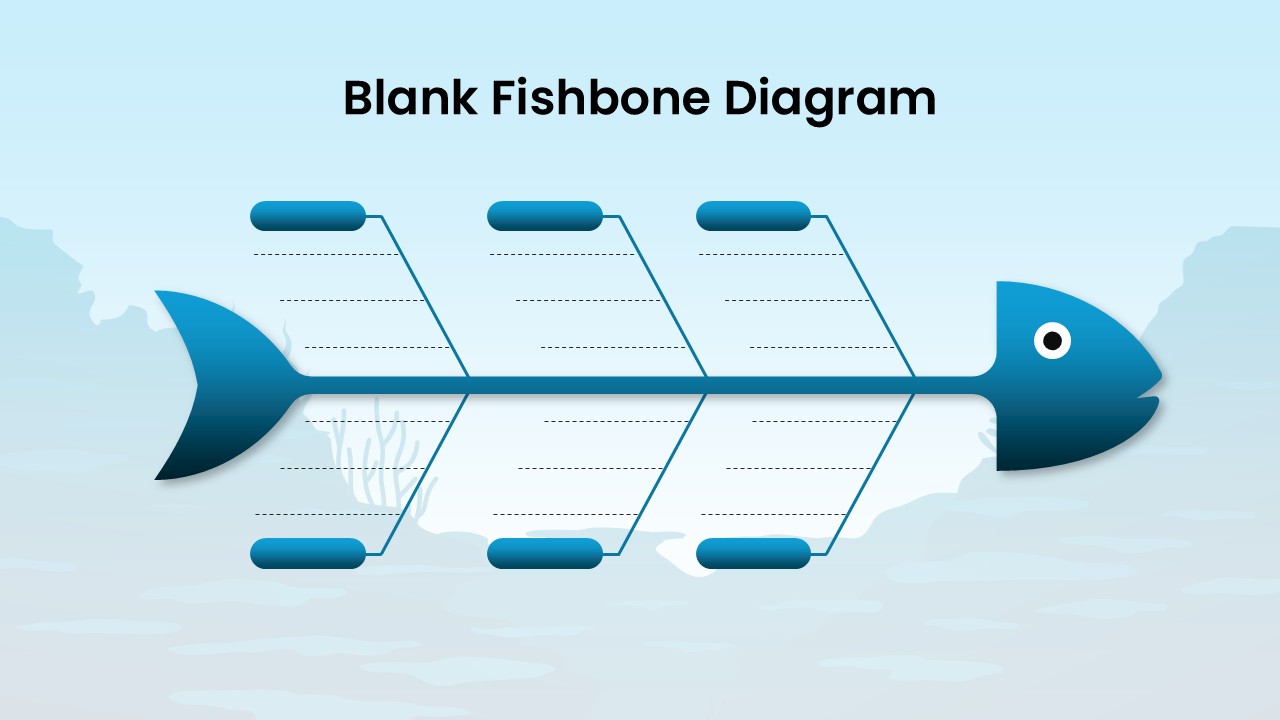
Blank Fishbone Diagram Template for PowerPoint & Google Slides
Process

Cause and Effect Diagram Infographic Template for PowerPoint & Google Slides
Bar/Column
Cause and Effect Diagram Template for PowerPoint and Google Slide
Process
Free Fishbone Diagram PowerPoint Template
Project
Free
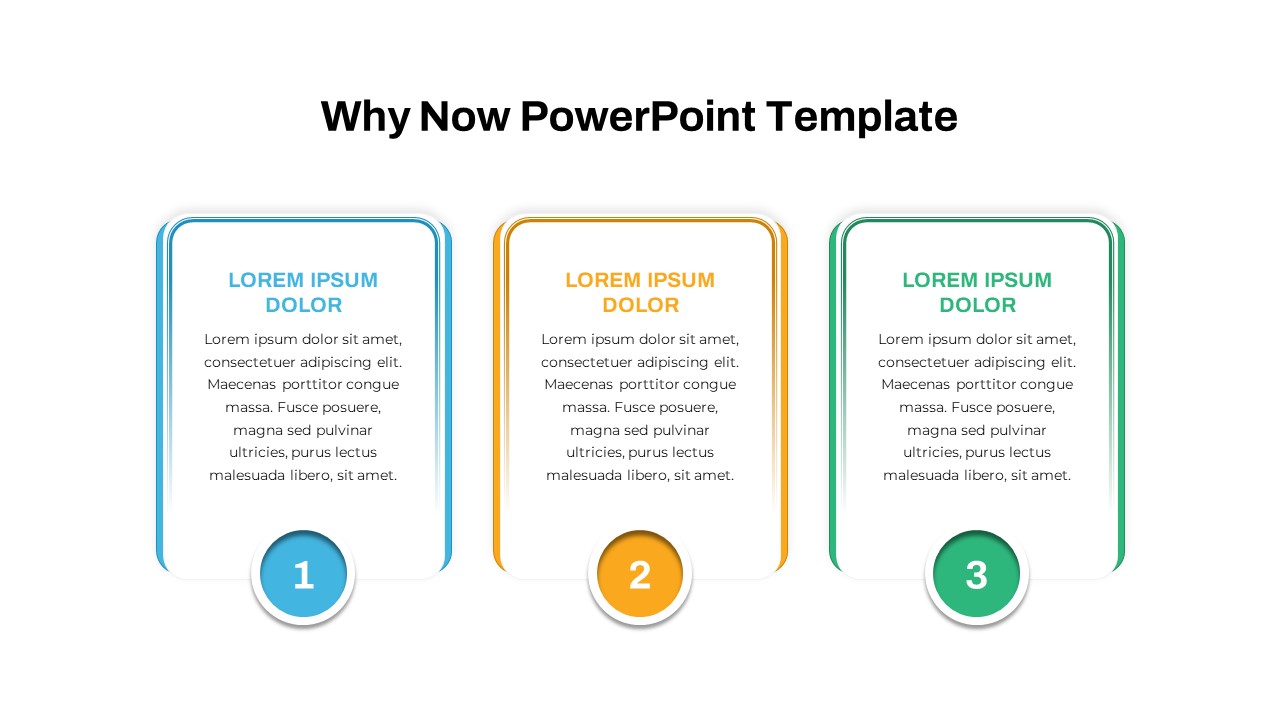
Why Now Numbered Cards Presentation Template for PowerPoint & Google Slides
Process
Cause and Effect Template for PowerPoint & Google Slides
Arrow
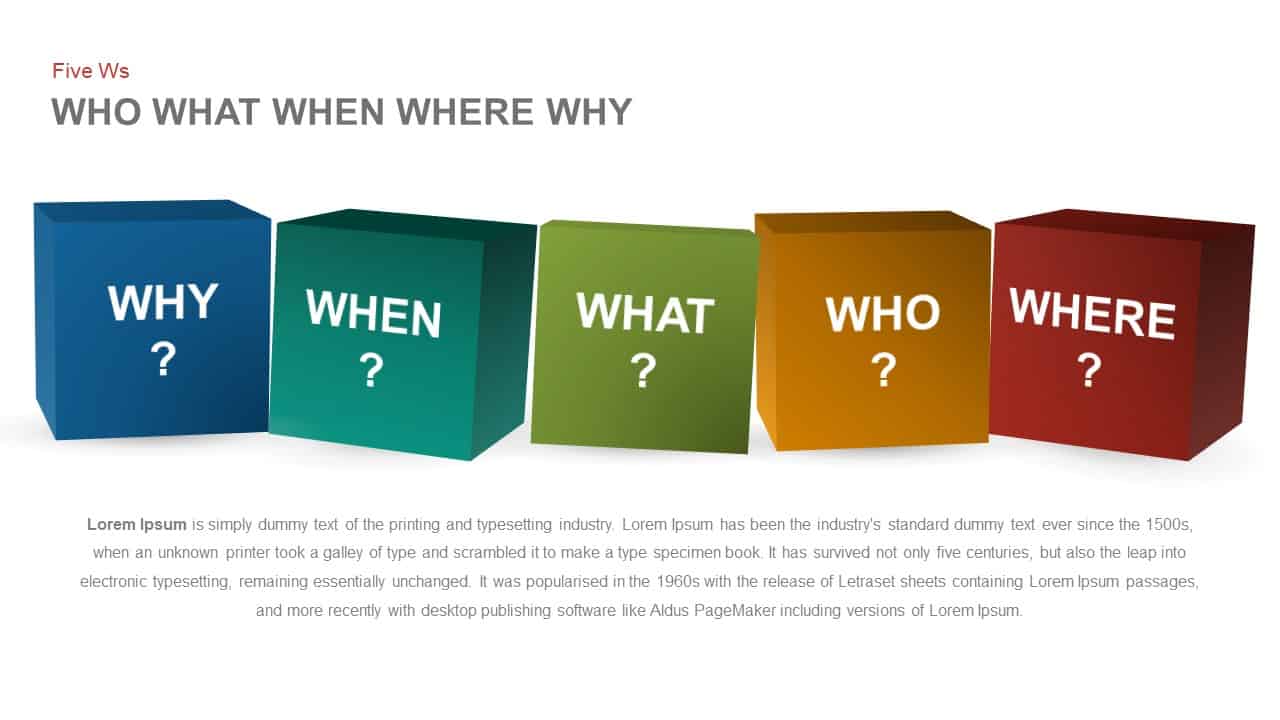
Who What When Where Why – Five Ws PowerPoint Template
Comparison
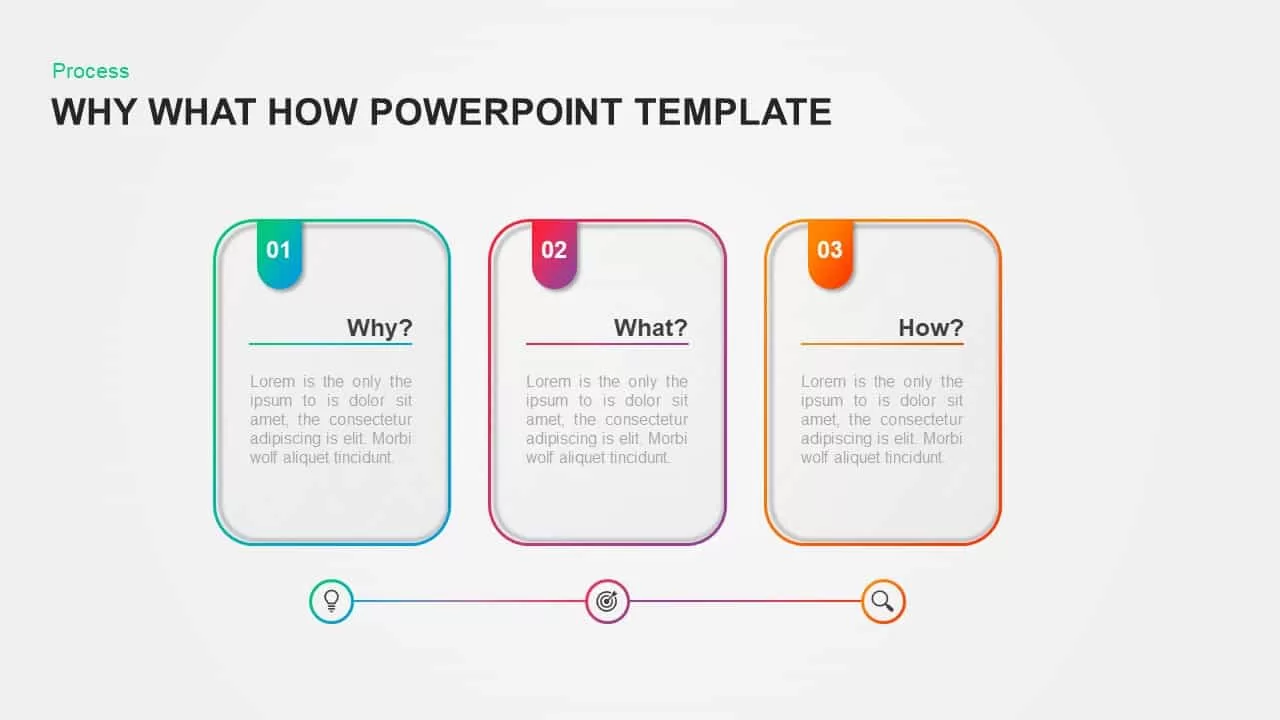
Why What How Process PowerPoint Template
Process