













Fishbone Diagram PPT Template and Google Slide
Fishbone Diagram PowerPoint Template
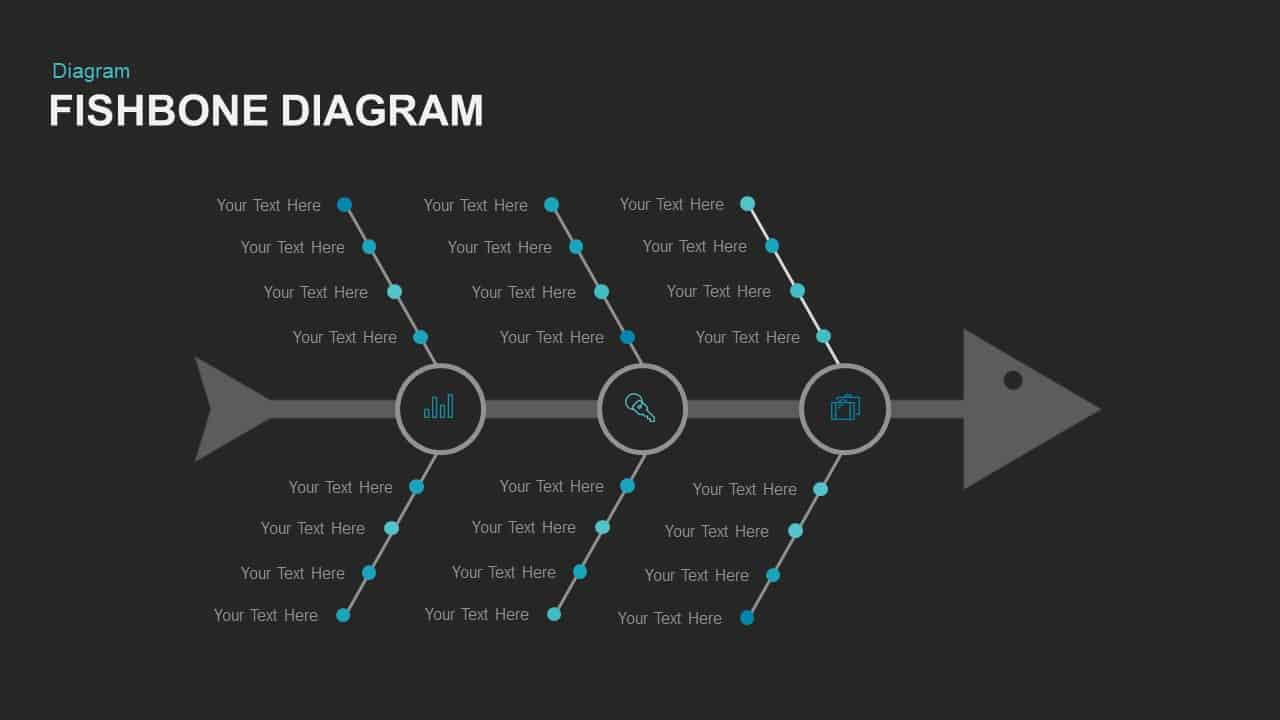
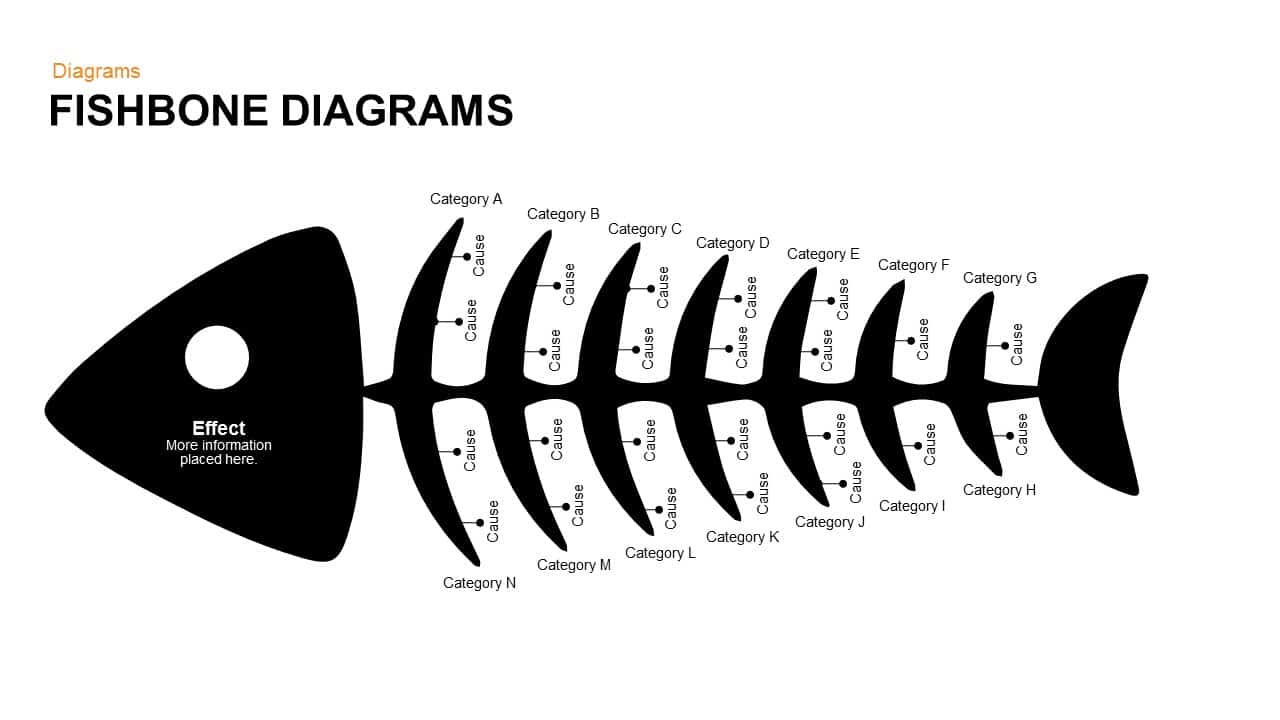
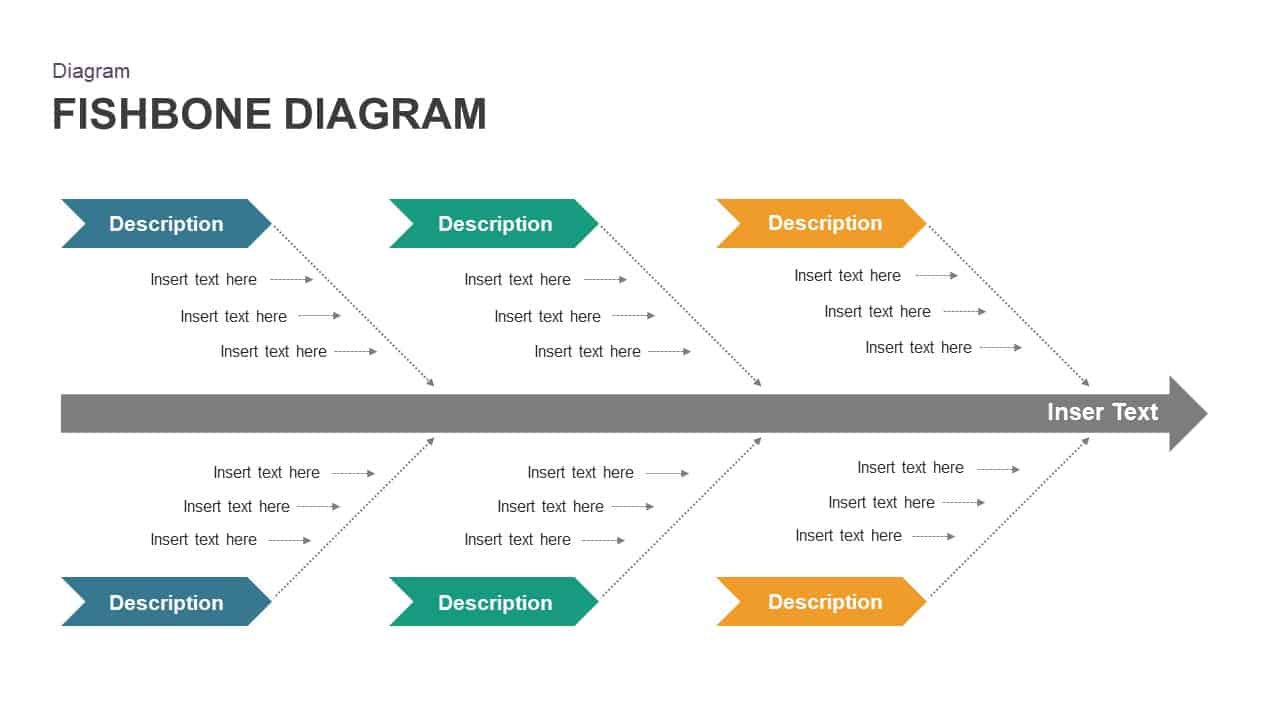
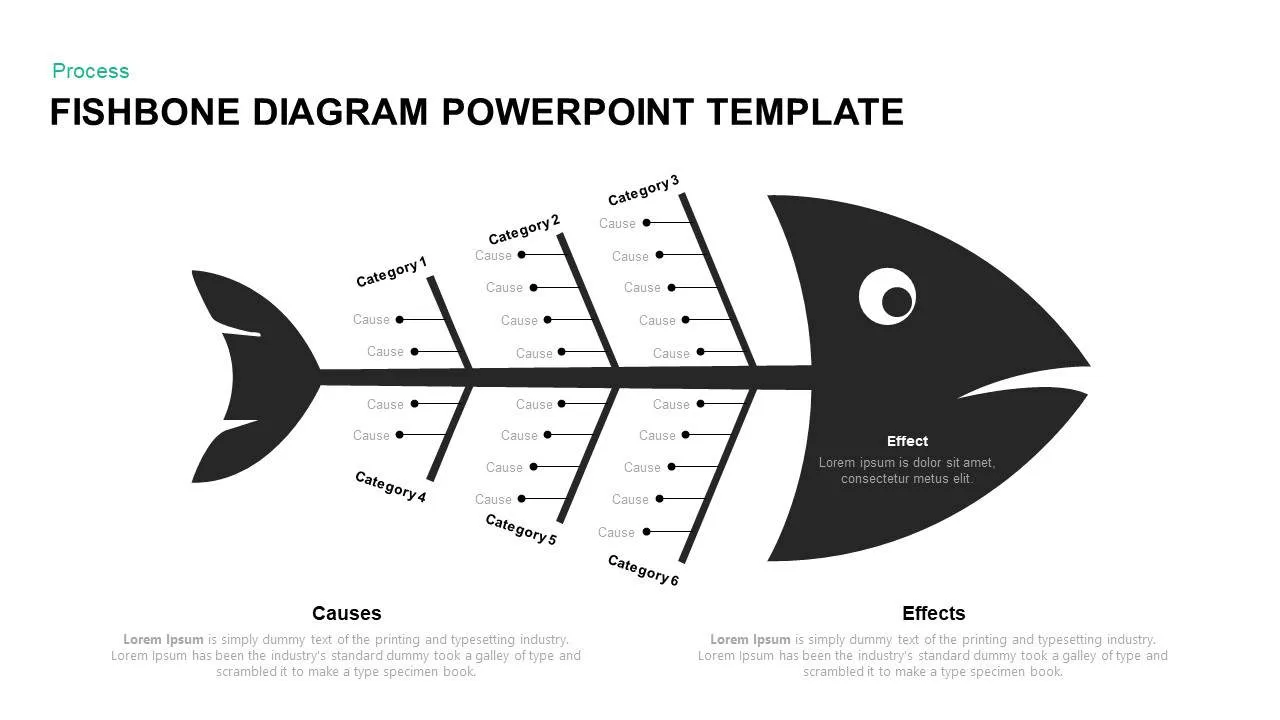
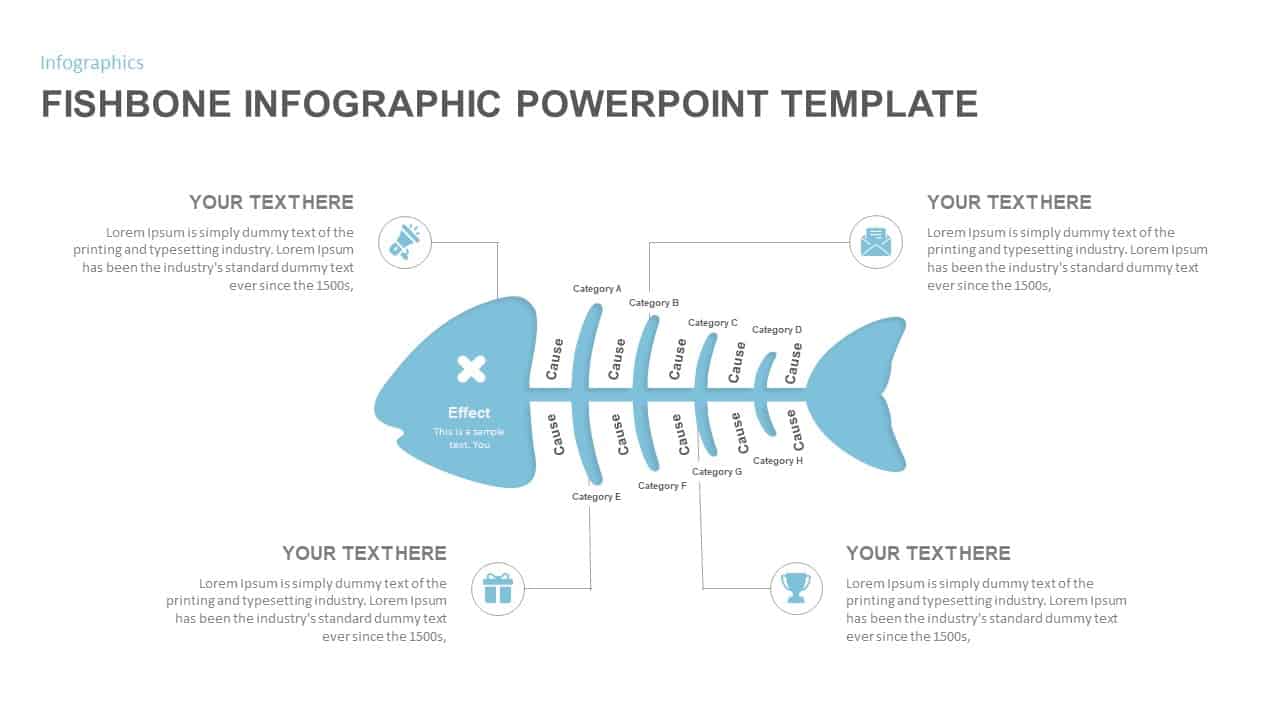
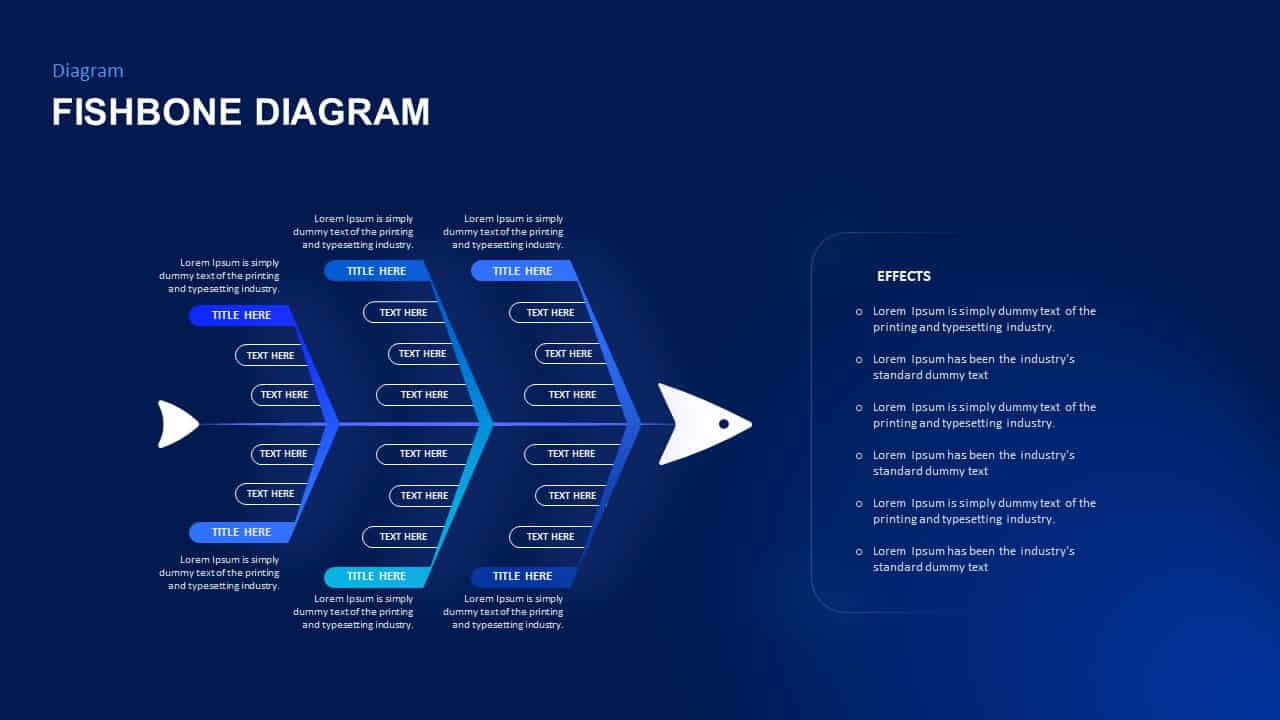
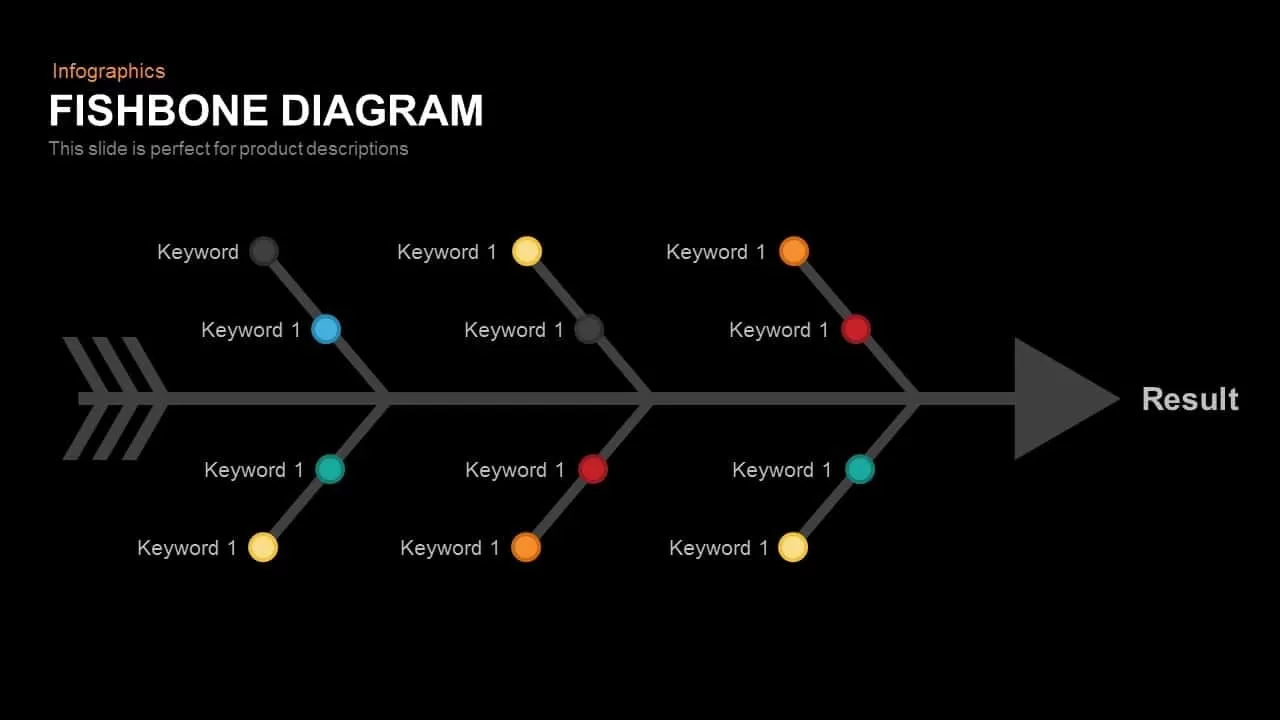
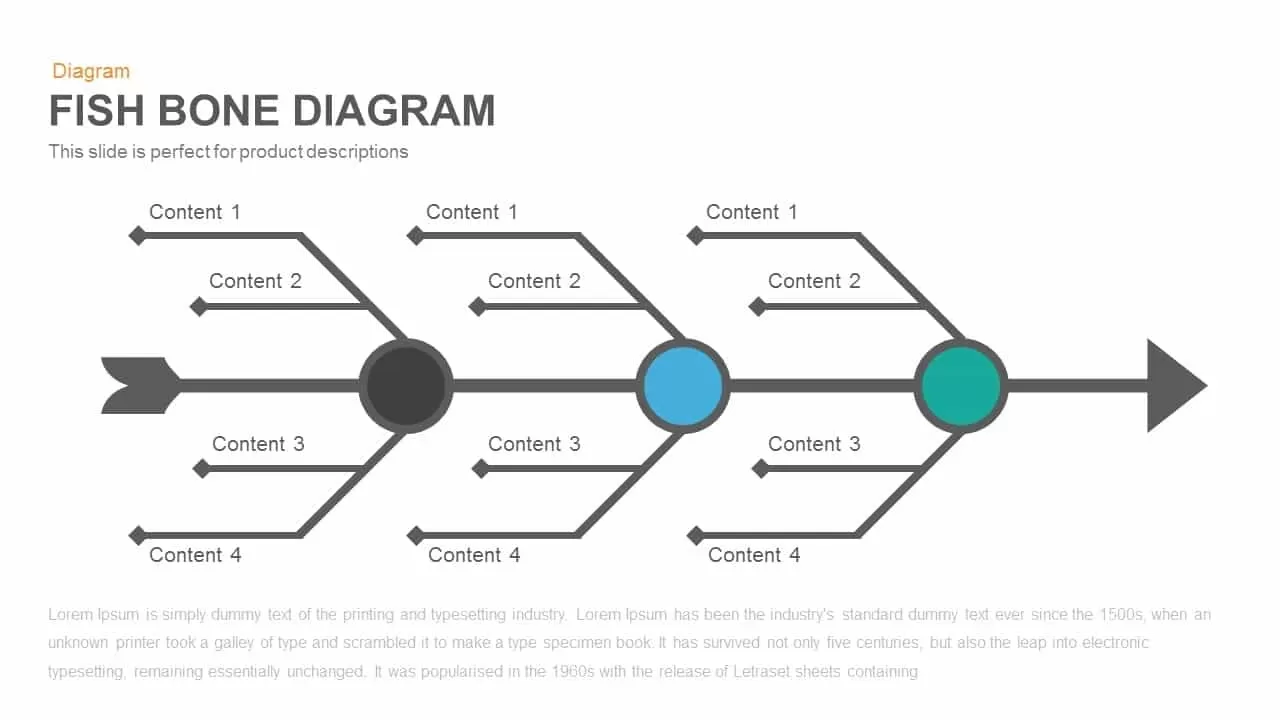
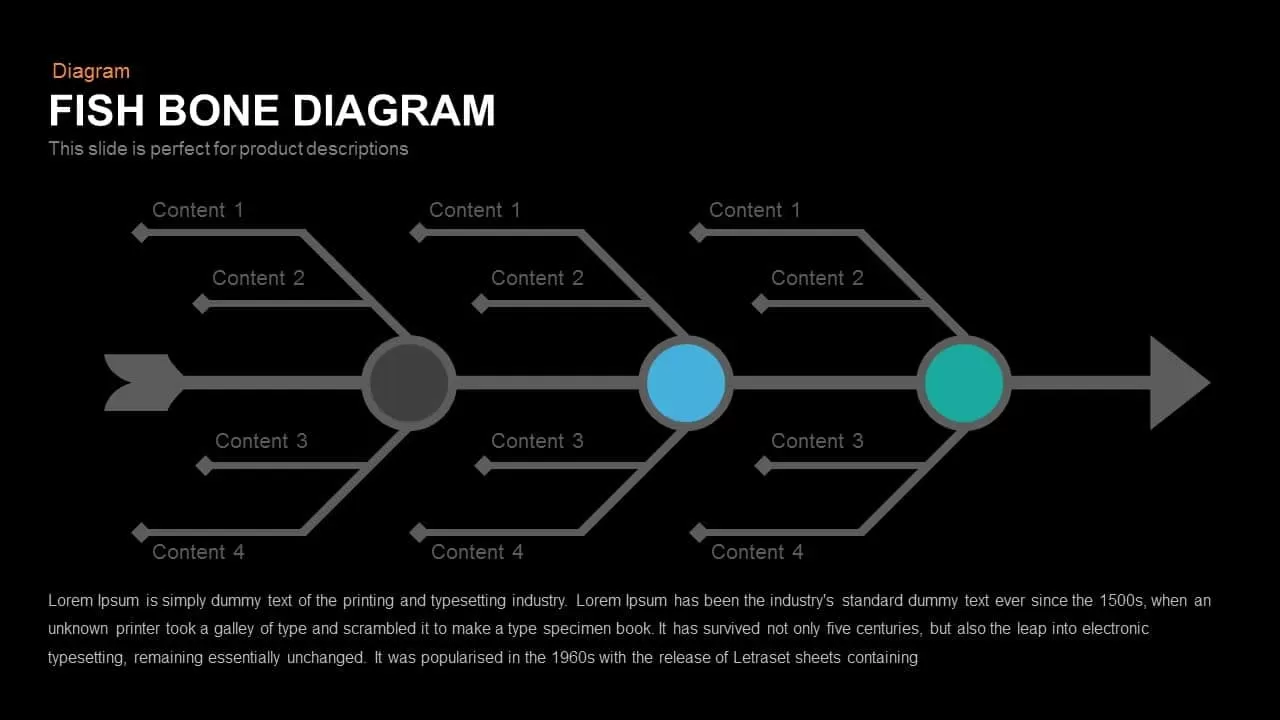
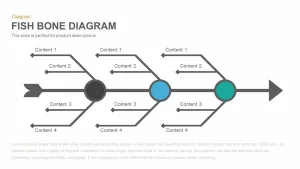
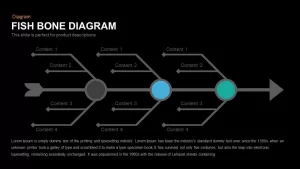
Fishbone diagram PPT template is a simple yet inspired template used for steps or stages that are connected together to obtain a single result. Formed in the figure of a fishbone, the template illustration is made of circles, straight lines, and arrowhead. Three circles are illustrated on the spine arrow and each circle has two branches emerging and connecting on both sides of the circle, this pattern is repeated for the other two circles as well. Henceforth, six branches are seen on one side of the bone and six branches on the other side of the bone. You have an option to write content or heading on all branches, a total of 12, and a text box below to write a detailed long description of the same.
Fishbone Diagram PPT template is available in the black and white background and can be used to represent management hierarchy, a continuous process or departmental divisions; it will surely be a novel presentation idea. The fishbone design allows customization of the shapes and effects. Users can modify or change the text font and background colours. The template is designed in both PowerPoint and Google Slide in both the aspect ratio 4:3(Normal) and 16:9 (widescreen).
To exhibit the cause and effect relationship of the theories variables and concepts; the fishbone diagram PowerPoint template is a perfect one. This diagram design is used to classify the facts behind an occurrence. Here, the presenter can give details of different causes and their possibilities to create an effect; the cause and effect relationship between a product and consumer attitude can be analyzed and verified through this three-layered fishbone diagram PowerPoint template. They are generally used in postmortem activities in order to understand which and where the factors made an effect. The structure of the diagram consists of a head, bone, and spine. This is for scientific and theoretically sounded professional presenters.
Login to download this file

Item ID
SB00220


Related Templates

Fishbone Diagram Cause-and-Effect Template for PowerPoint & Google Slides
Process
Blank Fishbone Diagram Template for PowerPoint & Google Slides
Process
Fishbone (Ishikawa) Diagram for PowerPoint & Google Slides
Process
5 Why Fishbone Diagram for Root Cause Analysis in PowerPoint & Google Slides
Process
Fishbone Diagram PowerPoint Template
Infographics
Free Fishbone Diagram PowerPoint Template
Project
Free
Fishbone Diagram Template PowerPoint
Flow Charts
Fishbone Diagram PowerPoint Template
Infographics
Fishbone Diagram Template
Process
Fishbone PowerPoint Template
Business Strategy
Fishbone Infographic PowerPoint Template
Process
Fishbone Template for PowerPoint Presentation
Infographics
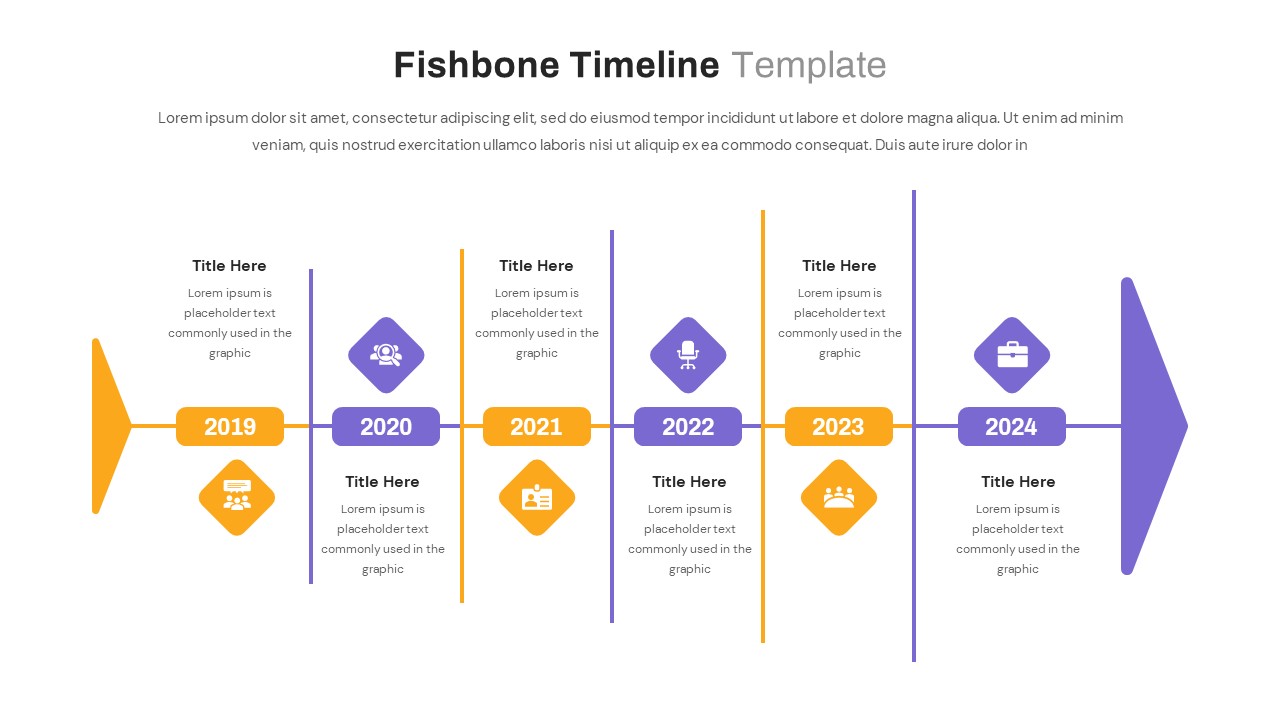
Fishbone Timeline Template
Manufacturing

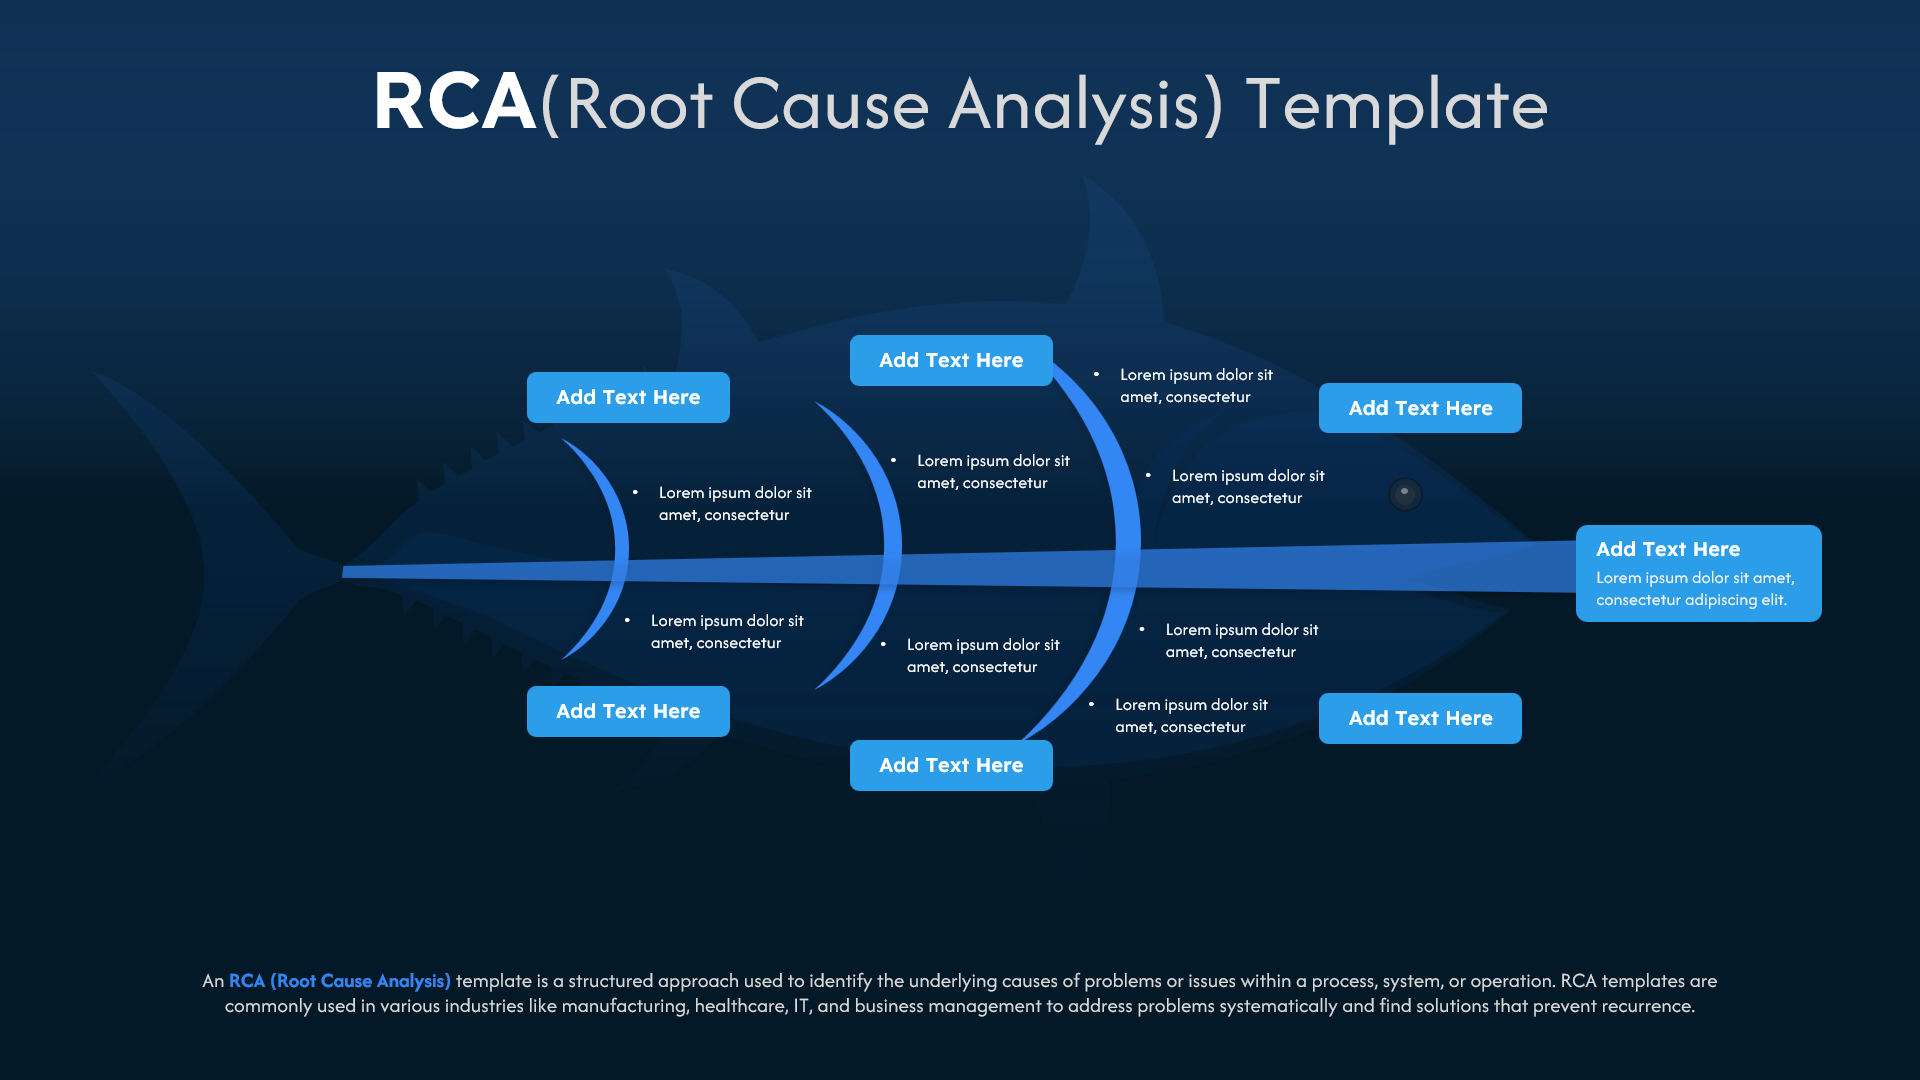
Fishbone RCA Template for Root Cause Analysis
Business
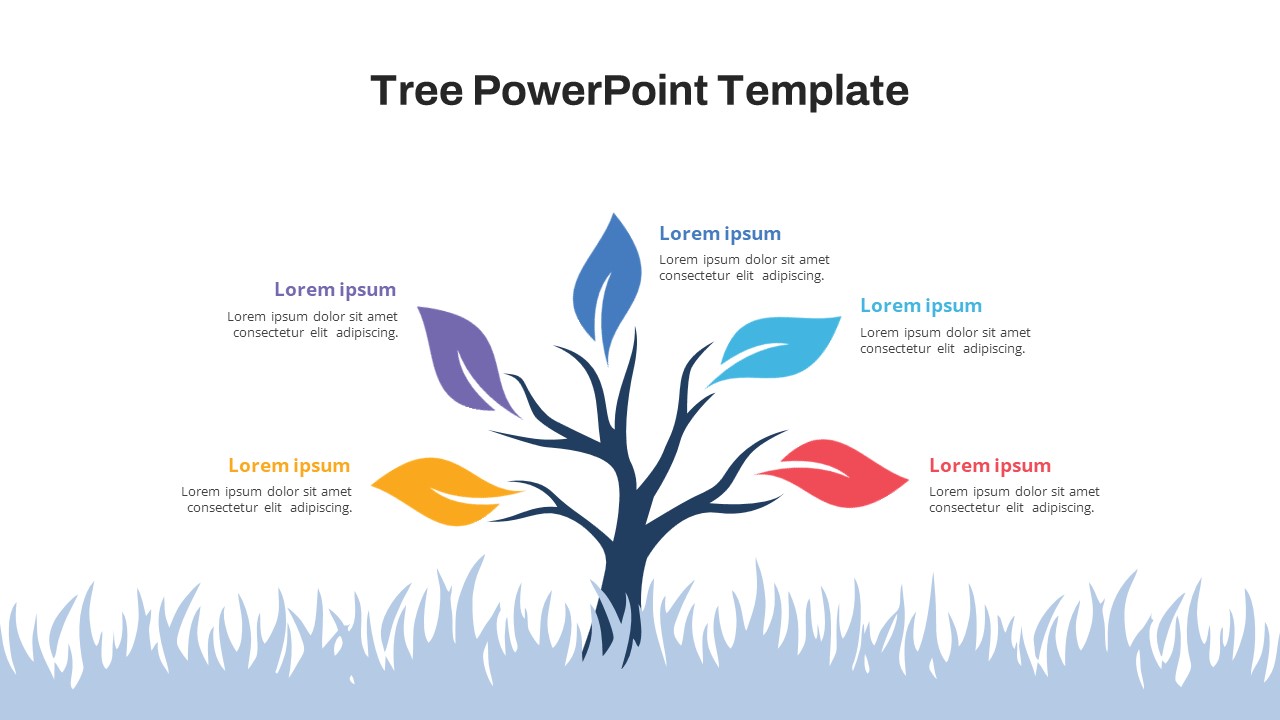
Tree Diagram Slide Template Free for PPT and Google Slides
Infographics
Free
Free Welcome PPT Template Slides for PPT & Google Slides
Free
Free
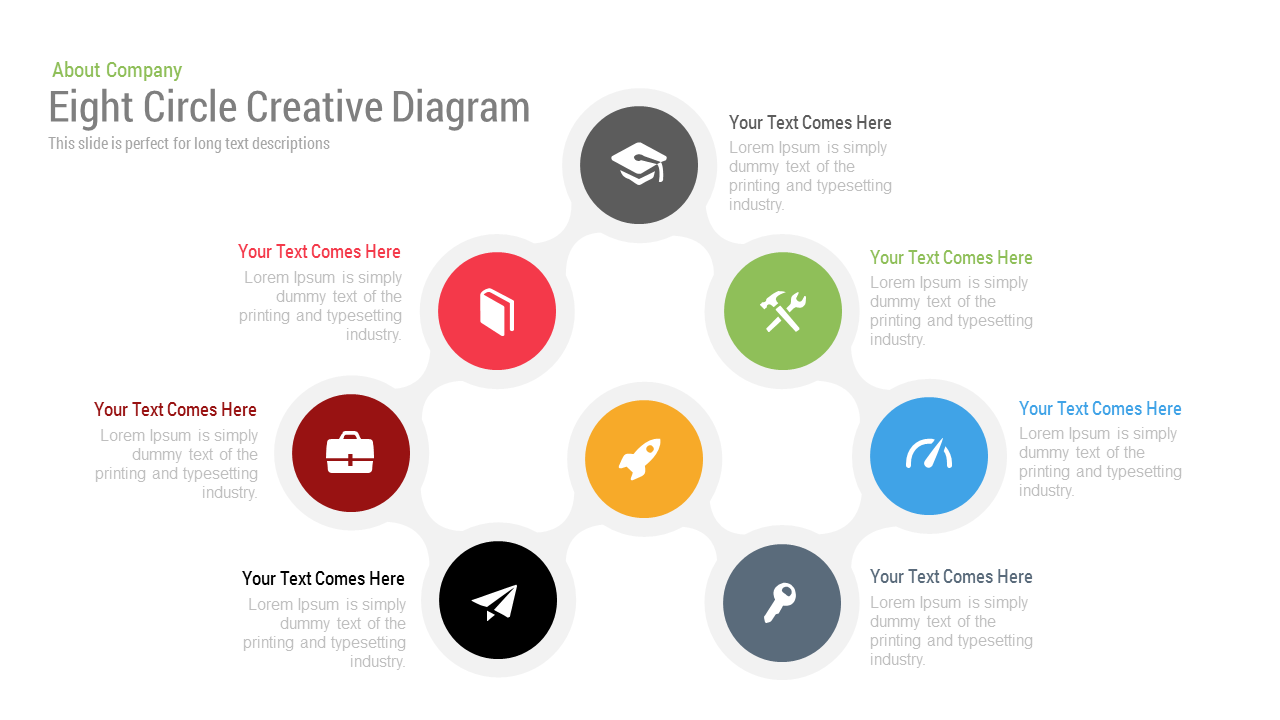
Free Eight Circle Creative Diagram Template for PPT & Google Slides
Circular
Free
Venn Diagram PPT Template and Google Slides
Circular
Free 3D Funnel Diagram Template for PPT & Google Slides
Funnel
Free
Product Roadmap Template – Timeline Diagram PPT & Google Slides
Project Status