


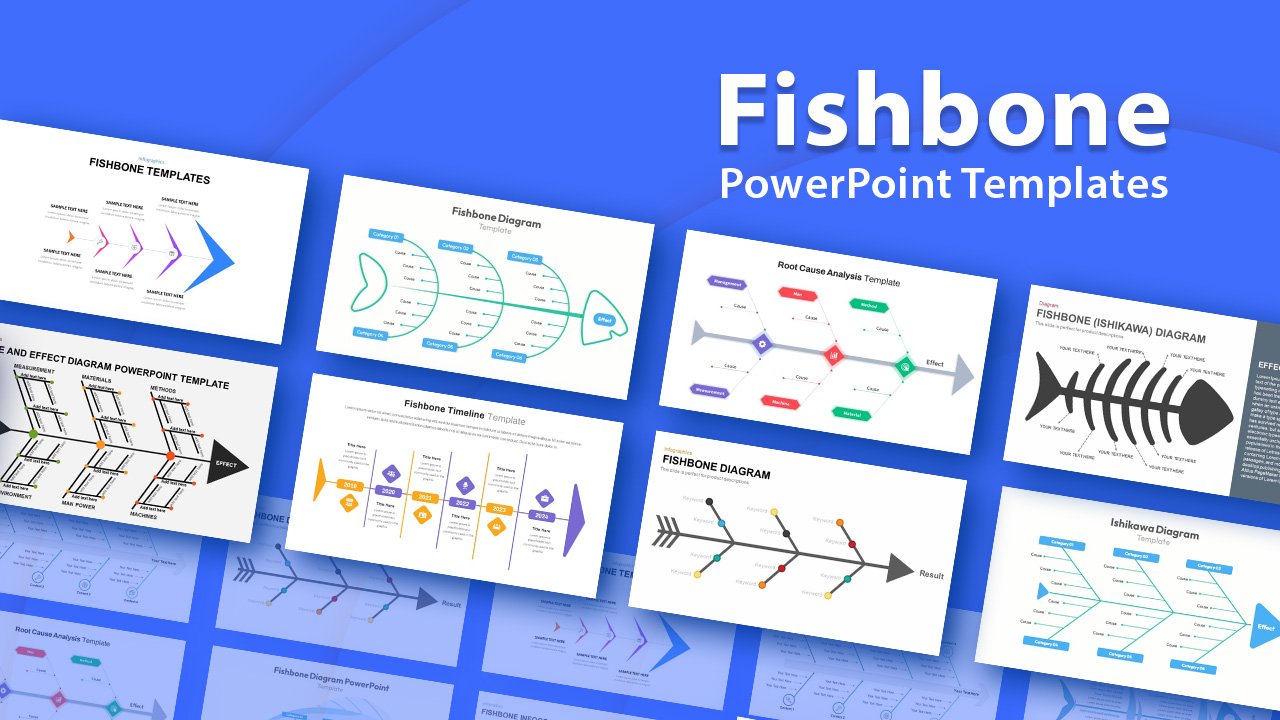
Fishbone PowerPoint Templates and Keynote Diagram
Download our editable fishbone PowerPoint templates and keynote which are useful in analyzing the roots of complex problems. These templates boast impressive graphics that vividly depict a multitude of potential causes behind a specific issue or outcome.
![]() Filter
Filter
Filter
-
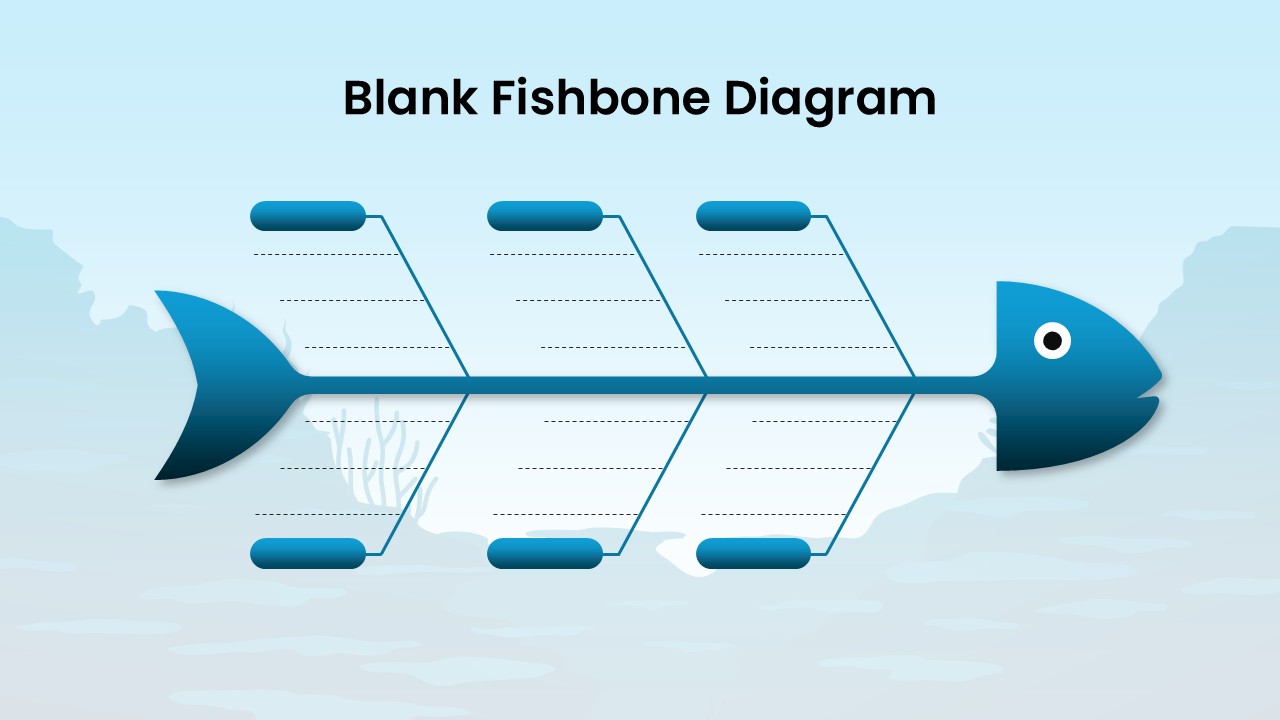
Blank Fishbone Diagram Template for PowerPoint & Google Slides
Process
-
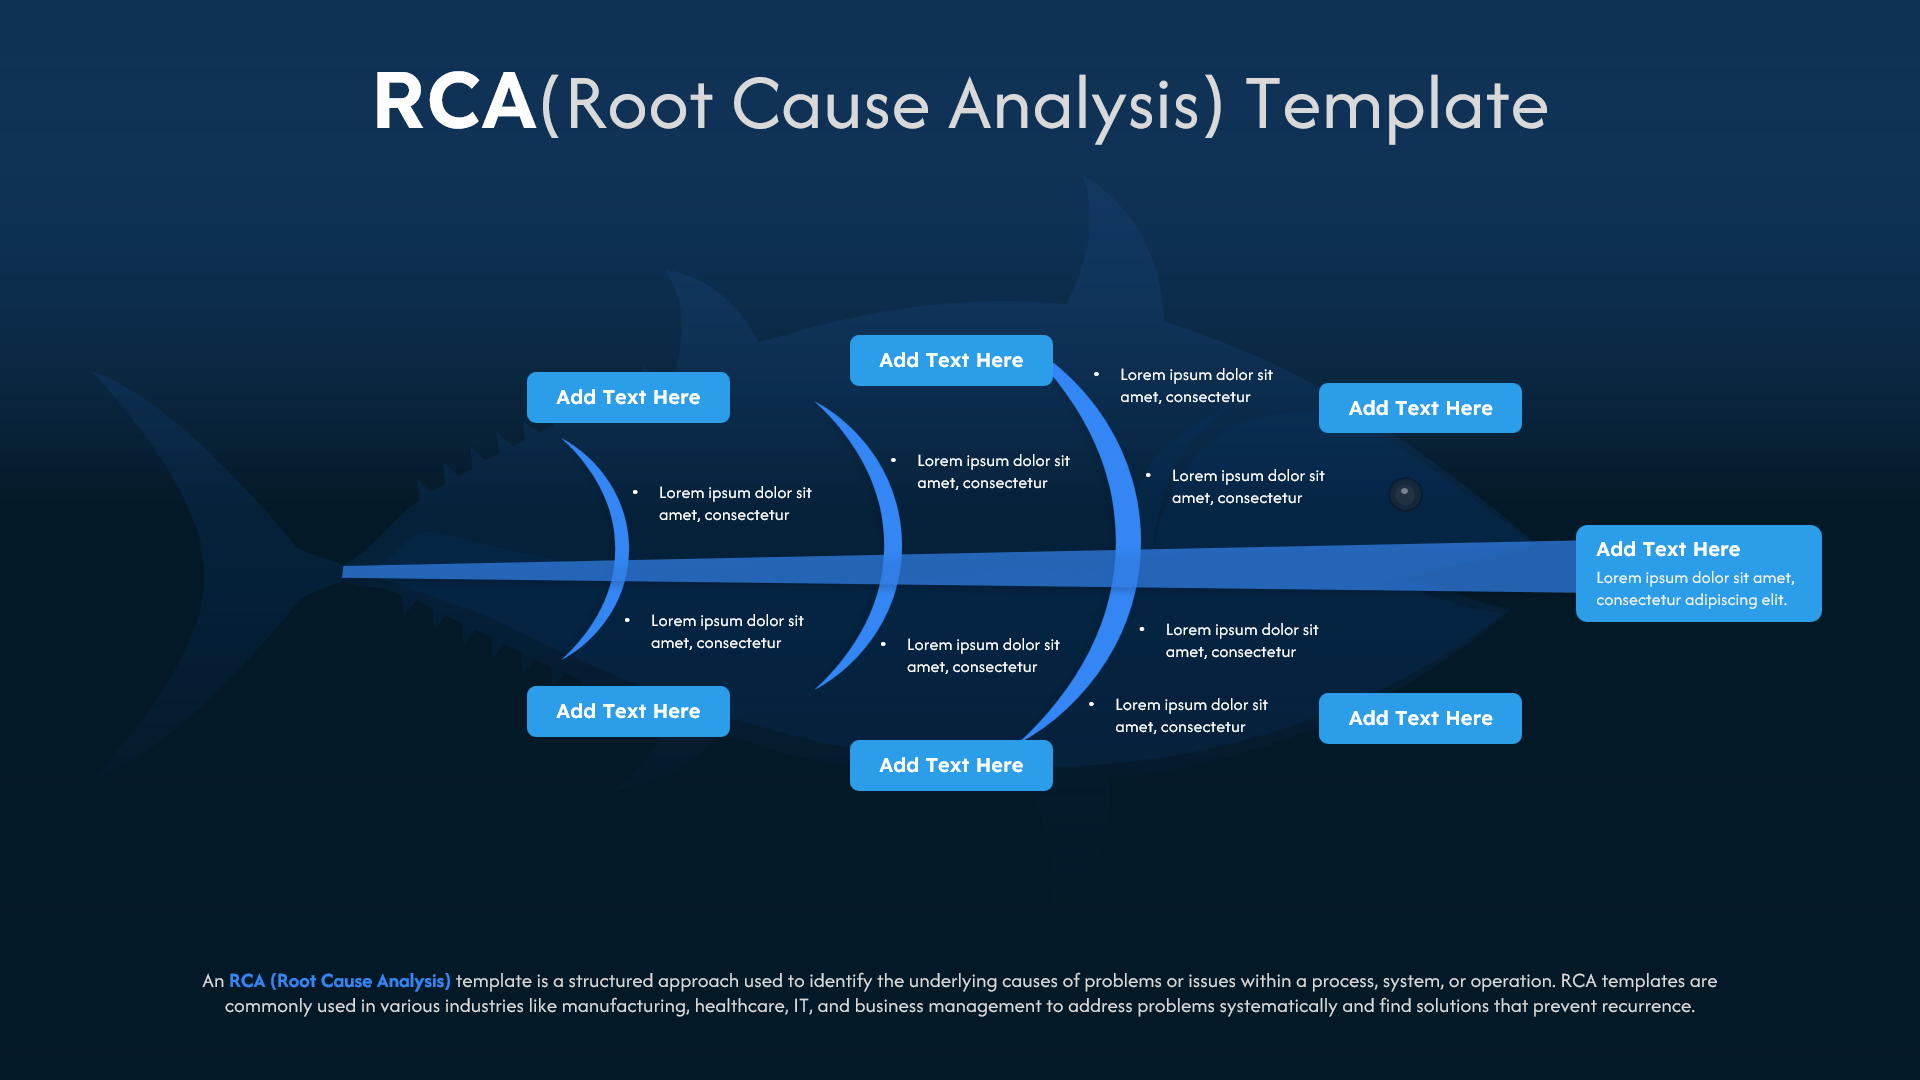
RCA Template for PowerPoint & Google Slides
Business
-

5 Why Fishbone Diagram for Root Cause Analysis in PowerPoint & Google Slides
Process
-

Free Root Cause Analysis PowerPoint Template
Process
Free
-

Fishbone Timeline Template
Manufacturing
-

Root Cause Analysis Infographic Pack Template for PowerPoint & Google Slides
Process
-

Fishbone Template for PowerPoint Presentation
Infographics
-

Sky and Tree Root Cause Analysis Deck Template for PowerPoint & Google Slides
Opportunities Challenges
-

Fishbone Infographic PowerPoint Template
Process
-

Root Cause Analysis Template PowerPoint and Google Slides
Business Strategy
-

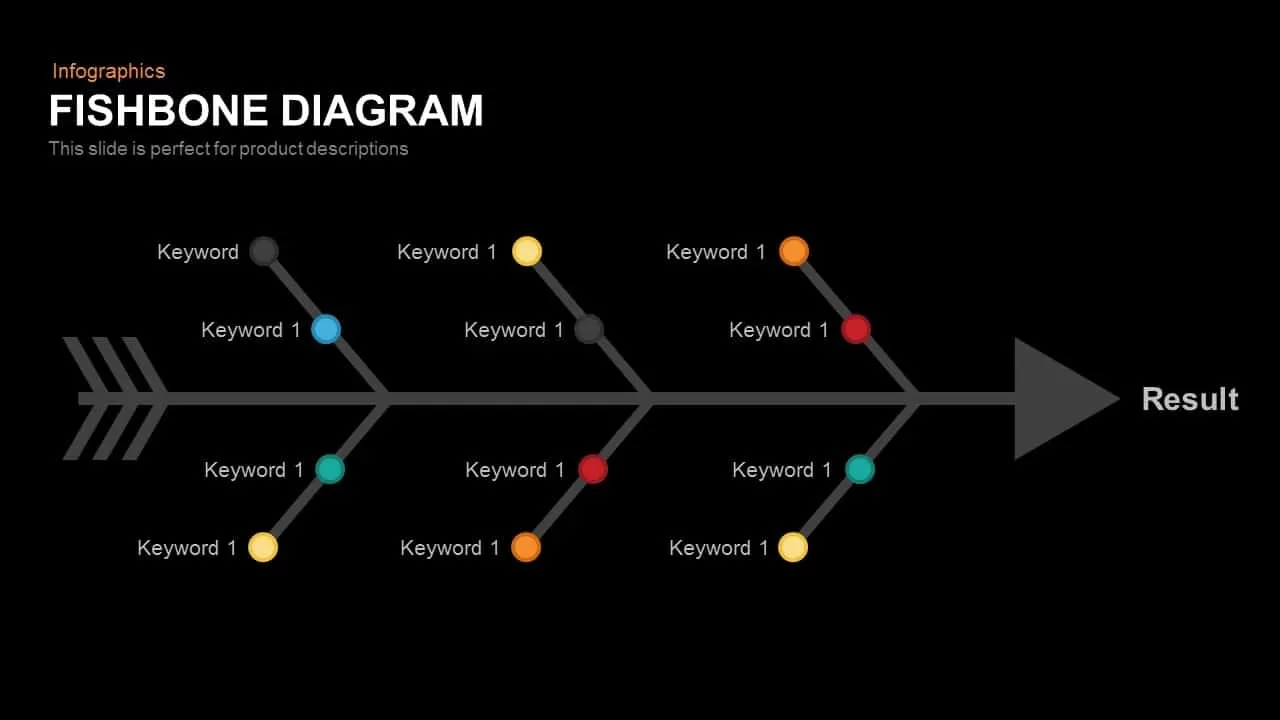
Fishbone Diagram Template
Process
-

Fishbone Cause and Effect Infographic Template for PowerPoint & Google Slides
Infographics
-

Fishbone Diagram Analysis Template for PowerPoint & Google Slides
Flow Charts
-

Cause and Effect Diagram Template for PowerPoint and Google Slide
Process
-

Free Fishbone Diagram PowerPoint Template
Project
Free
-

Fishbone Diagram Cause-and-Effect Template for PowerPoint & Google Slides
Process
-

Fishbone Diagram Overview template for PowerPoint & Google Slides
Infographics
-
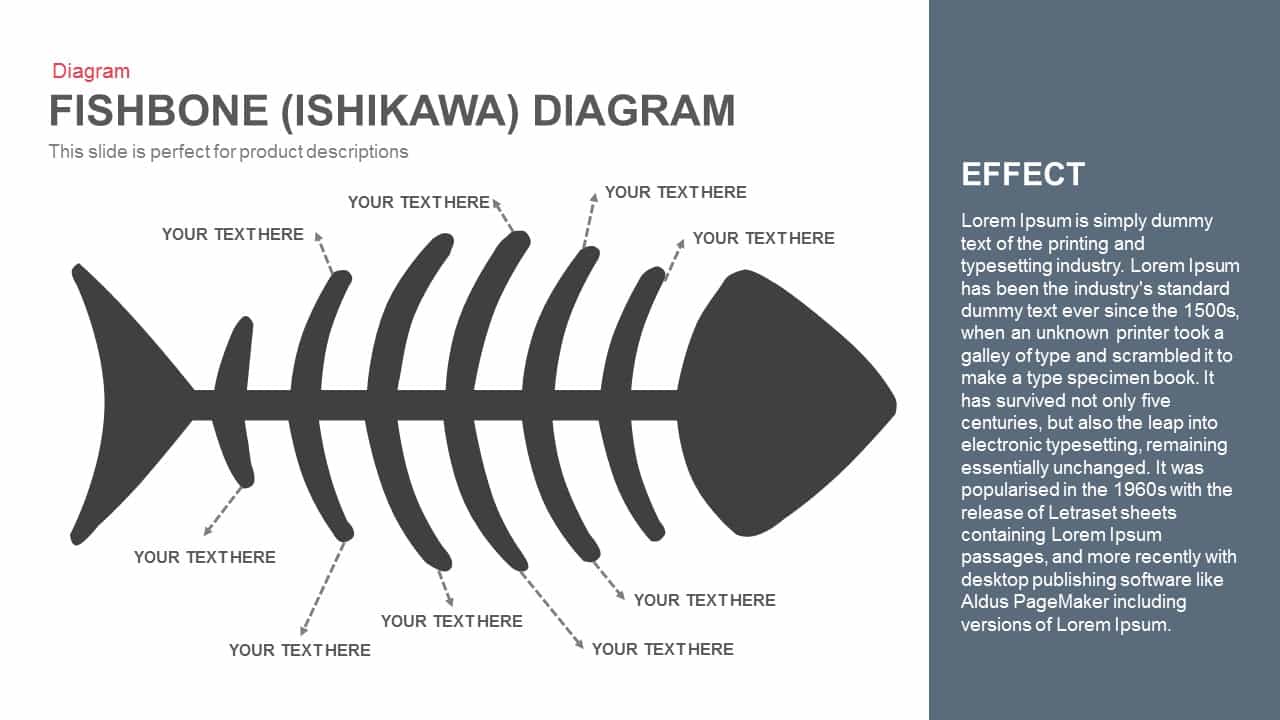
Fishbone (Ishikawa) Diagram for PowerPoint & Google Slides
Process
-
Fishbone RCA Diagram Template for PowerPoint & Google Slides
Business Strategy
-

Three-Section Fishbone Process Diagram template for PowerPoint & Google Slides
Process
 This is especially valuable when quantitative data is scarce. By downloading and incorporating fishbone diagram powerpoint templates into your PowerPoint presentations, you can elevate your discussions in fields such as manufacturing, sales, and marketing. The application of the Six Sigma methodology through these editable fishbone diagram templates can prove to be a game-changer for startups and entrepreneurs across various industries.
Each bone of the fish reveals the causes and the head indicates the effect. It enables the presenter to analyze and list the reasons, and errors in an organized way. It also allows the presenter to showcase various aspects of the problem from different angles.
The fishbone diagram PowerPoint template acts as a graphical tool for the presenter. Using it the user can do the proper analysis of the outcomes and the conclusions with cemented proof and data can also be discussed among the audience. Take advantage of the collection of our fishbone diagram template for PowerPoint to enhance your presentation. Also, check out what is six sigma and the list of Best Six Sigma PowerPoint Templates.
This is especially valuable when quantitative data is scarce. By downloading and incorporating fishbone diagram powerpoint templates into your PowerPoint presentations, you can elevate your discussions in fields such as manufacturing, sales, and marketing. The application of the Six Sigma methodology through these editable fishbone diagram templates can prove to be a game-changer for startups and entrepreneurs across various industries.
Each bone of the fish reveals the causes and the head indicates the effect. It enables the presenter to analyze and list the reasons, and errors in an organized way. It also allows the presenter to showcase various aspects of the problem from different angles.
The fishbone diagram PowerPoint template acts as a graphical tool for the presenter. Using it the user can do the proper analysis of the outcomes and the conclusions with cemented proof and data can also be discussed among the audience. Take advantage of the collection of our fishbone diagram template for PowerPoint to enhance your presentation. Also, check out what is six sigma and the list of Best Six Sigma PowerPoint Templates.