Data Studio Insights template for PowerPoint & Google Slides


Description
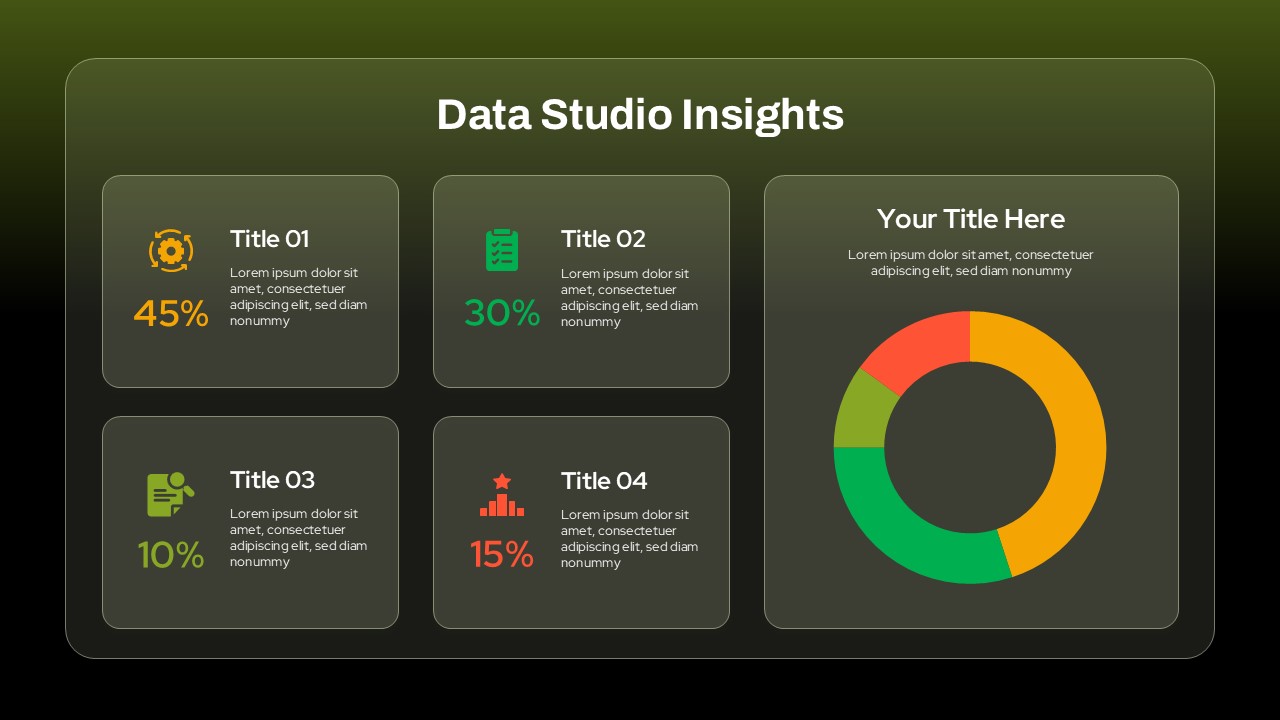
This Data Studio Insights template provides a sleek and organized layout for presenting analytical data and performance metrics. Featuring a clean design with color-coded sections for each insight, this slide makes it easy to display percentages and details across multiple categories. The inclusion of a central pie chart allows for a clear visual representation of data breakdowns, ideal for showcasing key insights in business, marketing, or performance reviews.
With sections to include titles, descriptions, and relevant data percentages (e.g., 45%, 30%, 10%, 15%), this template supports a structured and professional presentation style. Perfect for stakeholders or teams needing to report on data analysis, trends, and results, it ensures that all key points are clearly communicated.
Who is it for
This template is suited for data analysts, business managers, marketing professionals, and anyone involved in data presentation. It’s especially beneficial for individuals presenting data reports in meetings, sales, or marketing strategies.
Other Uses
Besides business insights, this template can also be adapted for educational purposes, offering a clear breakdown of research results, survey findings, or performance evaluations. It can also be used for project status reports or any situation where multiple data points need to be presented in an organized and visually appealing format.
Login to download this file

Item ID
SB05240
Related Templates

Data Analysis Bar Chart with Insights Template for PowerPoint & Google Slides
Bar/Column
Free
Creative Studio PowerPoint Template for PowerPoint & Google Slides
Decks
Architecture Design Studio Template for PowerPoint & Google Slides
Company Profile
Checkmate Slide for Strategic Insights Template for PowerPoint & Google Slides
Accomplishment
Finance AI Strategy & Insights Template for PowerPoint & Google Slides
AI
Key Insights Process Template for PowerPoint & Google Slides
Process
Landing Pages Optimization Insights Template for PowerPoint & Google Slides
Marketing Funnel
Focus Group Discussion and Insights Template for PowerPoint & Google Slides
Customer Experience
Customer Interview Insights Dashboard Template for PowerPoint & Google Slides
Customer Experience
Data Science PowerPoint Presentation Template for PowerPoint & Google Slides
Pitch Deck
Data Center PowerPoint Template for PowerPoint & Google Slides
Information Technology

Creative data chart analytics template for PowerPoint & Google Slides
Charts
Mobile Data Analysis Chart template for PowerPoint & Google Slides
Charts
World Map Data template for PowerPoint & Google Slides
World Maps
Circle Chart Data template for PowerPoint & Google Slides
Pie/Donut
Creative Data Analysis Bar Chart template for PowerPoint & Google Slides
Bar/Column

Smartphone Data User template for PowerPoint & Google Slides
Charts
Interactive US Population Data Map Slide Template for PowerPoint & Google Slides
World Maps
3D Bar Chart Data Infographics Template for PowerPoint & Google Slides
Bar/Column
3D Stacked Infographic Layers Data Template for PowerPoint & Google Slides
Pyramid
Circle Graph Data Visualization Template for PowerPoint & Google Slides
Circular
Pencil Bar Chart Data Analysis Template for PowerPoint & Google Slides
Bar/Column
3D Cone Chart Data Visualization template for PowerPoint & Google Slides
Bar/Column
Creative Lab Beakers Data Infographic template for PowerPoint & Google Slides
Infographics

Dynamic Data Dashboard Infographic Template for PowerPoint & Google Slides
Bar/Column
Data Analytics Dashboard Design template for PowerPoint & Google Slides
Bar/Column
Gear Pie Diagram Data Visualization Template for PowerPoint & Google Slides
Pie/Donut
Data-Driven Marketing Cycle Diagram Template for PowerPoint & Google Slides
Customer Journey
Tornado Chart Data Comparison Slide Template for PowerPoint & Google Slides
Bar/Column
Bottle Data Percentage Infographic Template for PowerPoint & Google Slides
Infographics
Immigration Data Dashboard Template for PowerPoint & Google Slides
Bar/Column
Leaf Infographic Data Visualization Template for PowerPoint & Google Slides
Infographics
Mobile Infographics Data Visualization Template for PowerPoint & Google Slides
Infographics
Data Management and Analytics Diagram Template for PowerPoint & Google Slides
Circular
Data Migration Life Cycle Curved Diagram Template for PowerPoint & Google Slides
Process
Medical Infographics Data Visualization Template for PowerPoint & Google Slides
Health
DIKW Data to Wisdom Pyramid Model Template for PowerPoint & Google Slides
Pyramid
Data-driven GDP Growth Infographic Pack Template for PowerPoint & Google Slides
Infographics
KPI Dashboard Data Visualization Template for PowerPoint & Google Slides
Bar/Column
KPI Dashboard Data Overview Slide Template for PowerPoint & Google Slides
Bar/Column
North America Data Map Callouts Template for PowerPoint & Google Slides
World Maps
Professional Heatmap Data Visualization Template for PowerPoint & Google Slides
Infographics
Donut Chart Data Breakdown template for PowerPoint & Google Slides
Pie/Donut

Modern Big Data Infographic Deck Template for PowerPoint & Google Slides
Decks
Waffle Chart Data Visualization Template for PowerPoint & Google Slides
Comparison Chart
Layered Data Governance Maturity Model Template for PowerPoint & Google Slides
Process
Free Stacked Column Chart Data Visualization Template for PowerPoint & Google Slides
Bar/Column
Free
Simple Bar Chart Data Visualization Template for PowerPoint & Google Slides
Bar/Column
XY Bubble Chart Data Visualization Template for PowerPoint & Google Slides
Comparison Chart
Simple Area Chart Data Trends Analysis Template for PowerPoint & Google Slides
Comparison Chart
Data Over Time Line Chart template for PowerPoint & Google Slides
Charts
Waterfall Chart Data Visualization Template for PowerPoint & Google Slides
Comparison Chart
Multipurpose Spline Chart Data Trend Template for PowerPoint & Google Slides
Bar/Column
Editable Africa Map Infographic Data Template for PowerPoint & Google Slides
World Maps
UK Counties Map Data Visualization Template for PowerPoint & Google Slides
World Maps
Advanced Data Flow Diagram Pack Template for PowerPoint & Google Slides
Flow Charts
Interactive Jump Line Data Chart Template for PowerPoint & Google Slides
Comparison Chart
Segmented Scatter Chart Data Visualization Template for PowerPoint & Google Slides
Business Strategy
Free Big Data Network Visualization Template for PowerPoint & Google Slides
Circular
Free
Syria Regional Data Map Infographic Template for PowerPoint & Google Slides
World Maps
Data Lake Hub-and-Spoke Diagram Template for PowerPoint & Google Slides
Cloud Computing
ETL Data Pipeline Workflow Diagram Template for PowerPoint & Google Slides
Process
Data Privacy template for PowerPoint & Google Slides
Information Technology
Data Protection Strategies template for PowerPoint & Google Slides
Information Technology
Comprehensive Data & AI Capability Model Template for PowerPoint & Google Slides
AI
Data Flywheel Strategy template for PowerPoint & Google Slides
Business
Data Privacy and Compliance in ML template for PowerPoint & Google Slides
Technology
Data-Driven AI in Insurance Infographic Template for PowerPoint & Google Slides
Circular
AI and Data Ecosystem Map Template for PowerPoint & Google Slides
AI
Data Protection & Encryption in the Cloud Overview template for PowerPoint & Google Slides
Cloud Computing
Customer Data Platform Workflow Diagram Template for PowerPoint & Google Slides
Information Technology
Data-Driven Marketing Lifecycle Diagram Template for PowerPoint & Google Slides
Process
Data-Driven Decision Making overview template for PowerPoint & Google Slides
Business
First Party Data Overview Template for PowerPoint & Google Slides
Business
Data Governance Roles Pyramid Diagram Template for PowerPoint & Google Slides
Pyramid
Business Data Table Template for PowerPoint & Google Slides
Table
Colorful Business Data Comparison Table Template for PowerPoint & Google Slides
Table
Six Column Data Table Template for PowerPoint & Google Slides
Table
Data Gap Analysis Template for PowerPoint & Google Slides
Business
Mobile User Data Analysis Infographic for PowerPoint & Google Slides
Process
Bar Data Chart Slide for PowerPoint & Google Slides
Bar/Column
Weekly Data Chart Slide for PowerPoint & Google Slides
Comparison Chart

3D Column Chart with Data Table for PowerPoint & Google Slides
Bar/Column

Cone Data Chart for PowerPoint & Google Slides
Charts
4 Business Data Infographics Diagram for PowerPoint & Google Slides
Process
Data-Driven Line Chart Diagram Template for PowerPoint
Comparison Chart
Clustered Column Chart Data Analysis Template for PowerPoint
Bar/Column
Free Data Analytics Dashboard Template for PowerPoint
Charts
Free