Customer Loyalty & Profitability Matrix Template for PowerPoint & Google Slides


Description
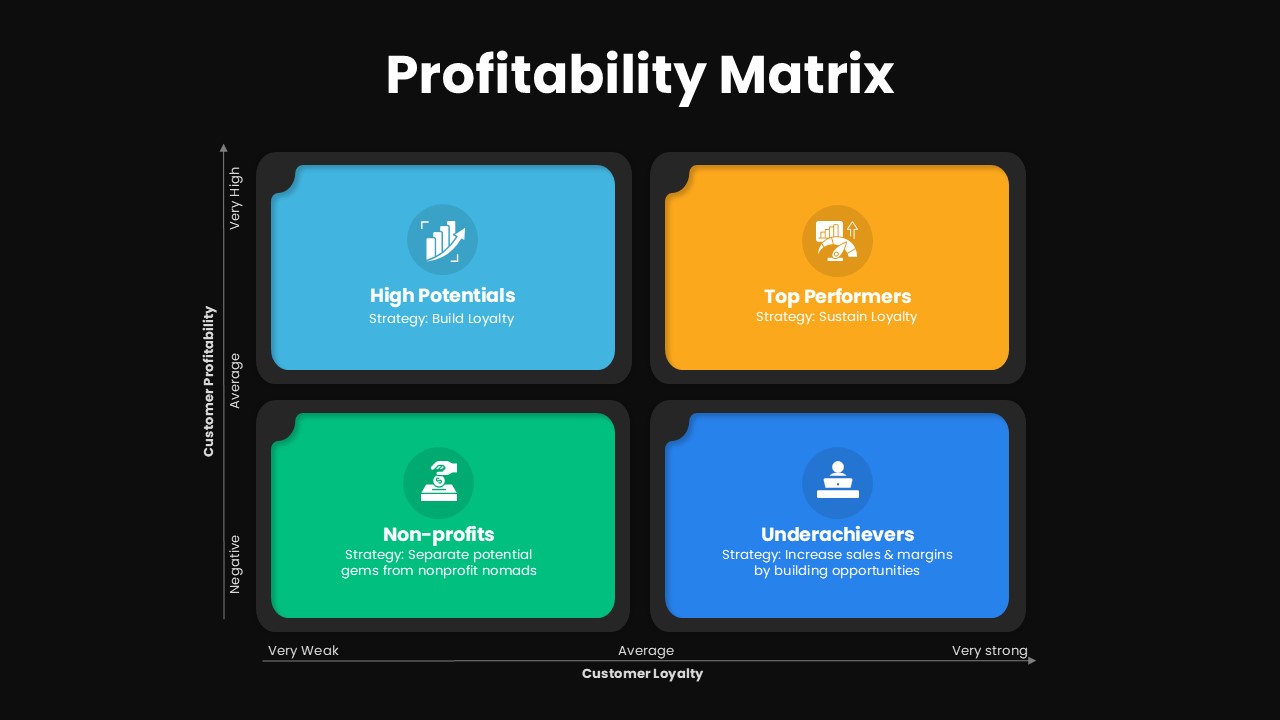
Use this high-impact profitability matrix slide to visualize and segment customer groups according to loyalty and profitability metrics. The slide presents a clean 2×2 grid with four high-definition vector cards—High Potentials, Top Performers, Non-profits, and Underachievers—each paired with an intuitive icon and concise strategy prompt. Axes clearly label customer profitability (Negative to Very High) on the vertical and customer loyalty (Very Weak to Very Strong) on the horizontal, providing immediate context for data-driven discussions. Each quadrant is distinguished by vibrant flat hues—cyan, orange, green, and royal blue—against a crisp white backdrop, complemented by subtle drop shadows, rounded corners, and consistent typography for a modern flat aesthetic.
Designed for effortless editing, this template includes master slides, editable text placeholders, alignment guides, and scalable vector icons, enabling rapid customization of colors, fonts, and content without disrupting layout or resolution. Swap out icons, update strategy labels, or apply corporate color schemes in seconds while maintaining pixel-perfect clarity across PowerPoint and Google Slides. Integrated smart guides ensure vector shapes stay aligned when resizing or duplicating, eliminating formatting headaches and speeding up version control during collaborative edits.
Whether you’re delivering executive briefings, marketing performance reviews, or customer strategy workshops, this slide empowers teams to drive stakeholder alignment. By mapping customer segments into distinct strategic categories, presenters can prioritize retention initiatives, loyalty-building campaigns, or profitability optimizations with maximum impact and minimal effort.
Beyond customer segmentation, this asset supports a wide range of strategic frameworks. Duplicate or resize grid elements to illustrate product-market fit analyses, risk versus reward assessments, or project prioritization matrices. Repurpose the layout for employee performance evaluations, resource allocation heatmaps, or innovation pipeline overviews. Its multipurpose design also suits investor pitch decks, internal training modules, and academic lectures, making this slide an indispensable tool for storytelling across industries.
Who is it for
Marketing managers, sales directors, and customer success teams will benefit from this matrix when evaluating segment performance, loyalty drivers, and cost-to-serve metrics. Business analysts, CRM specialists, and strategy consultants can leverage the clear 2×2 classification to align on roadmap priorities, resource allocation, and loyalty programs. Ideal for startups, enterprises, agencies, and academic settings.
Other Uses
Repurpose this flexible grid to map risk management strategies versus impact, vendor performance versus dependency, or product adoption versus revenue. Adapt the axes to visualize employee engagement versus productivity, feature usage versus customer satisfaction, or channel ROI versus reach. By relabeling axes and cards, you can transform this slide into any two-variable strategic tool.
Login to download this file

Item ID
SB04726
Related Templates

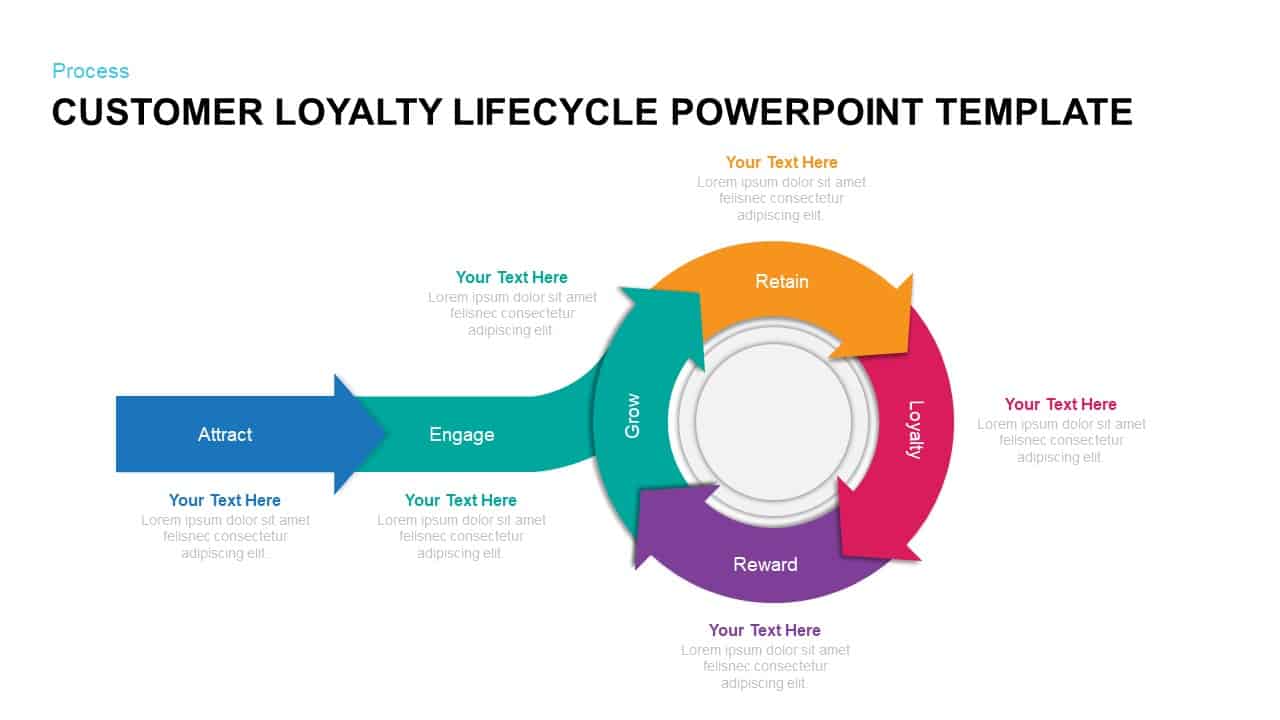
Customer Loyalty Lifecycle Process Template for PowerPoint & Google Slides
Process

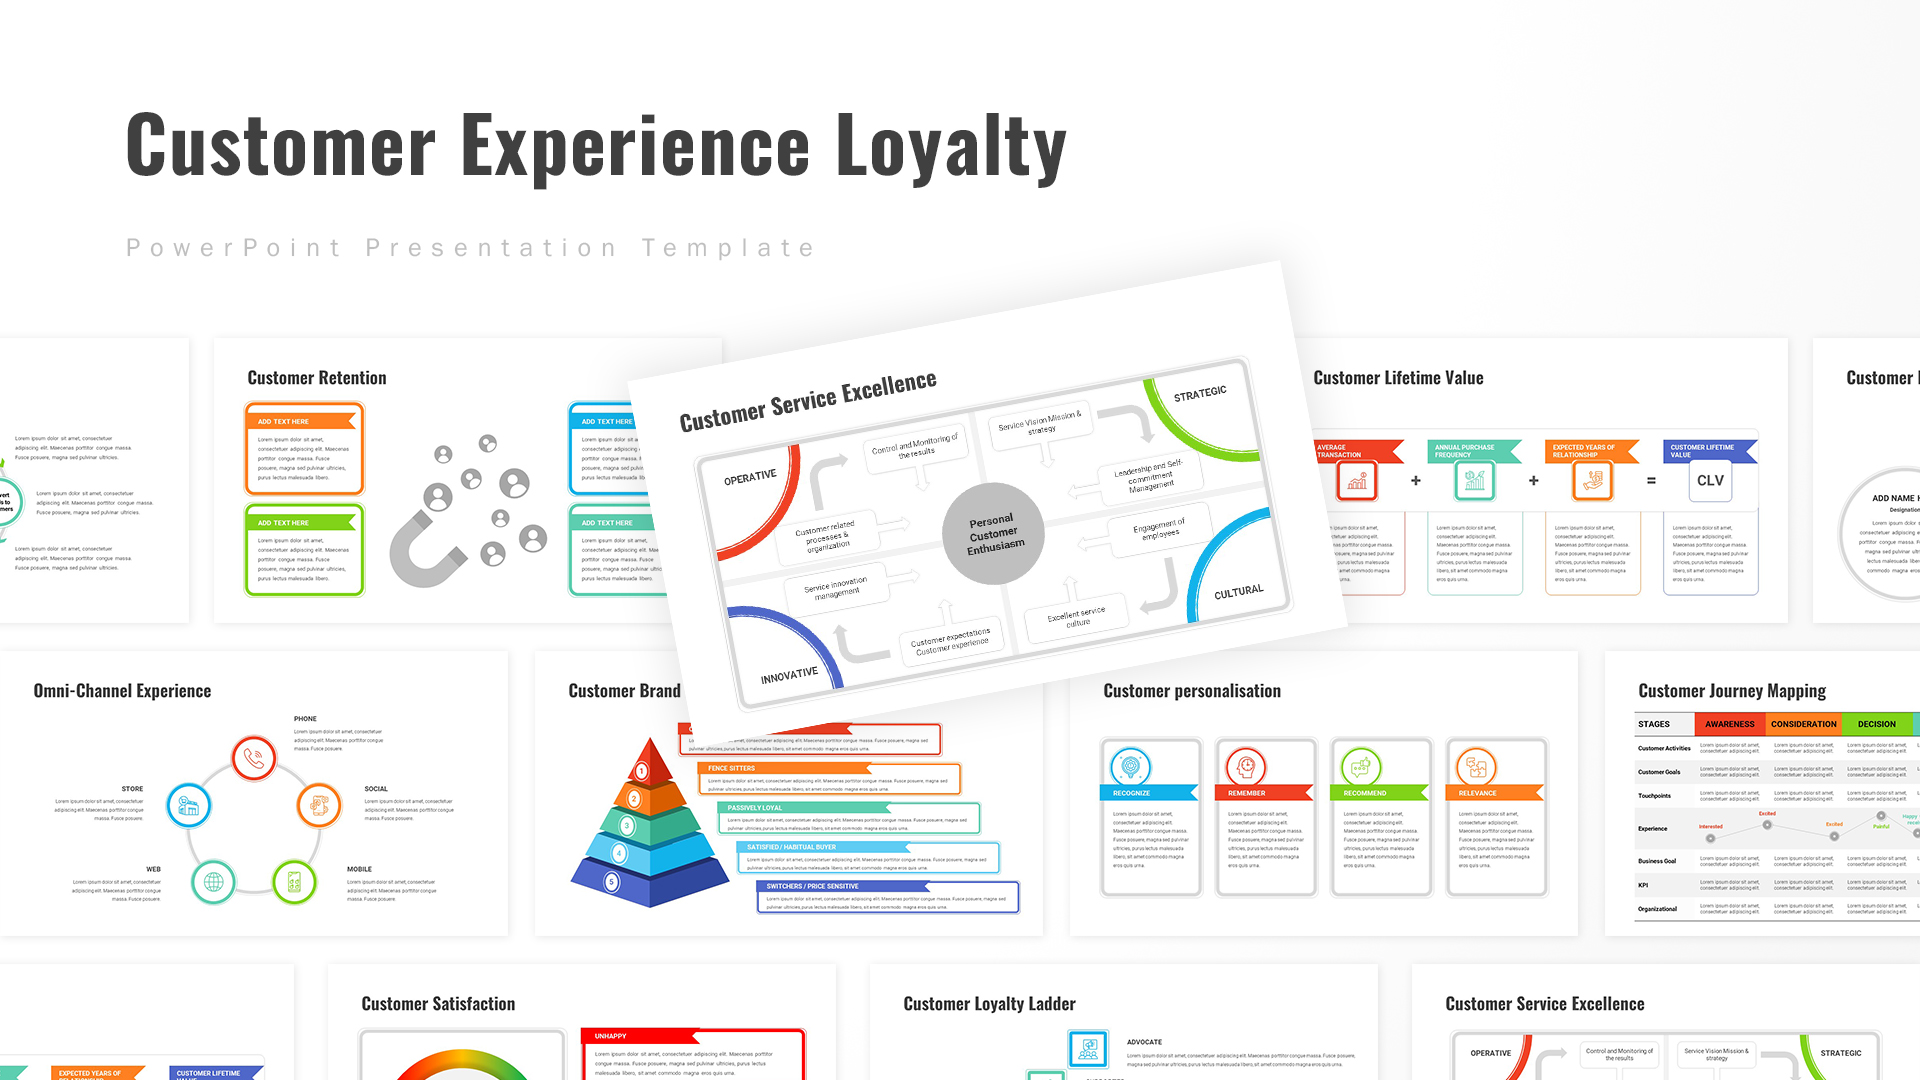
Customer Experience Loyalty Deck for PowerPoint & Google Slides
Customer Experience
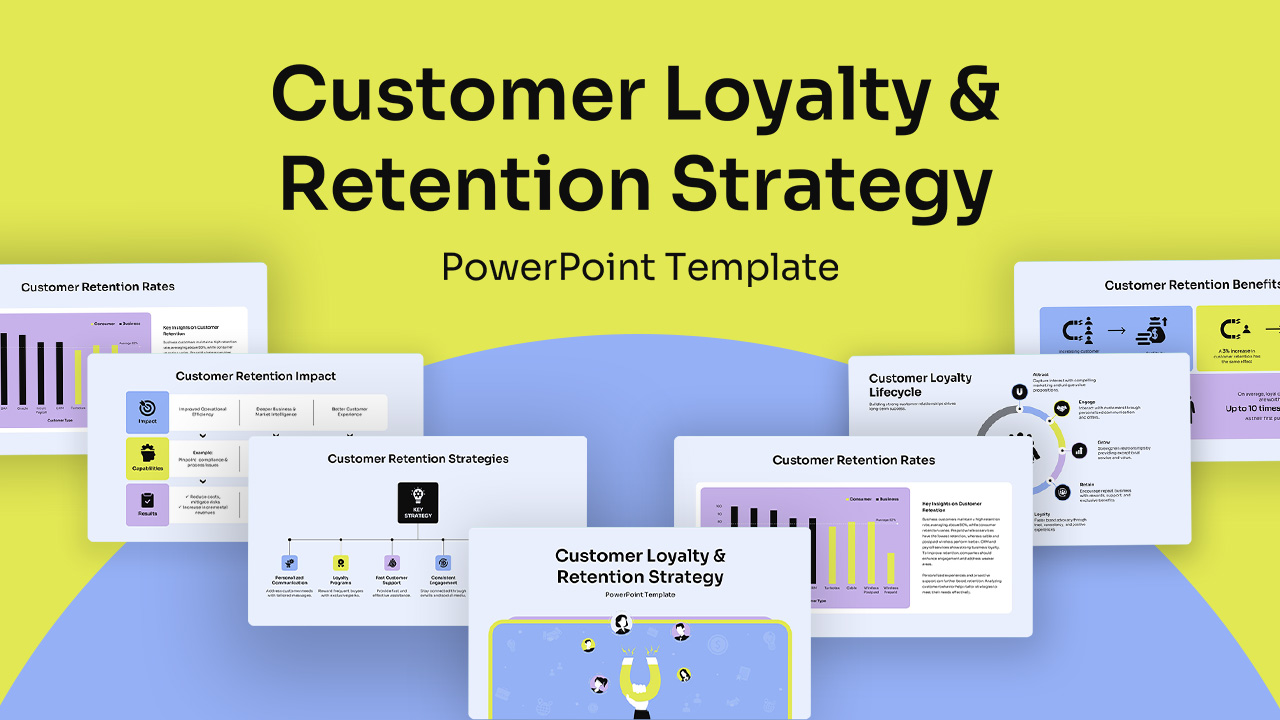
Customer Loyalty & Retention Strategy Deck for PowerPoint & Google Slides
Business Strategy
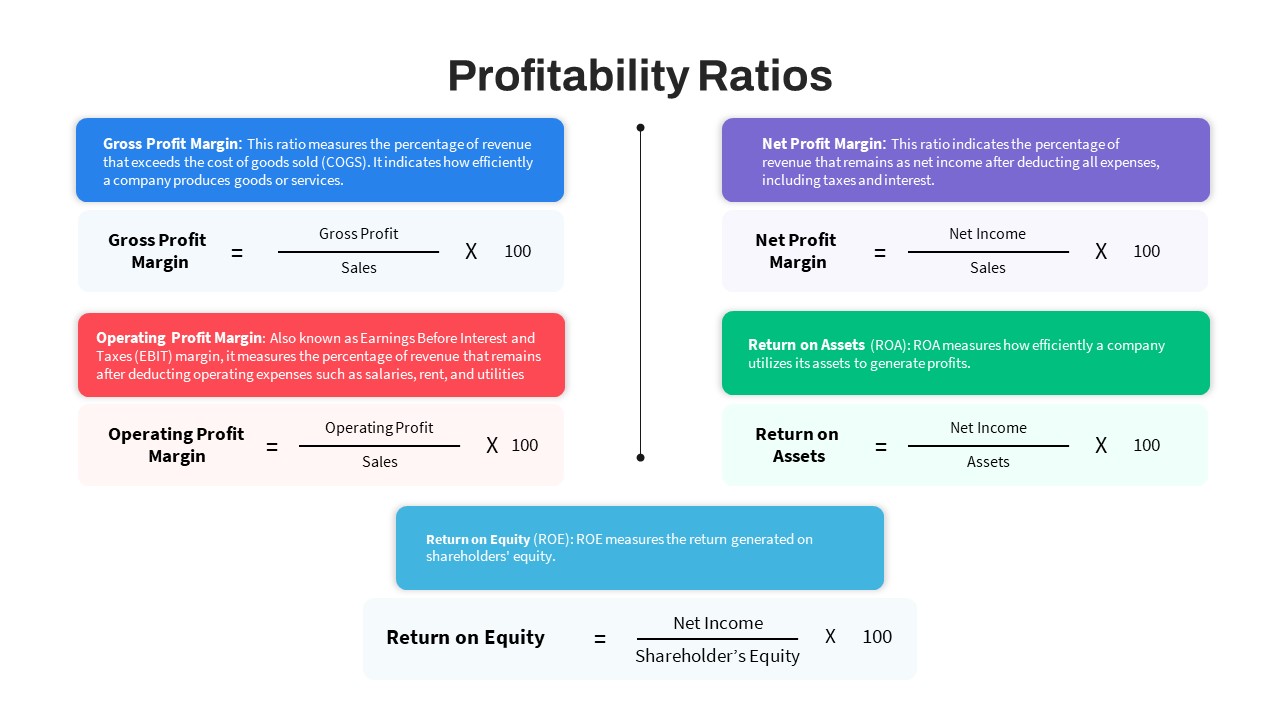
Profitability Ratios Formula Overview Template for PowerPoint & Google Slides
Revenue
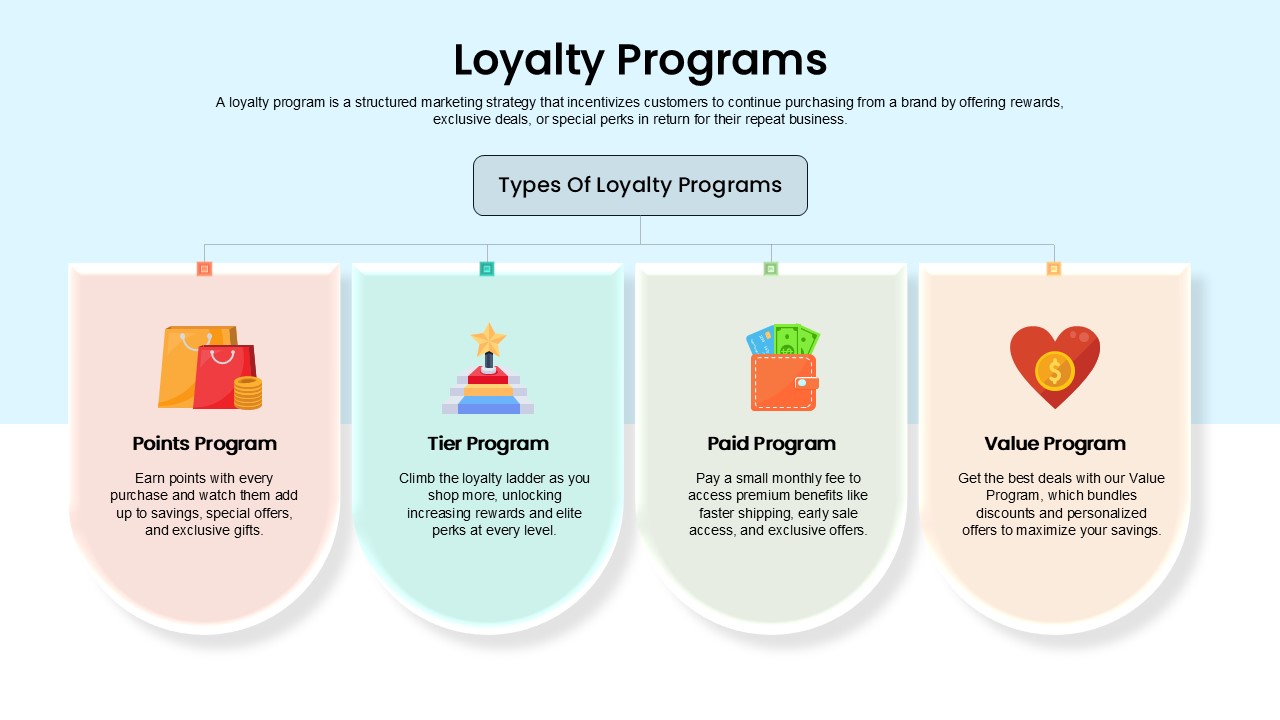
Loyalty Programs Overview template for PowerPoint & Google Slides
Business

Innovation Ambition Matrix & Funnel Strategy Slides for PowerPoint & Google Slides
Process
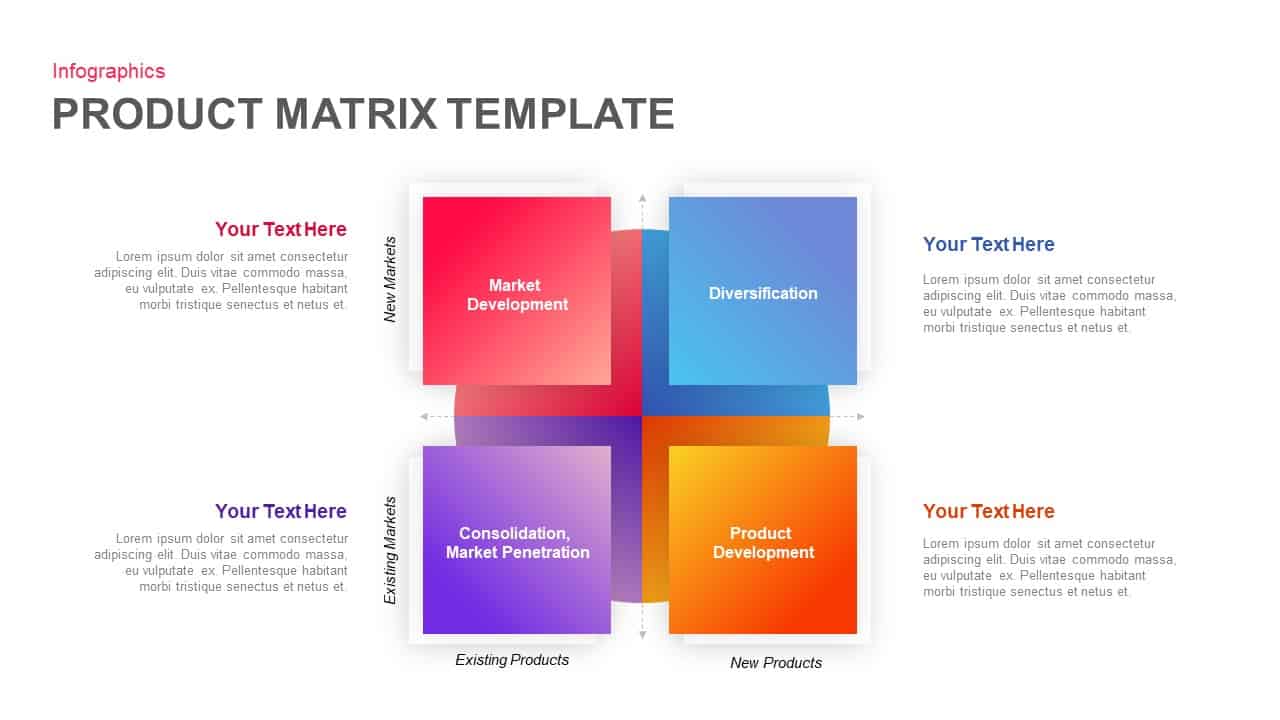
Market Development Matrix Chart Template for PowerPoint & Google Slides
Comparison Chart
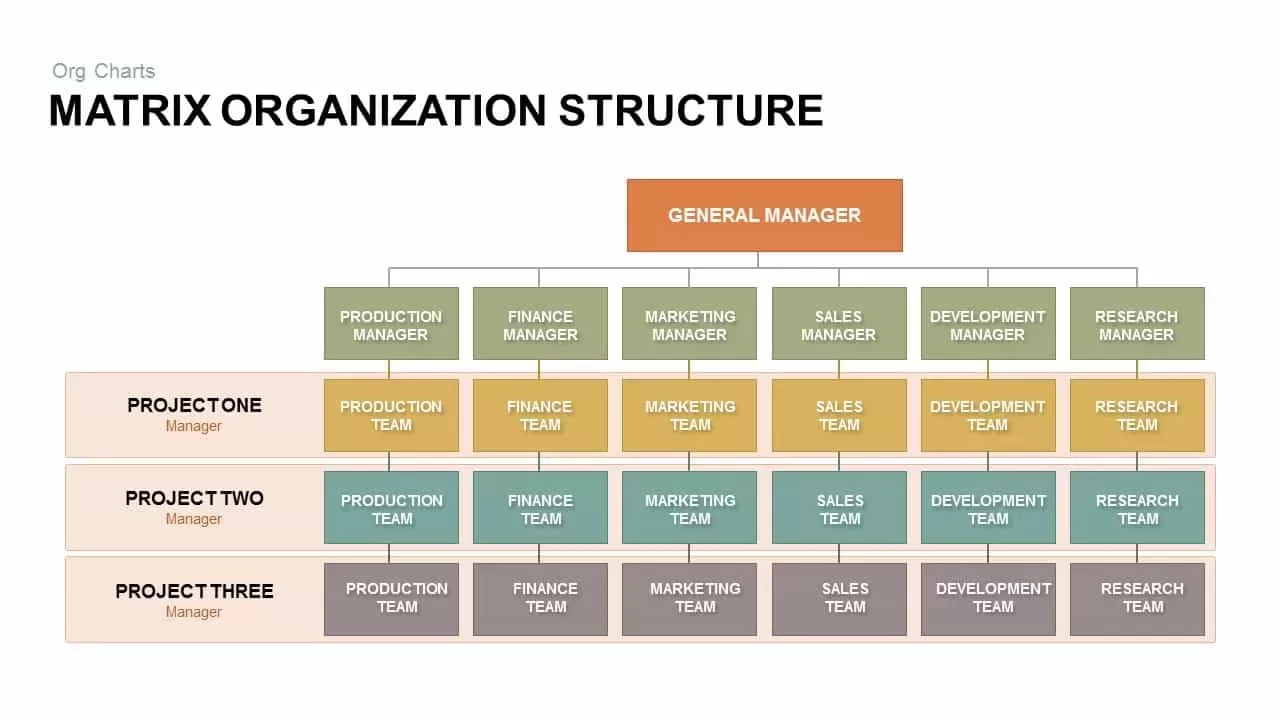
Matrix Organization Structure template for PowerPoint & Google Slides
Org Chart
Ansoff Matrix Growth Strategy Model Template for PowerPoint & Google Slides
BCG

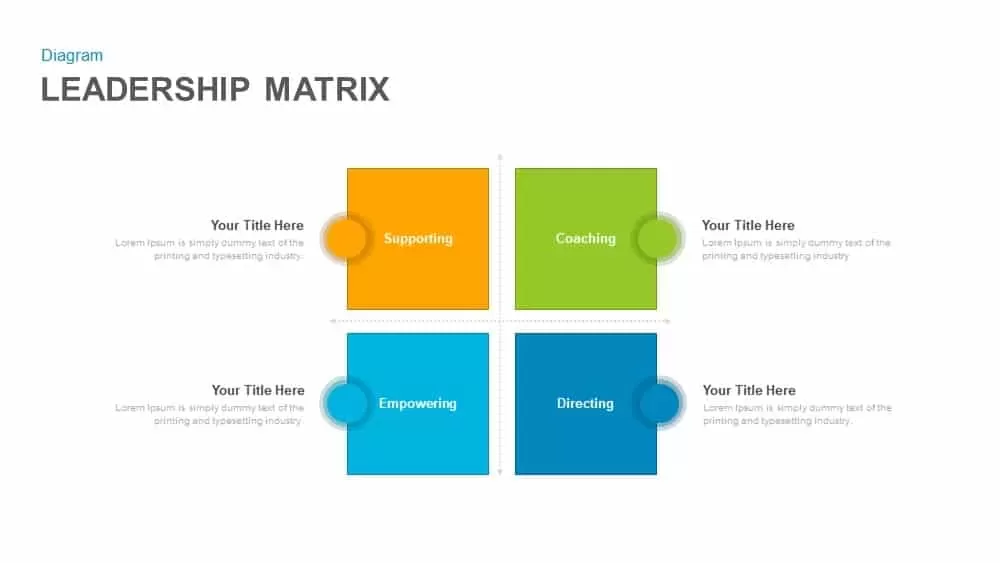
Leadership Matrix with Four Quadrants Template for PowerPoint & Google Slides
Comparison
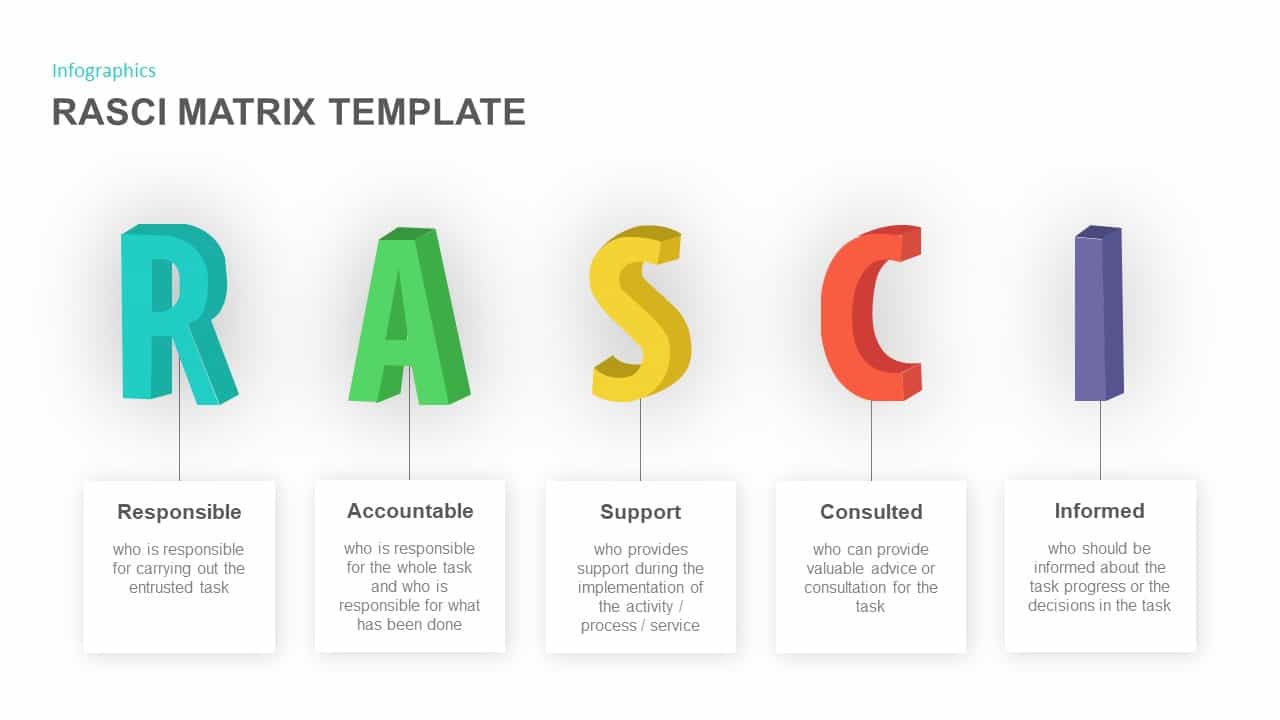
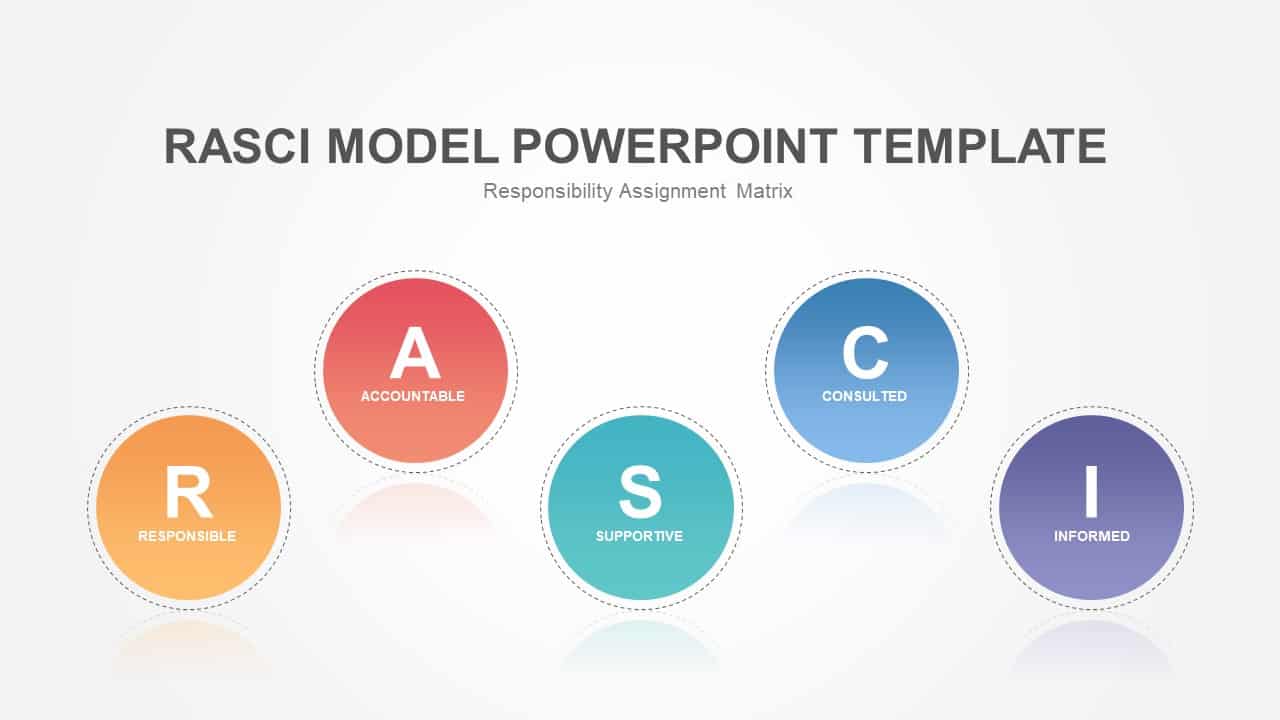
RASCI Assignment Matrix Infographic Template for PowerPoint & Google Slides
Infographics
Product Market Expansion Matrix Template for PowerPoint & Google Slides
Business
RASCI Responsibility Matrix Chart Template for PowerPoint & Google Slides
Business

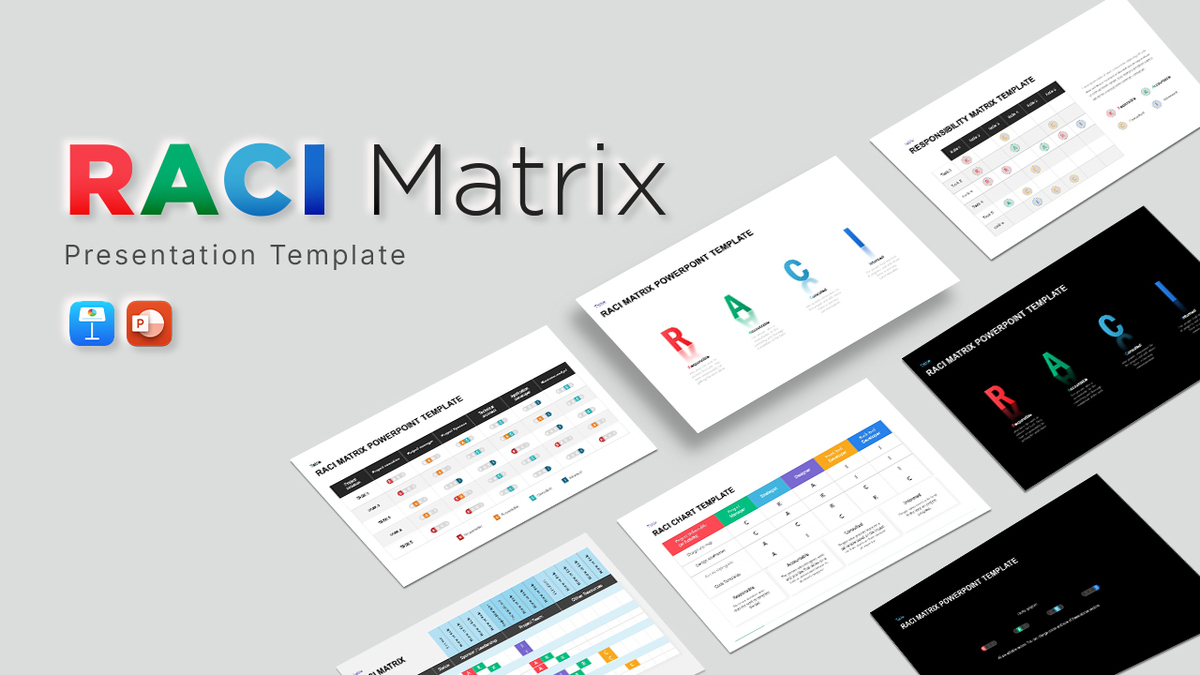
Interactive RACI Responsibility Matrix Template for PowerPoint & Google Slides
Project
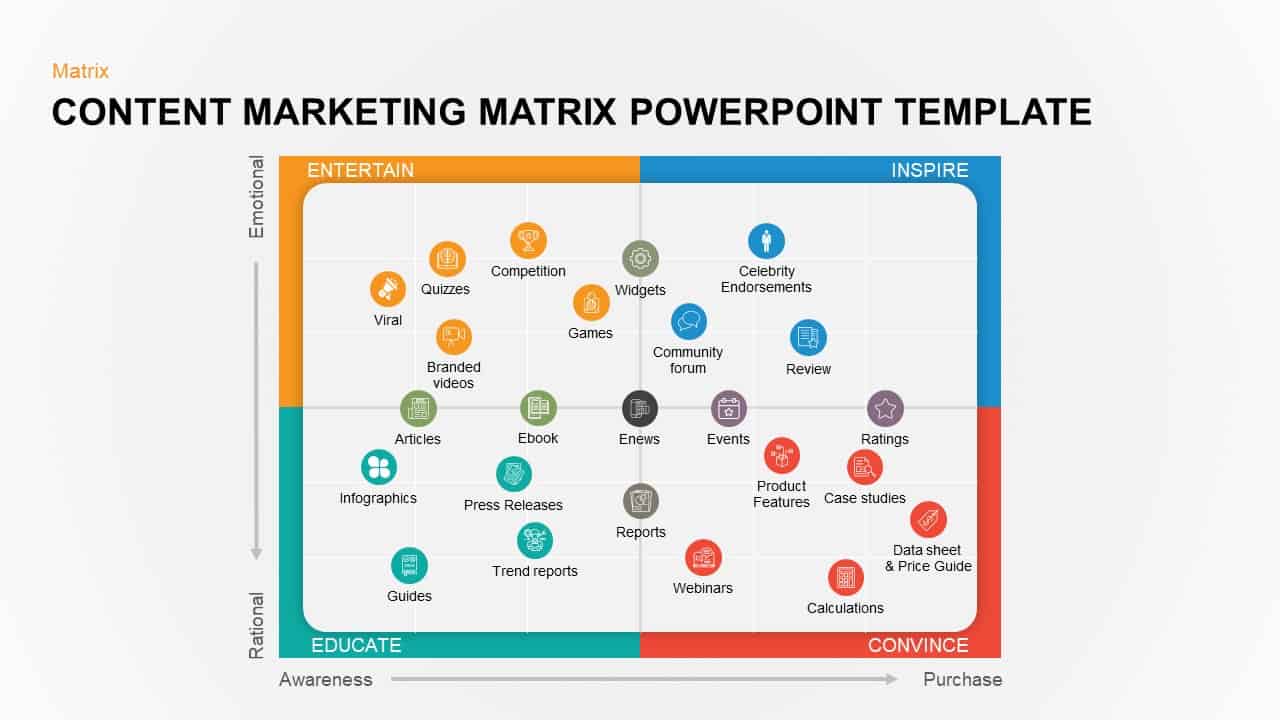
Colorful Content Marketing Matrix Template for PowerPoint & Google Slides
Comparison
Concentric Marketing Matrix Slide Template for PowerPoint & Google Slides
Circular
Three-Year Strategic Plan Matrix Template for PowerPoint & Google Slides
Timeline
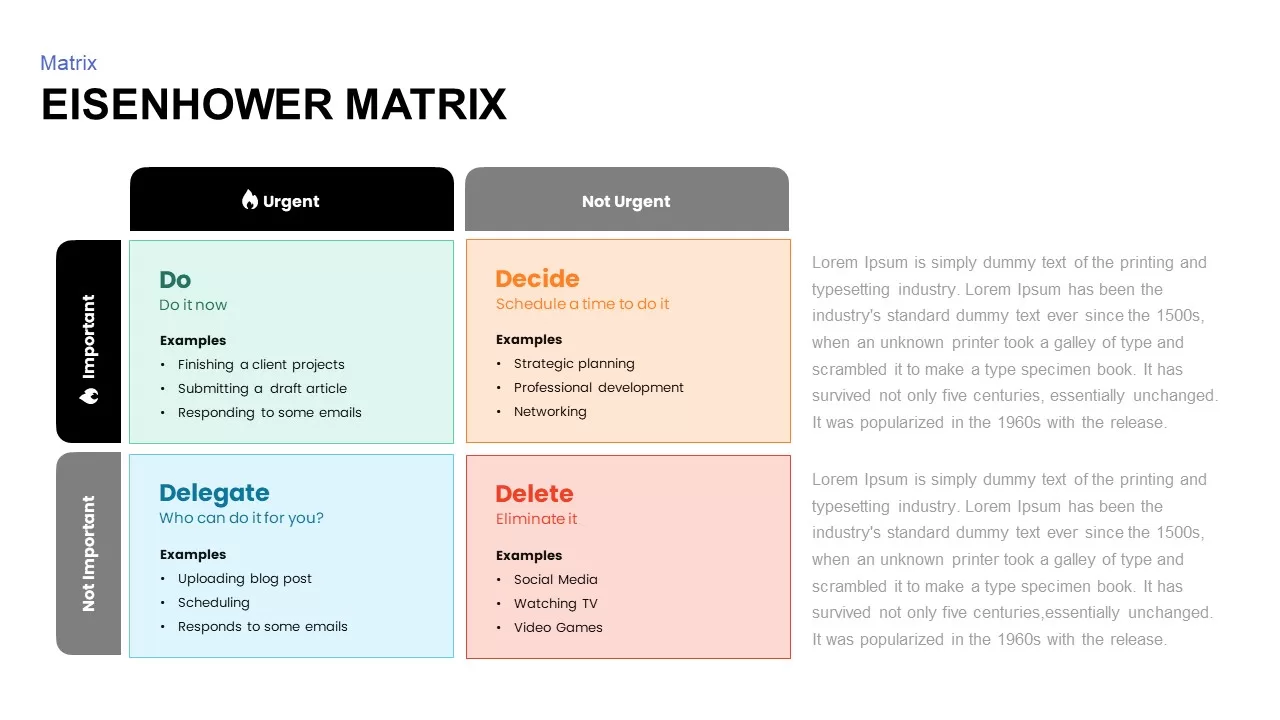
Eisenhower Matrix Task Prioritization Template for PowerPoint & Google Slides
Comparison Chart
RASCI Responsibility Assignment Matrix Template for PowerPoint & Google Slides
Project
Strategic ADL Matrix by Industry Life Cycle & Position Template for PowerPoint & Google Slides
Business Strategy
Ansoff Growth Matrix Strategy Diagram Template for PowerPoint & Google Slides
Business Strategy
Supply Positioning Model Matrix Template for PowerPoint & Google Slides
Comparison Chart
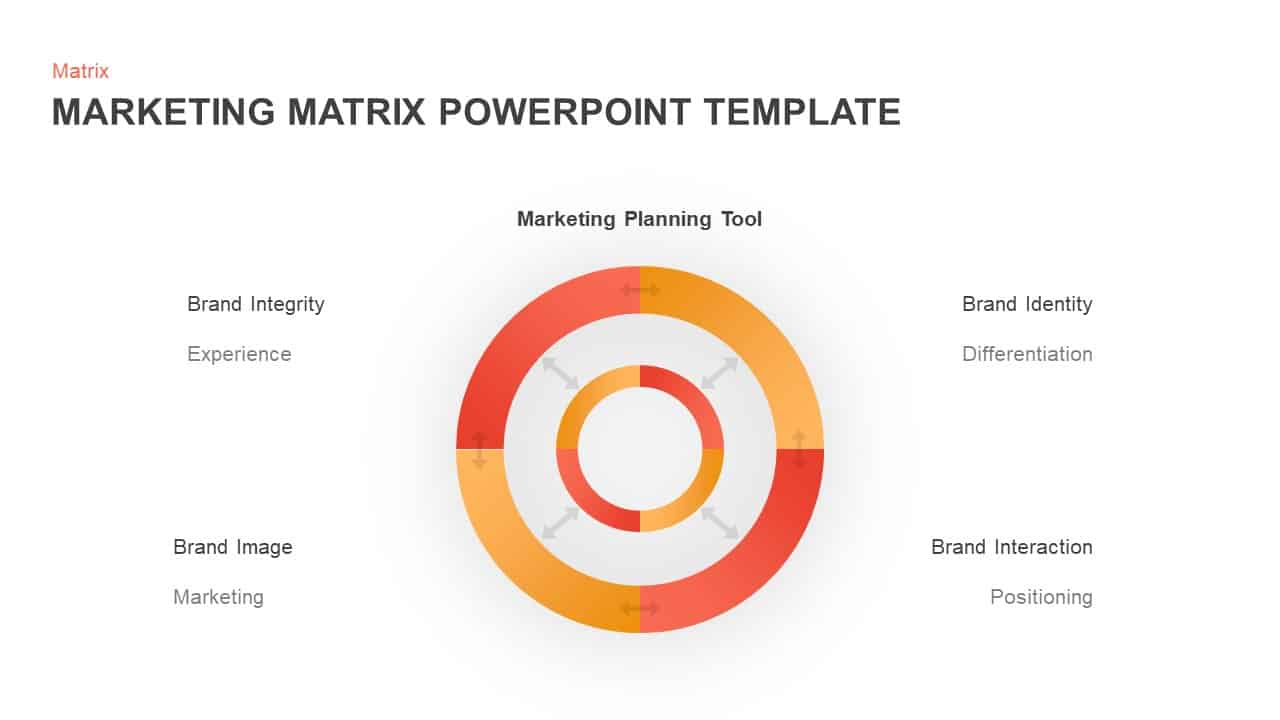
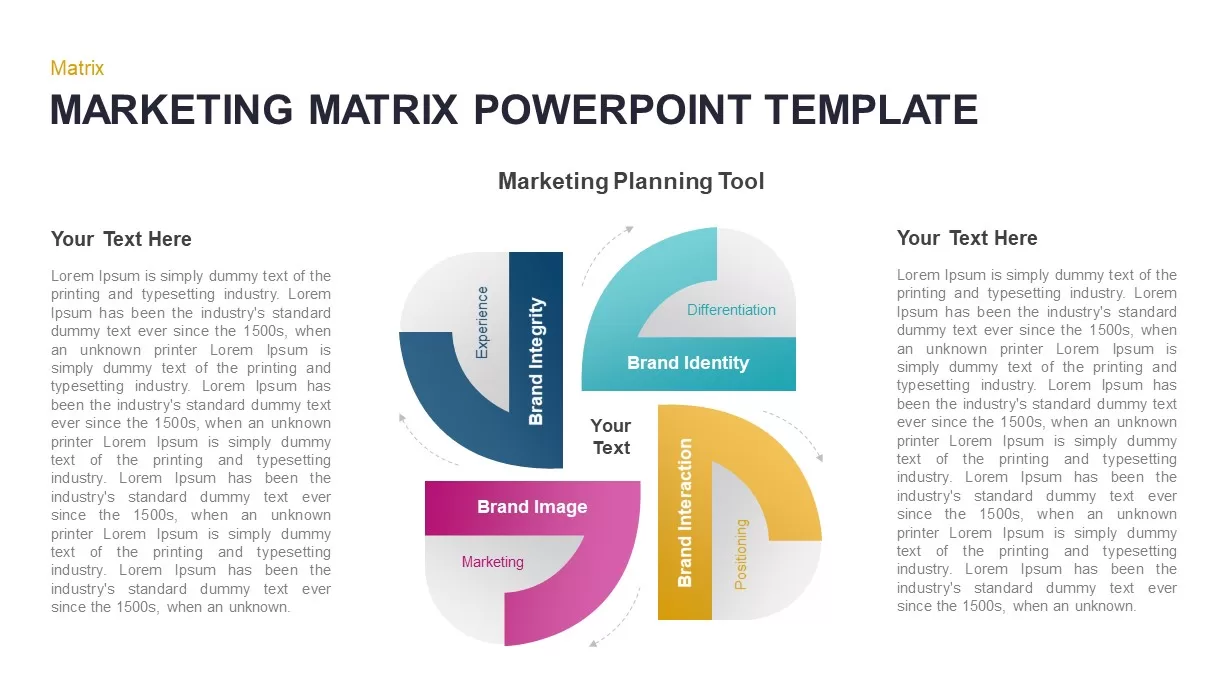
Marketing Matrix Brand Quadrant Diagram Template for PowerPoint & Google Slides
Process
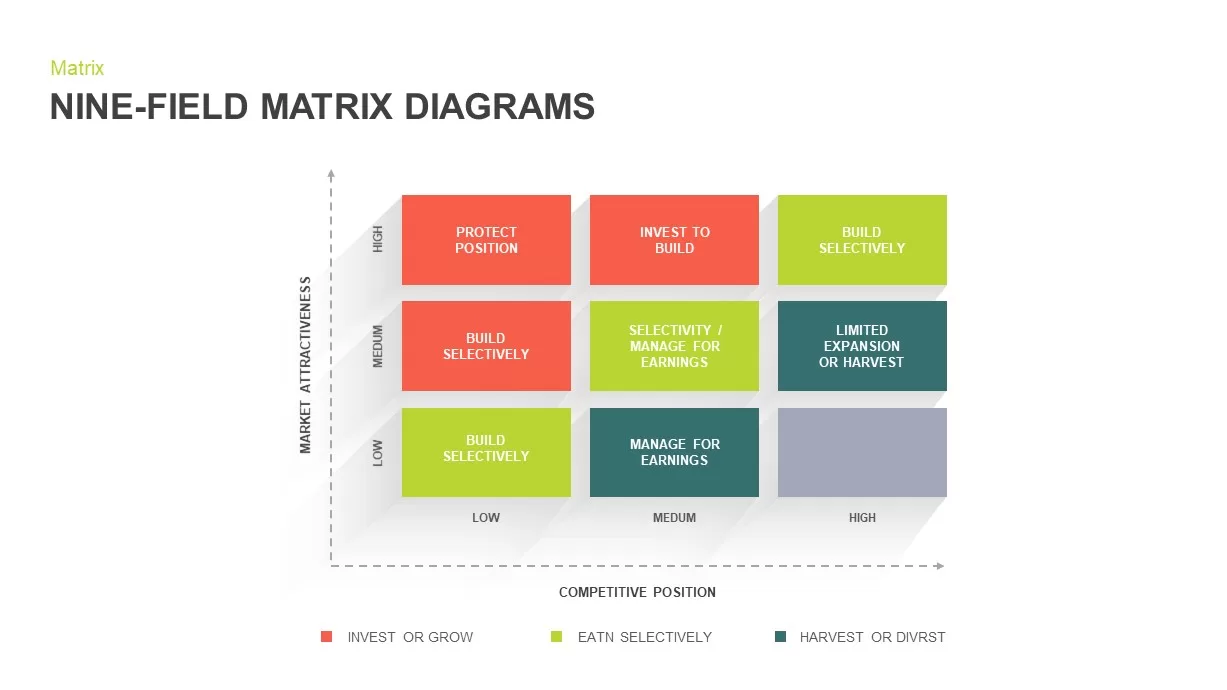
Nine-Field Matrix Diagrams Collection Template for PowerPoint & Google Slides
Comparison Chart
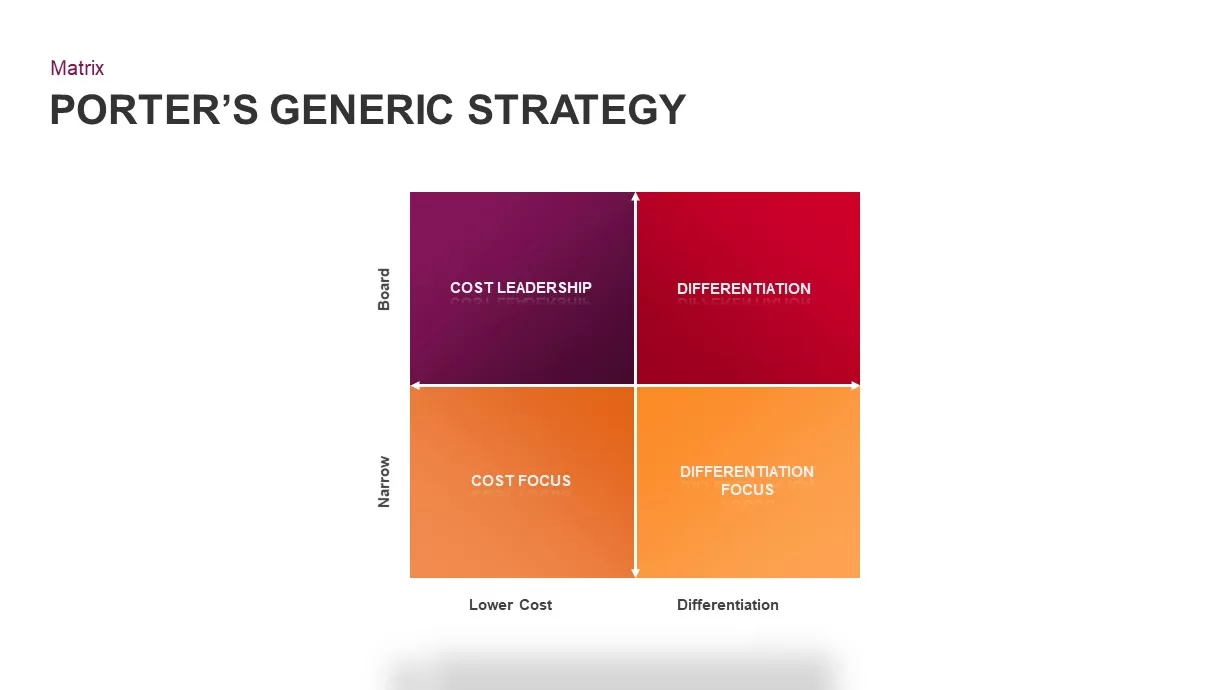
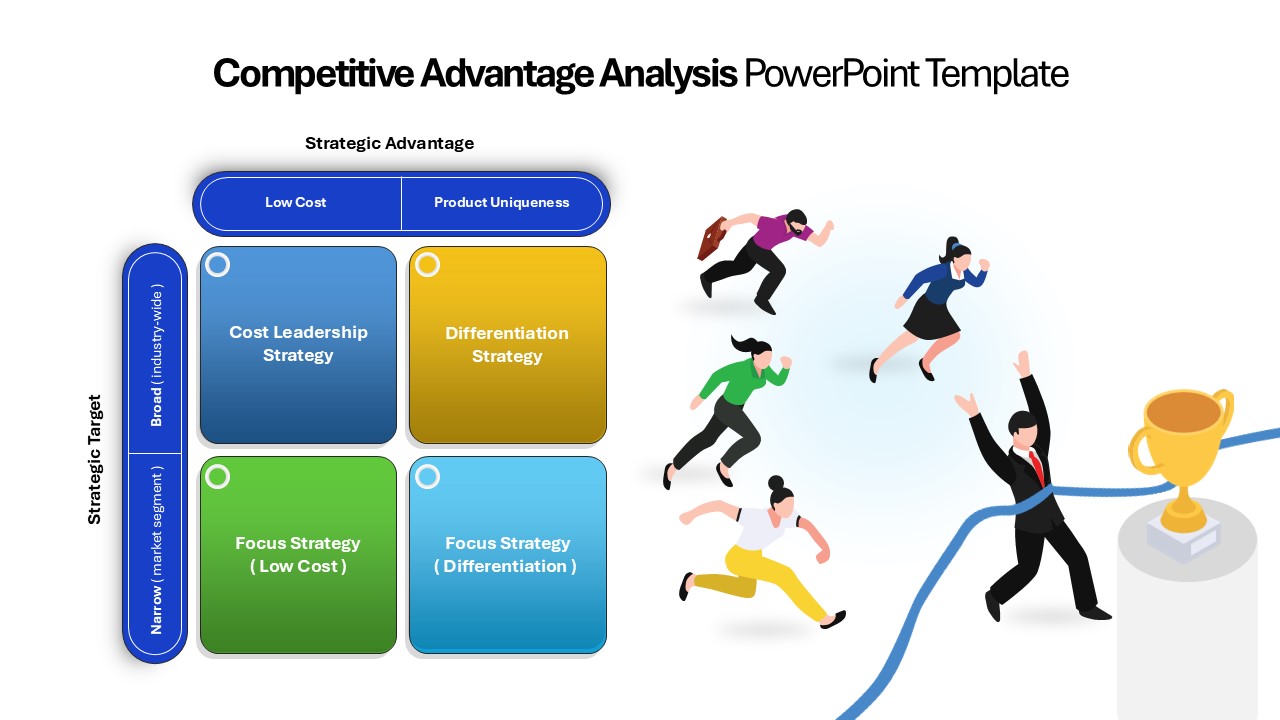
Porter’s Generic Strategy Matrix Diagram Template for PowerPoint & Google Slides
Competitor Analysis
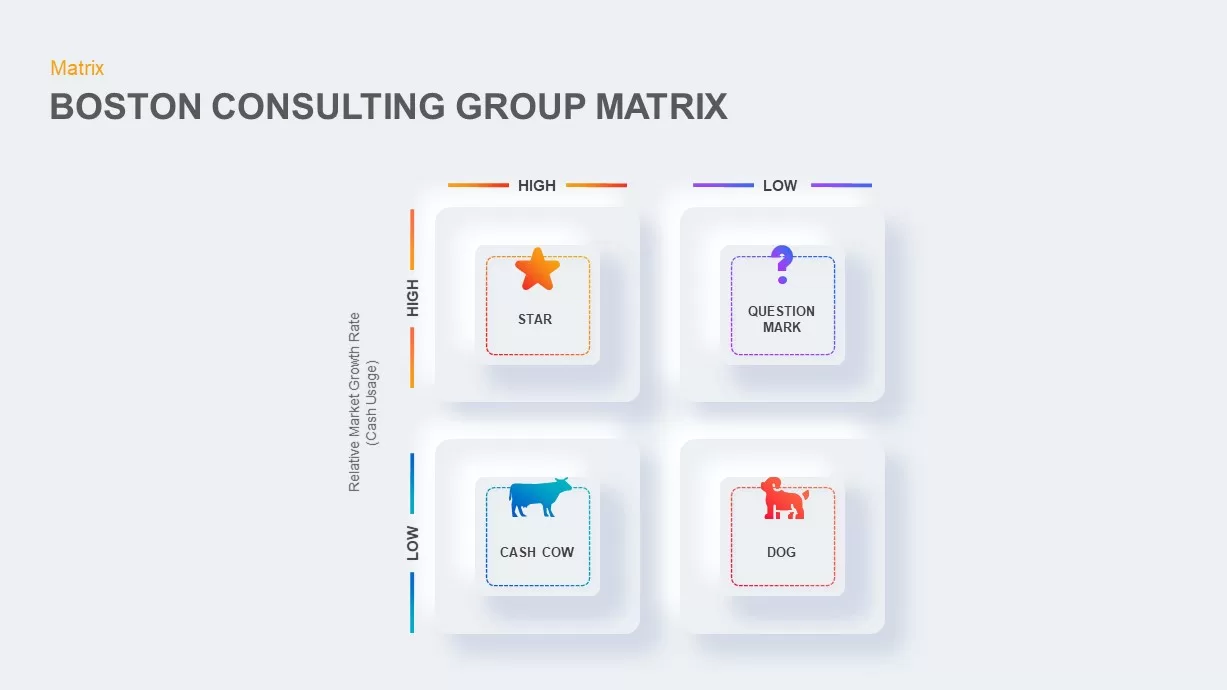
Boston Consulting Group Matrix Diagram Template for PowerPoint & Google Slides
BCG
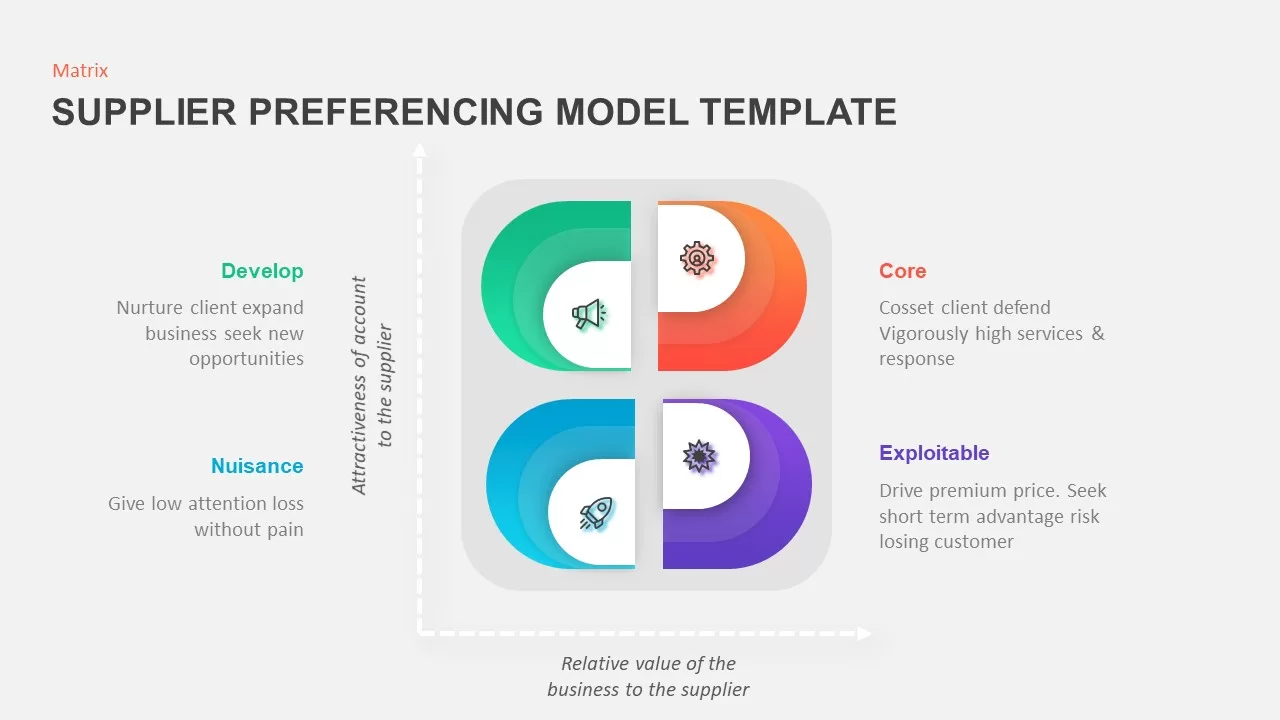
Supplier Preferencing Model Matrix Template for PowerPoint & Google Slides
Business Strategy
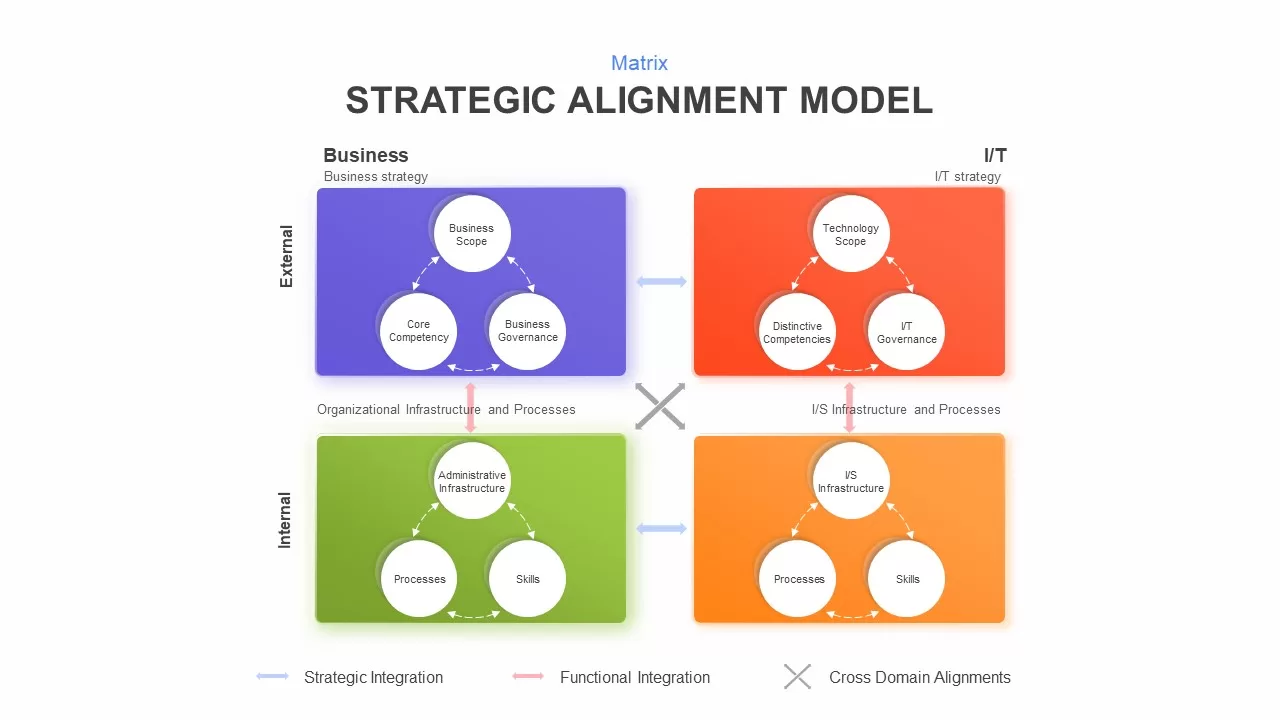
Strategic Alignment Matrix Model Template for PowerPoint & Google Slides
Project
Editable Four-Quadrant TOWS Matrix Template for PowerPoint & Google Slides
Opportunities Challenges
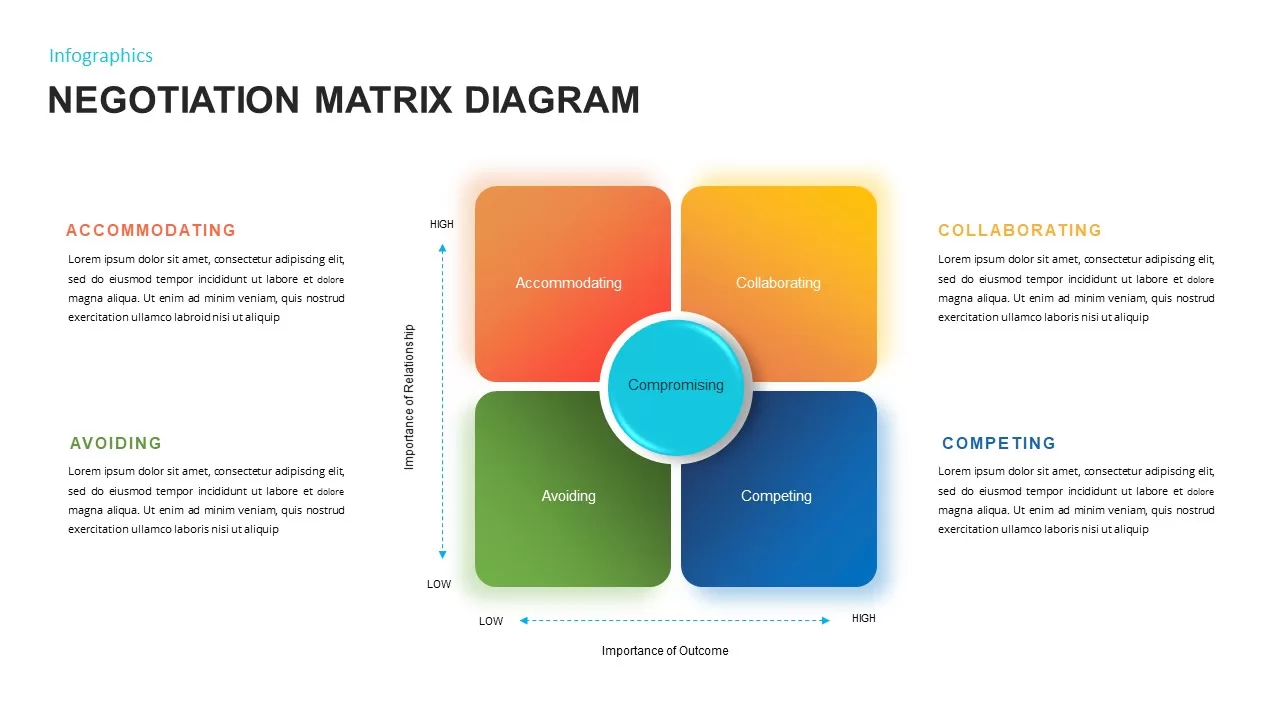
Negotiation Matrix Diagram Template for PowerPoint & Google Slides
Business
Eisenhower Matrix Decision-Making template for PowerPoint & Google Slides
Infographics
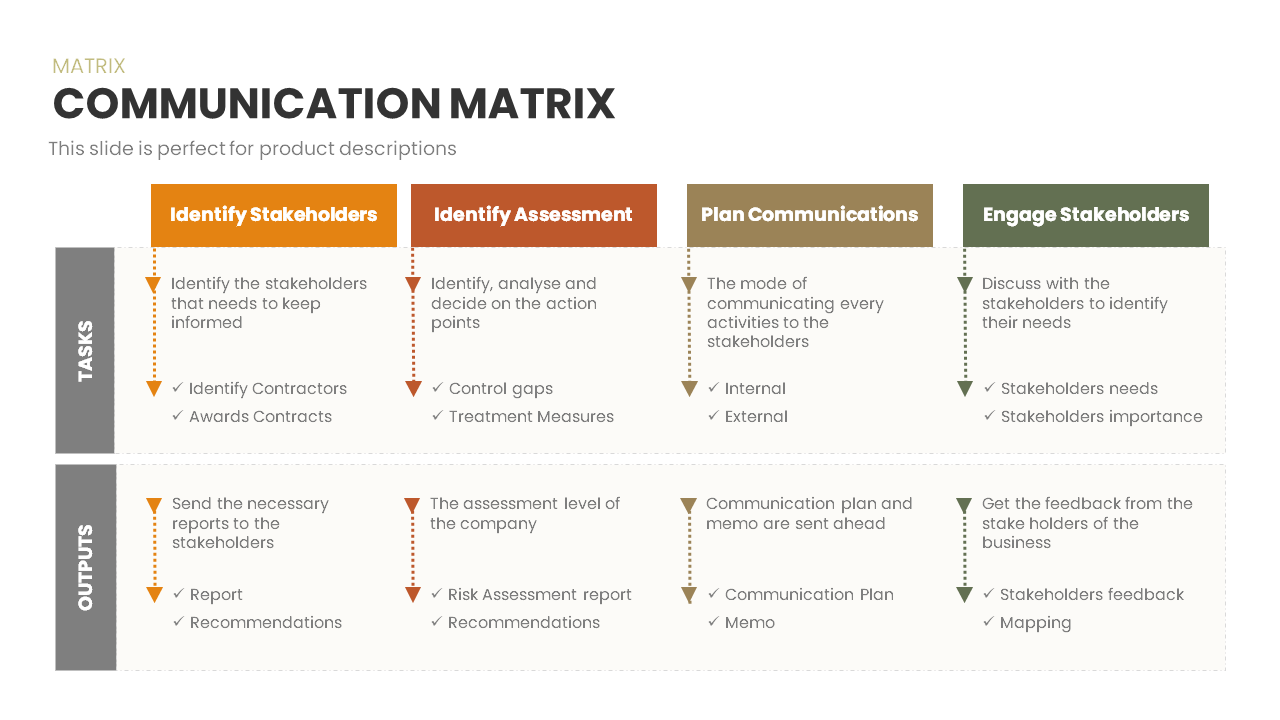
Communication Matrix Overview Template for PowerPoint & Google Slides
Business
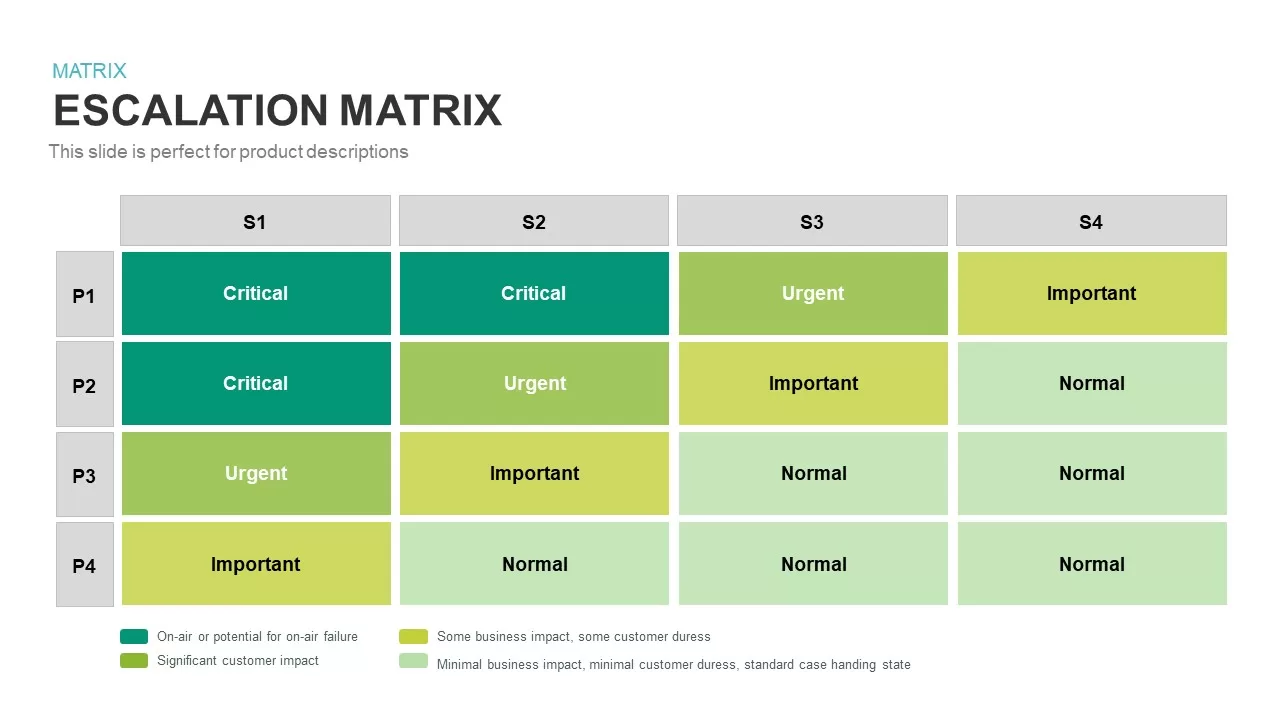
Escalation Matrix template for PowerPoint & Google Slides
Business
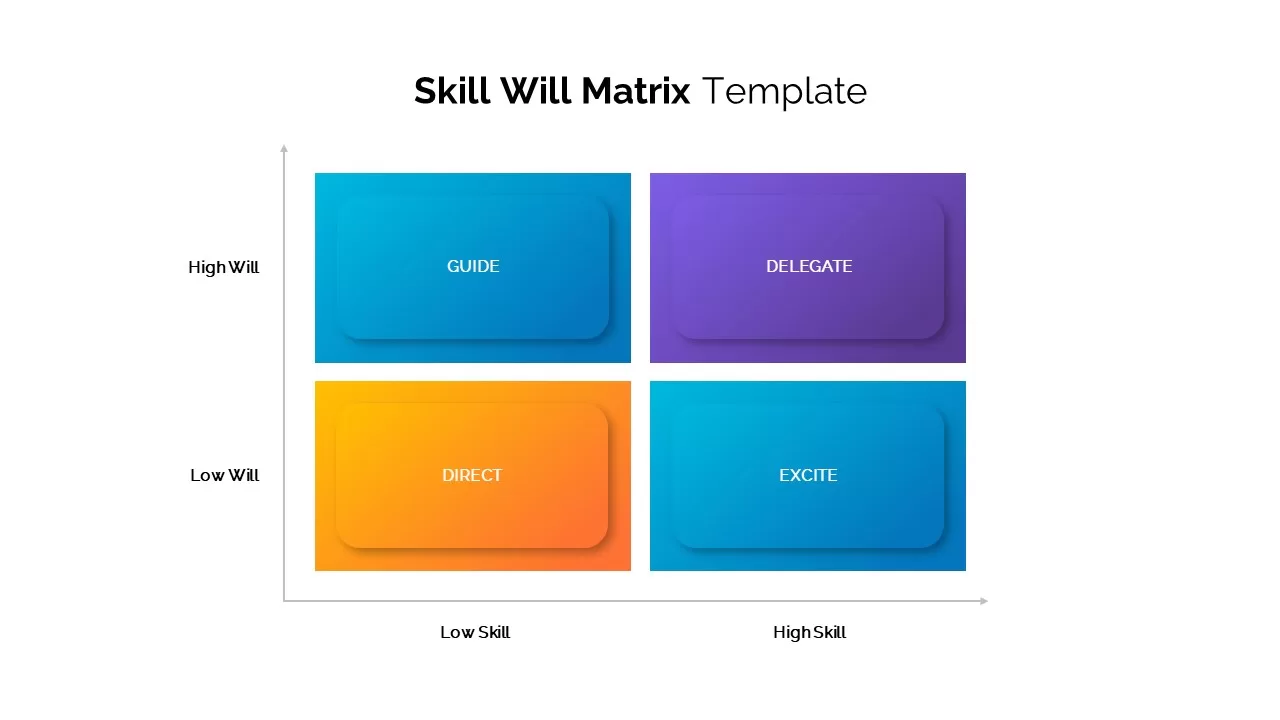
Skill Will Matrix Template for PowerPoint & Google Slides
Infographics
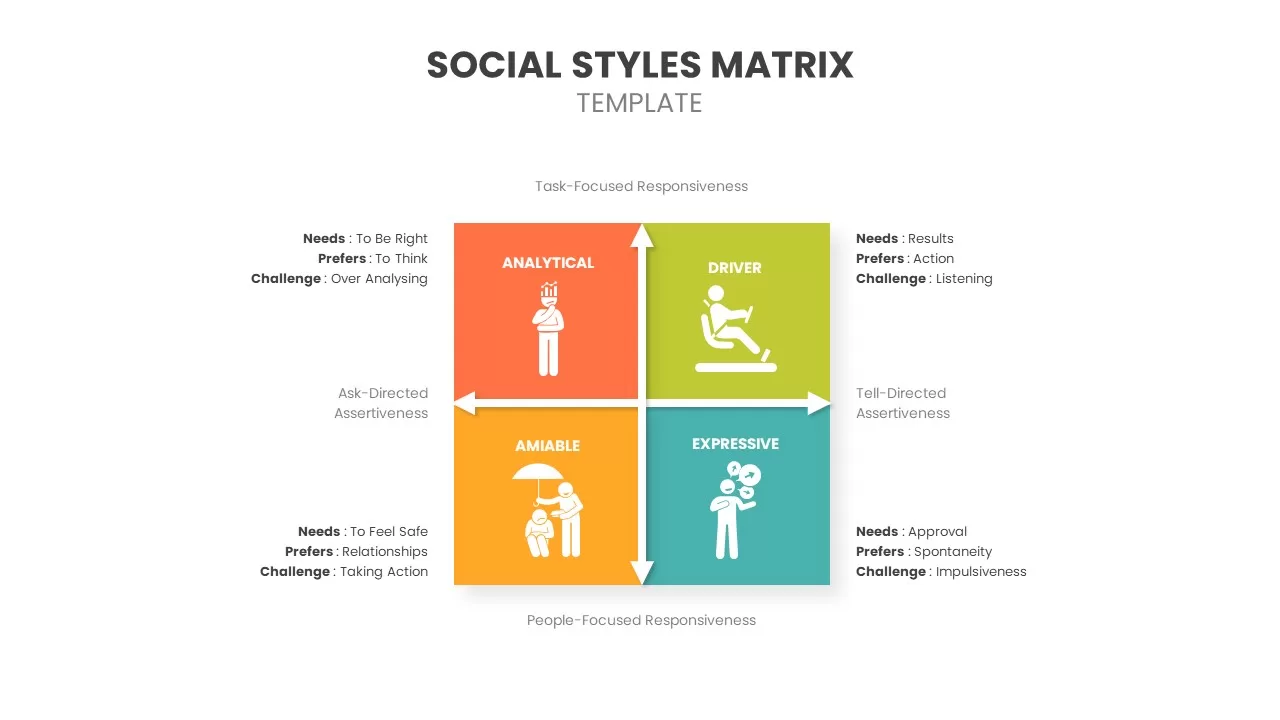
Social Styles Matrix Template for PowerPoint & Google Slides
Business
Pugh Matrix Decision Comparison Chart Template for PowerPoint & Google Slides
Comparison Chart
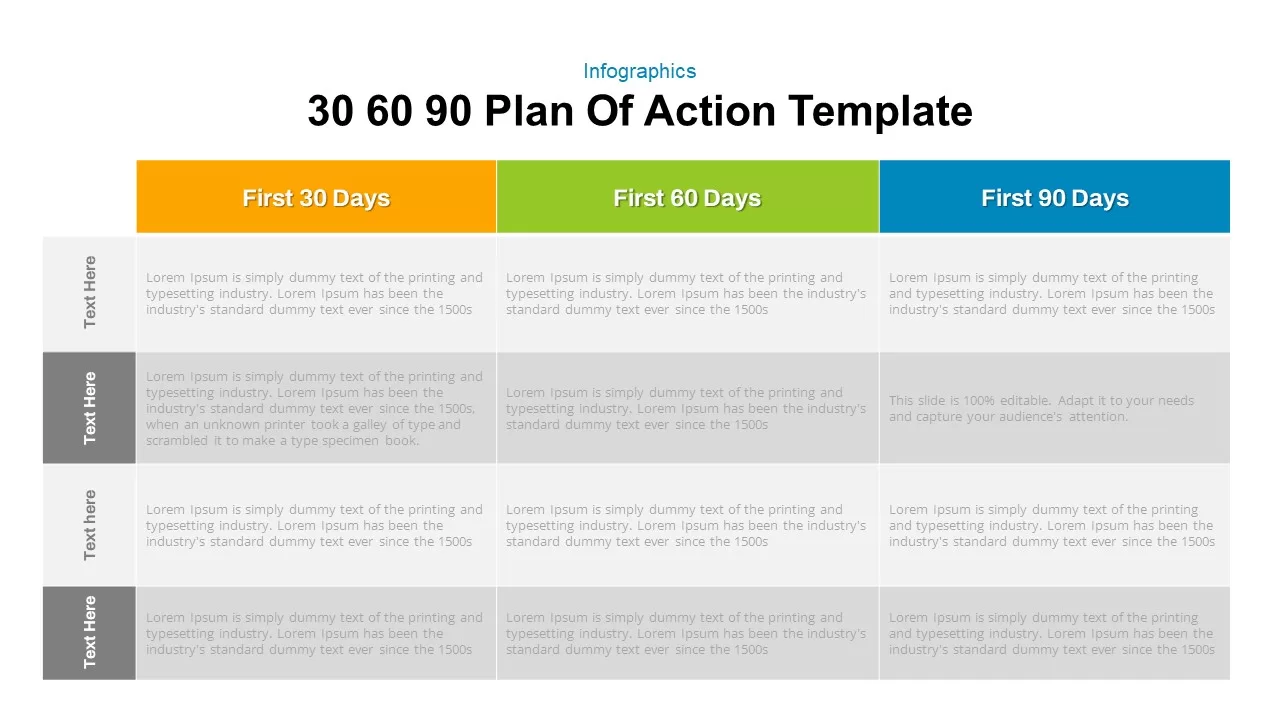
30 60 90 Day Plan Matrix Table Template for PowerPoint & Google Slides
Timeline
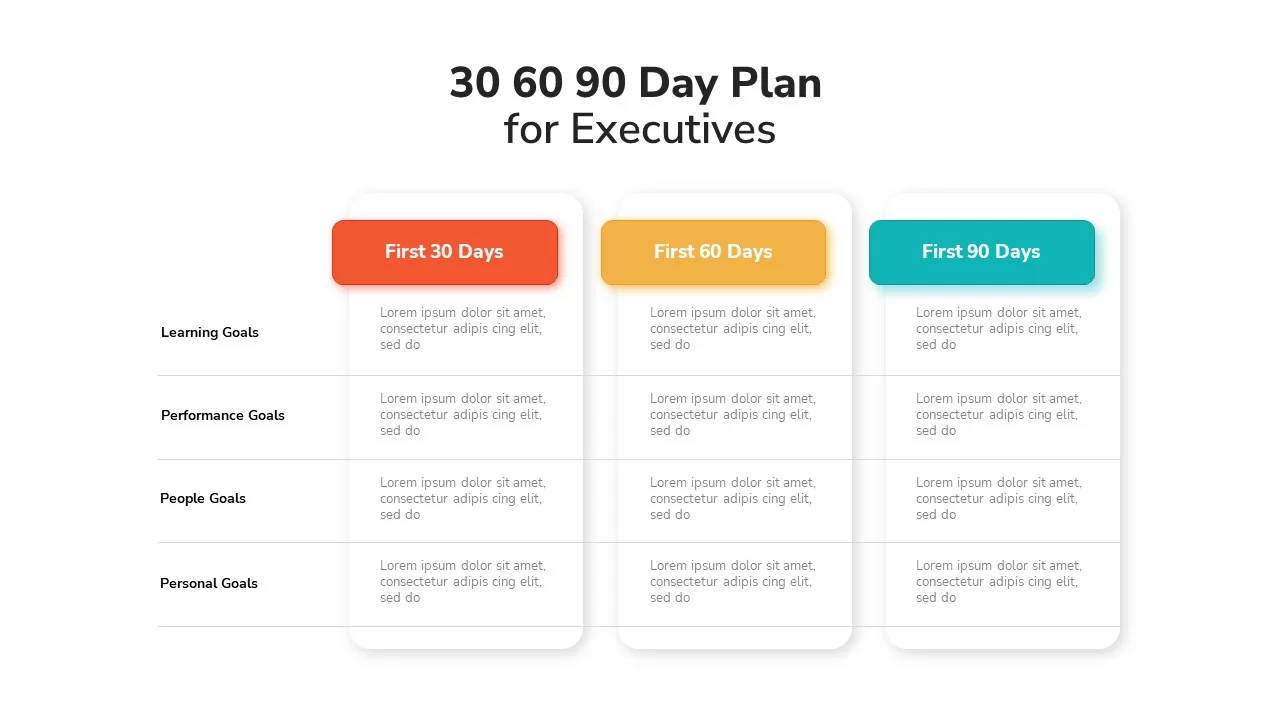
Executive 30-60-90 Day Plan Matrix Template for PowerPoint & Google Slides
Timeline
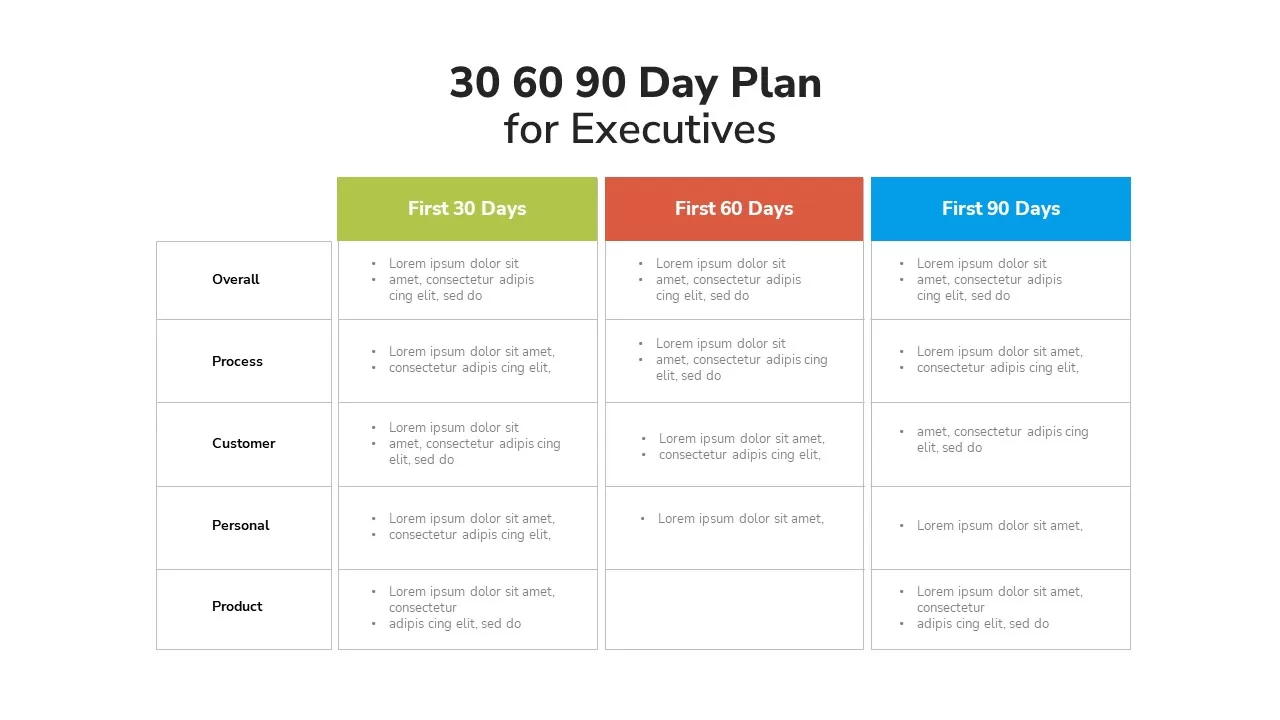
Executive 30-60-90 Day Plan Matrix Template for PowerPoint & Google Slides
Timeline
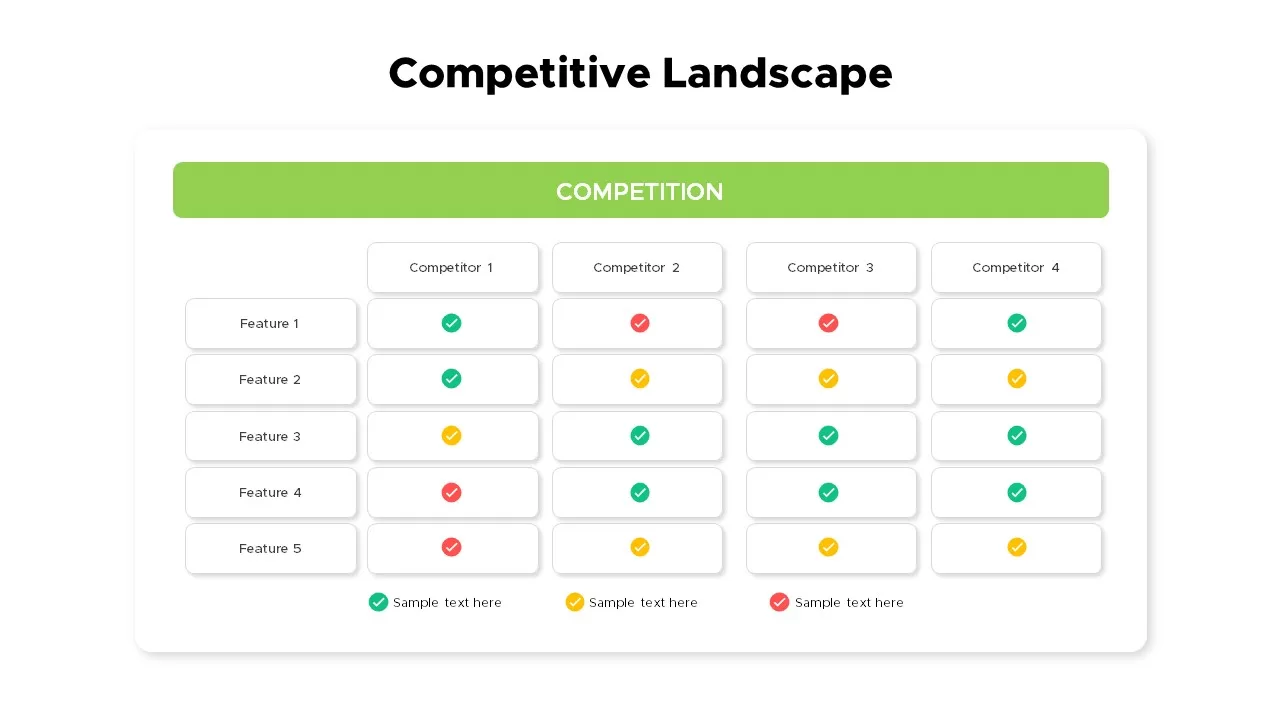
Competitive Landscape Matrix Template for PowerPoint & Google Slides
Comparison
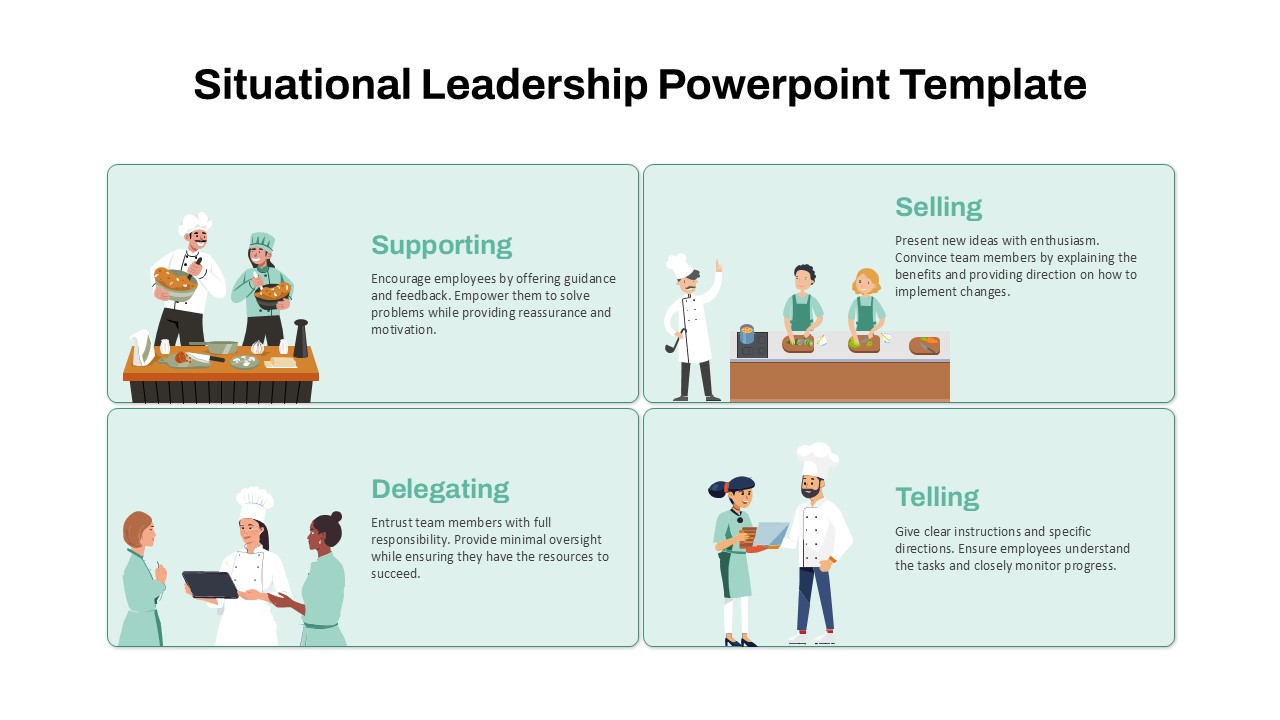
Situational Leadership Matrix Template for PowerPoint & Google Slides
Process
9-Box Matrix for Performance & Potential Template for PowerPoint & Google Slides
Employee Performance
Professional Interactive Heat Map Matrix Template for PowerPoint & Google Slides
Comparison Chart
Heat Map Risk Matrix Dashboard Template for PowerPoint & Google Slides
Comparison Chart
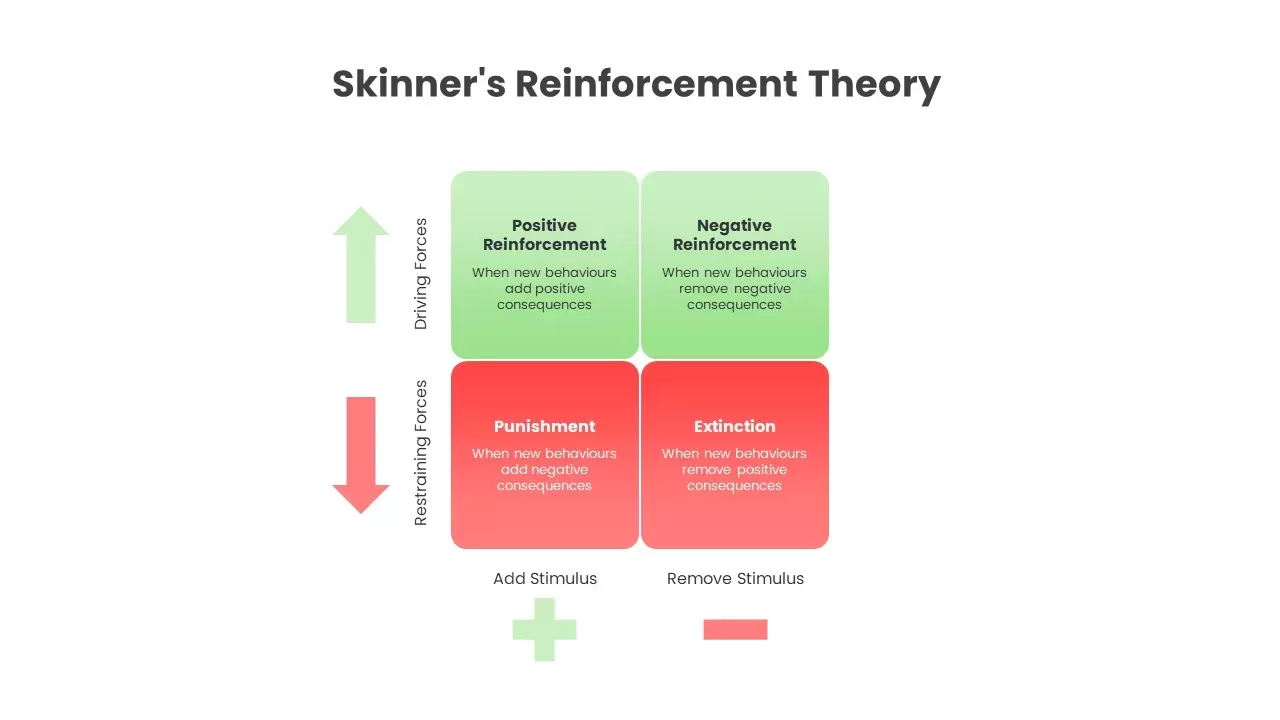
Skinner’s Reinforcement Theory Matrix Template for PowerPoint & Google Slides
Comparison
Risk Assessment Heatmap Matrix Slide Template for PowerPoint & Google Slides
Comparison Chart
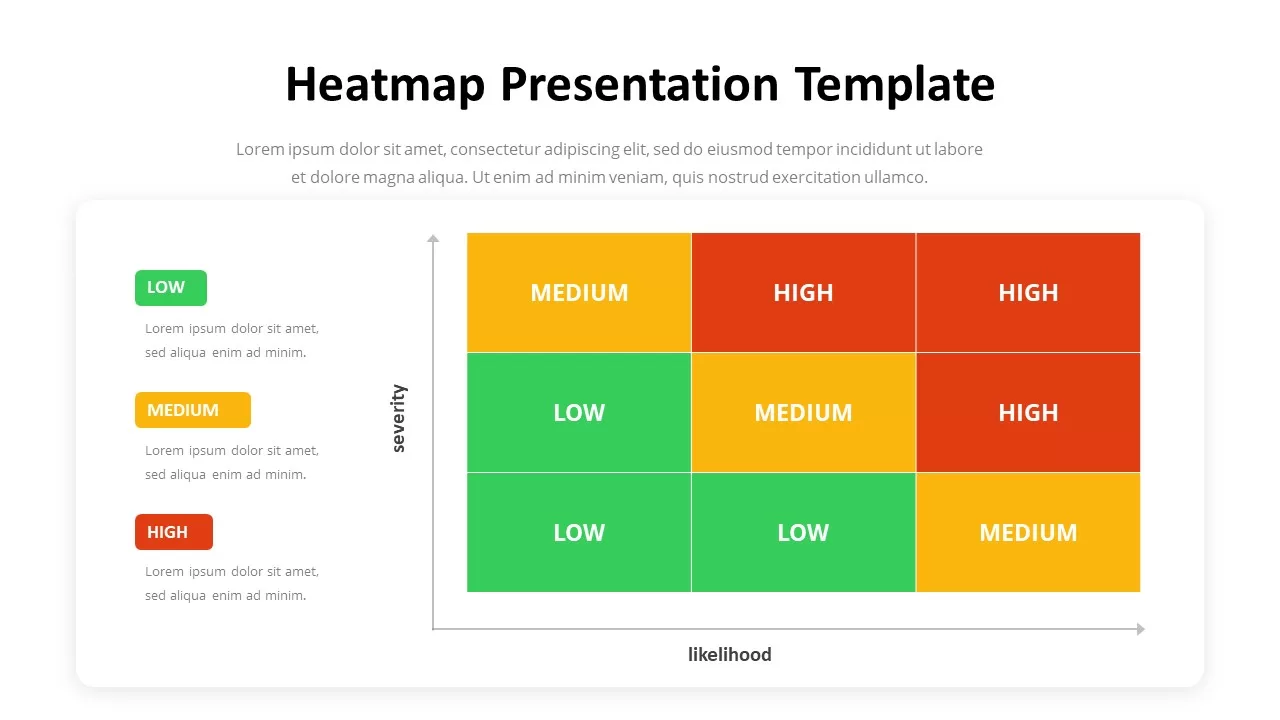
Heatmap Matrix Template for PowerPoint & Google Slides
Maps
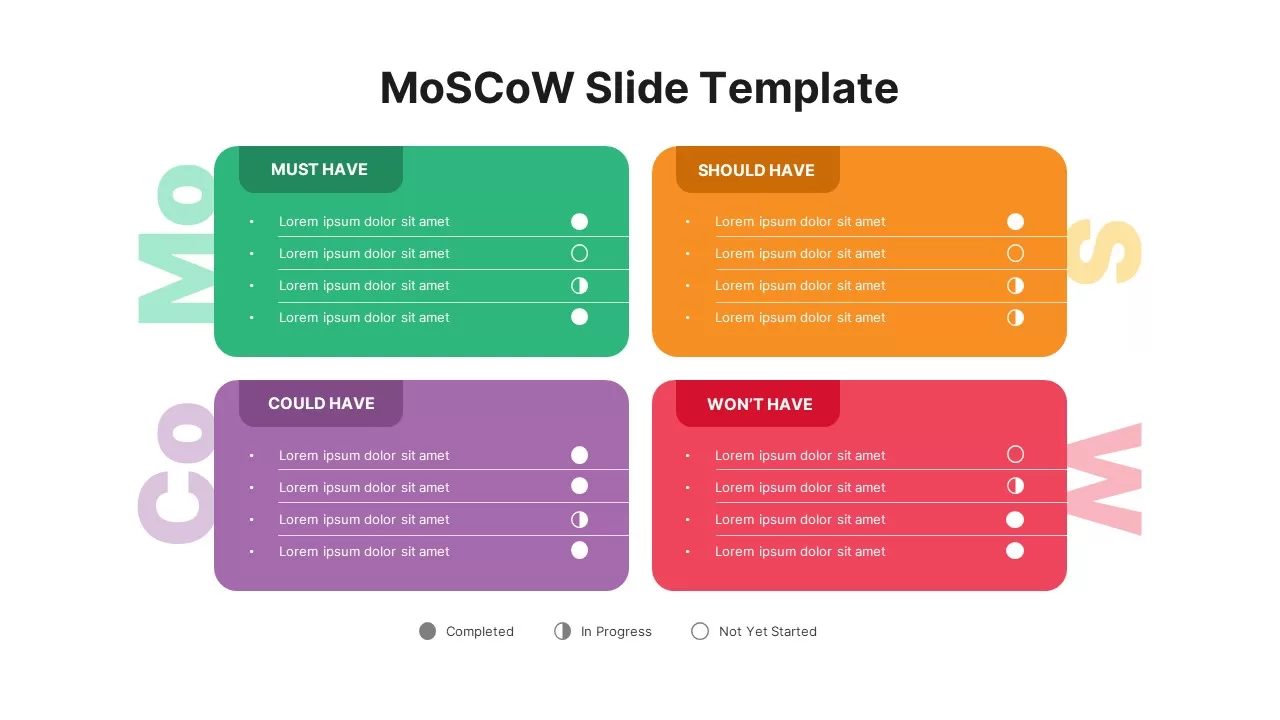
MoSCoW Prioritization Matrix Slide Template for PowerPoint & Google Slides
Business Strategy
Vendor Comparison Matrix with High-Level Requirements template for PowerPoint & Google Slides
Comparison Chart
MABA Attractiveness Matrix Chart Template for PowerPoint & Google Slides
Comparison Chart
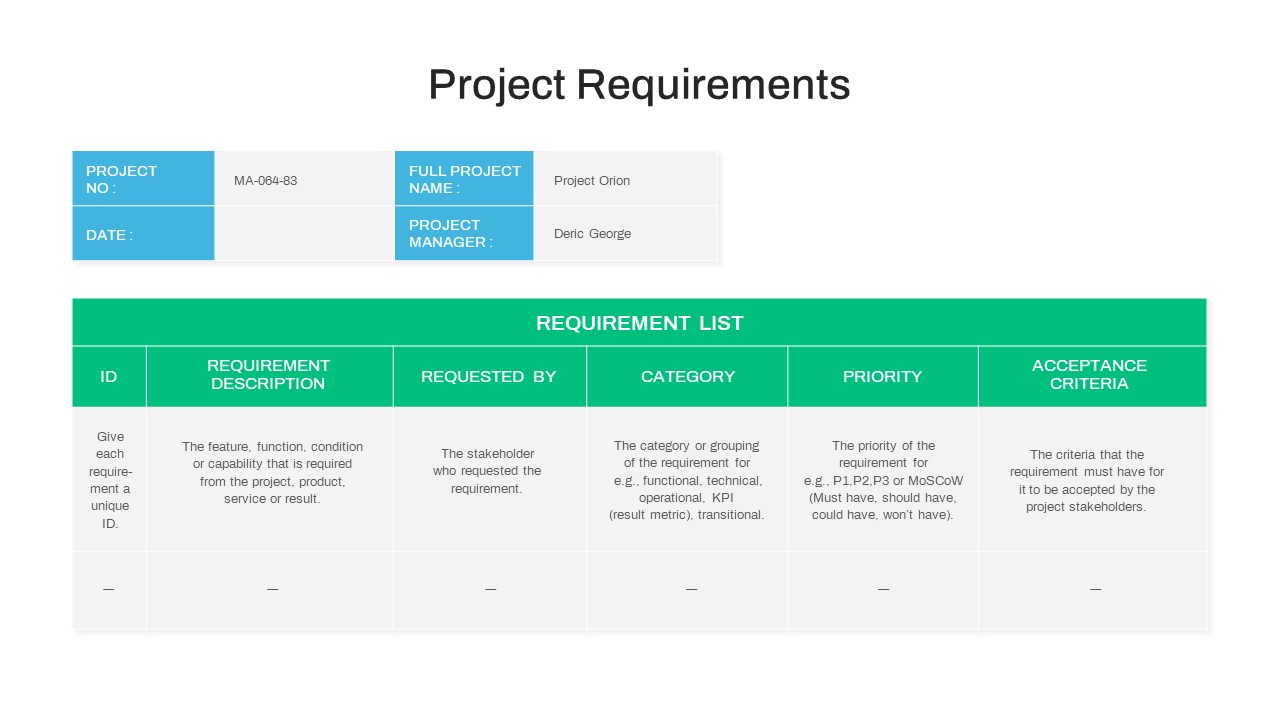
Project Requirements Matrix Template for PowerPoint & Google Slides
Project
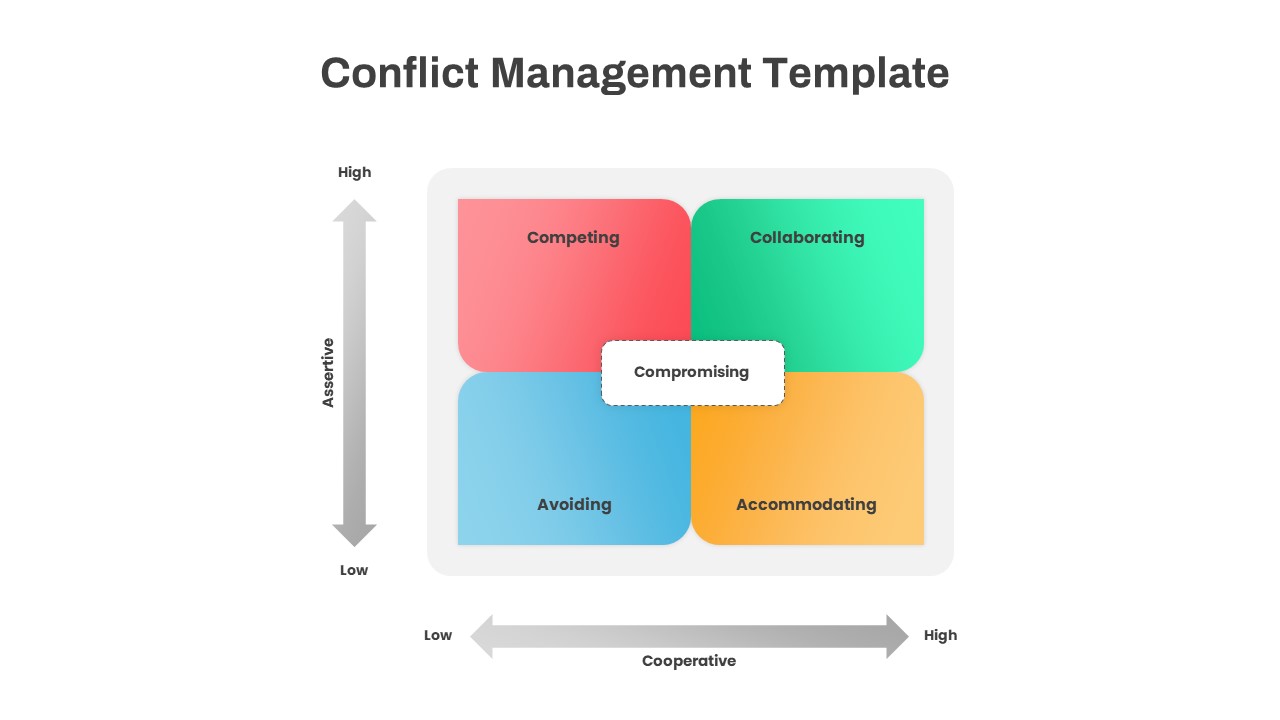
Conflict Management Matrix Template for PowerPoint & Google Slides
Leadership
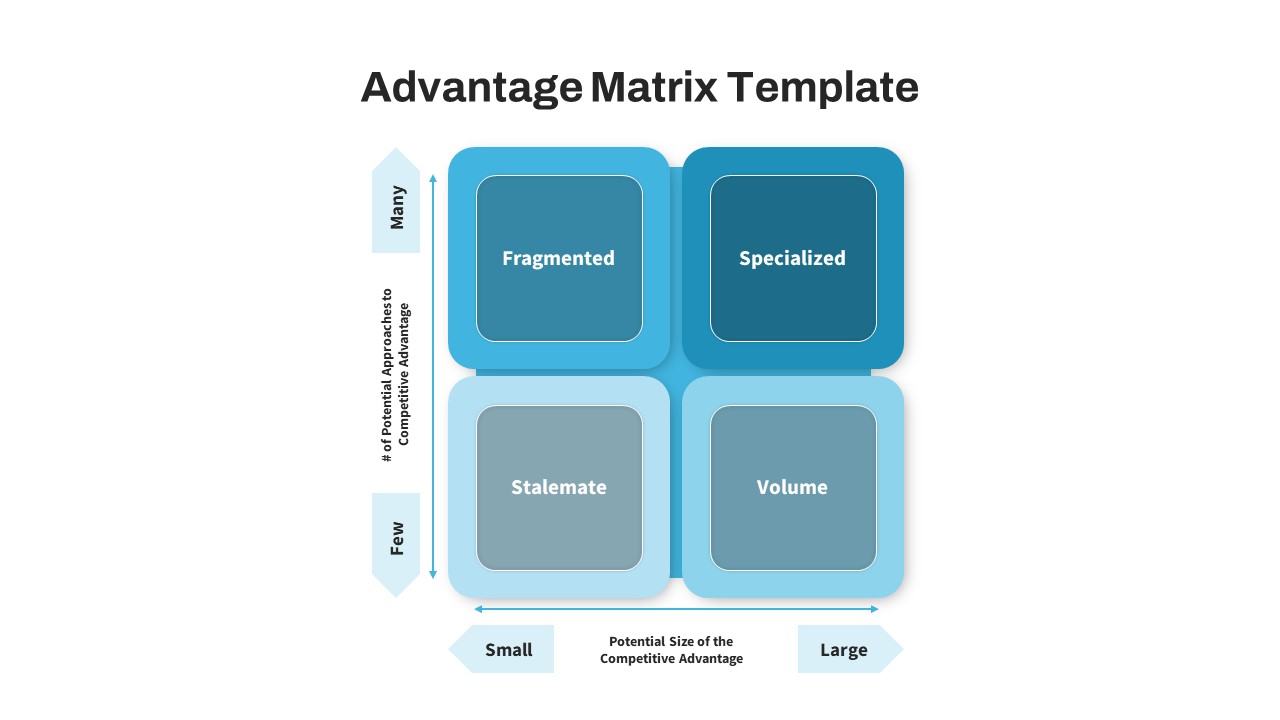
Advantage Matrix 2×2 Framework Template for PowerPoint & Google Slides
Competitor Analysis
Bubble Chart Scatter, Diagram & Matrix Template for PowerPoint & Google Slides
Comparison Chart
Business Growth Strategies Matrix Template for PowerPoint & Google Slides
Comparison
Free Competitor Analysis Matrix Template for PowerPoint & Google Slides
Competitor Analysis
Free
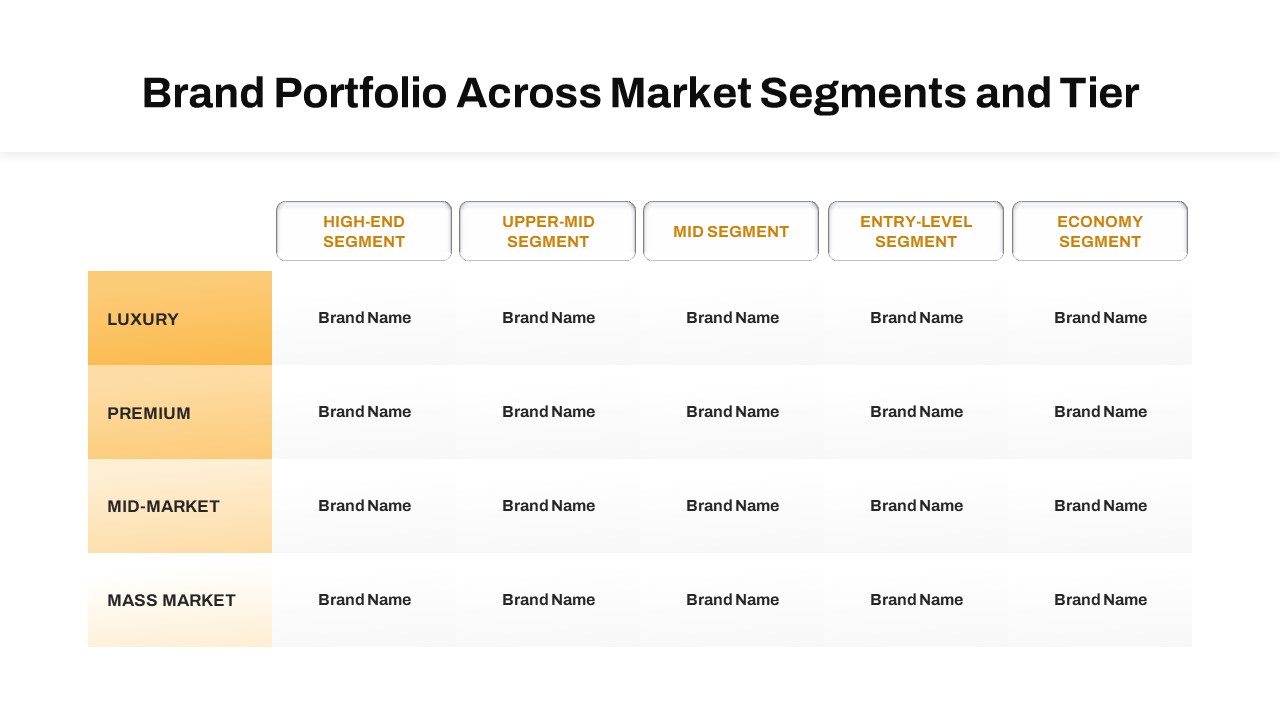
Brand Portfolio Matrix: Segments & Tiers Template for PowerPoint & Google Slides
Business Report
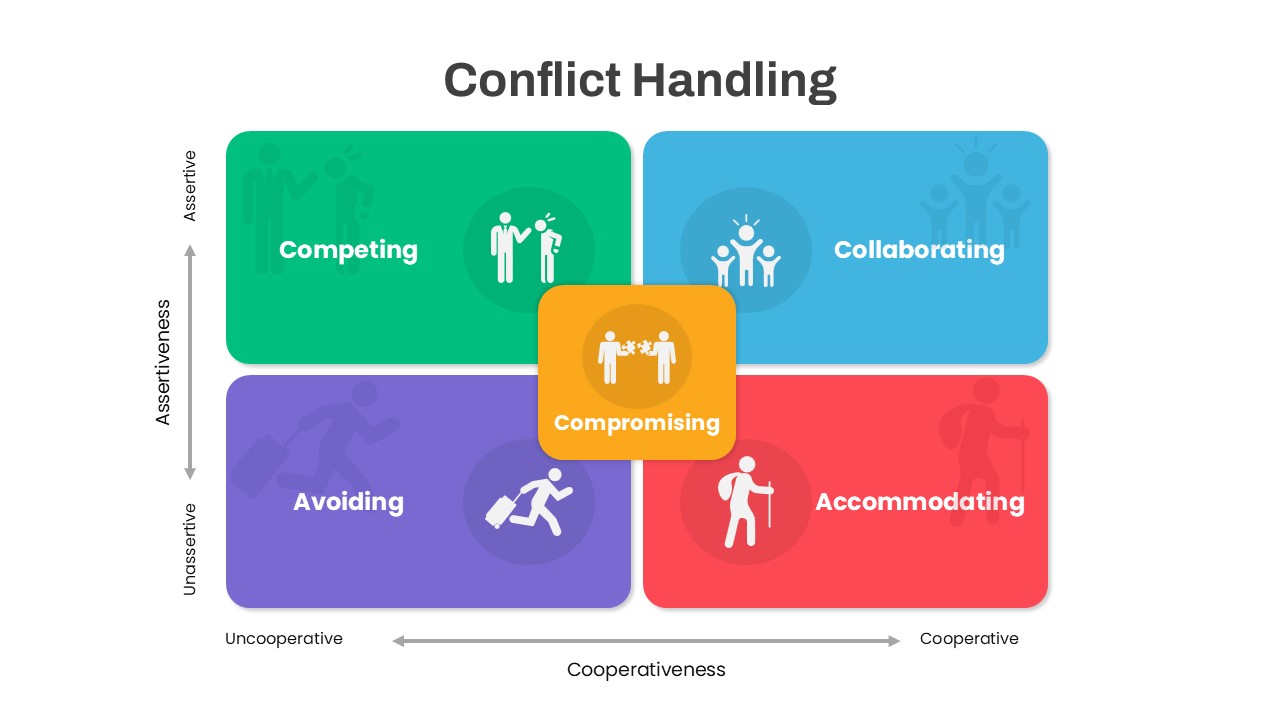
Colorful Conflict Handling Matrix Template for PowerPoint & Google Slides
Comparison
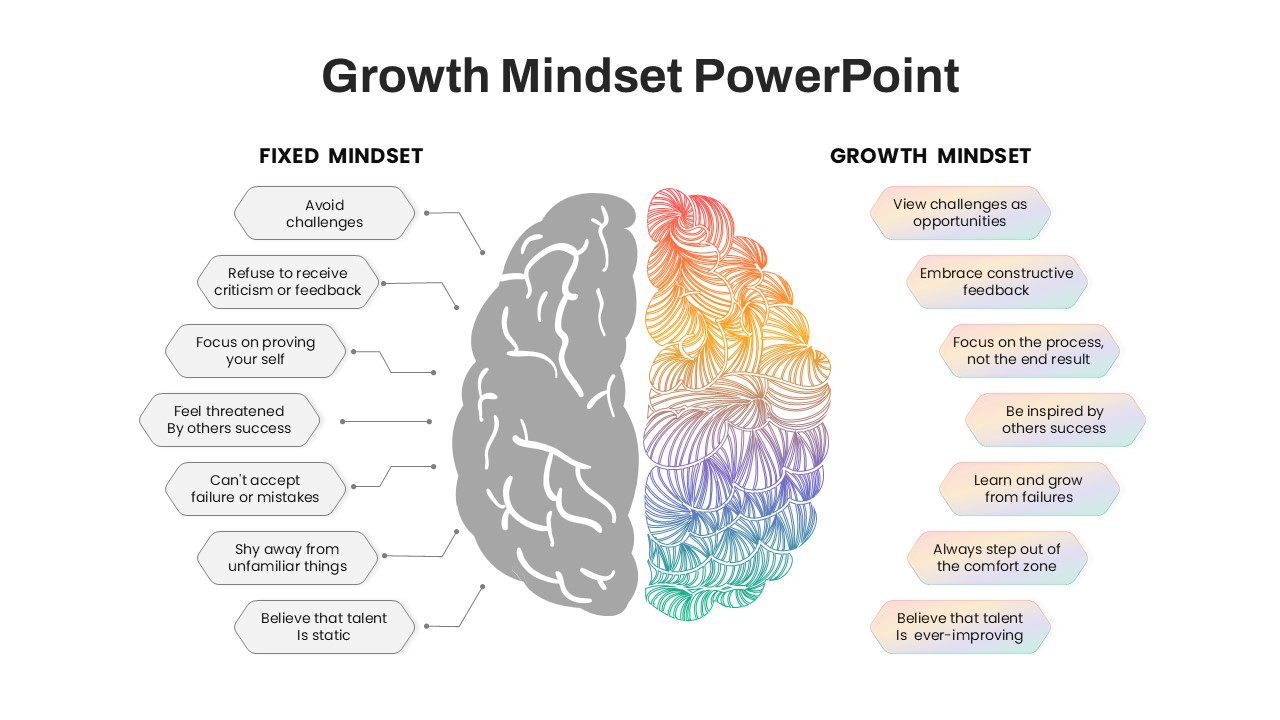
Fixed vs Growth Mindset Matrix Template for PowerPoint & Google Slides
Comparison
Decision Matrix & Prioritization Chart Template for PowerPoint & Google Slides
Comparison Chart
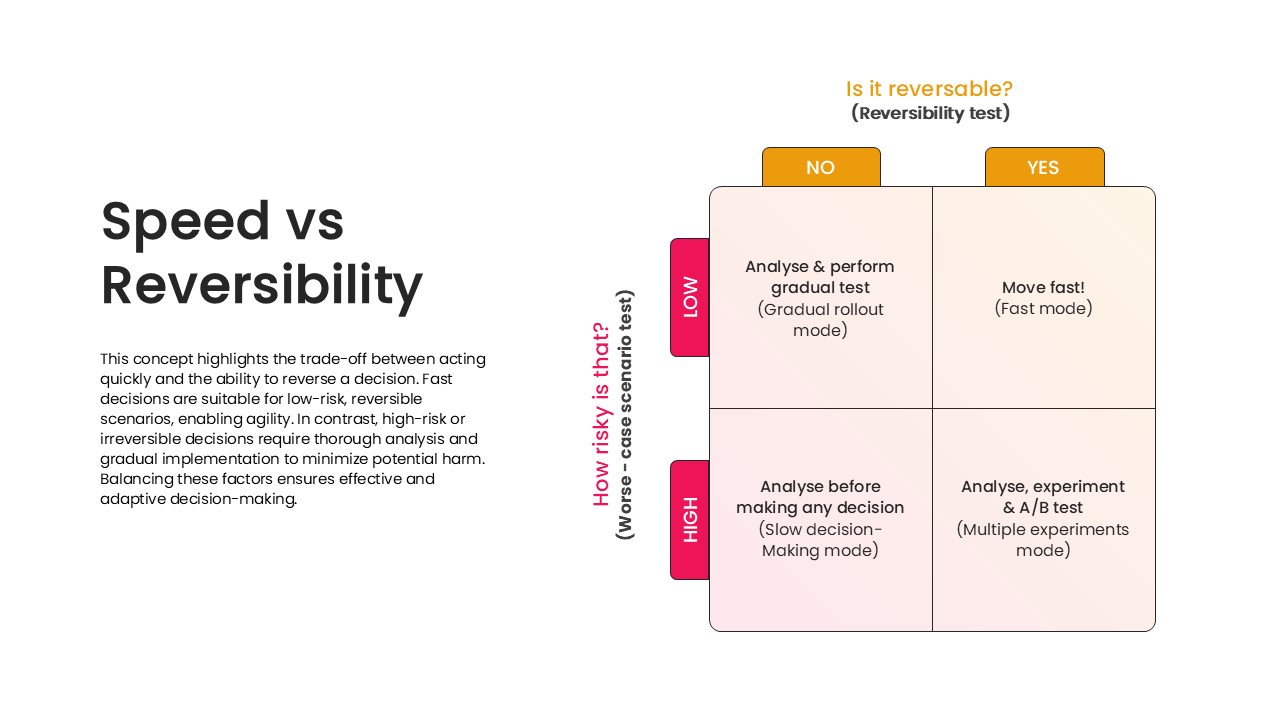
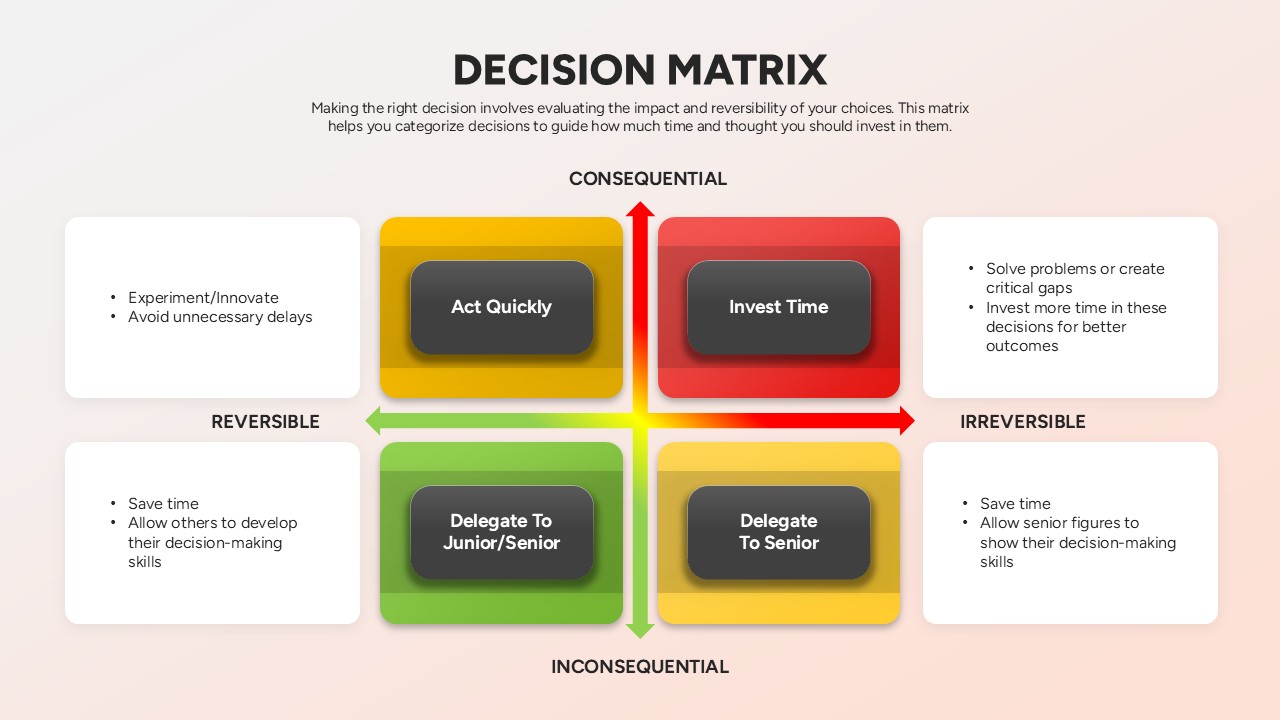
Speed vs Reversibility Decision Matrix Template for PowerPoint & Google Slides
Comparison
Ansoff Growth Matrix Professional Template for PowerPoint & Google Slides
Comparison
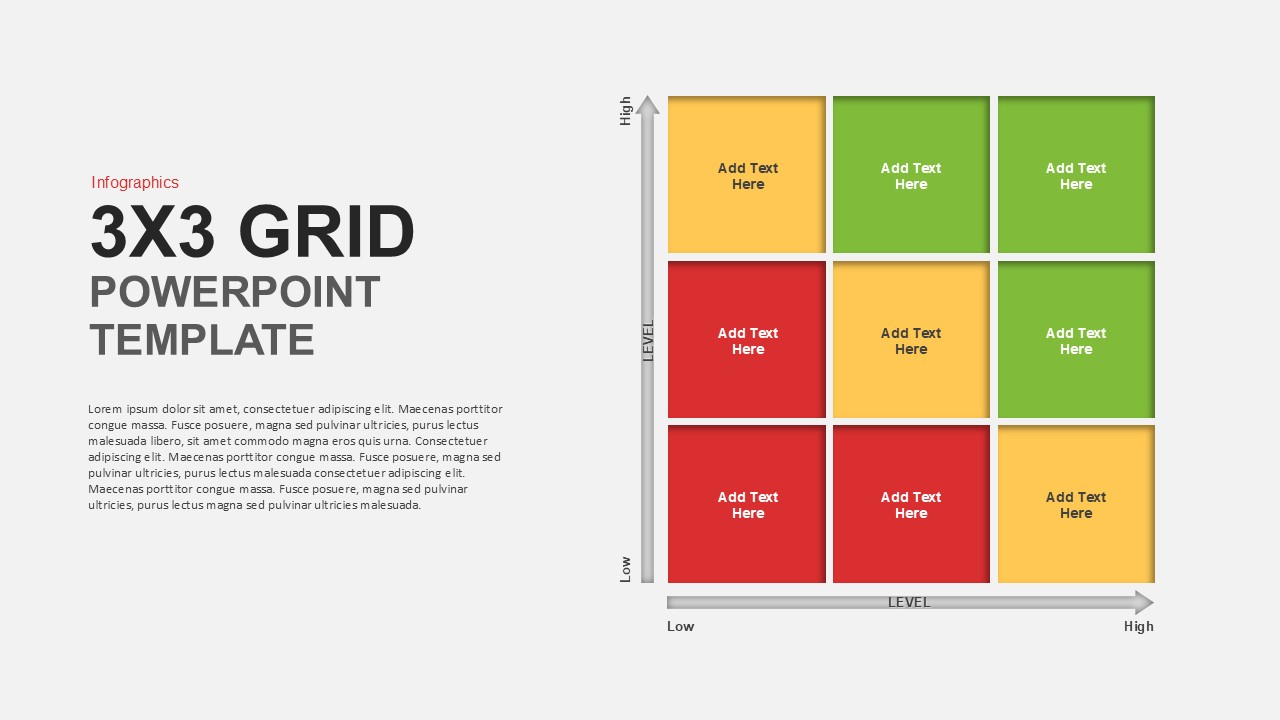
Matrix Grid Diagram Template for PowerPoint & Google Slides
Comparison
Porter’s Generic Strategies Matrix Template for PowerPoint & Google Slides
Business Strategy
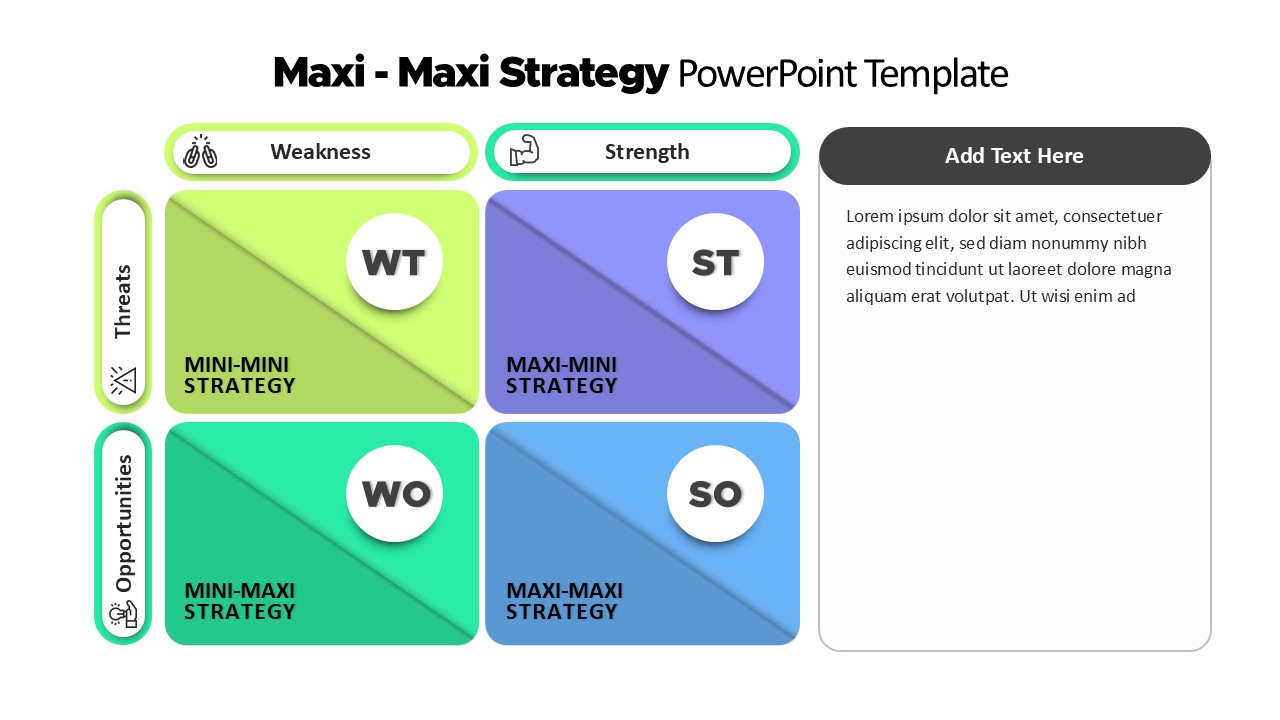
Maxi-Maxi Strategy Matrix SWOT Diagram Template for PowerPoint & Google Slides
SWOT
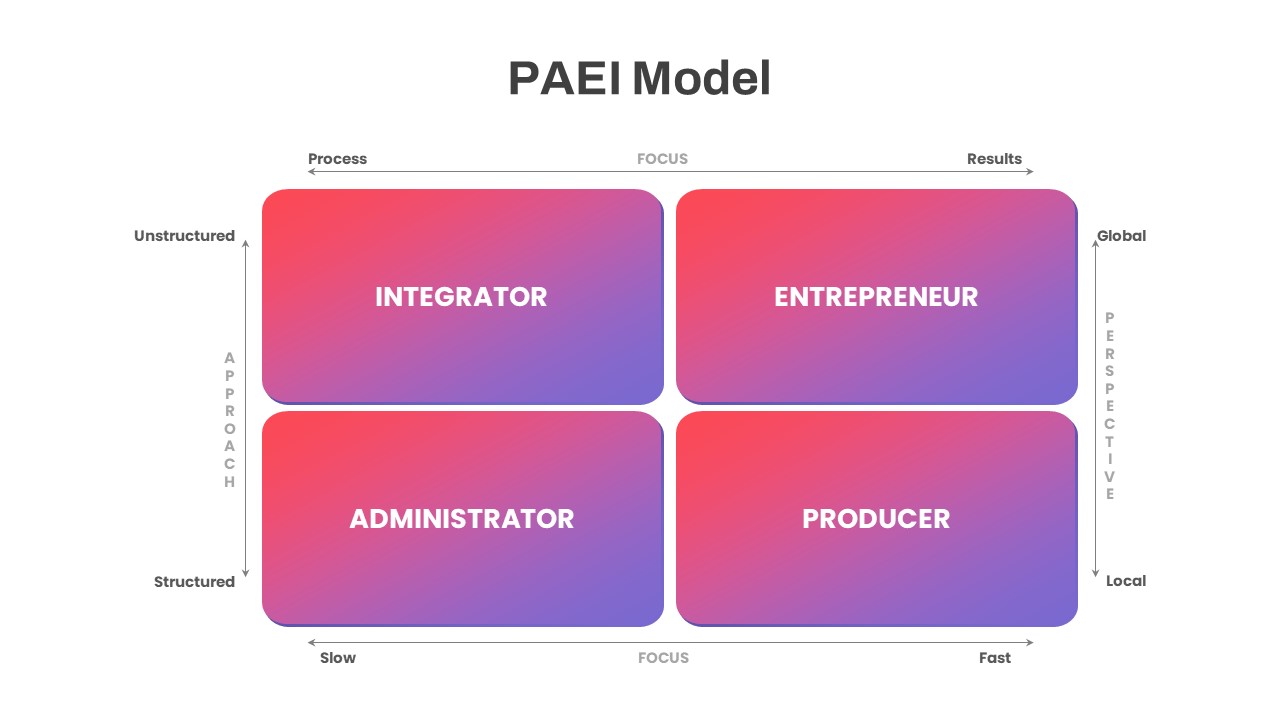
PAEI Leadership Roles 2×2 Matrix Diagram Template for PowerPoint & Google Slides
Business Models
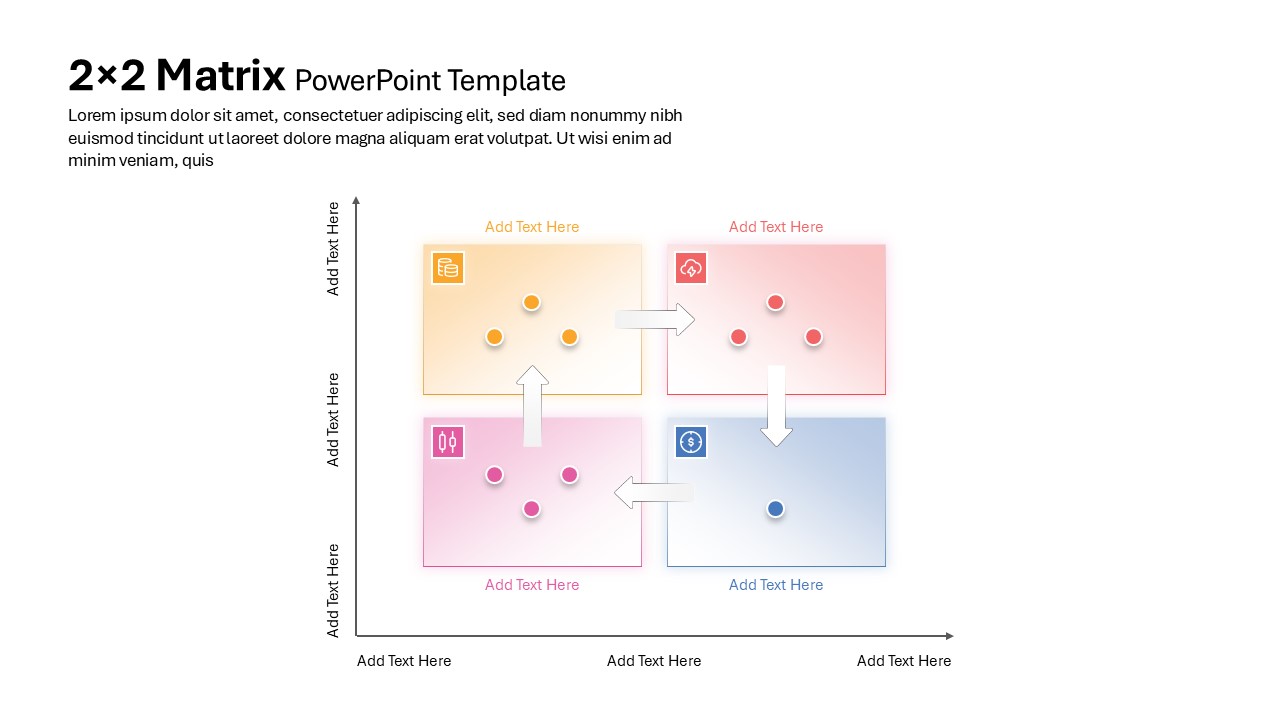
2×2 Matrix PowerPoint & Google Slides Template
Business Models
Competitor Profile Matrix Comparison Template for PowerPoint & Google Slides
Comparison Chart
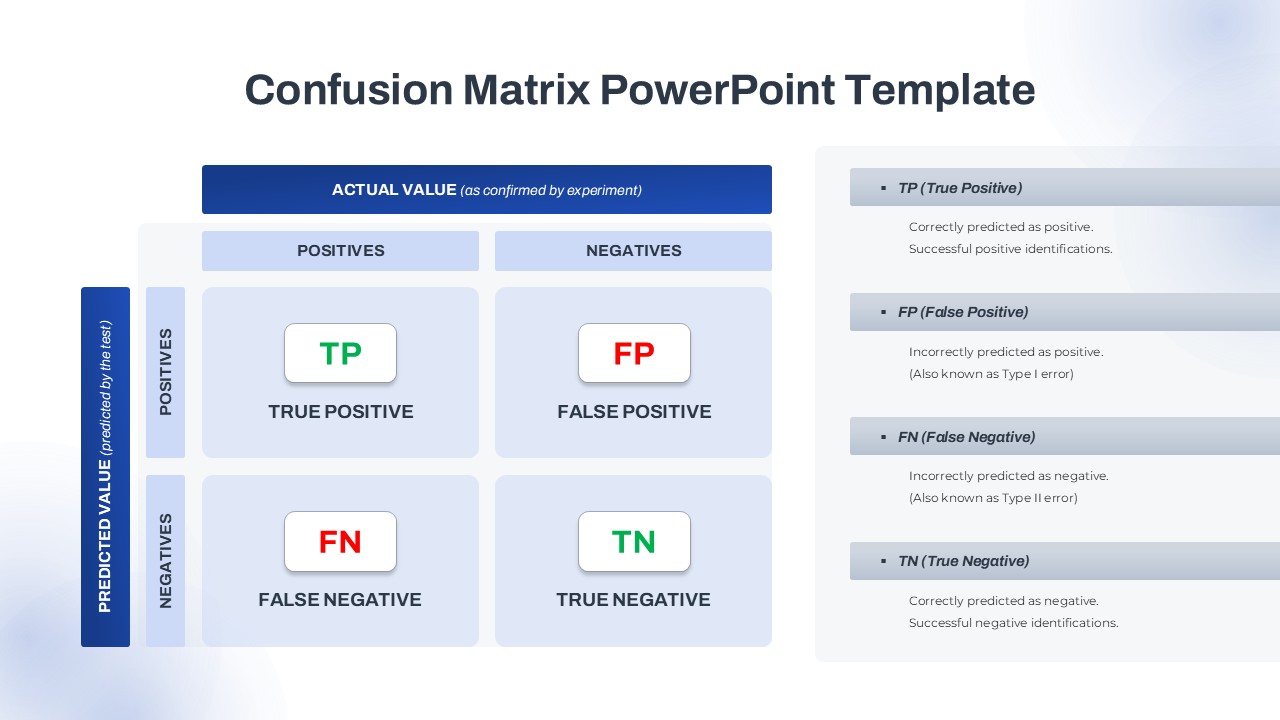
Confusion Matrix Diagram Overview Template for PowerPoint & Google Slides
Comparison
Risk Scoring & Ranking Heatmap Matrix Template for PowerPoint & Google Slides
Risk Management
Feasibility Matrix Comparison Chart Template for PowerPoint & Google Slides
Comparison Chart
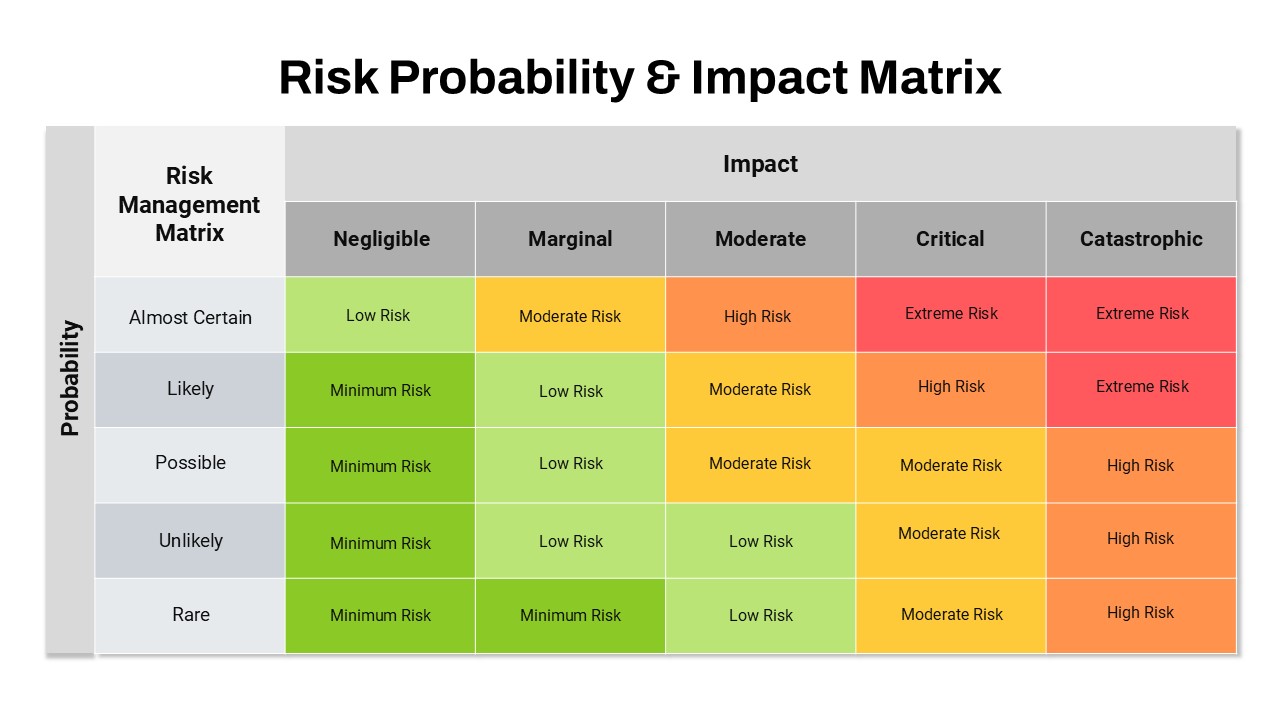
Risk Probability and Impact Matrix Template for PowerPoint & Google Slides
Risk Management
Quantitative Risk Analysis Matrix template for PowerPoint & Google Slides
Risk Management
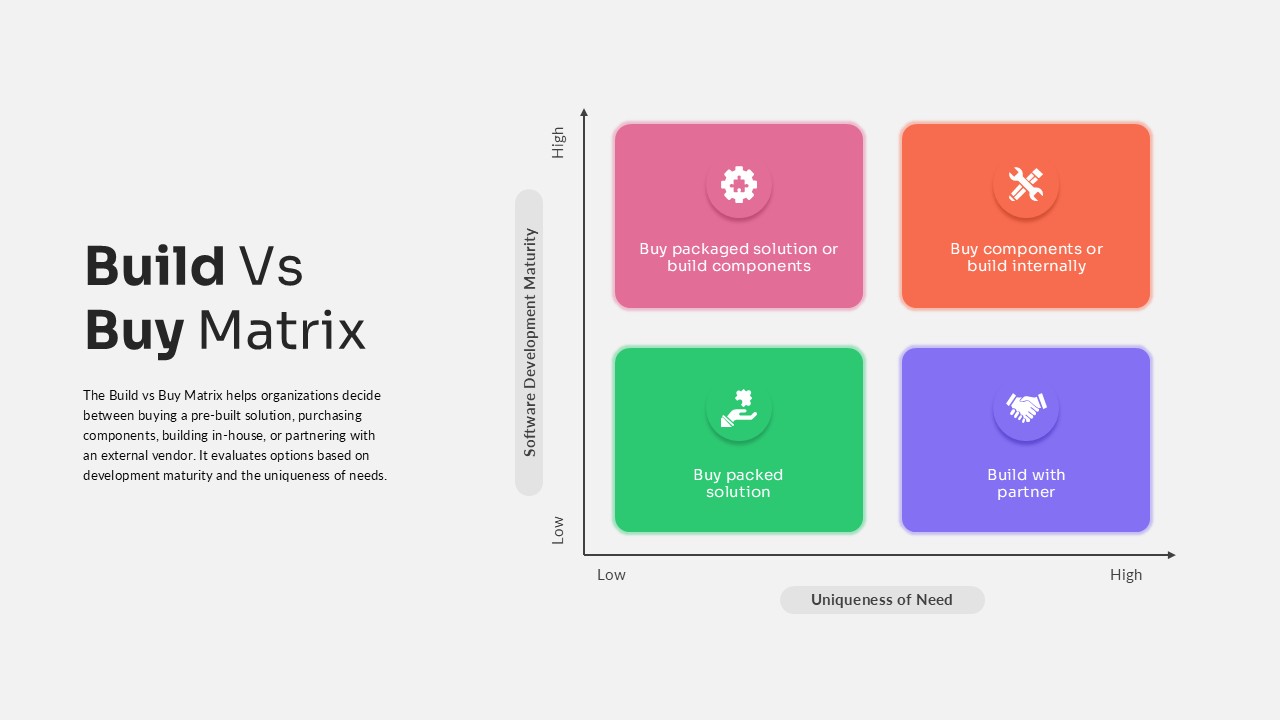
Build vs Buy Matrix Decision Framework template for PowerPoint & Google Slides
Business Strategy
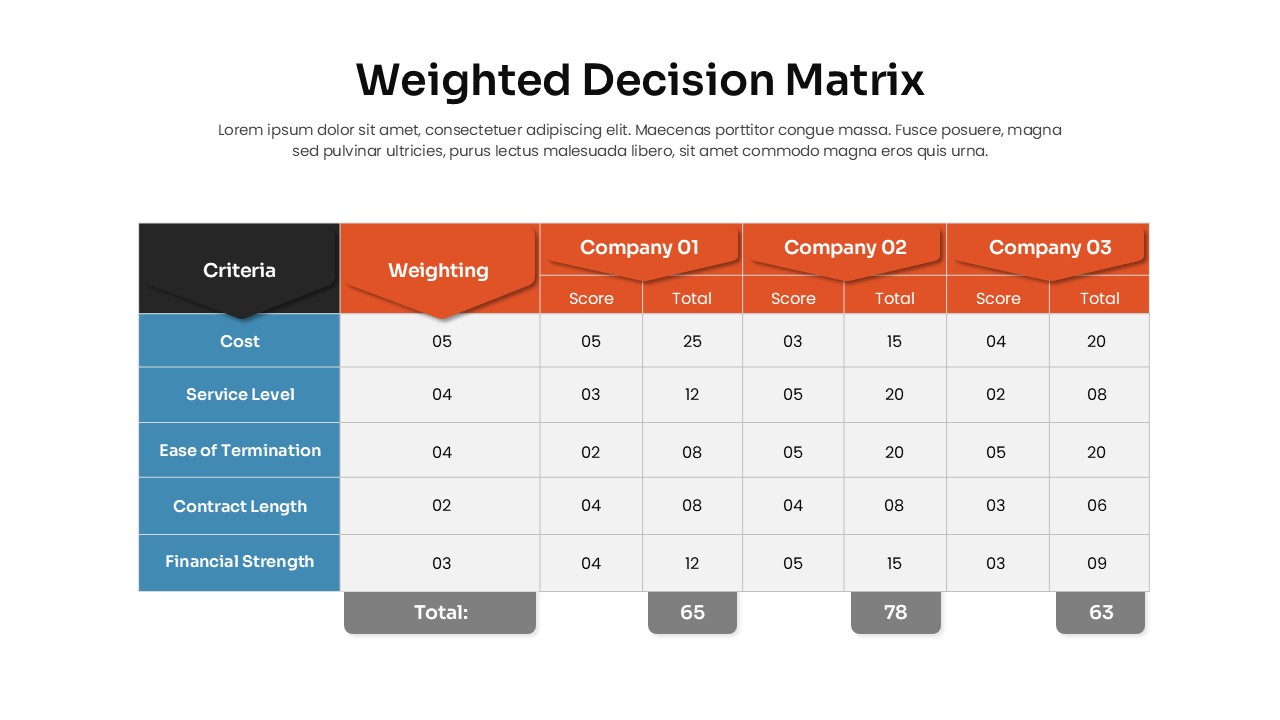
Weighted Decision Matrix template for PowerPoint & Google Slides
Business Models
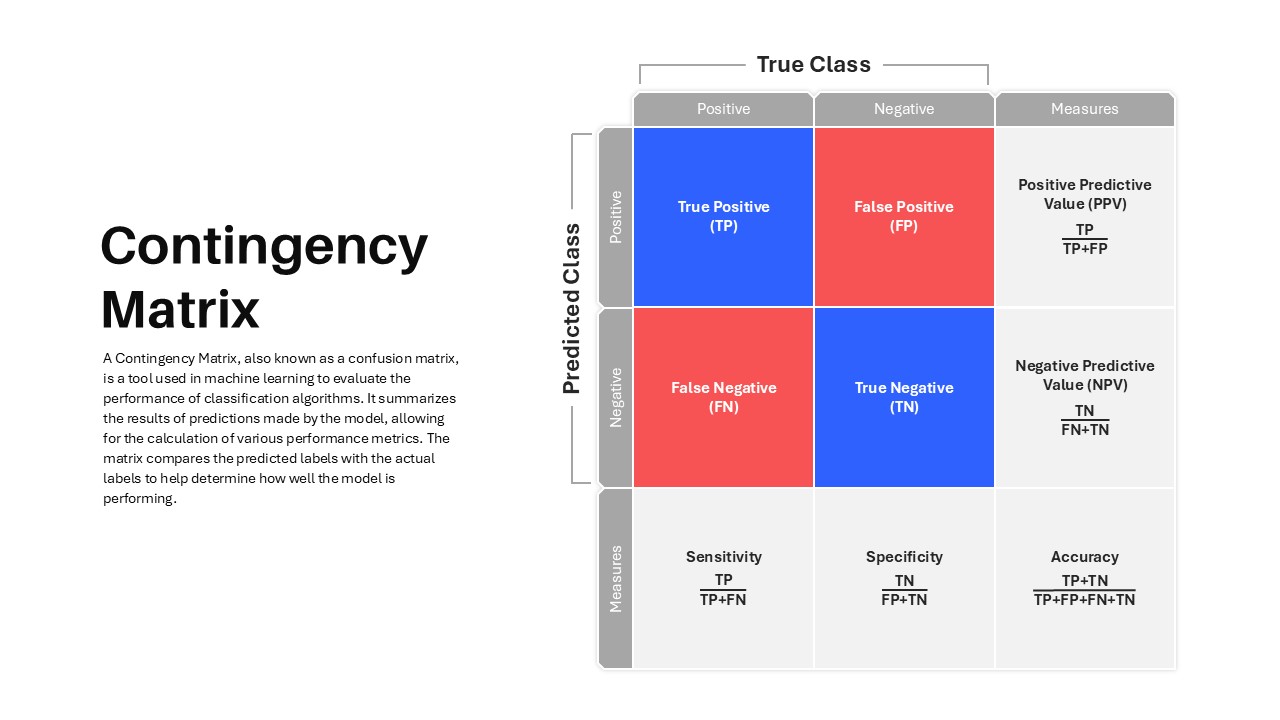
Contingency Matrix in Machine Learning template for PowerPoint & Google Slides
Technology
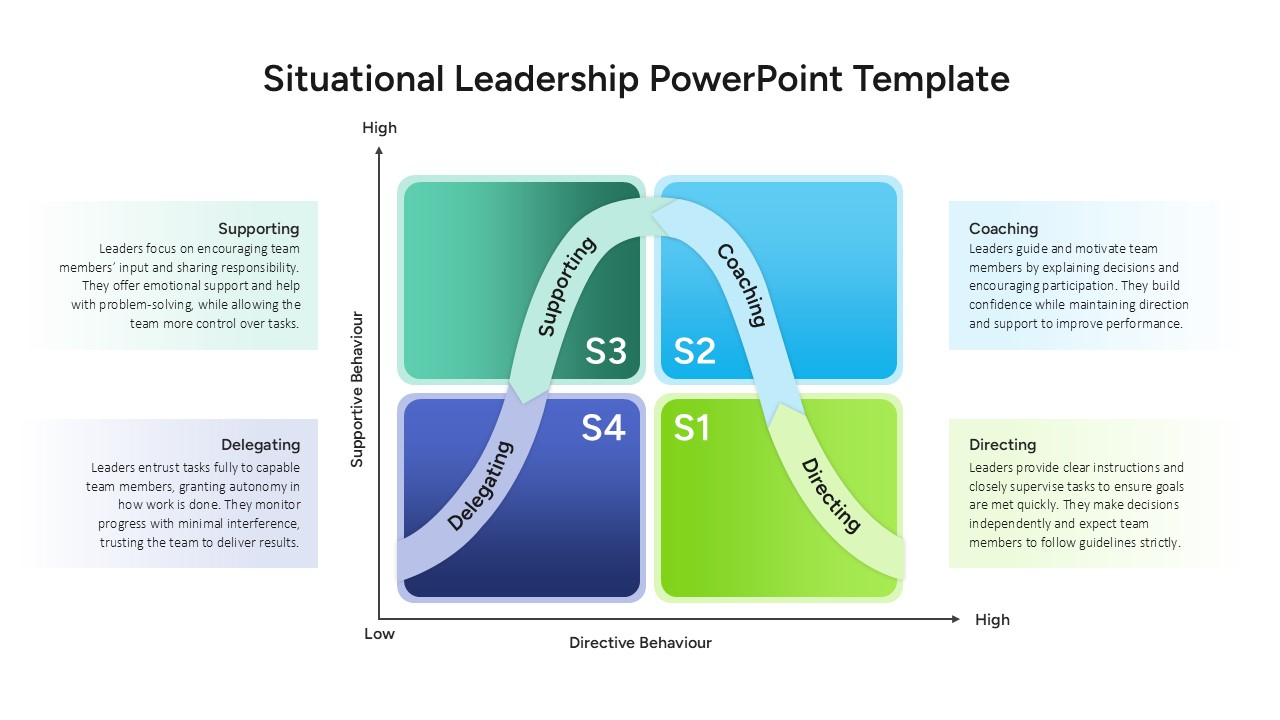
Situational Leadership Matrix Template for PowerPoint & Google Slides
Leadership
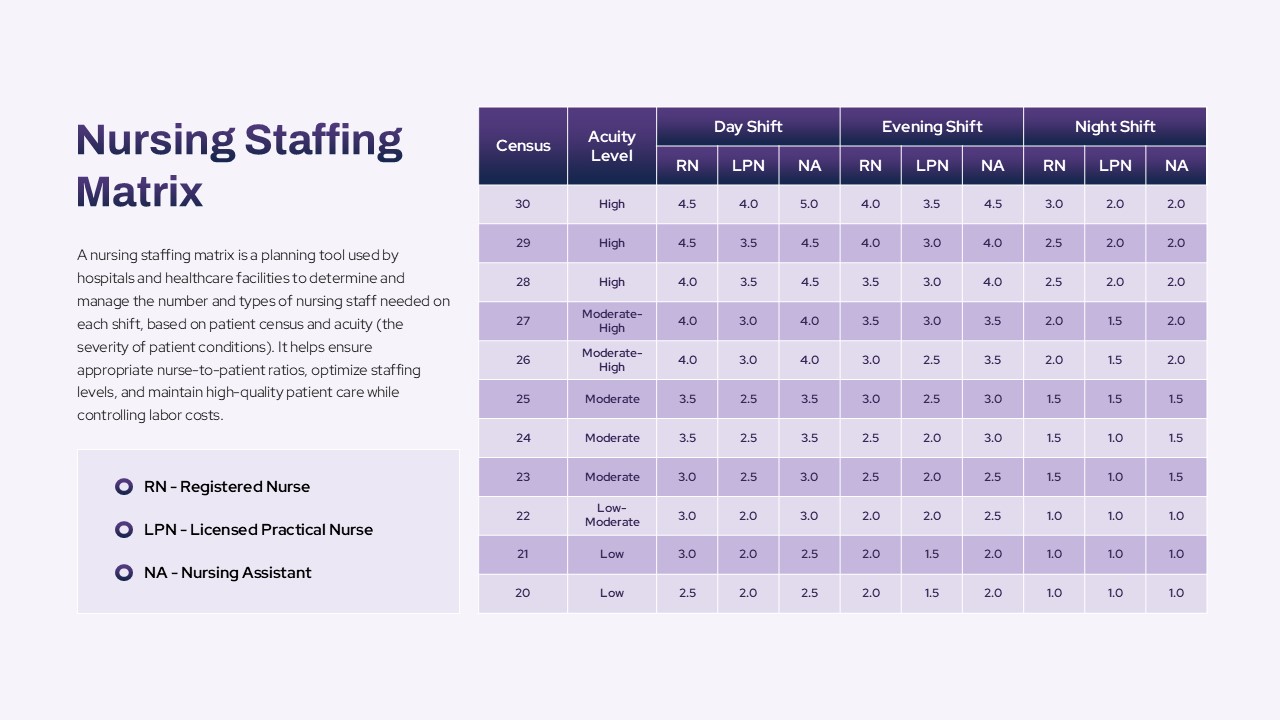
Nursing Staffing Matrix Planning Template for PowerPoint & Google Slides
Nursing
Disaster Response Role Matrix RACI Chart Template for PowerPoint & Google Slides
Project Status
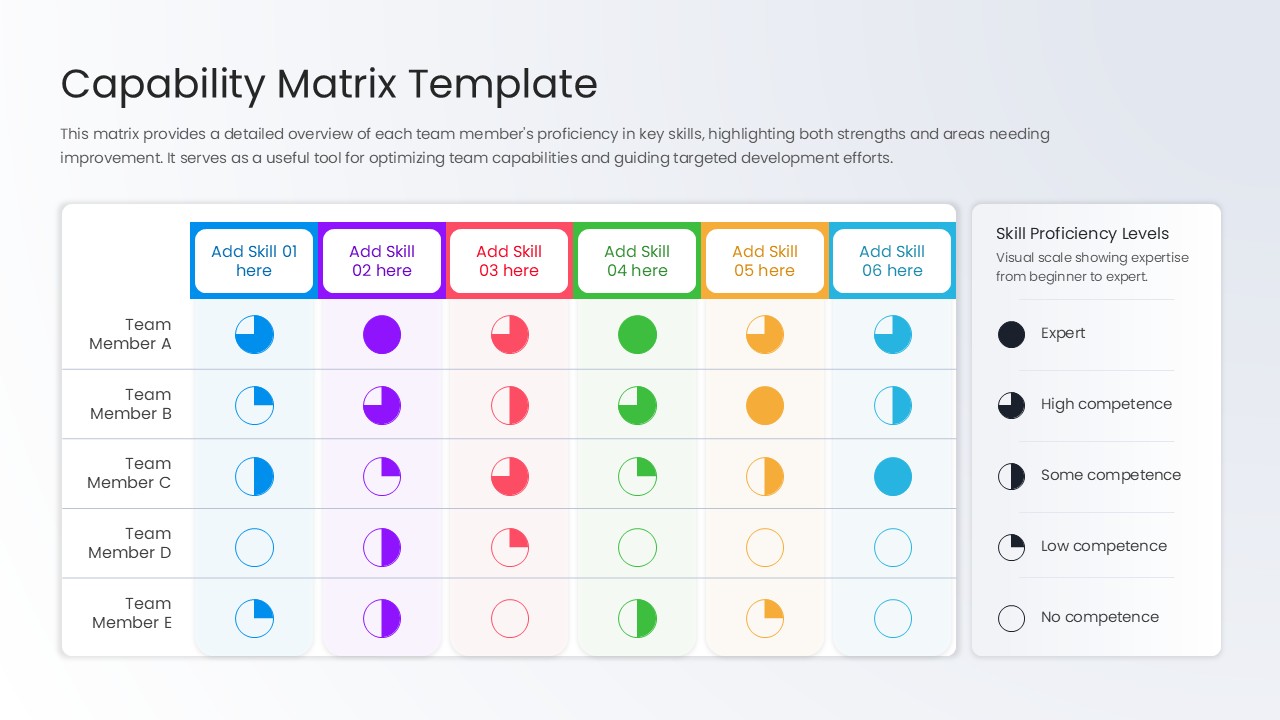
Capability Matrix Template for PowerPoint & Google Slides
HR
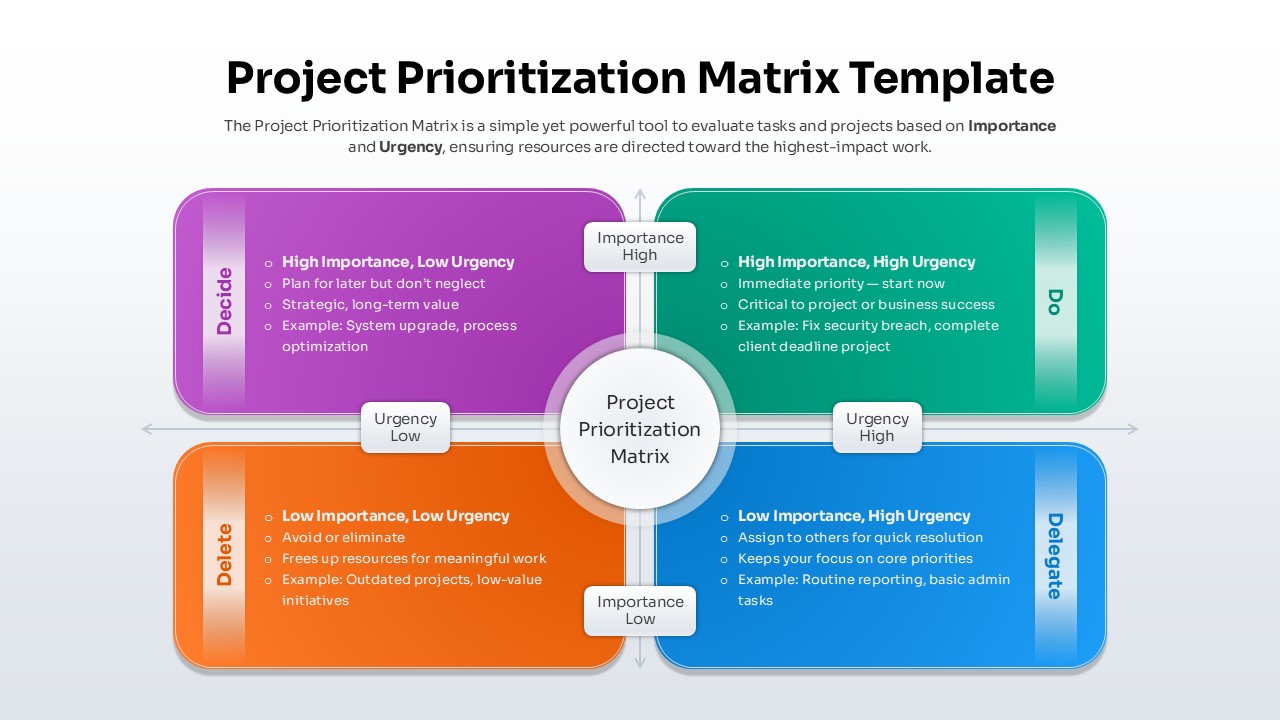
Project Prioritization Matrix Template for PowerPoint & Google Slides
Project
Personal SWOT Analysis Matrix Cards Template for PowerPoint & Google Slides
SWOT
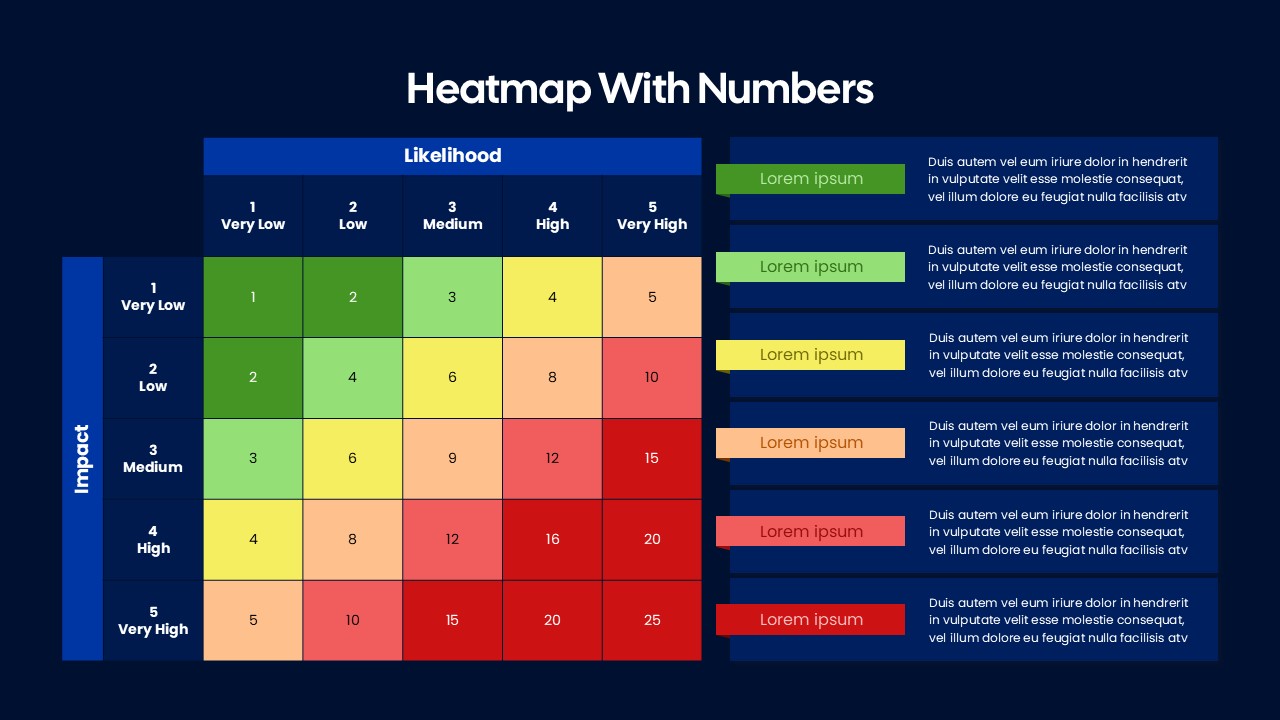
Heatmap Matrix with Numbers Template for PowerPoint & Google Slides
Project
Decision Matrix Evaluation Framework Slide Template for PowerPoint & Google Slides
Leadership
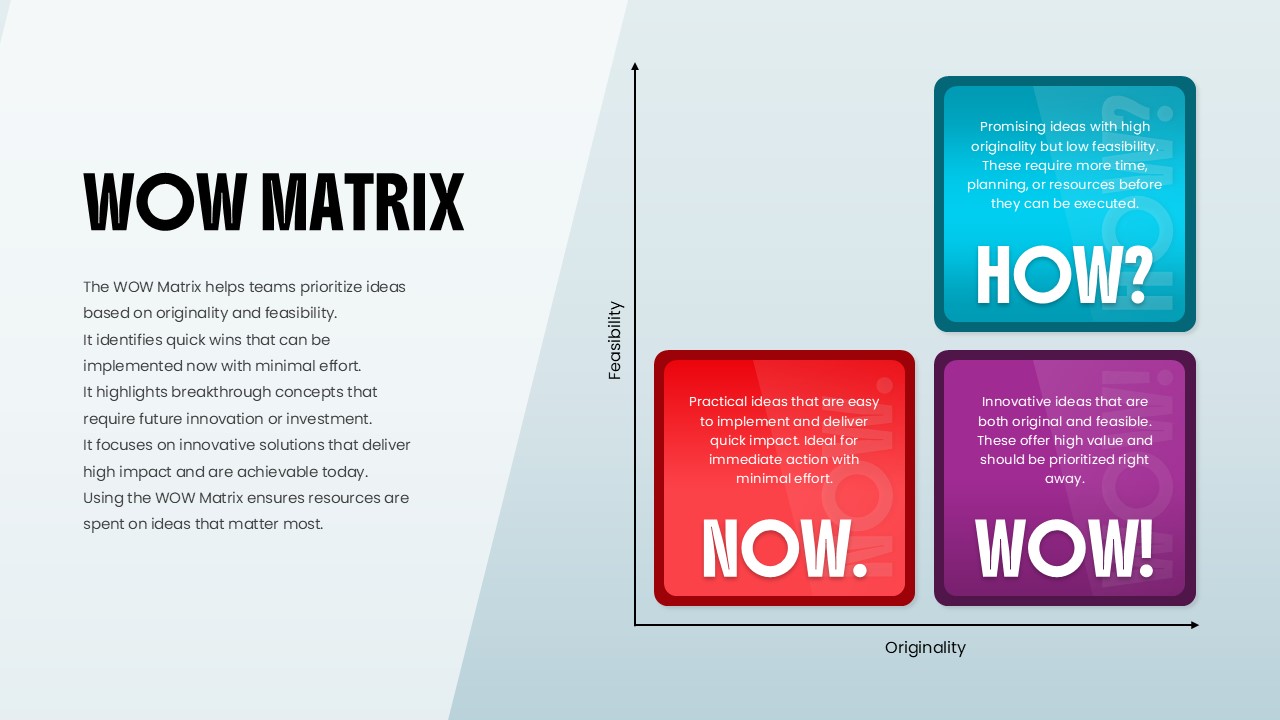
WOW Matrix Template for PowerPoint & Google Slides
Business Strategy
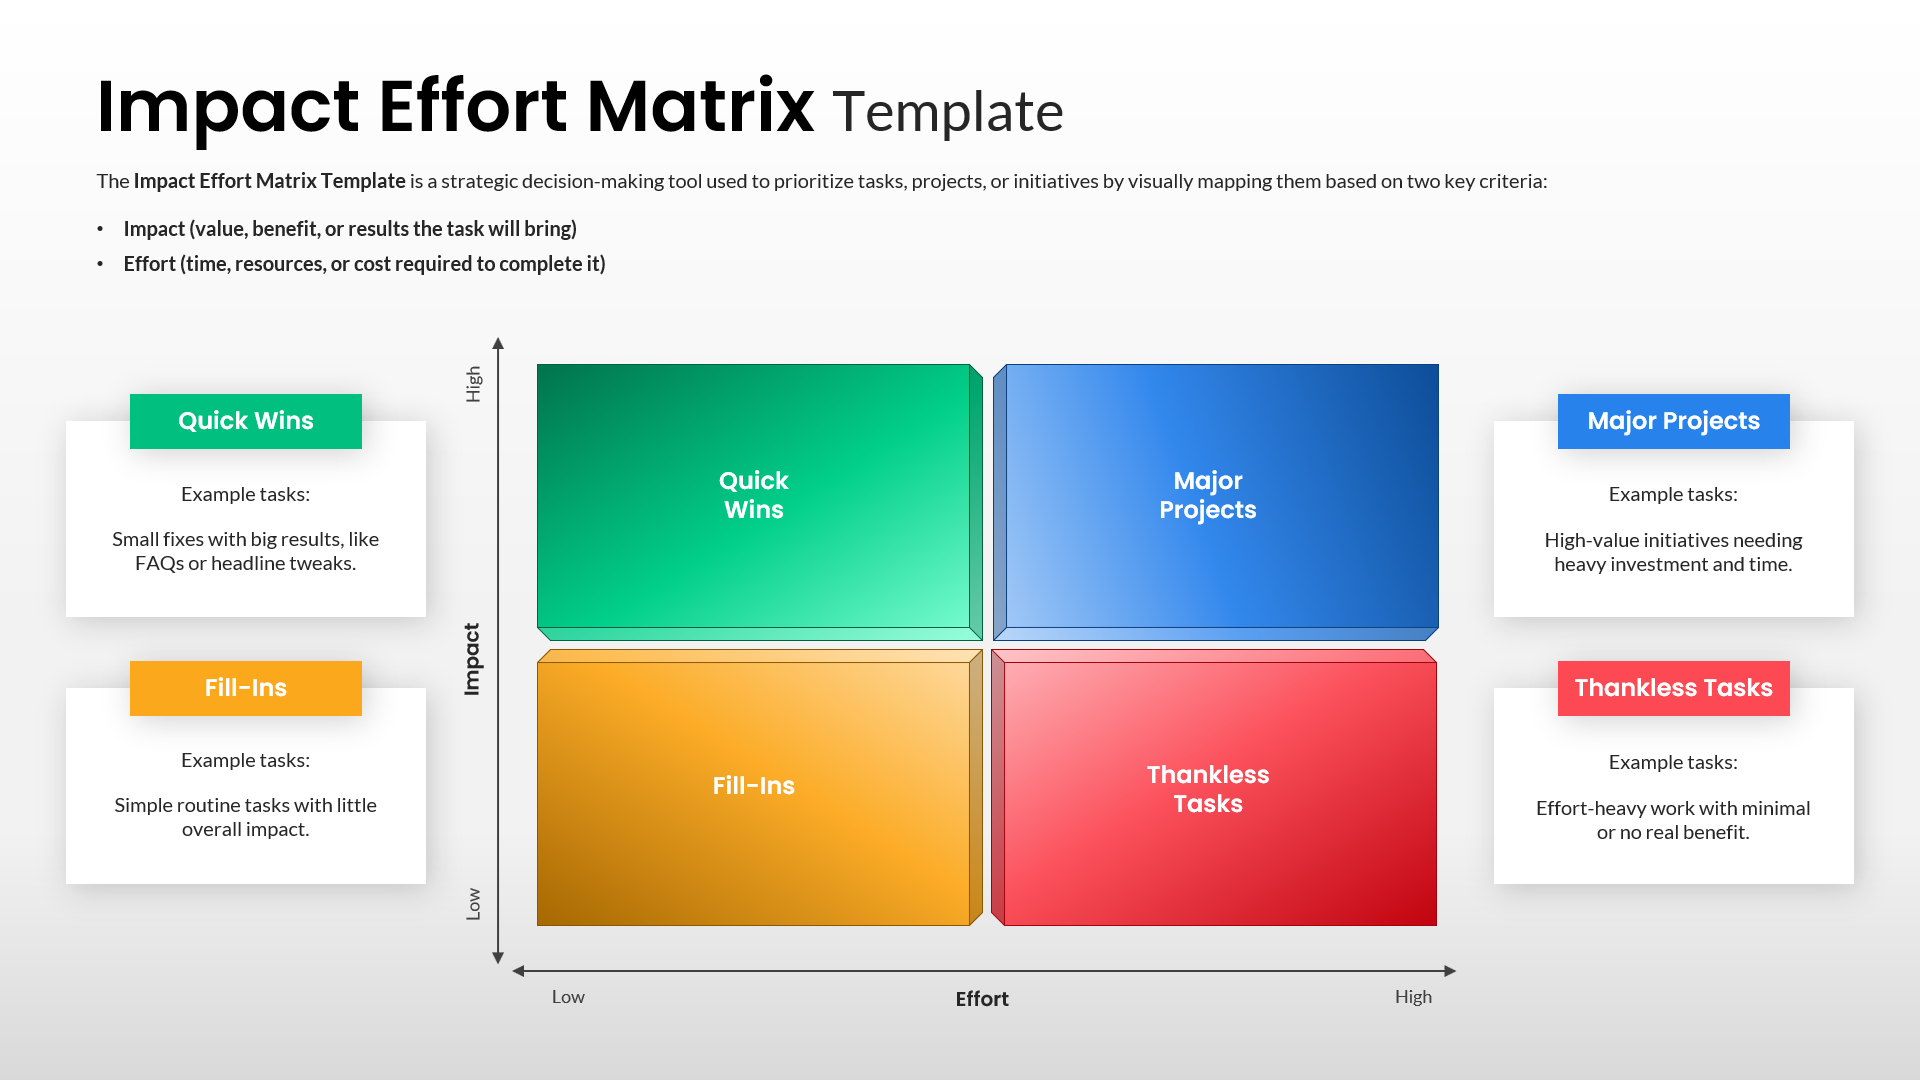
Impact Effort Matrix Template for PowerPoint & Google Slides
Comparison Chart
Ansoff Growth Matrix Template for PowerPoint & Google Slides
Business Strategy
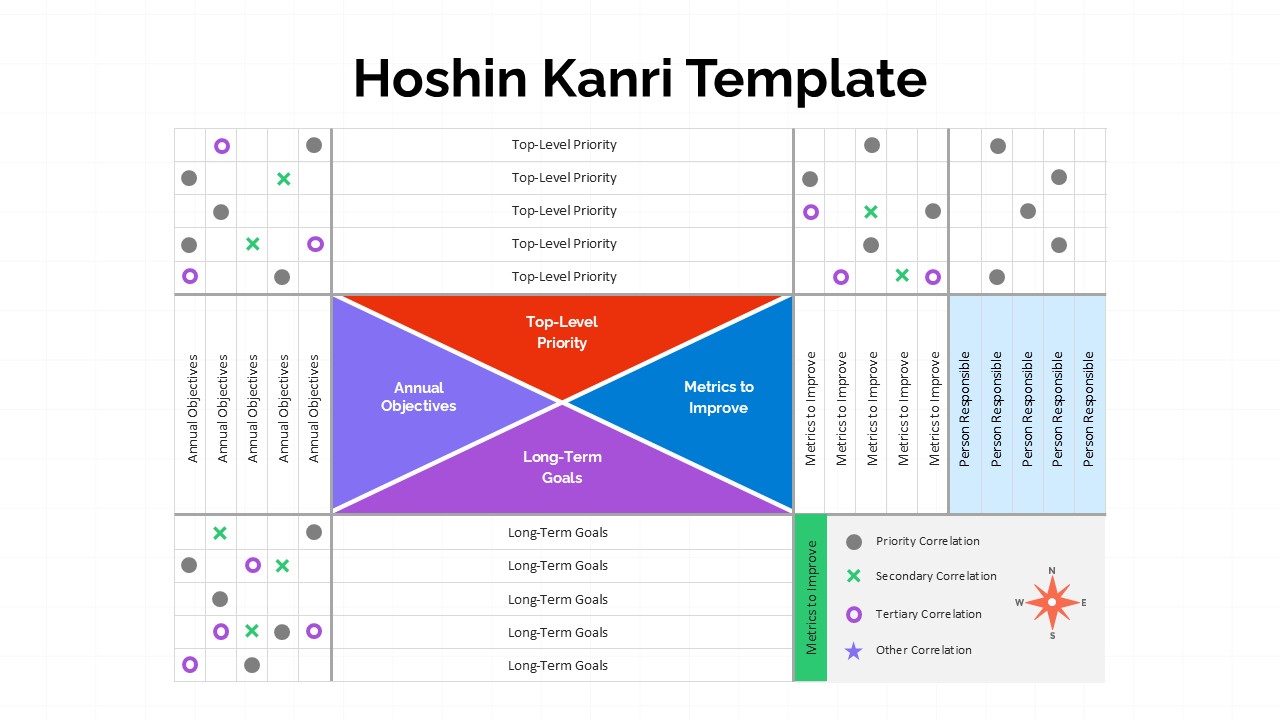
Hoshin Kanri Strategic Planning Matrix Template for PowerPoint & Google Slides
Business Strategy
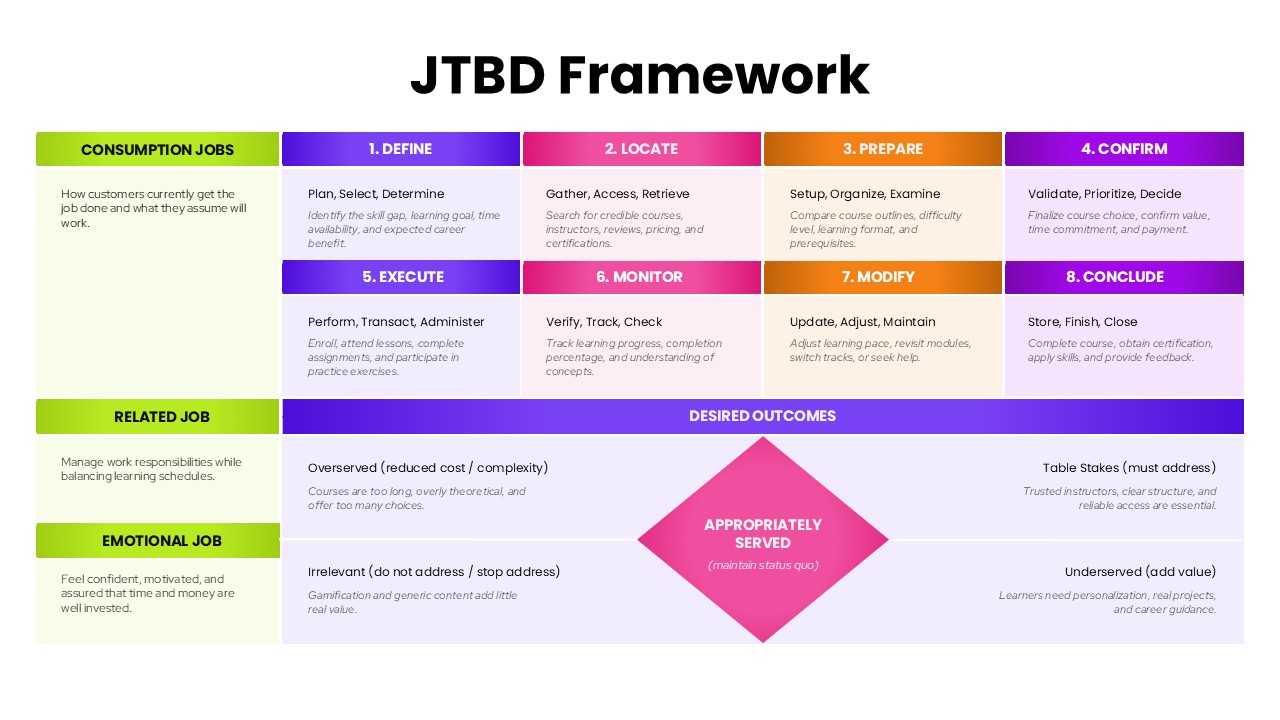
JTBD Framework Process and Outcomes Matrix Template for PowerPoint & Google Slides
Marketing
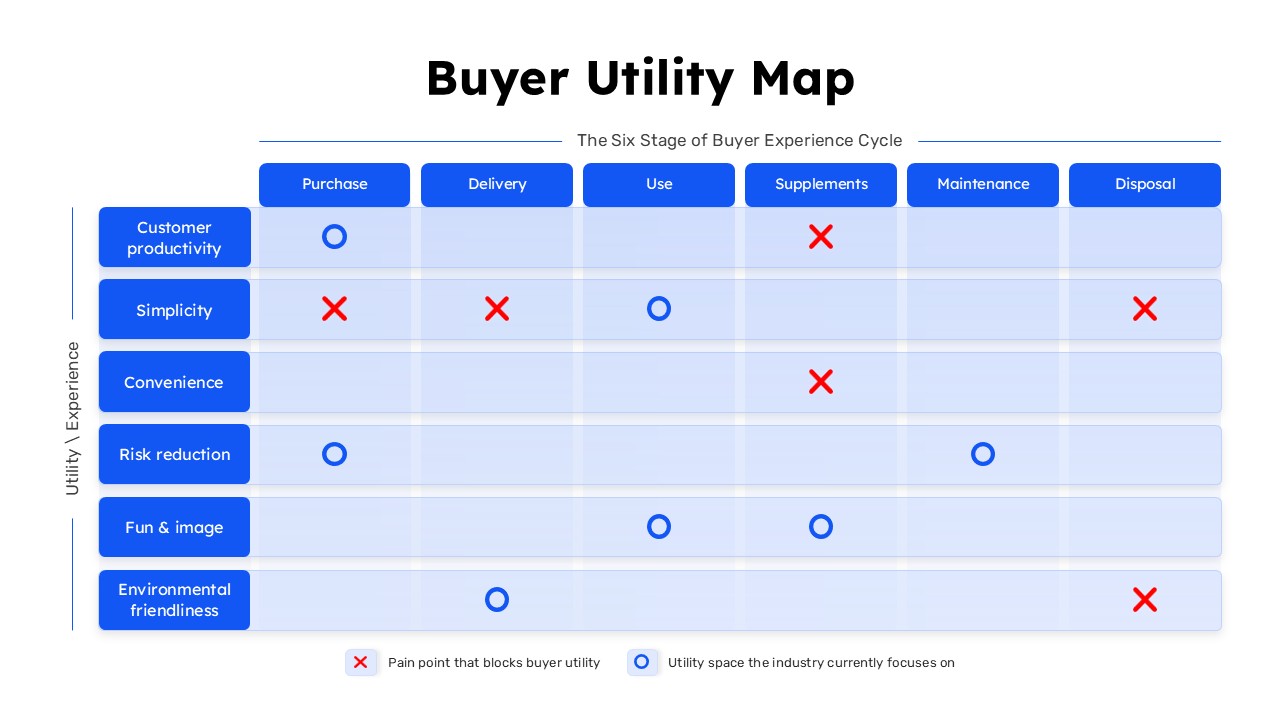
Buyer Utility Map Strategy Matrix Template for PowerPoint & Google Slides
Customer Journey
Materiality Assessment Matrix Diagram Template for PowerPoint & Google Slides
Risk Management
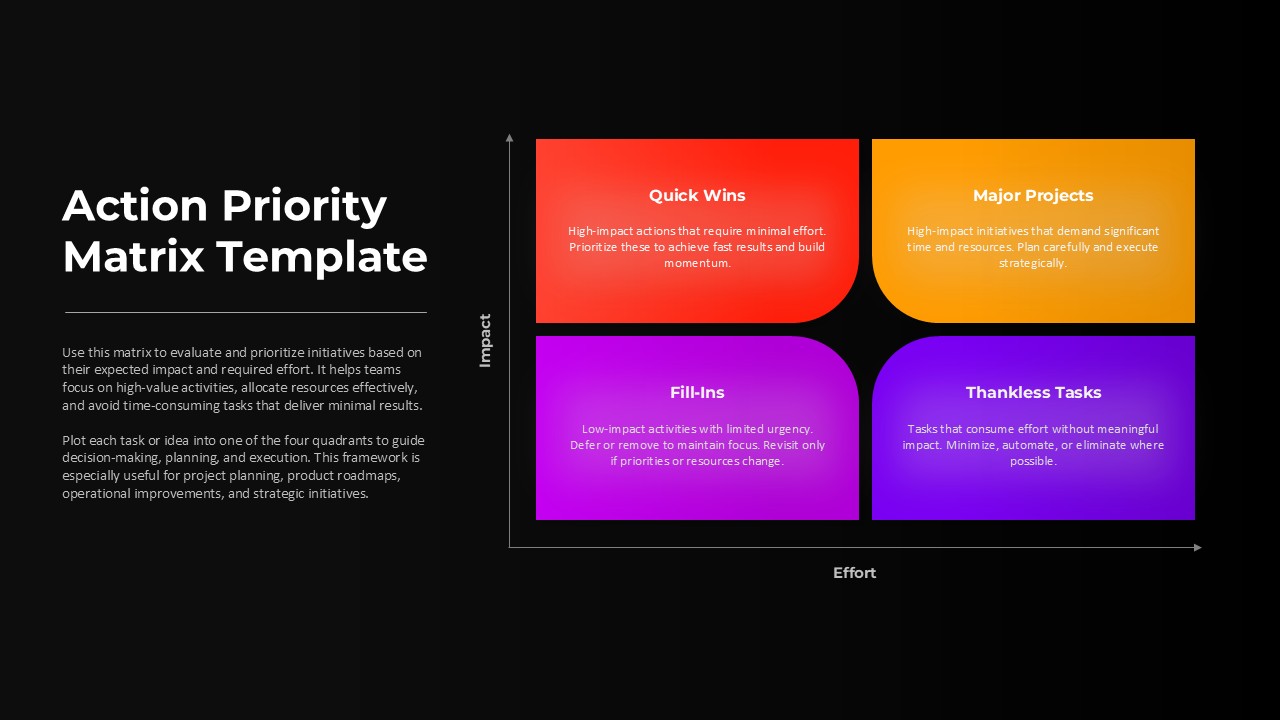
Action Priority Impact Effort Matrix Template for PowerPoint & Google Slides
Business Strategy
IT Gap Analysis Assessment Matrix Template for PowerPoint & Google Slides
Information Technology
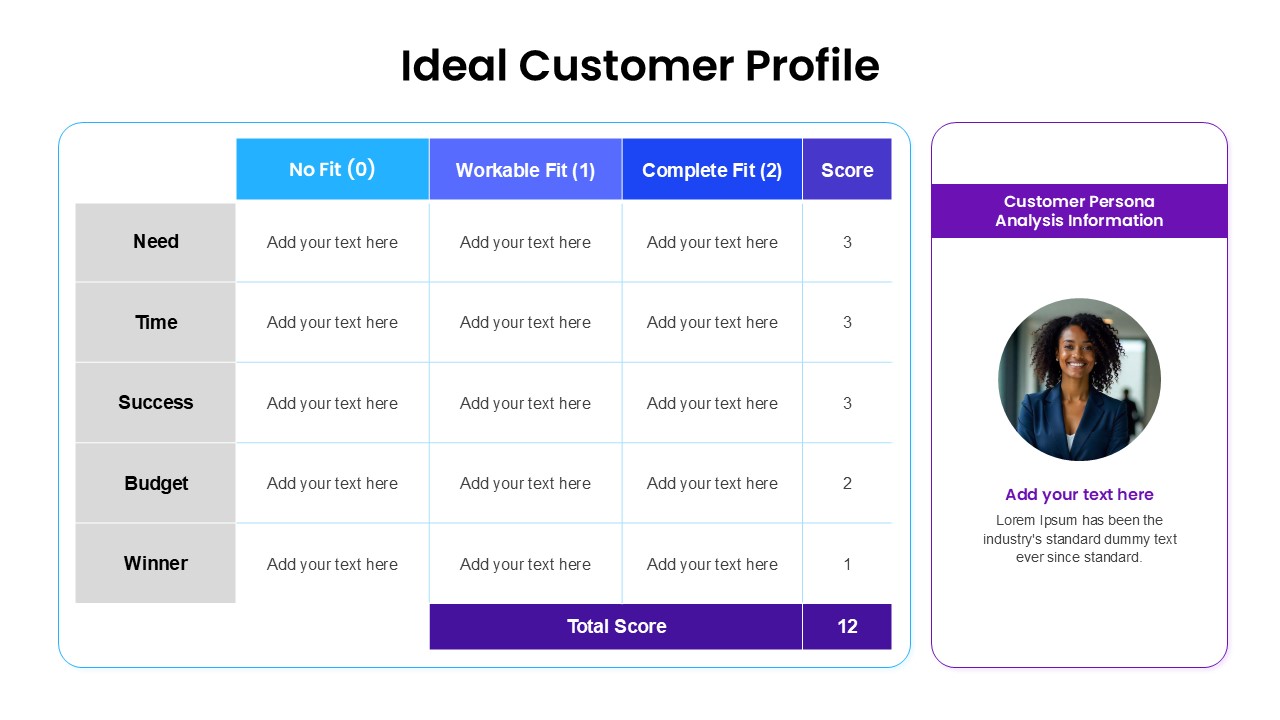
Ideal Customer Profile PowerPoint Template for PowerPoint & Google Slides
Business Strategy
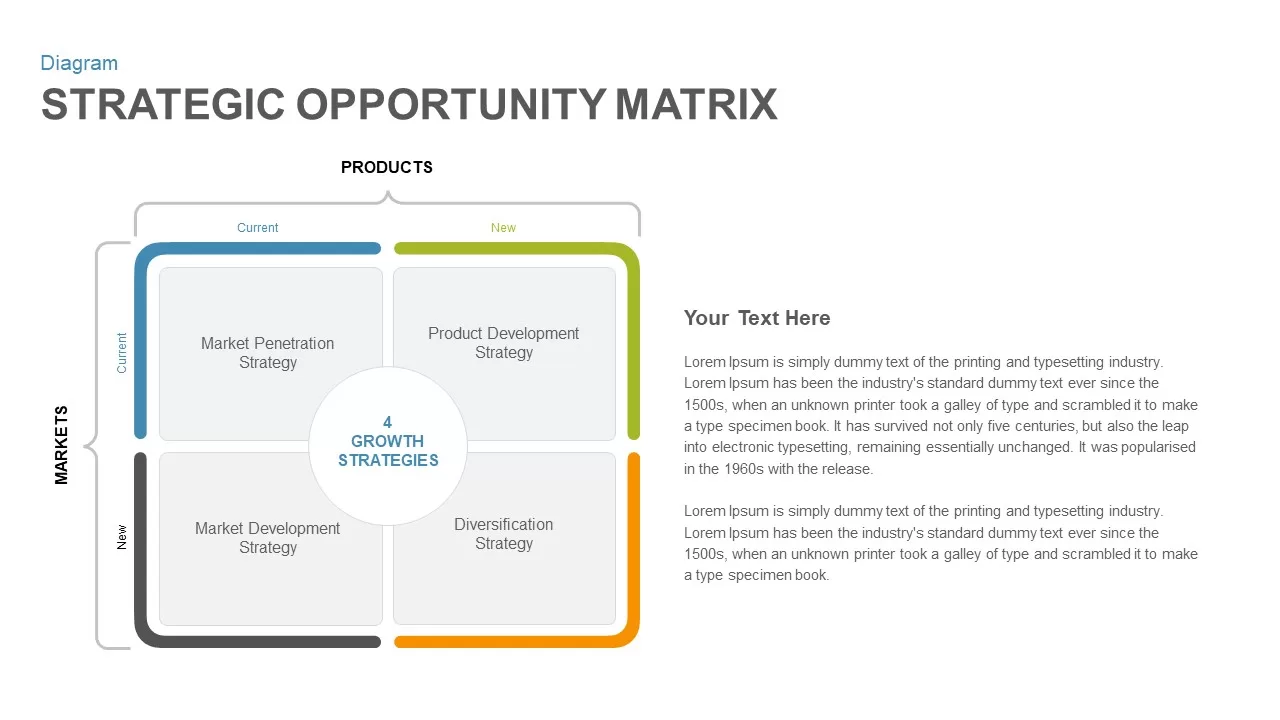
Strategic Opportunity Matrix Diagram for PowerPoint & Google Slides
Business Strategy
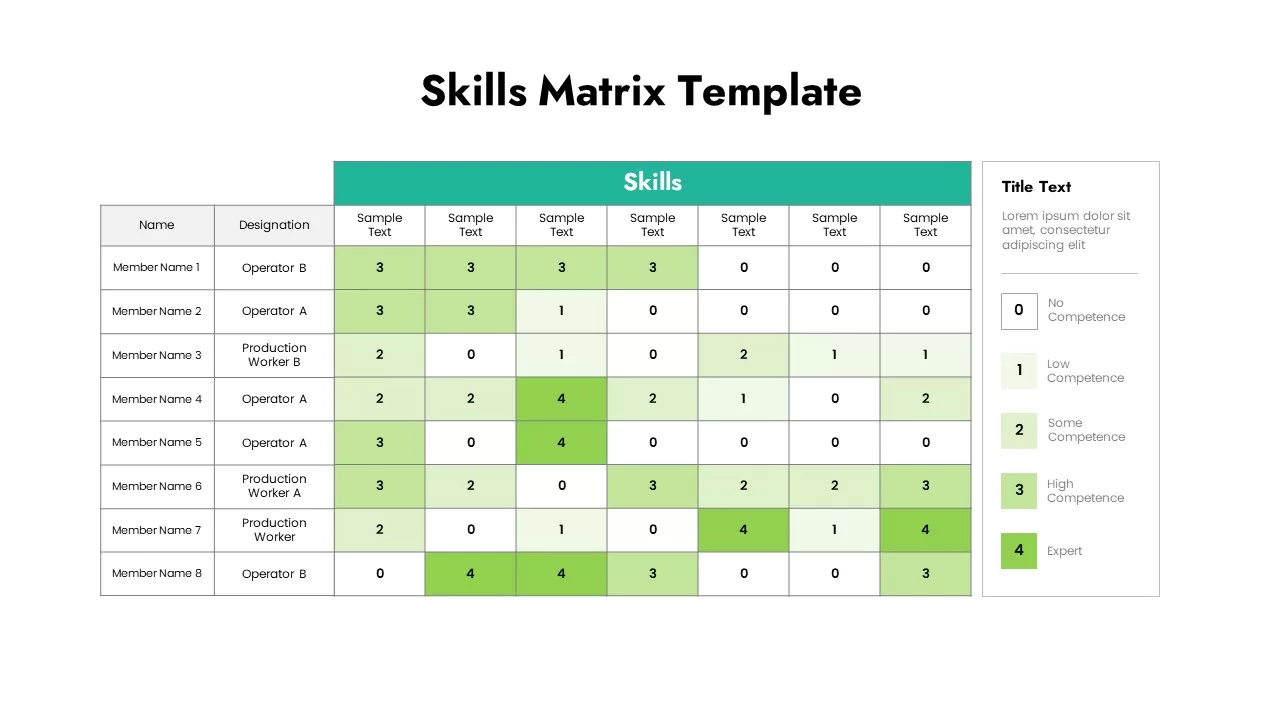
Skills Matrix infographic for PowerPoint & Google Slides
Project Status
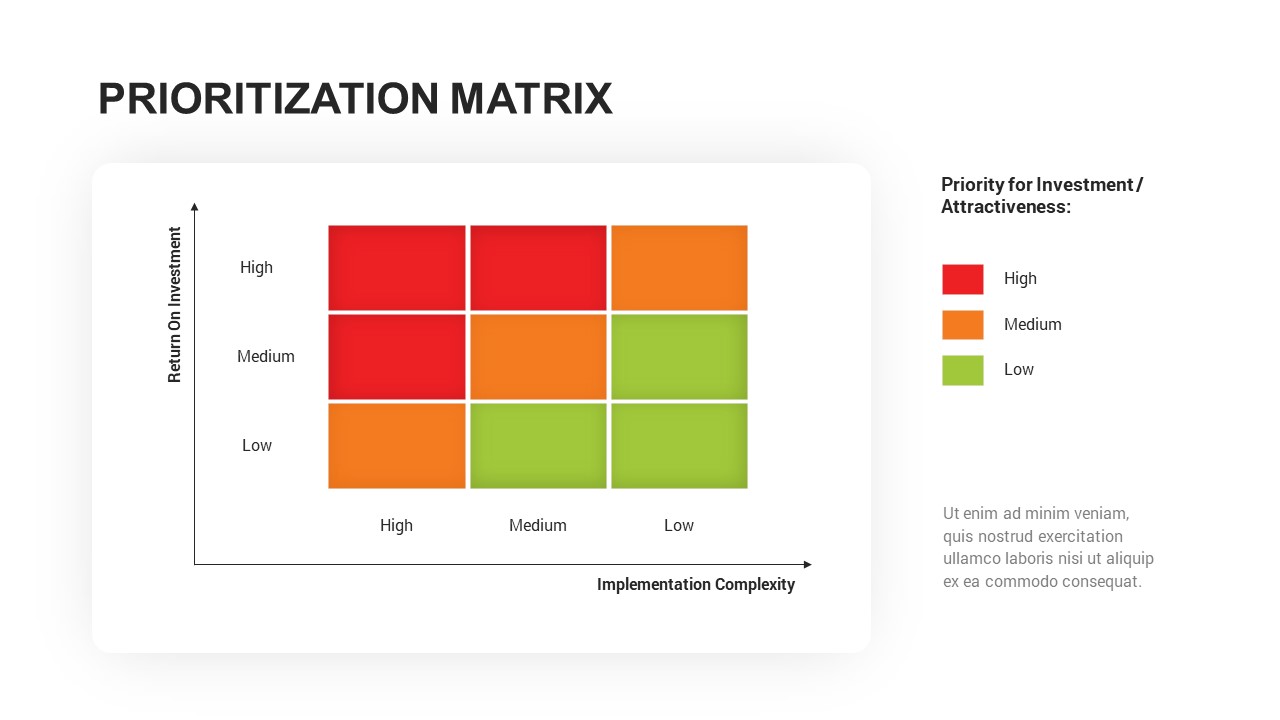
Prioritization Matrix for PowerPoint & Google Slides
Business Proposal
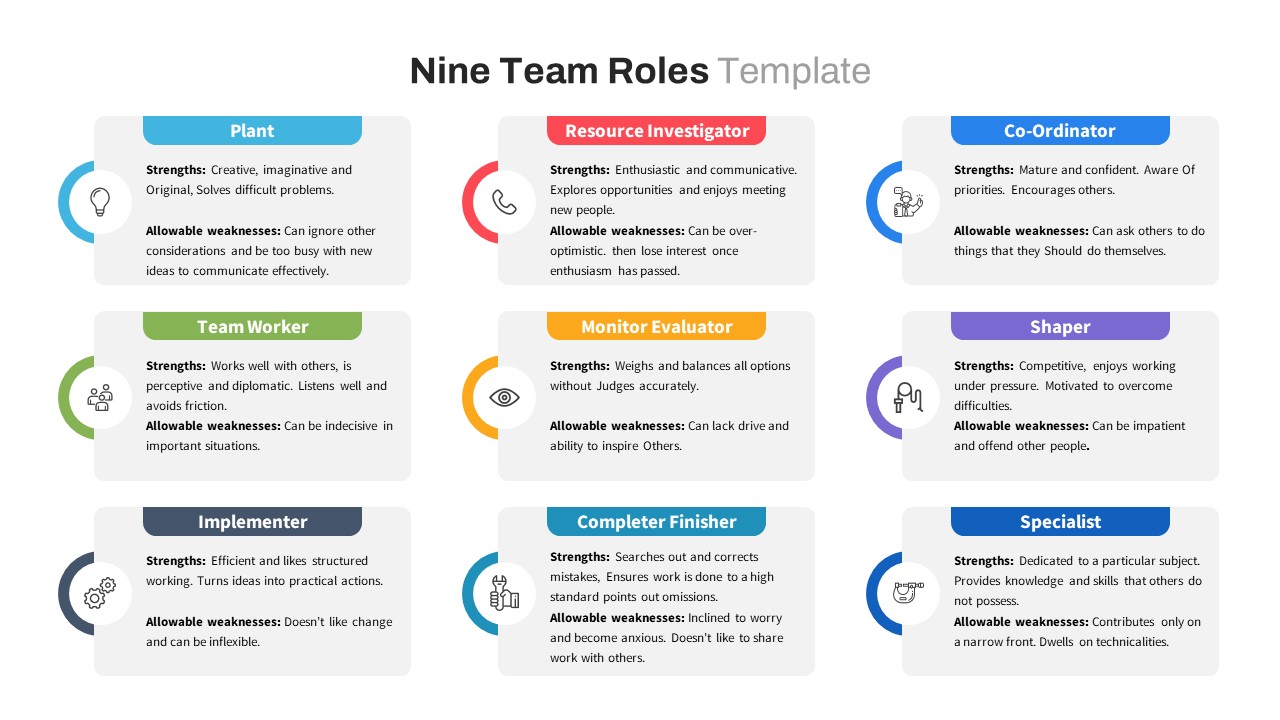
Nine Belbin Team Roles Matrix Slide for PowerPoint & Google Slides
Employee Performance
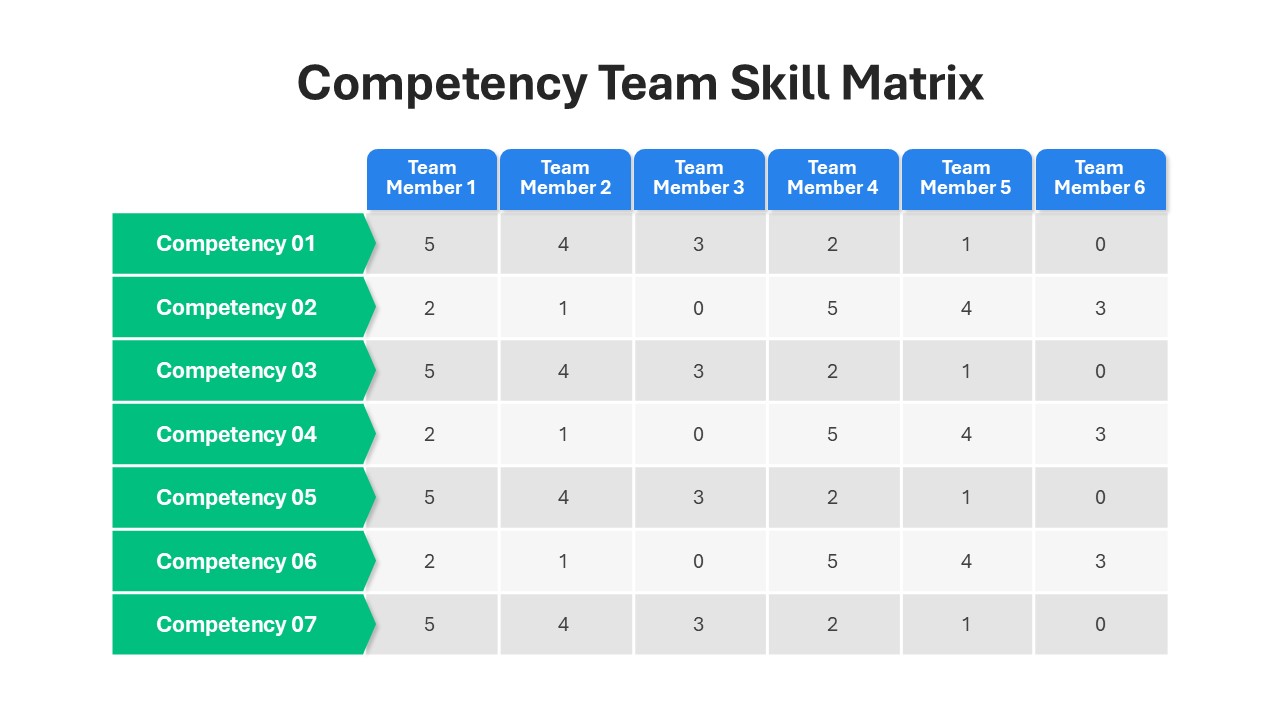
Competency Team Skill Matrix for PowerPoint & Google Slides
Employee Performance
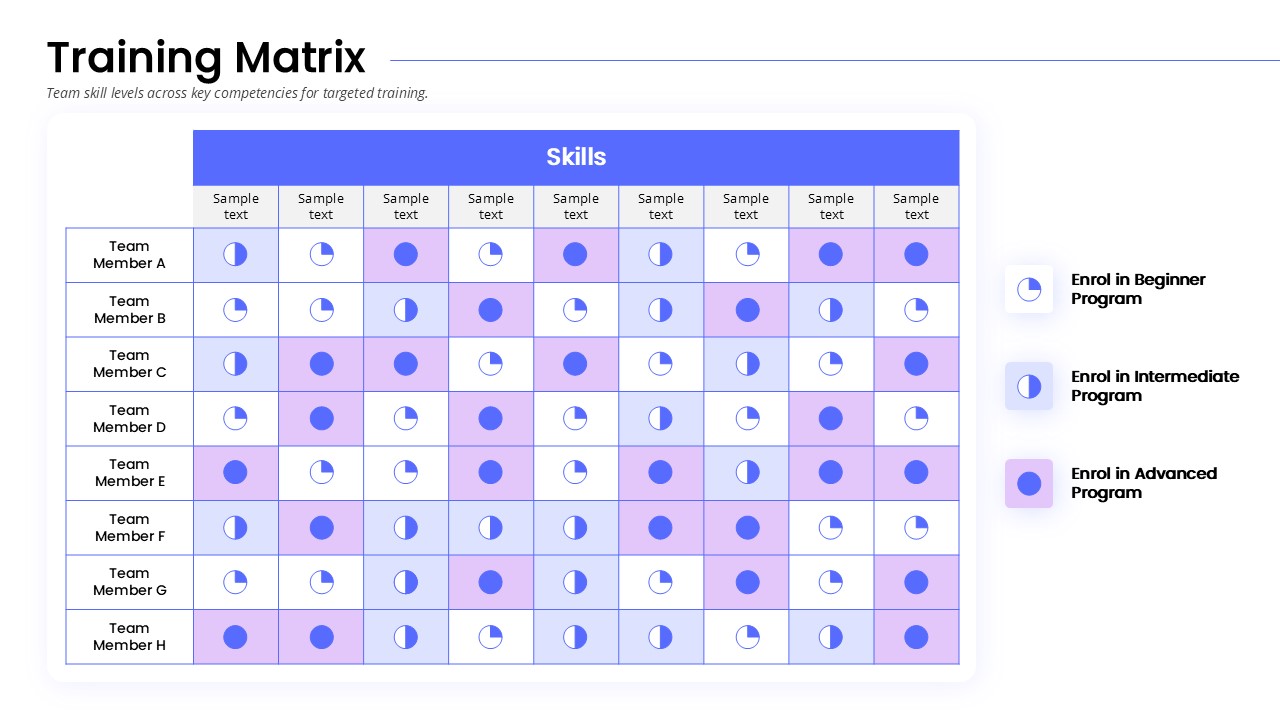
Training Matrix for PowerPoint & Google Slides
HR