Buyer Utility Map Strategy Matrix Template for PowerPoint & Google Slides
Buyer Utility Map Presentation Template for PowerPoint & Google Slides
Evaluating customer friction points, uncovering uncontested market space, and diagnosing gaps in product experience requires a structured strategic matrix. This buyer utility map presentation template equips business strategists, product managers, innovation consultants, and executive leaders with an actionable diagnostic matrix designed to evaluate customer experience across the six stages of the buyer experience cycle alongside core utility levers.
Originating from the Blue Ocean Strategy framework, the buyer utility map helps corporate teams look beyond incremental product upgrades. By systematically crossing six sequential lifecycle phases with six fundamental utility propositions, presenters can easily spotlight industry-wide blind spots, pinpoint painful customer bottlenecks, and identify high-impact innovation opportunities during corporate reviews and strategy workshops.
Step-by-Step Delivery and Strategic Framework
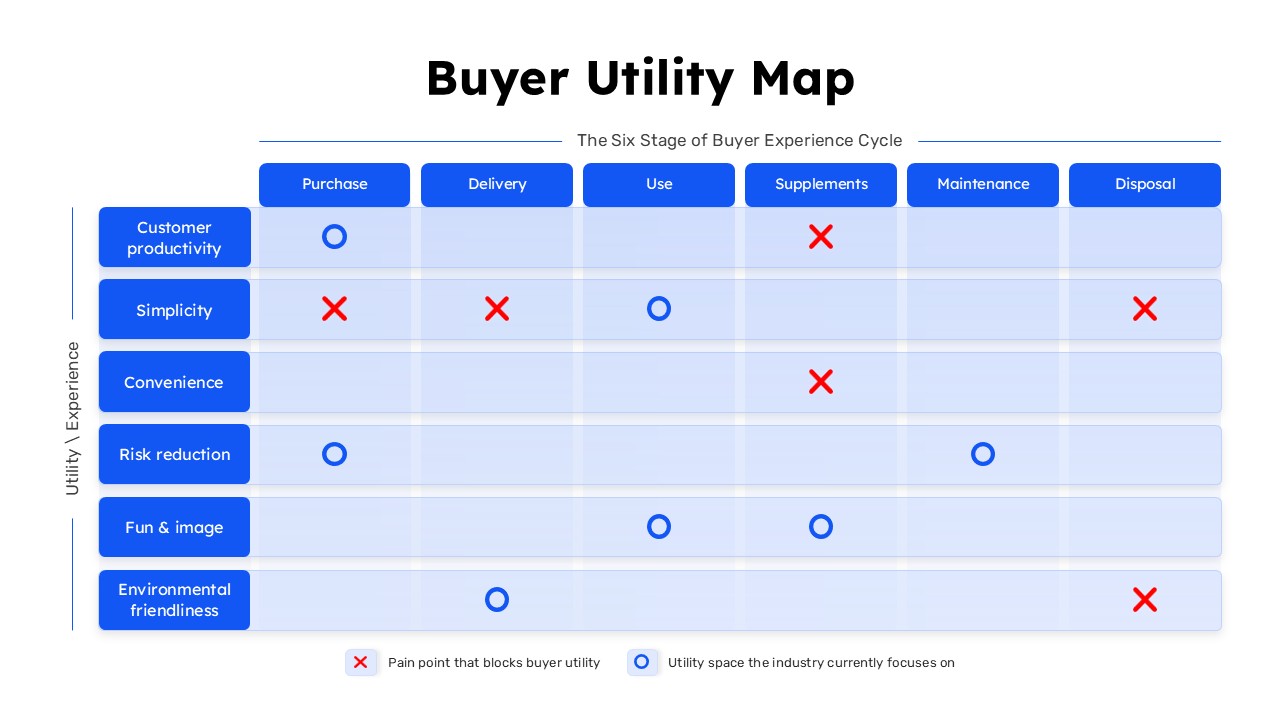
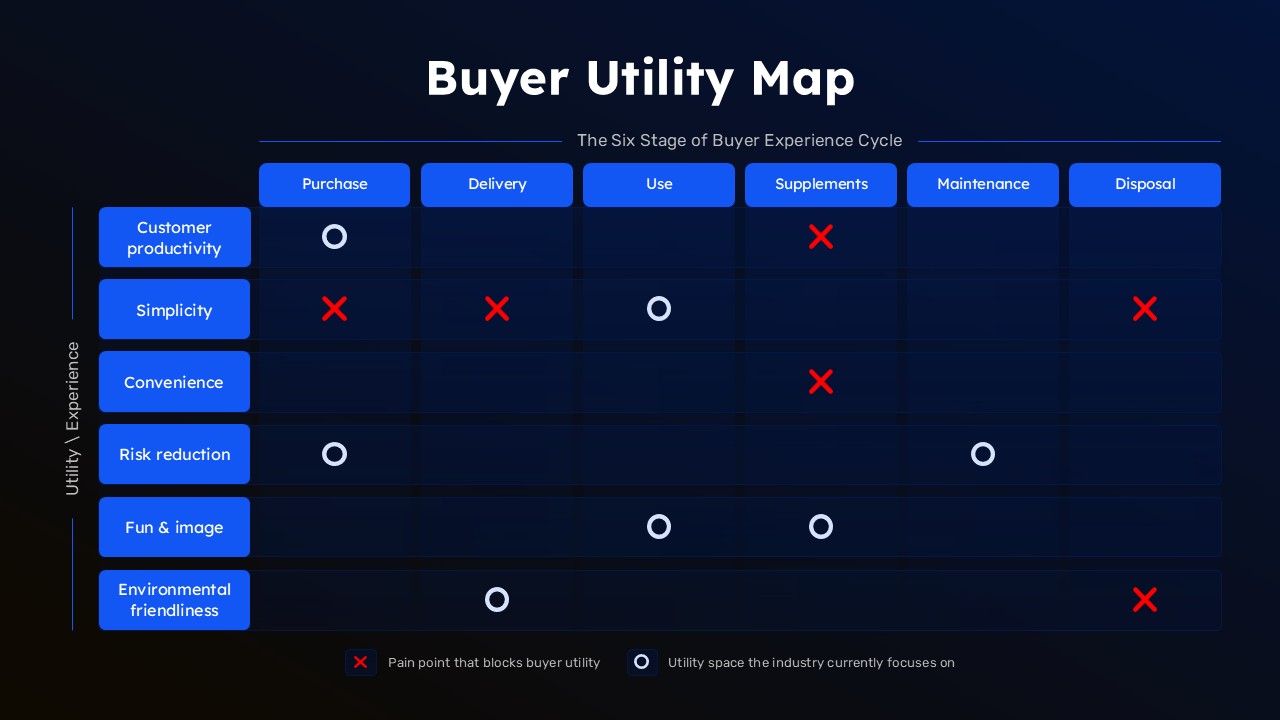
- Establish the Buyer Experience Stages: Direct the audience across the top horizontal axis labeled “The Six Stage of Buyer Experience Cycle.” Walk through each phase sequentially: Purchase, Delivery, Use, Supplements, Maintenance, and Disposal. This establishes how customers interact with an offering from initial procurement to ultimate retirement.
- Examine the Utility Levers: Guide stakeholders down the left vertical axis labeled “Utility \ Experience.” Detail the six foundational value drivers: Customer productivity, Simplicity, Convenience, Risk reduction, Fun & image, and Environmental friendliness.
- Audit Industry Focus Spaces: Review the blue circular markers placed across the grid. Explain to stakeholders that each circle represents a utility space where the industry currently concentrates its efforts and investments, demonstrating where competition is fiercest.
- Target Critical Utility Blocks: Analyze the red cross markers plotted across intersecting cells. Detail each designated pain point where existing solutions create unnecessary friction, waste customer effort, or introduce operational risk.
- Identify Blue Ocean Opportunities: Conclude by highlighting open, empty grid intersections. Show leadership how resolving active red-cross pain points or expanding into neglected blank intersections allows your business to unlock completely new market demand.
Presentation Design & Technical Versatility
The presentation template features a clean white background framing a structured 6×6 matrix. The header row features six royal blue rounded rectangular badges indicating the buyer cycle stages, while the left column uses matching blue tabs to anchor each utility dimension. The grid interior uses soft, alternating periwinkle row fills that provide clear contrast for interactive markers. An integrated legend sits directly beneath the table, clearly distinguishing red crosses (pain points blocking buyer utility) from blue circles (current industry focus spaces). Every cell, table border, marker graphic, and text label consists of 100% editable vector components compatible with Microsoft PowerPoint and Google Slides.
Want more slides like this? Check out our collection of customer journey presentation slides.
Login to download this file

Item ID
SB05694Designed By
Naseeba


Related Templates

Buyer Journey Mapping Template for PPT & Google Slides
Process
Buyer Persona PowerPoint Template
Customer Journey
Free User Buyer PowerPoint Persona Template
Recruitment
Free
Buyer Persona Template
Customer Journey
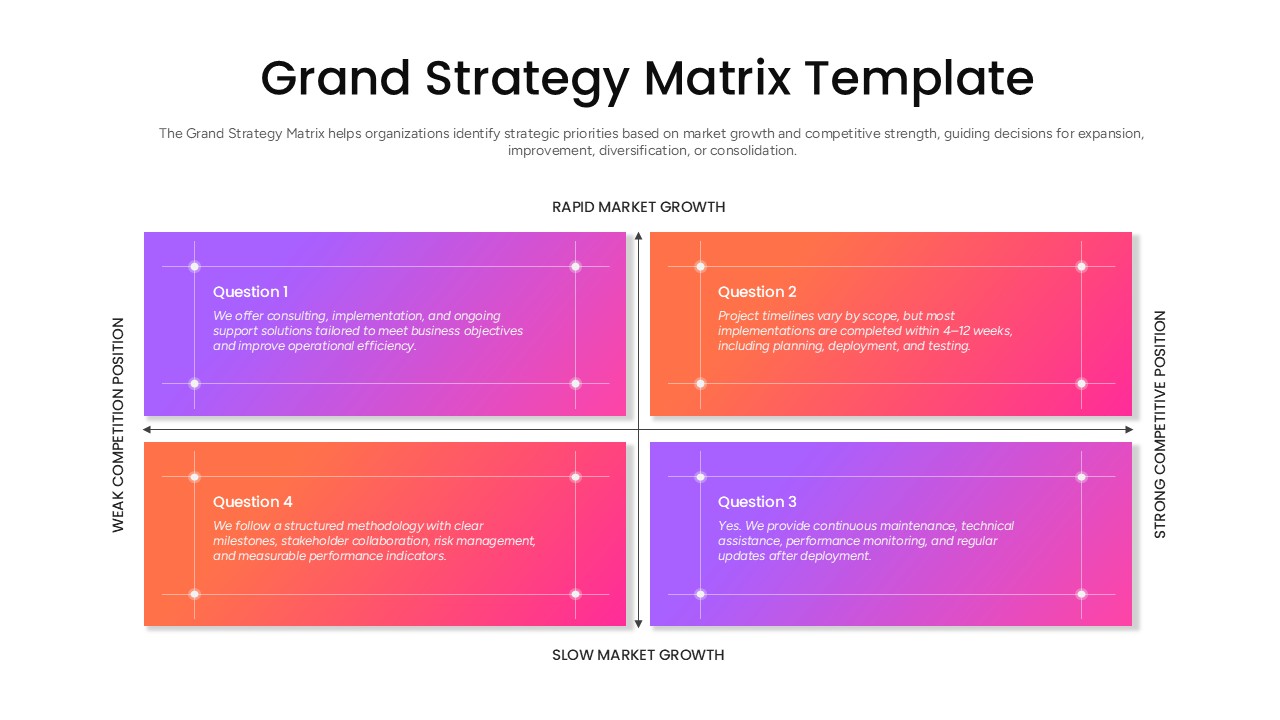
Grand Strategy Matrix PowerPoint Template
Business Strategy
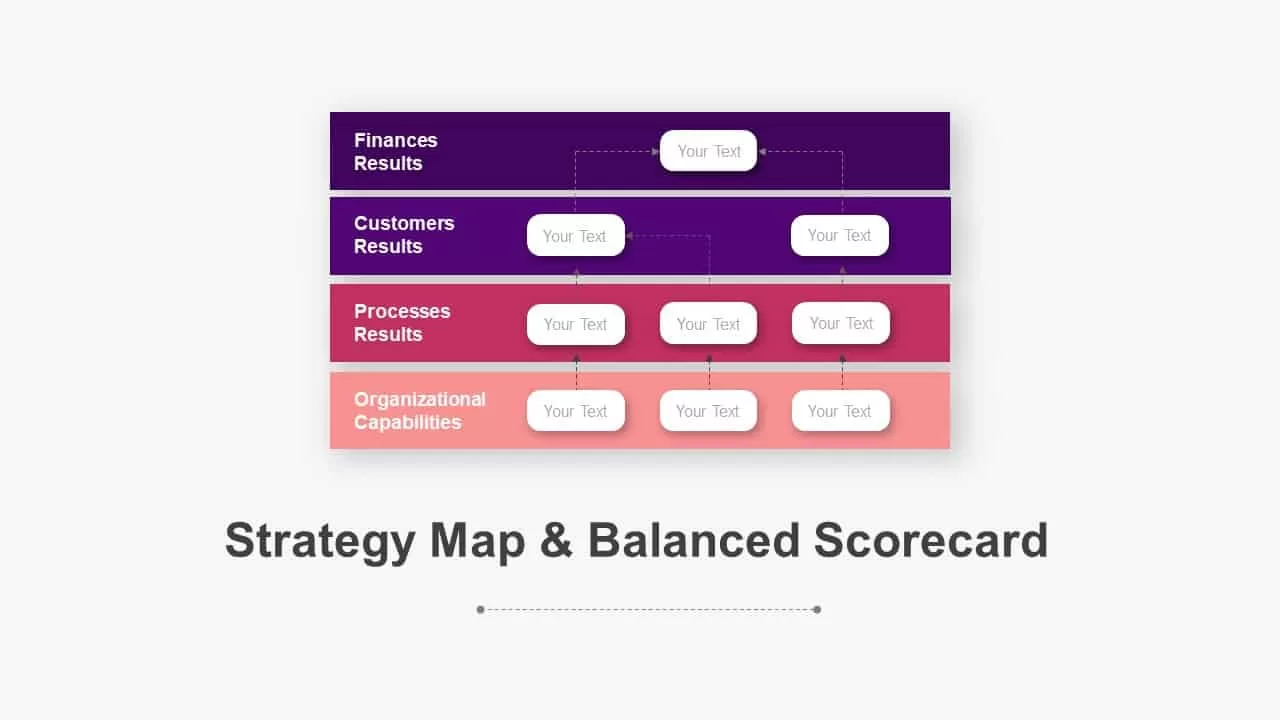
Balanced Scorecard Strategy Map Diagram Pack for PowerPoint & Google Slides
Business Strategy
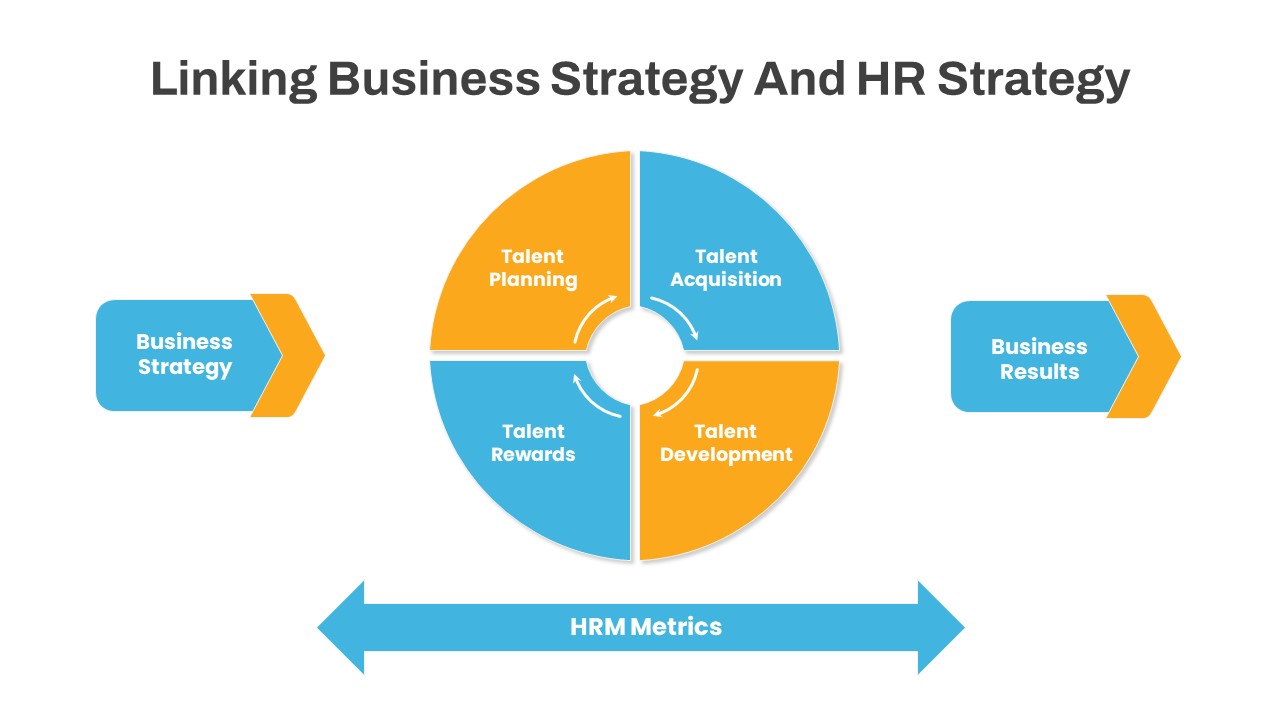
Business Strategy HR Strategy Link PowerPoint Template
Business Strategy
Strategy House Template – Business Strategy Model Diagram
Business Strategy
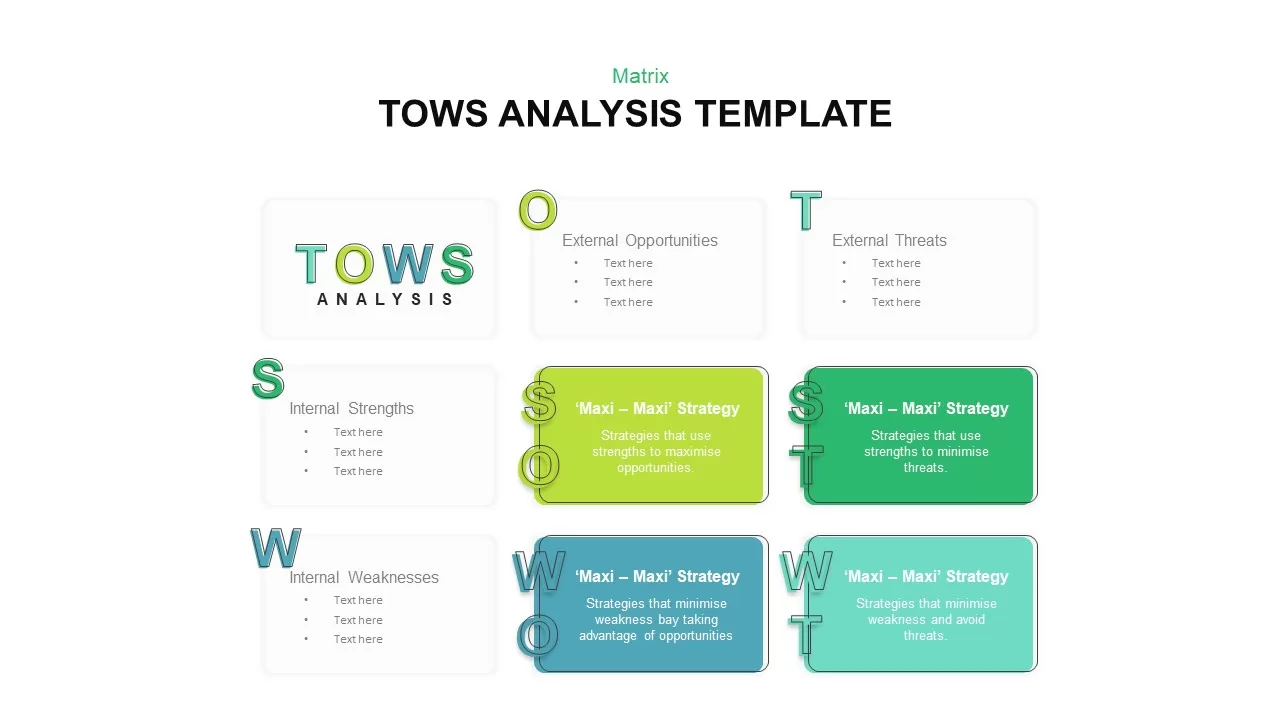
Editable Four-Quadrant TOWS Matrix Template for PowerPoint & Google Slides
Opportunities Challenges
9-Box Matrix for Performance & Potential Template for PowerPoint & Google Slides
Employee Performance
MoSCoW Prioritization Matrix Slide Template for PowerPoint & Google Slides
Business Strategy
Bubble Chart Scatter, Diagram & Matrix Template for PowerPoint & Google Slides
Comparison Chart
Speed vs Reversibility Decision Matrix Template for PowerPoint & Google Slides
Comparison
Situational Leadership Matrix Template for PowerPoint
Leadership
Nursing Staffing Matrix Template
Nursing
Capability Matrix PowerPoint Template
Human Resources
Personal SWOT Analysis Matrix Cards Template for PPT & Google Slides
SWOT
Ansoff Growth Matrix Template
Business Strategy
Hoshin Kanri Template for PPT & Google Slides Theme
Business Strategy
Product Process Matrix Diagram Template
Business Strategy