Dynamic Creative Head Infographics Template for PowerPoint & Google Slides
Description
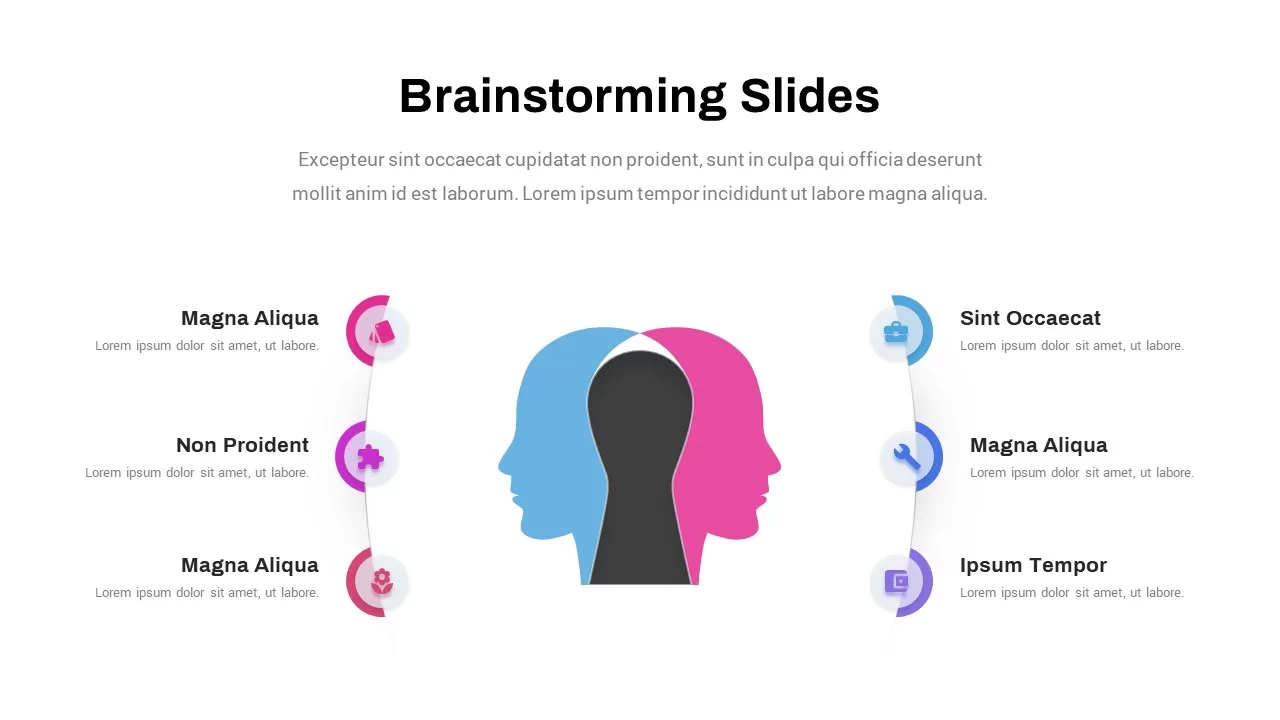
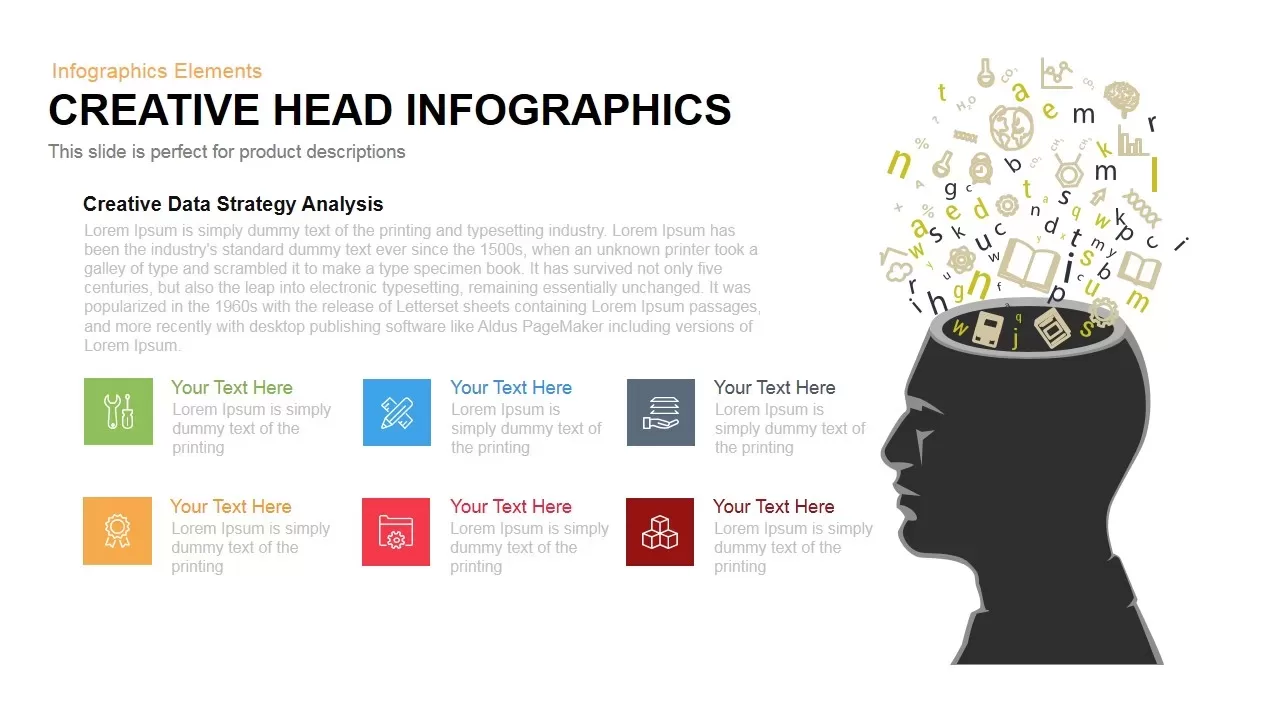
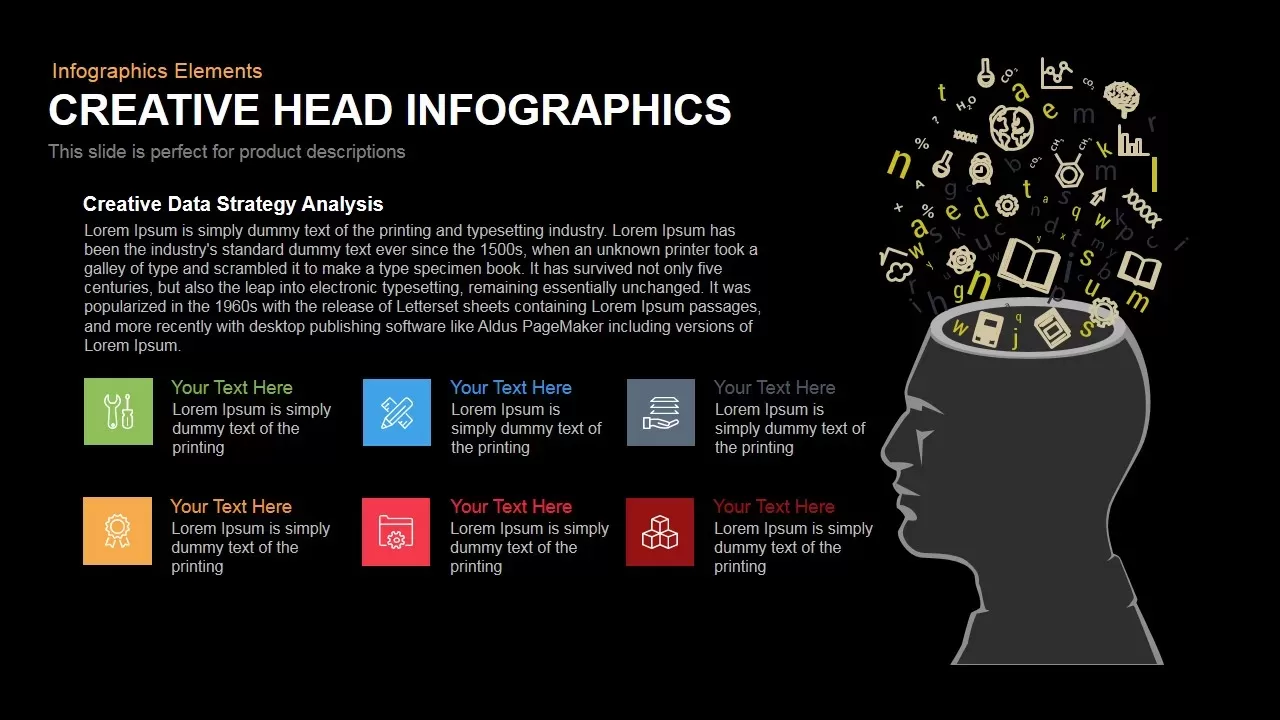
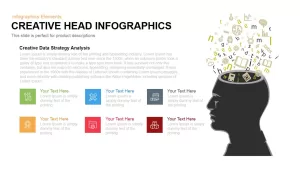
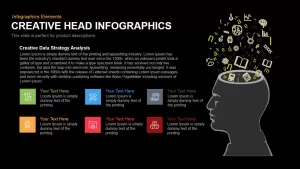
Leverage this dynamic head infographic slide to visualize strategic objectives, performance metrics, or creative ideas with clarity and impact. On the right side, a high-resolution vector silhouette of a businessperson’s profile features stylized icons and letterforms bursting from an open head, symbolizing innovation and data flow. Six color-coded square callouts—each containing a distinct white line icon and placeholder heading—anchor to the left of the silhouette, providing structured space for detailed annotations. Gradient connector lines and subtle drop shadows enhance depth, while semi-transparent navigation arrows along the slide edges suggest guided storytelling or carousel-style walkthroughs.
Built on fully editable master slides, every element is customizable: swap out the silhouette graphic, recolor the icon backgrounds, update icons to match your branding, adjust connector paths, or modify text placeholders in seconds. Vector-based shapes scale seamlessly across both PowerPoint and Google Slides without quality loss, ensuring pixel-perfect clarity on any display. The clean white background and minimalist typography maintain reader focus, while balanced white space and consistent alignment deliver a polished and professional appearance.
This template excels at communicating complex workflows, project milestones, or organizational structures by combining metaphorical imagery with precise data labels. Duplicate callouts or expand icon sets to accommodate additional objectives, or reposition the silhouette to emphasize alternate workflows. Use built-in guides to align elements accurately and maintain consistent spacing across slides.
Ideal for executive presentations, marketing pitches, or team workshops, this head infographic empowers presenters to transform abstract concepts into tangible visual narratives. Engage your audience with a slide that balances creative flair and functional design, accelerating slide creation without sacrificing professional polish.
Who is it for
Business leaders, marketing strategists, product managers, and data analysts will leverage this infographic to convey strategic goals, project roadmaps, and innovation frameworks in executive briefings, stakeholder workshops, or investor pitches.
Other Uses
Repurpose this layout for brainstorming outcomes, research findings, or training agendas. Replace icons and headings to map customer personas, feature backlogs, or departmental KPIs with visual clarity and impact.
Login to download this file

Item ID
SB00128
Related Templates

Creative Dynamic Gantt Chart Timeline Template for PowerPoint & Google Slides
Timeline
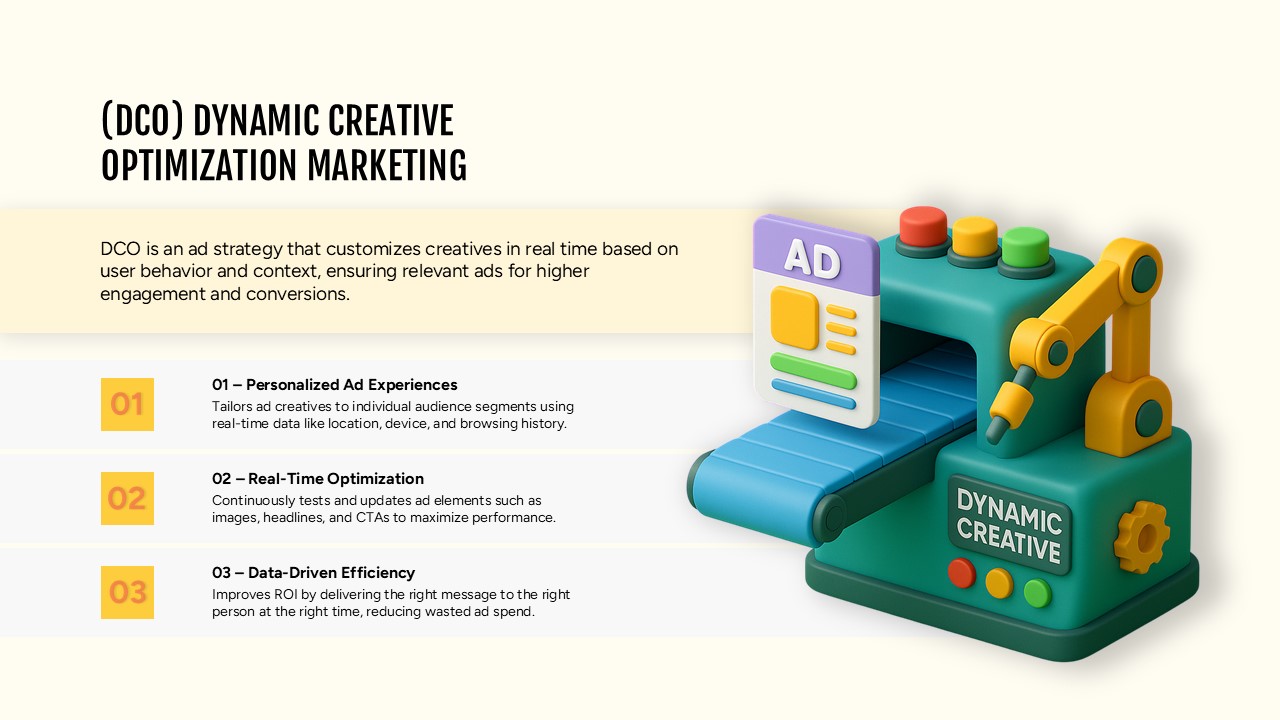
Dynamic Creative Optimization Marketing Template for PowerPoint & Google Slides
Digital Marketing

Dynamic Circle Timeline Infographics template for PowerPoint & Google Slides
Timeline
Dynamic Gear Diagram Infographics Template for PowerPoint & Google Slides
Process
Bubble Head Metrics Infographic Template for PowerPoint & Google Slides
Circular
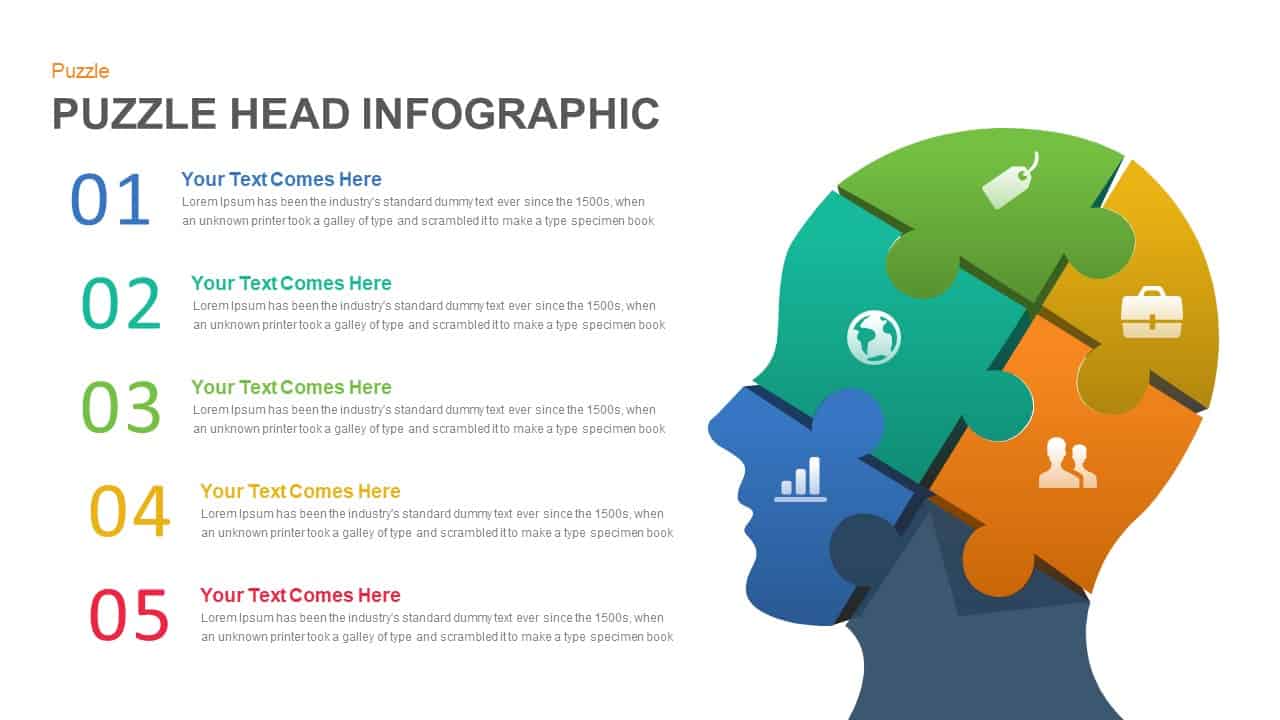
Five-Step Puzzle Head Infographic Template for PowerPoint & Google Slides
Process
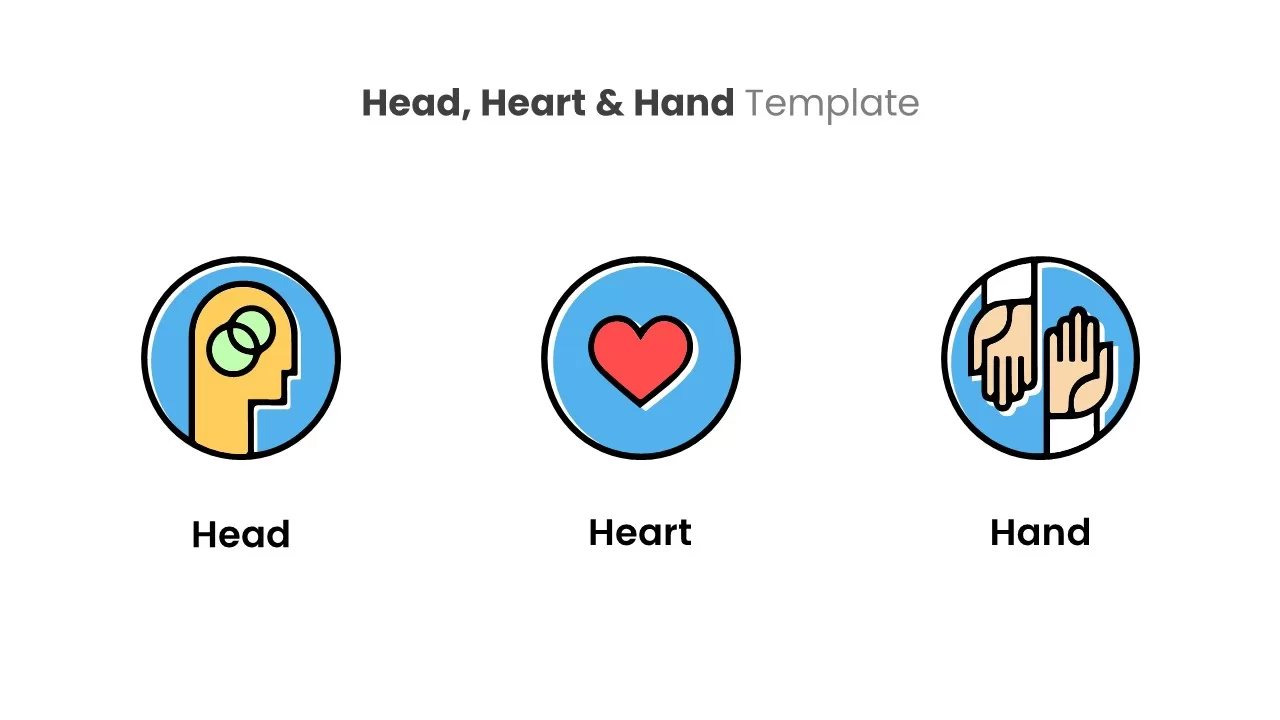
Head, Heart & Hand Infographic Template for PowerPoint & Google Slides
Process
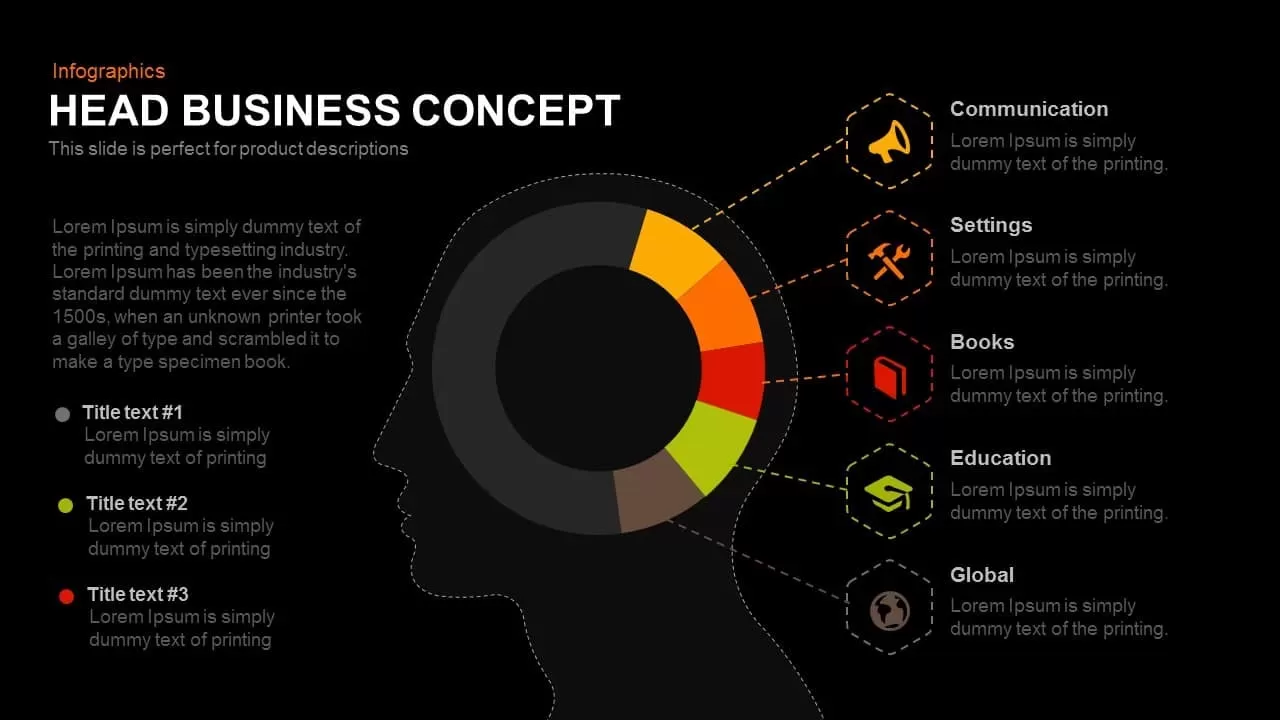
Head Business Concept for PowerPoint & Google Slides
Circular
Dual Head Brainstorming Concept Slide for PowerPoint & Google Slides
Process
Dynamic Shield Process Flow Diagram template for PowerPoint & Google Slides
Process
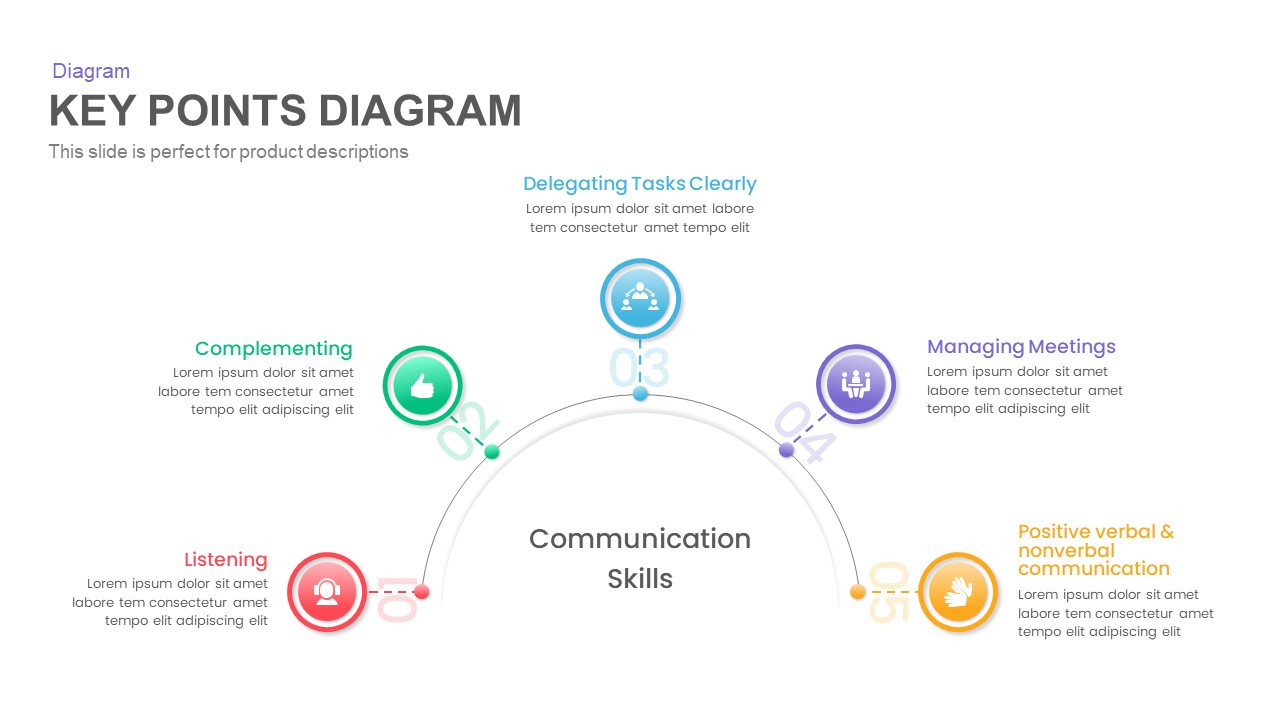
Dynamic Key Points Diagram Template for PowerPoint & Google Slides
Process

Dynamic Data Dashboard Infographic Template for PowerPoint & Google Slides
Bar/Column
Dynamic Arrow Process Template for PowerPoint & Google Slides
Process

Dynamic 4 Gear Process Diagram Template for PowerPoint & Google Slides
Process
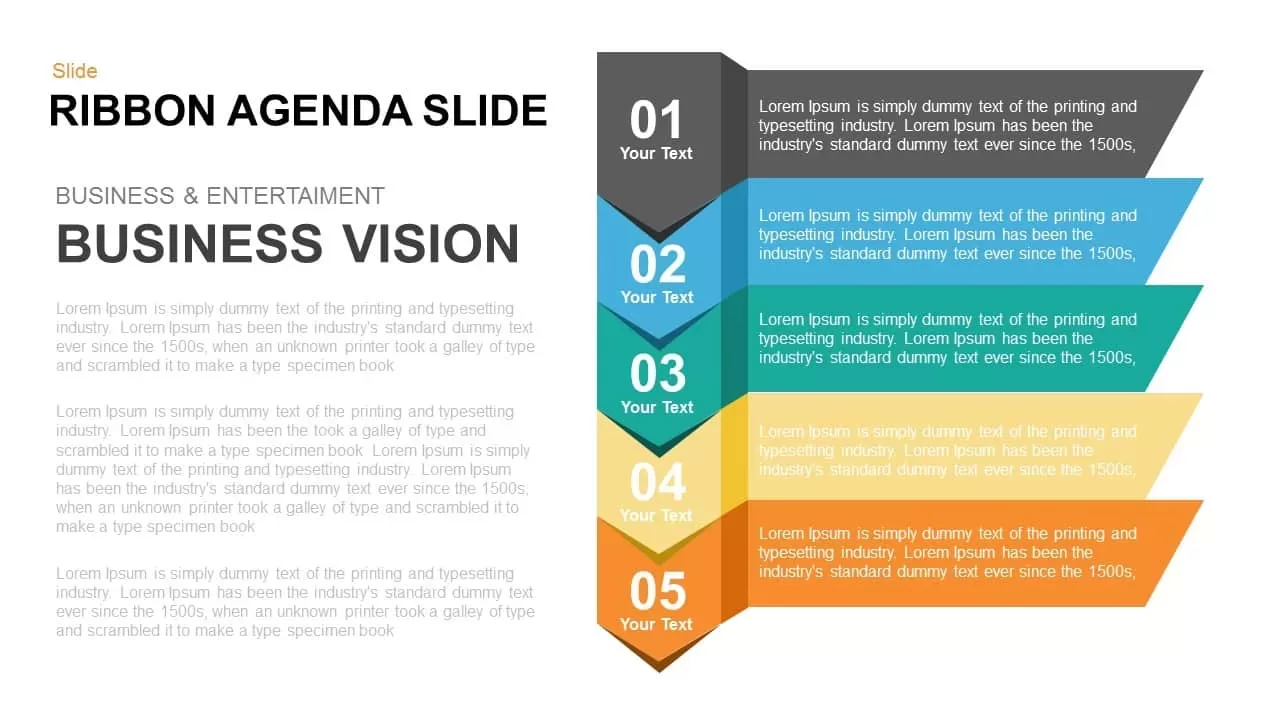
Dynamic Five-Step Ribbon Agenda Layout Template for PowerPoint & Google Slides
Agenda
Dynamic Multicolor Comparison Table Template for PowerPoint & Google Slides
Comparison
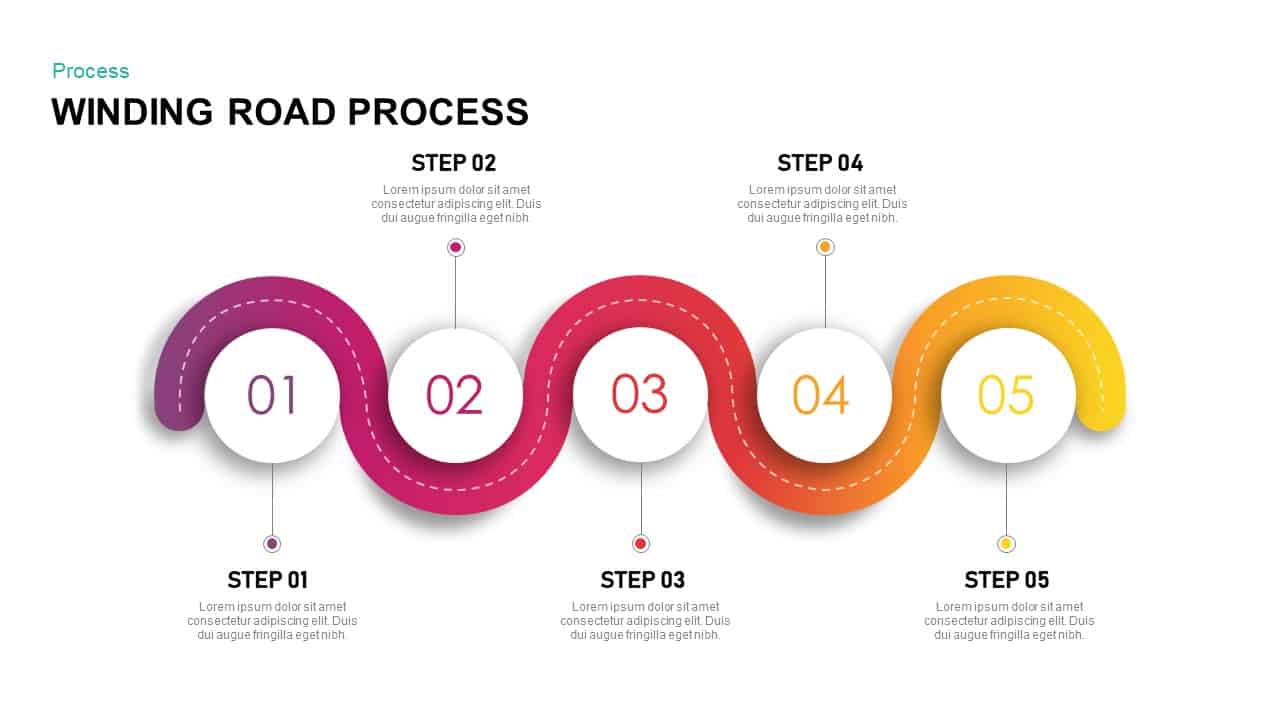
Dynamic Winding Road Process Timeline Template for PowerPoint & Google Slides
Process
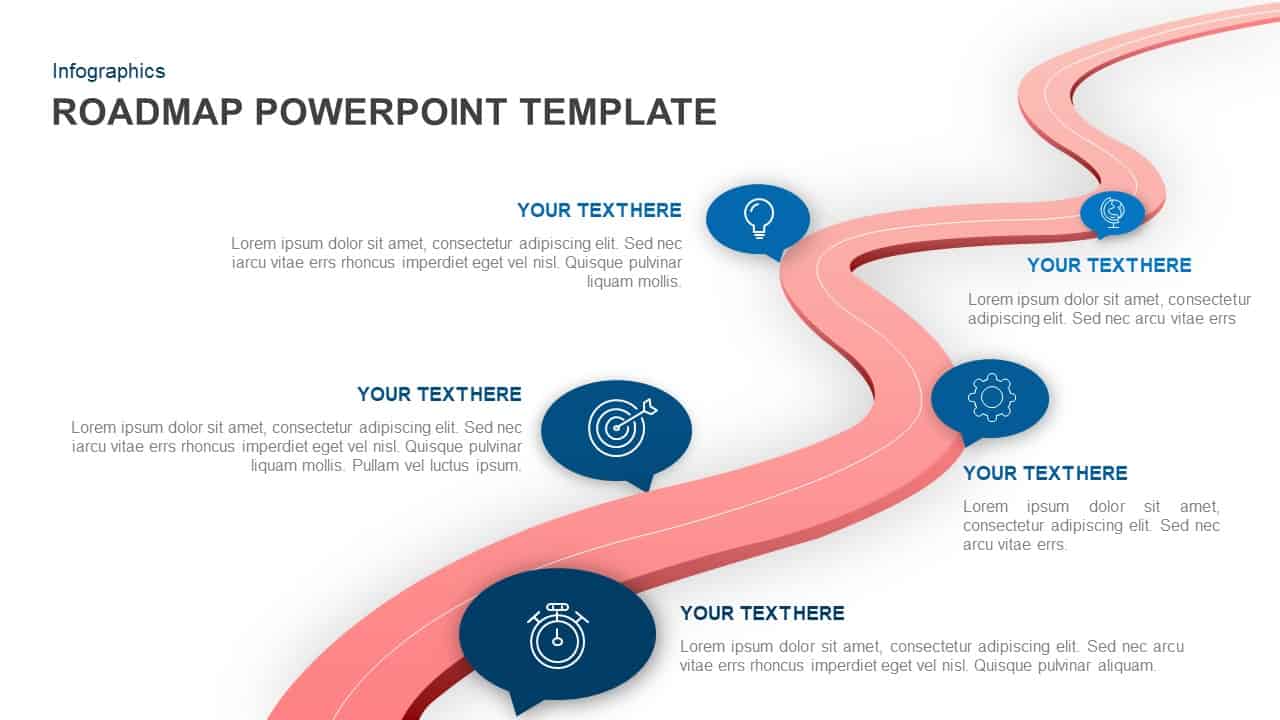
Dynamic Winding Roadmap Infographic Template for PowerPoint & Google Slides
Roadmap
Dynamic AI Applications Infographic Template for PowerPoint & Google Slides
AI
Dynamic Growth Arrow Step Infographic Template for PowerPoint & Google Slides
Process
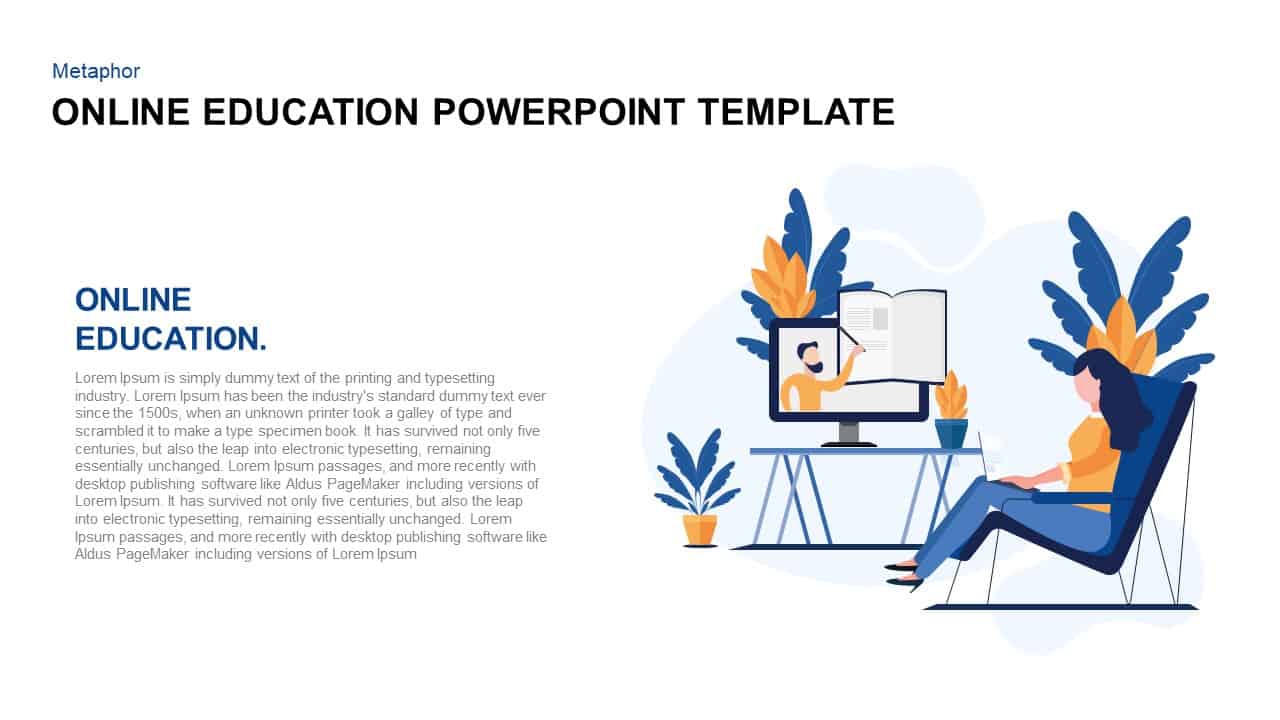
Dynamic Online Education Illustration Template for PowerPoint & Google Slides
Business Proposal
Capital Structure Dynamic Split Chart Template for PowerPoint & Google Slides
Comparison Chart

Dynamic Marketing Radar Chart Analytics Template for PowerPoint & Google Slides
Comparison
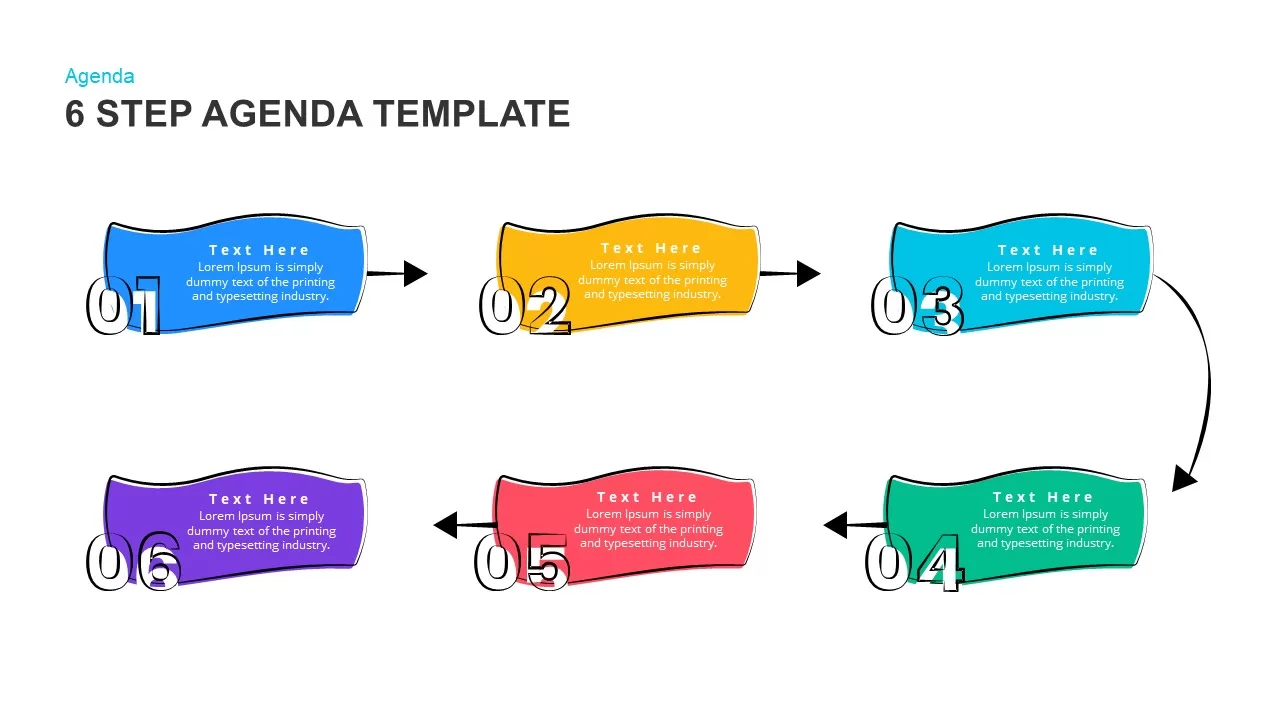
Modern & Dynamic 6-Step Agenda Sequence Template for PowerPoint & Google Slides
Agenda
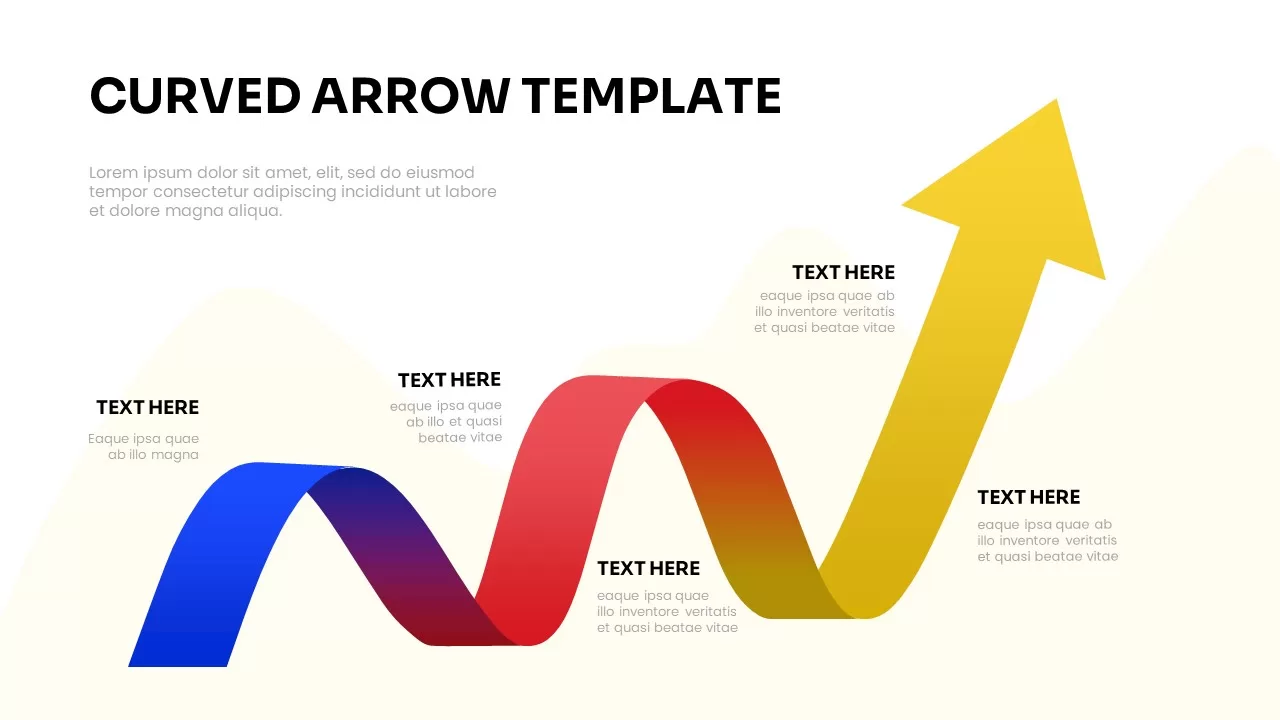
Dynamic Curved Arrow Process Roadmap Template for PowerPoint & Google Slides
Process
Dynamic Benchmarking Comparison Chart Template for PowerPoint & Google Slides
Comparison Chart
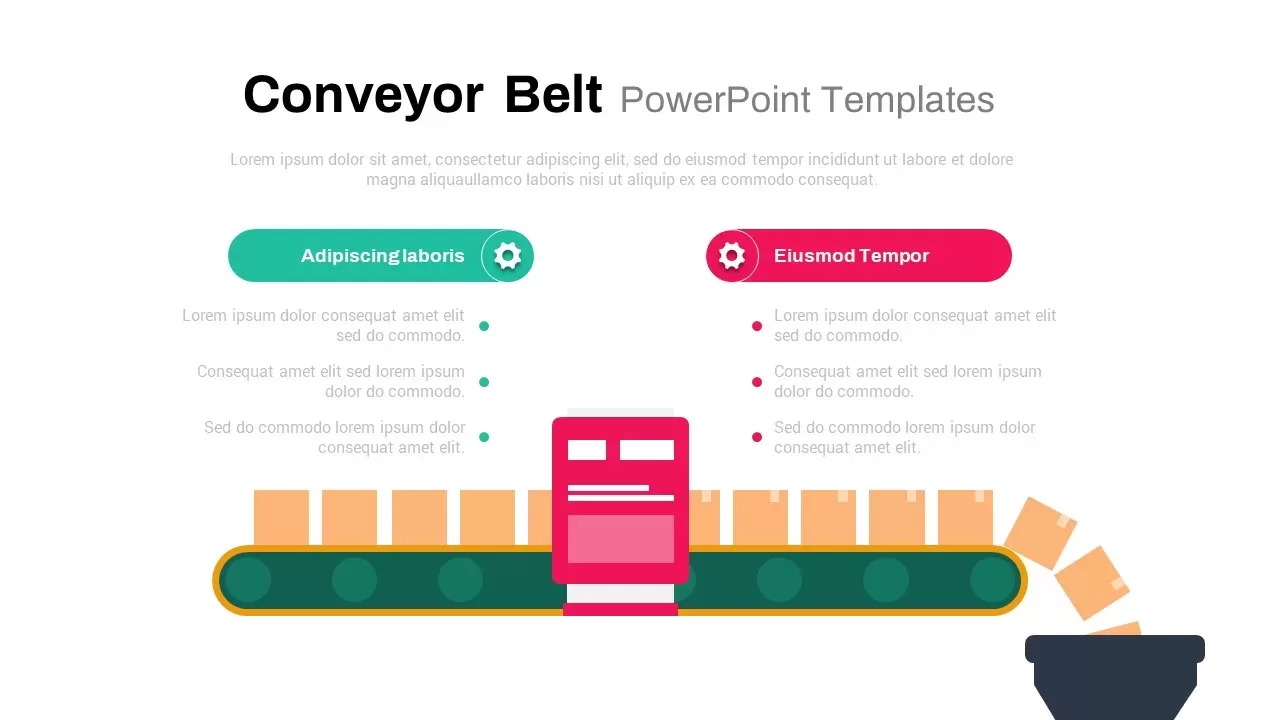
Dynamic Conveyor Belt Process Flow Template for PowerPoint & Google Slides
Process
Dynamic Statistics & Progress Charts Template for PowerPoint & Google Slides
Pie/Donut
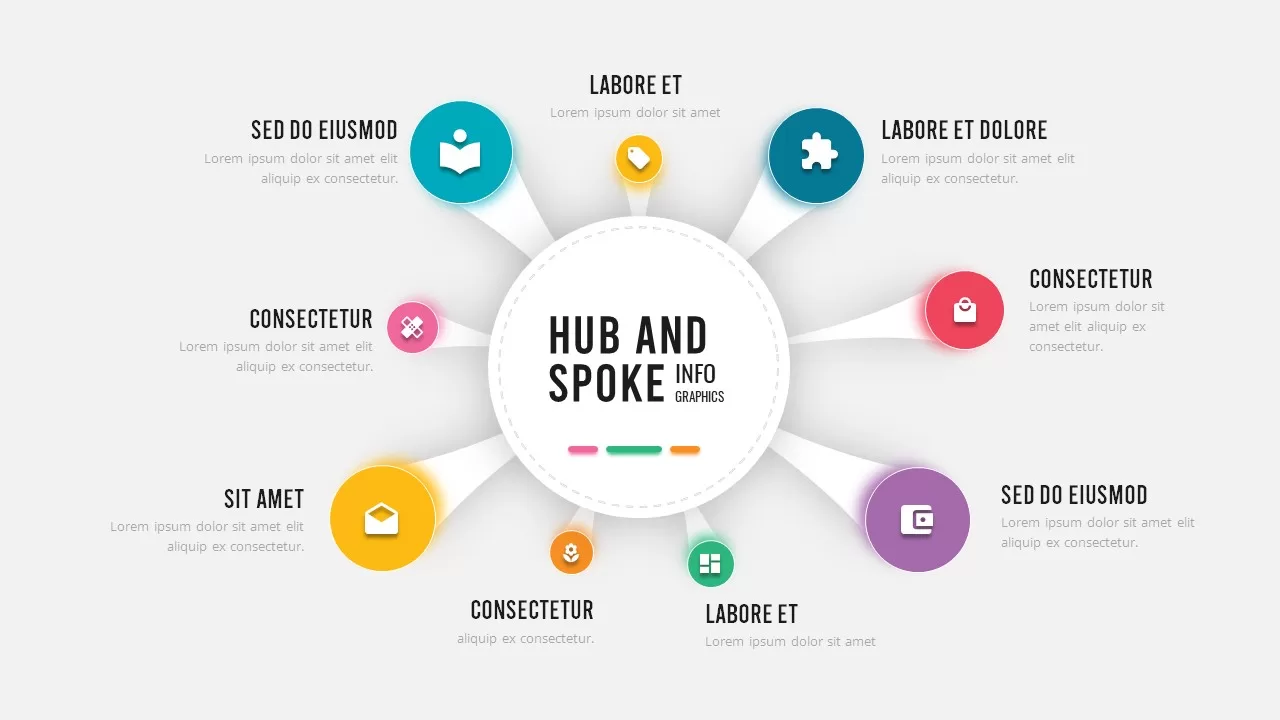
Dynamic Hub-and-Spoke Infographic Diagram Template for PowerPoint & Google Slides
Circular
Dynamic Circular Hub-and-Spoke Infographic Template for PowerPoint & Google Slides
Circular
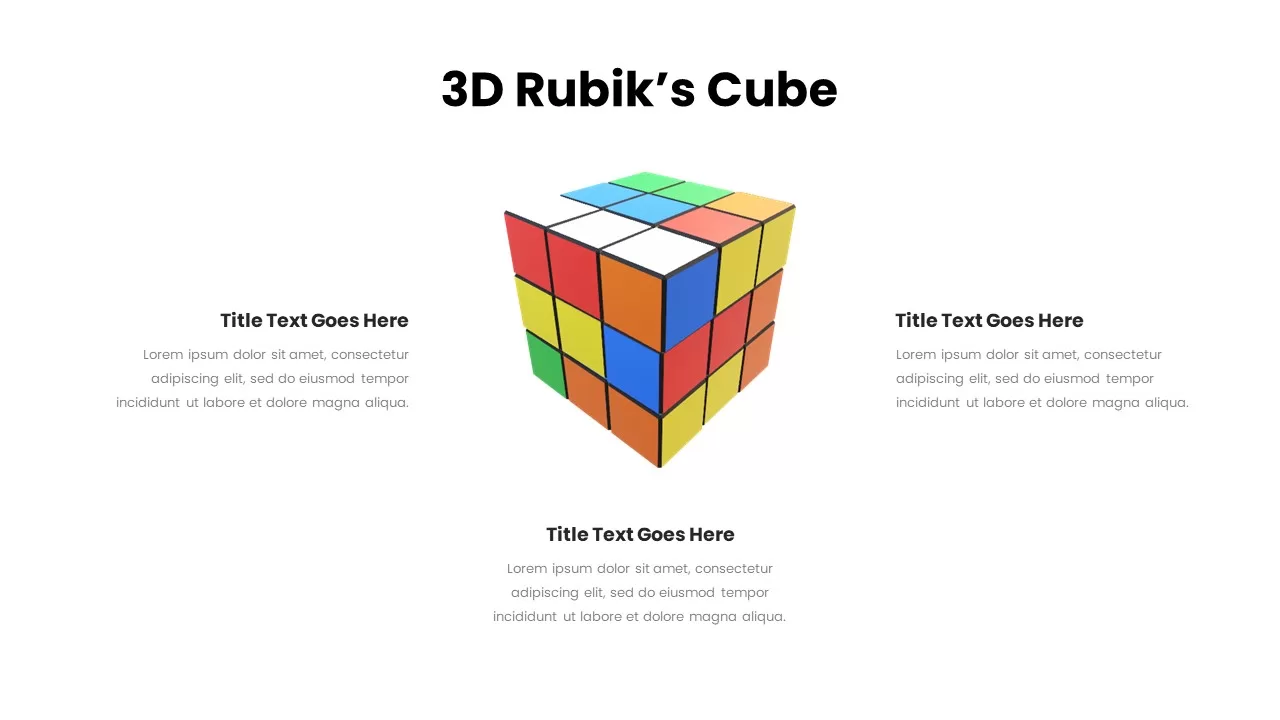
Dynamic 3D Rubik’s Cube Diagram Pack Template for PowerPoint & Google Slides
Infographics
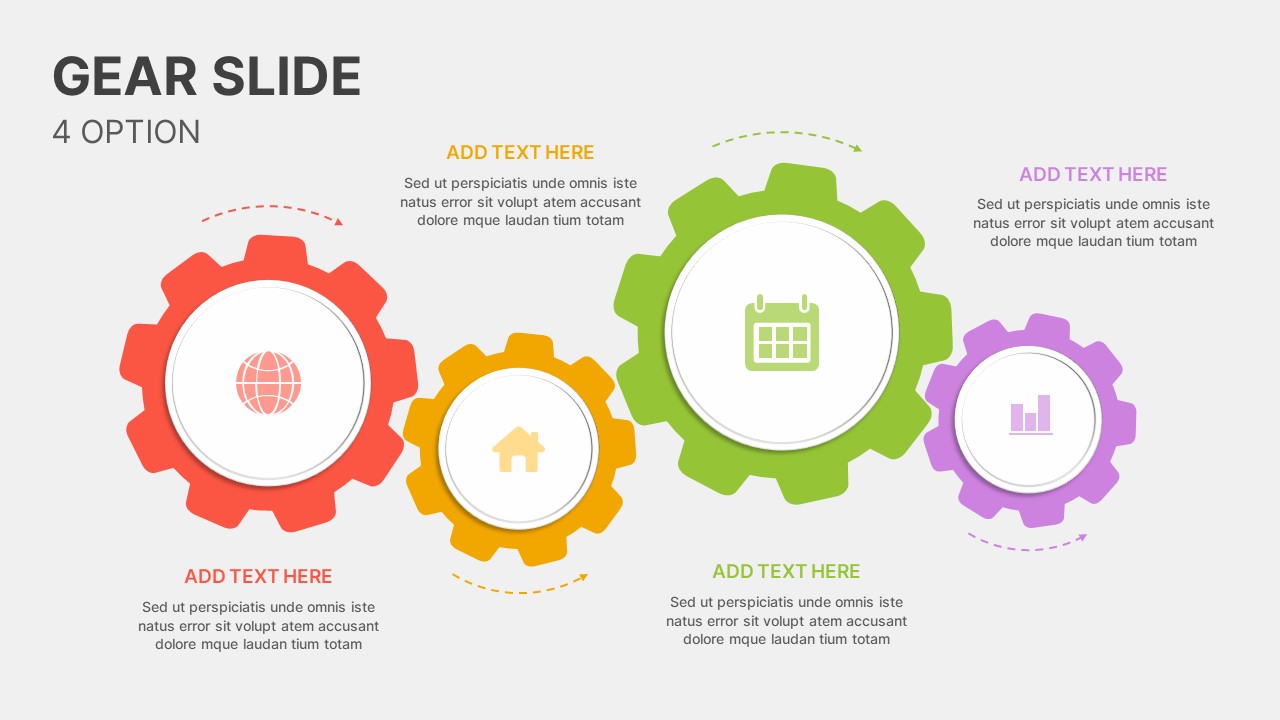
Dynamic Four-Step Gear Process Template for PowerPoint & Google Slides
Process
Dynamic Basketball Training Promotion Template for PowerPoint & Google Slides
Advertising
Dynamic Hurdle Race Presentation Template for PowerPoint & Google Slides
Advertising
Dynamic Sprint Race Cover Slide Template for PowerPoint & Google Slides
Graphics
Dynamic Soccer Stadium Presentation Template for PowerPoint & Google Slides
Graphics
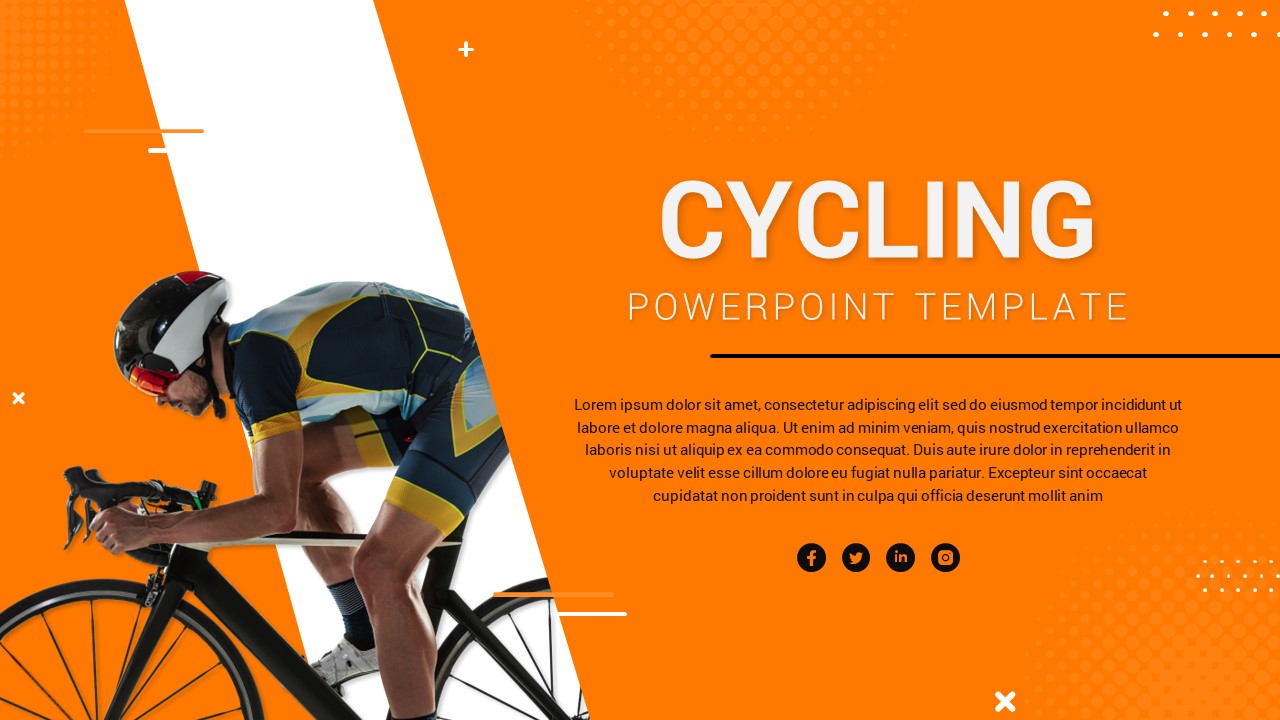
Dynamic Cycling Presentation Template for PowerPoint & Google Slides
Graphics
Dynamic Boxing Training Cover Slide Template for PowerPoint & Google Slides
Graphics
Dynamic Relay Race Presentation Slide Template for PowerPoint & Google Slides
Graphics
Dynamic Chevron Timeline Infographic Template for PowerPoint & Google Slides
Timeline
Dynamic Animated Question Mark Template for PowerPoint & Google Slides
Graphics
Dynamic Three-Series Stacked Area Chart Template for PowerPoint & Google Slides
Comparison Chart
Dynamic Sunburst Chart Visualization Template for PowerPoint & Google Slides
Charts
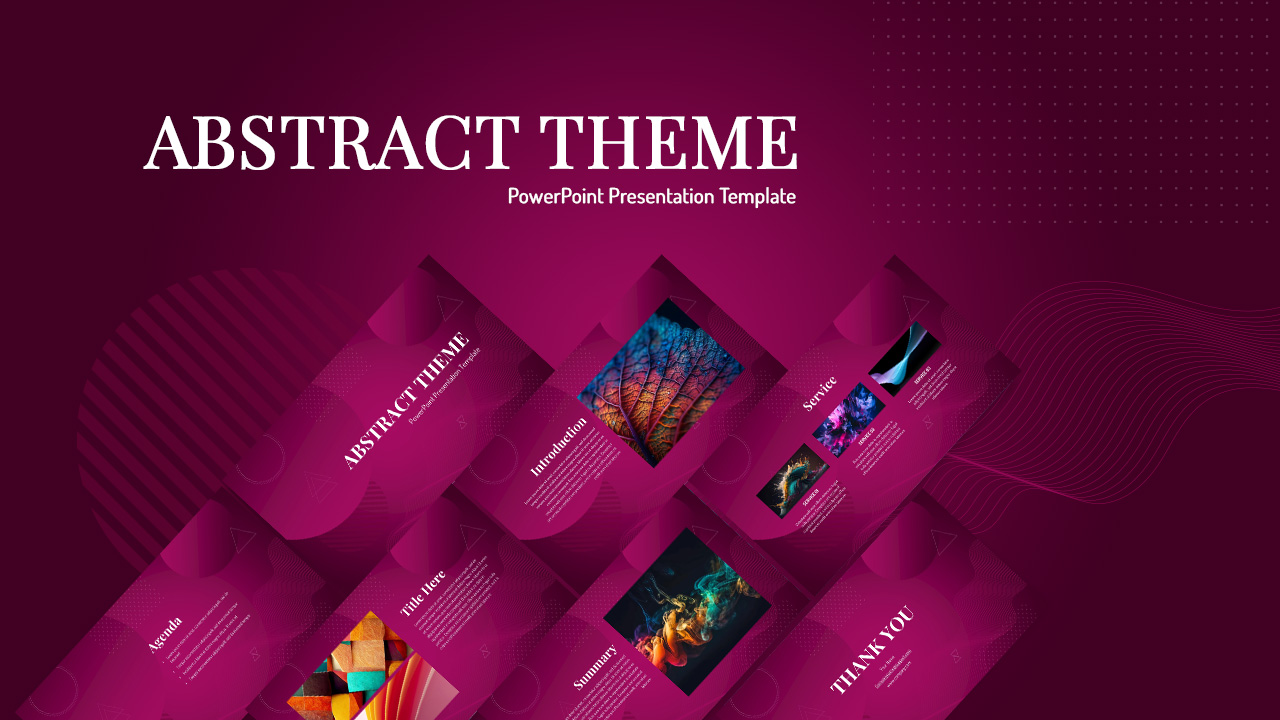
Dynamic Abstract Corporate Theme Template for PowerPoint & Google Slides
Decks
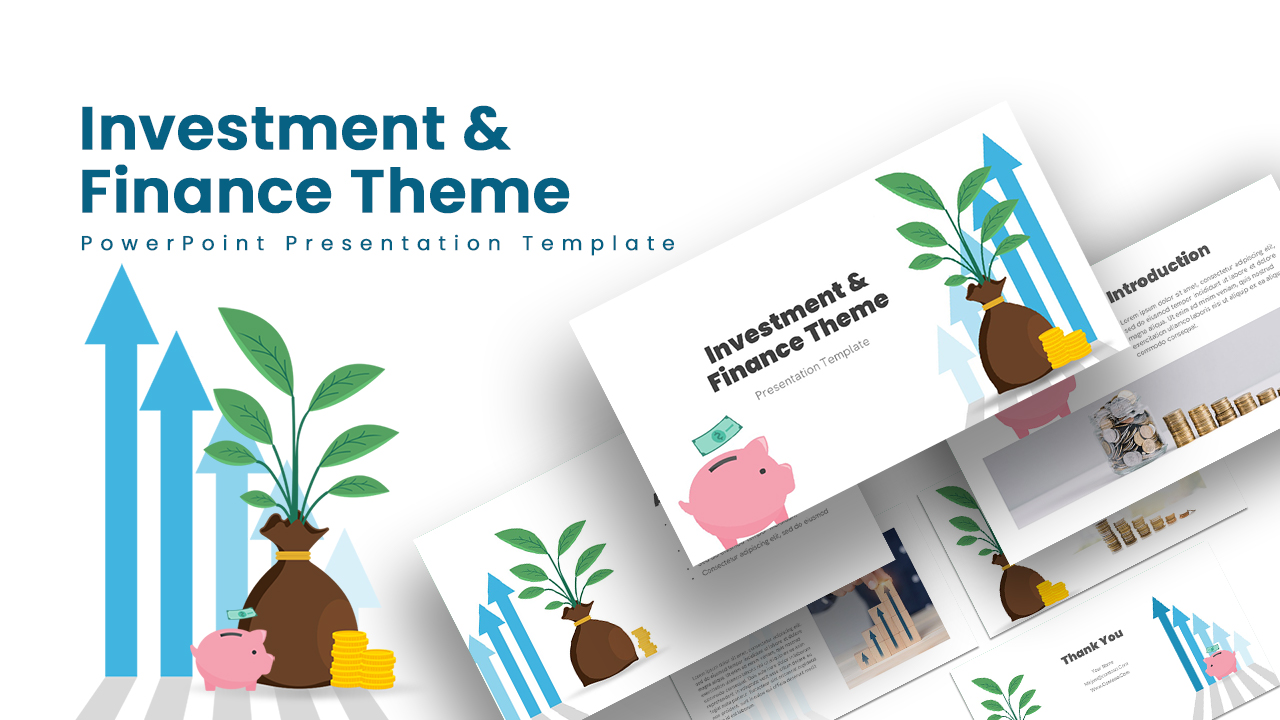
Dynamic Investment & Finance Growth Template for PowerPoint & Google Slides
Finance
Dynamic Bar-of-Pie Chart Comparison Template for PowerPoint & Google Slides
Pie/Donut
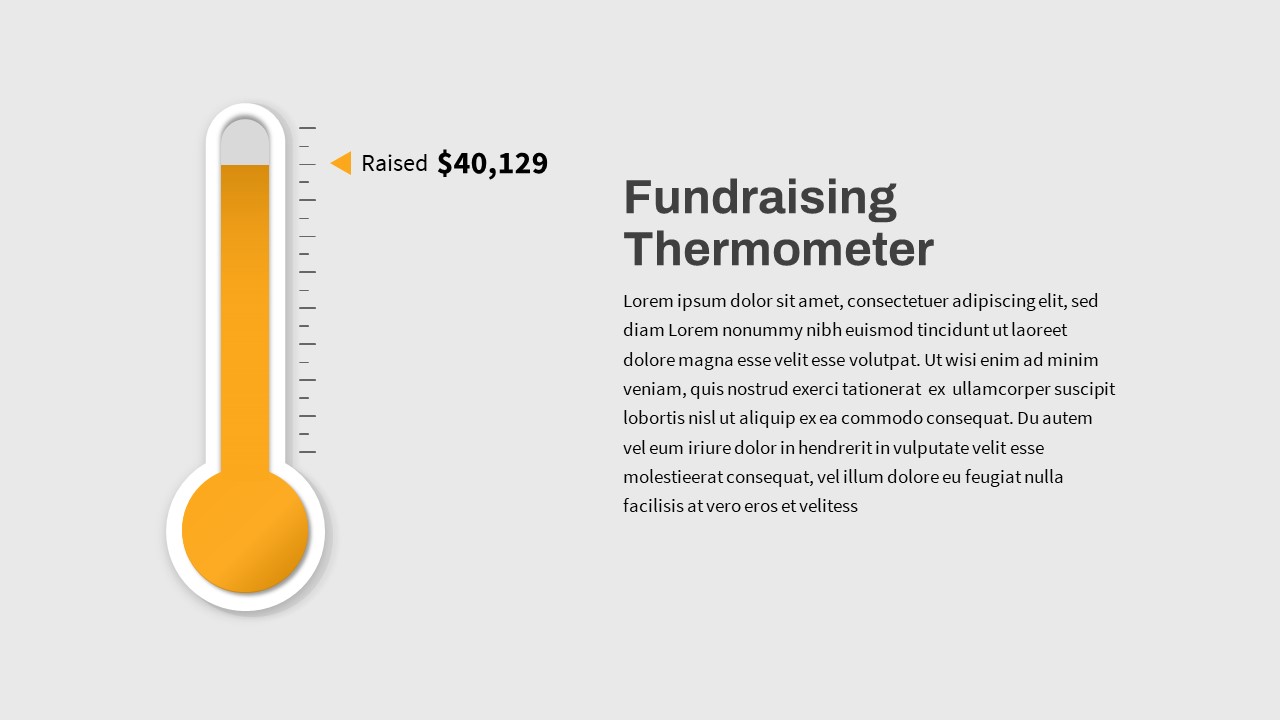
Dynamic Fundraising Thermometer Slide Template for PowerPoint & Google Slides
Revenue

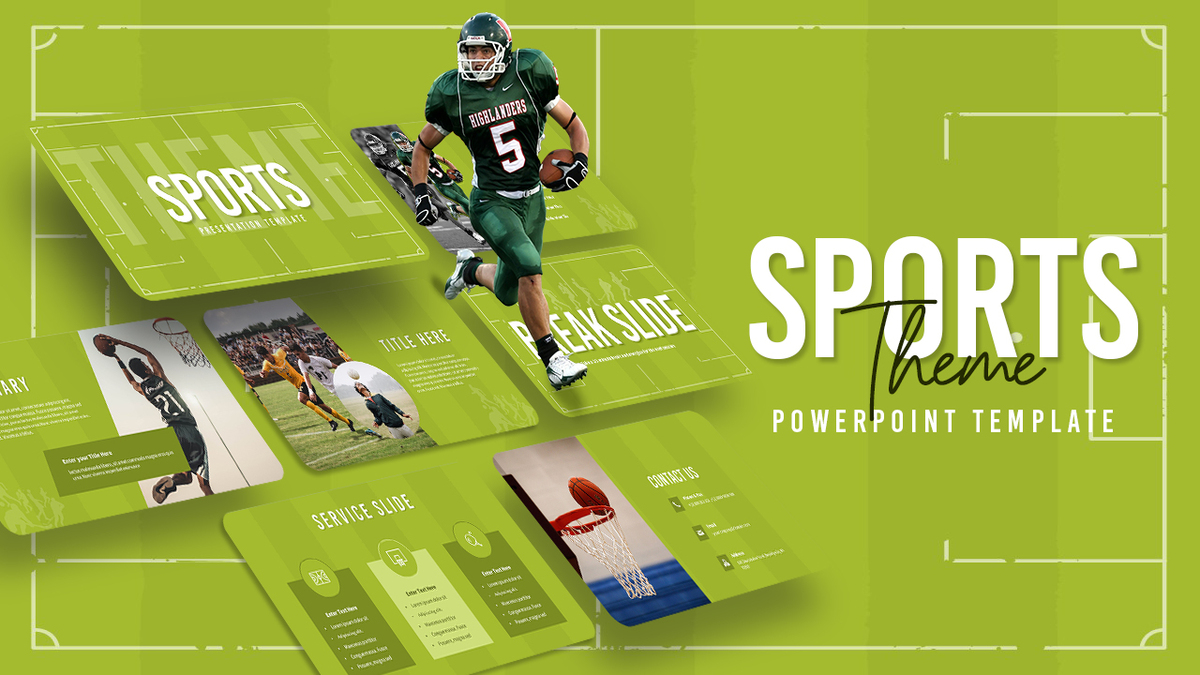
Dynamic Green Field Sports Presentation Template for PowerPoint & Google Slides
Decks
Dynamic Financial Analysis Line Chart Template for PowerPoint & Google Slides
Finance
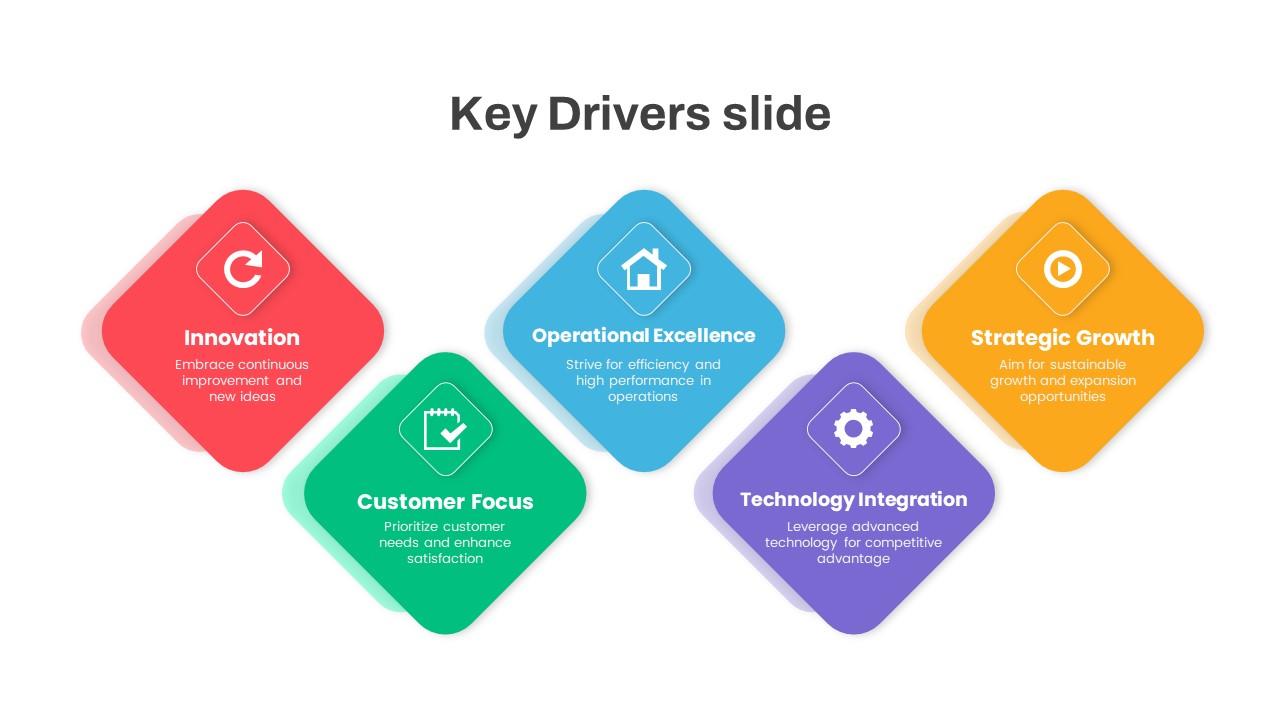
Dynamic Business Key Drivers Slide Template for PowerPoint & Google Slides
Process

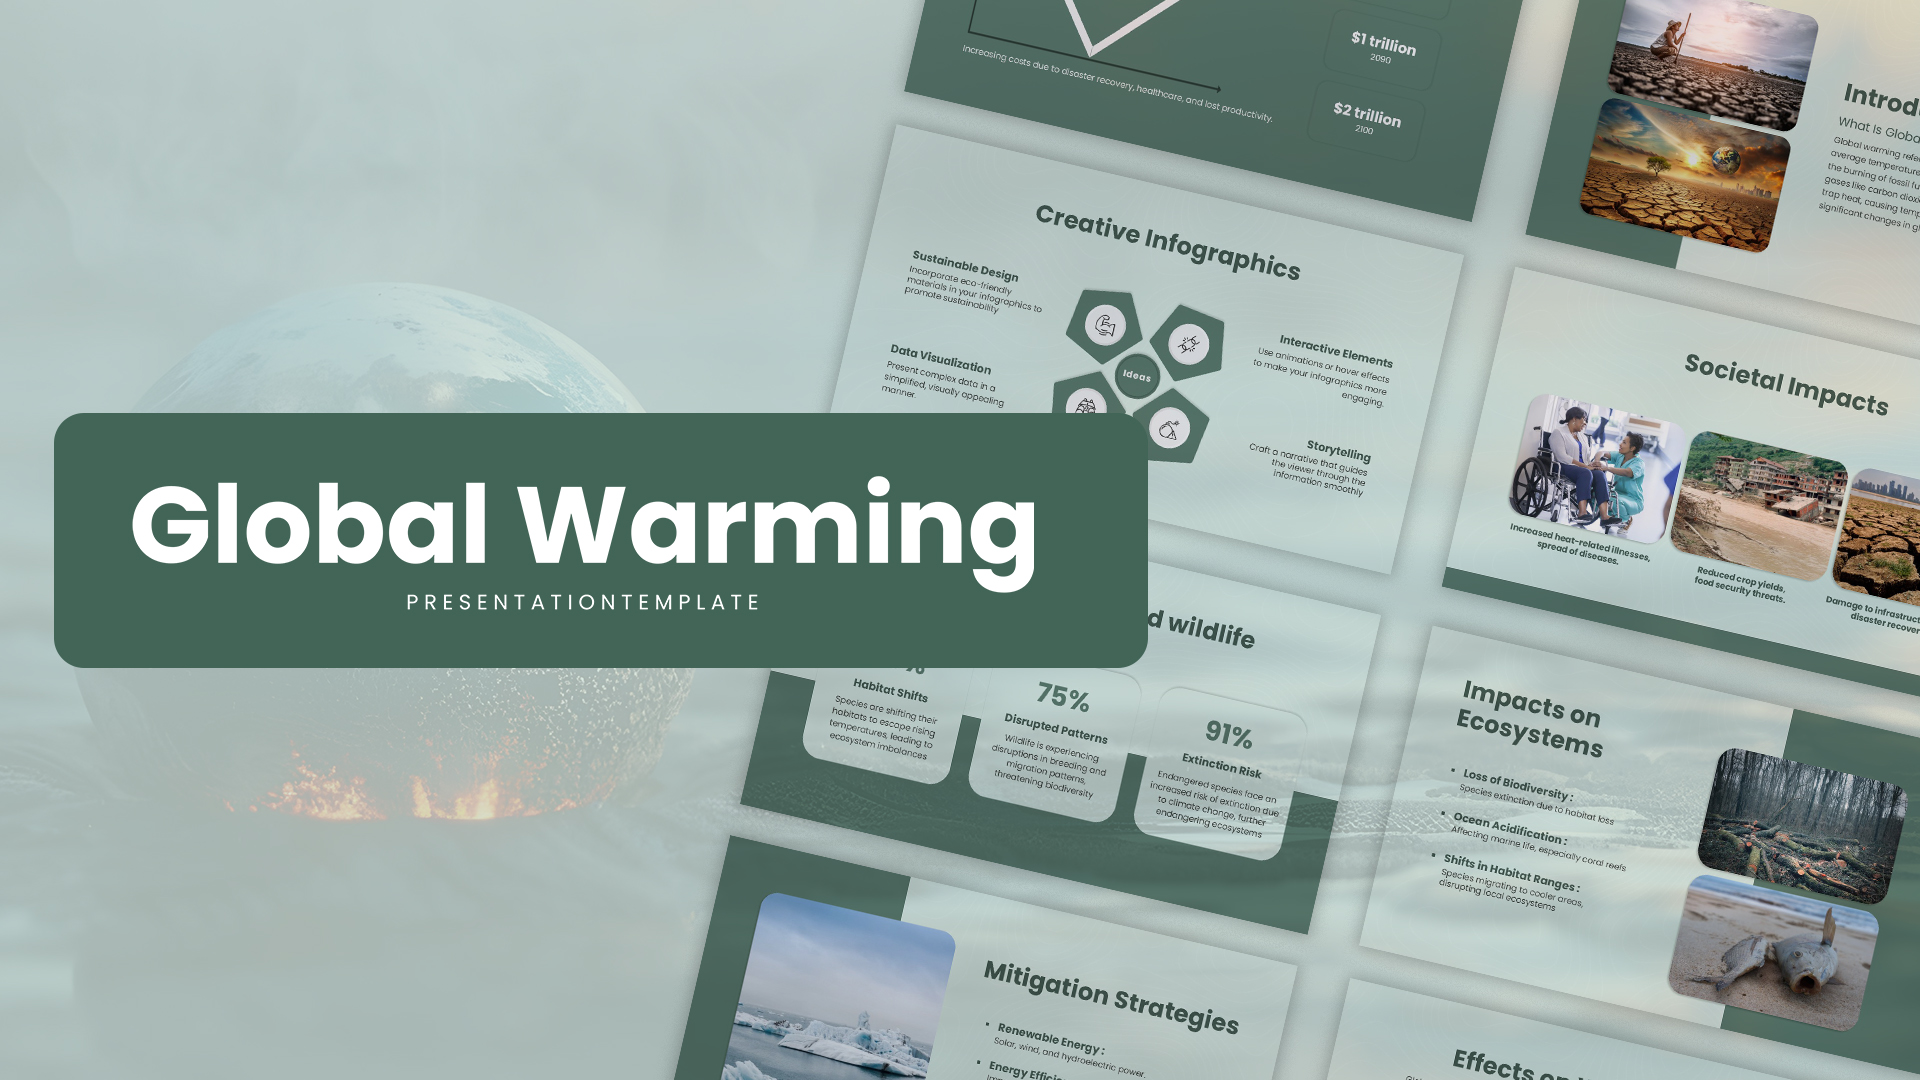
Free Dynamic Global Warming Presentation Template for PowerPoint & Google Slides
Pitch Deck
Free
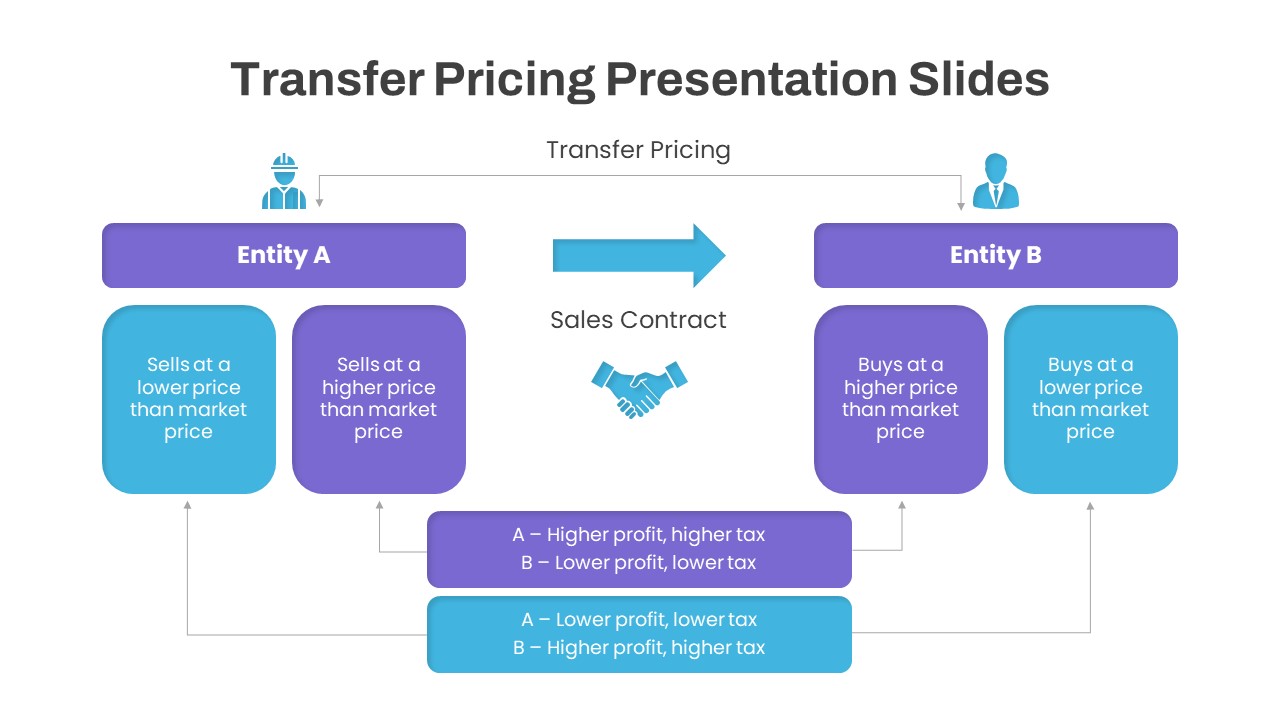
Dynamic Transfer Pricing Flow Diagram Template for PowerPoint & Google Slides
Finance
Dynamic Carousel Icon Hub Diagram Template for PowerPoint & Google Slides
Circular
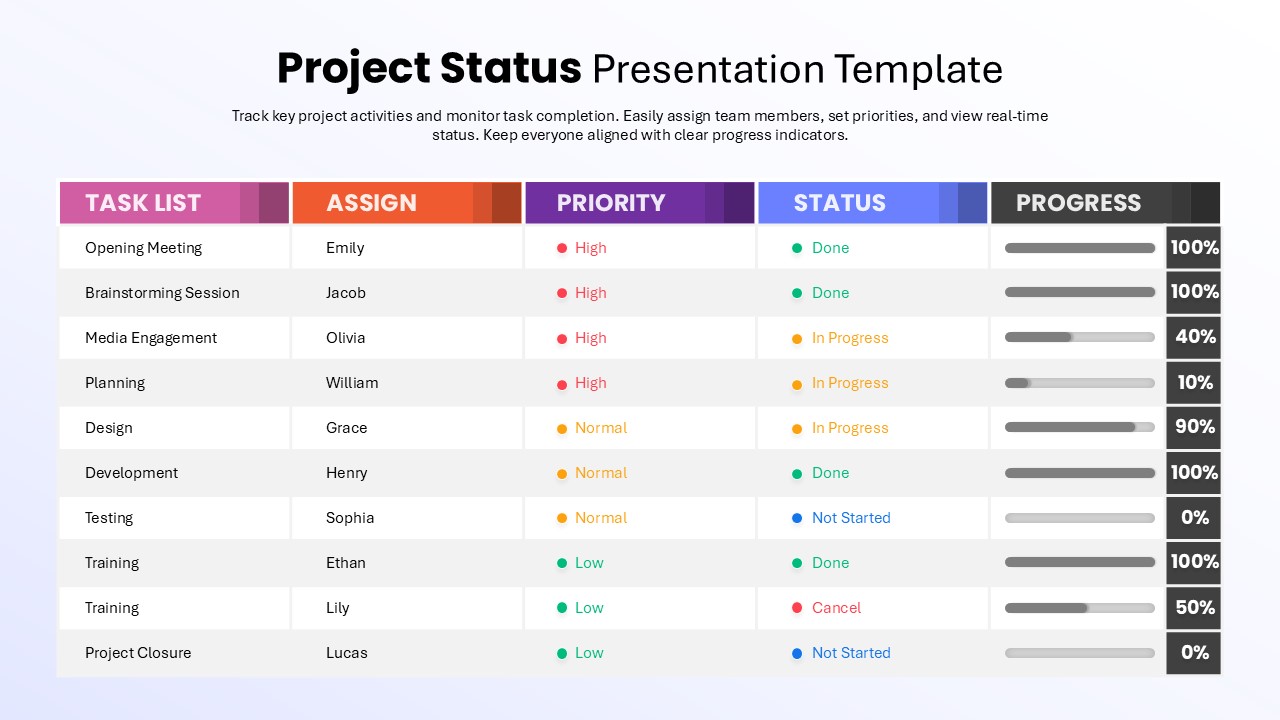
Dynamic Project Status Tracking Table Template for PowerPoint & Google Slides
Project Status
Dynamic Tennis Sports Theme Slide for PowerPoint & Google Slides
Graphics
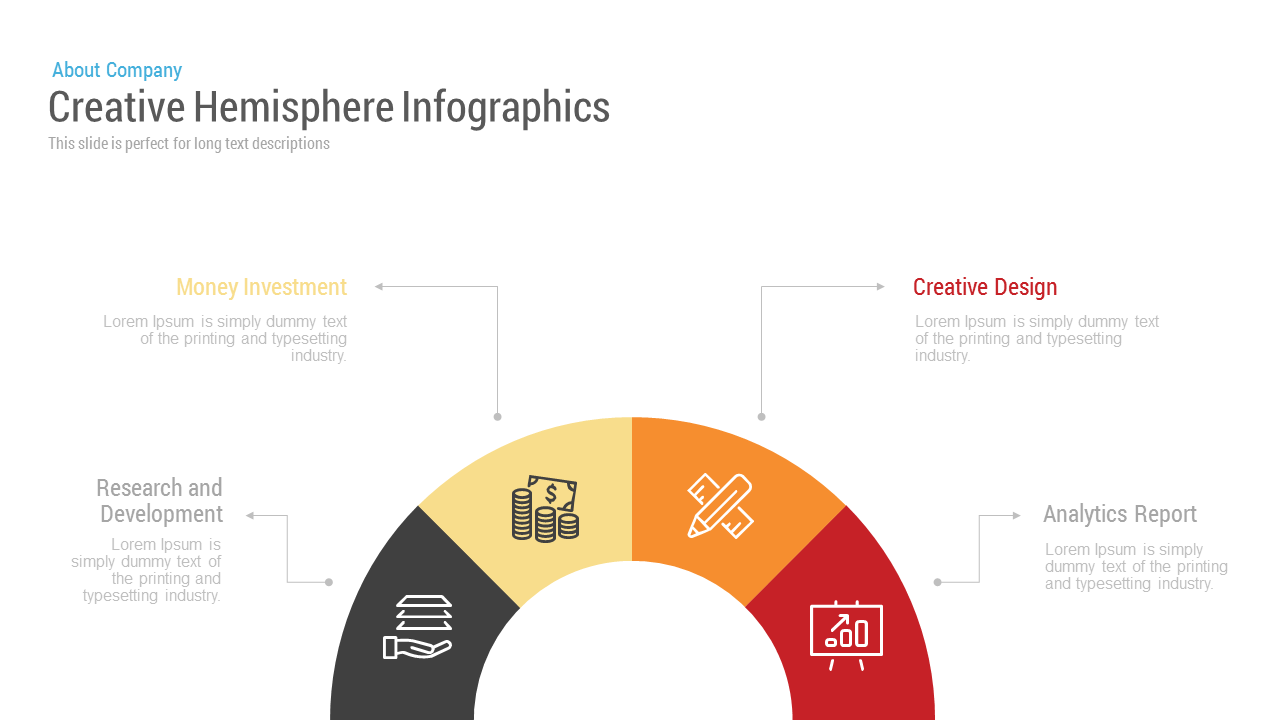
Free Creative Hemisphere Infographics template for PowerPoint & Google Slides
Infographics
Free
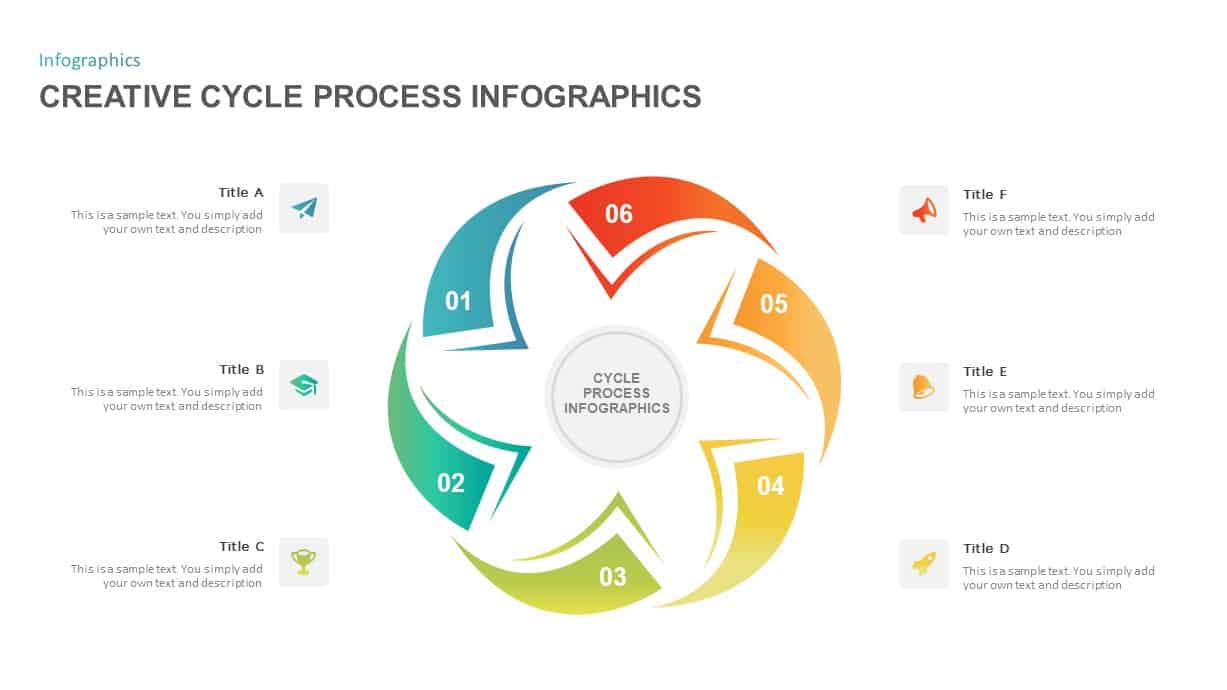
Creative Cycle Process Infographics Template for PowerPoint & Google Slides
Process
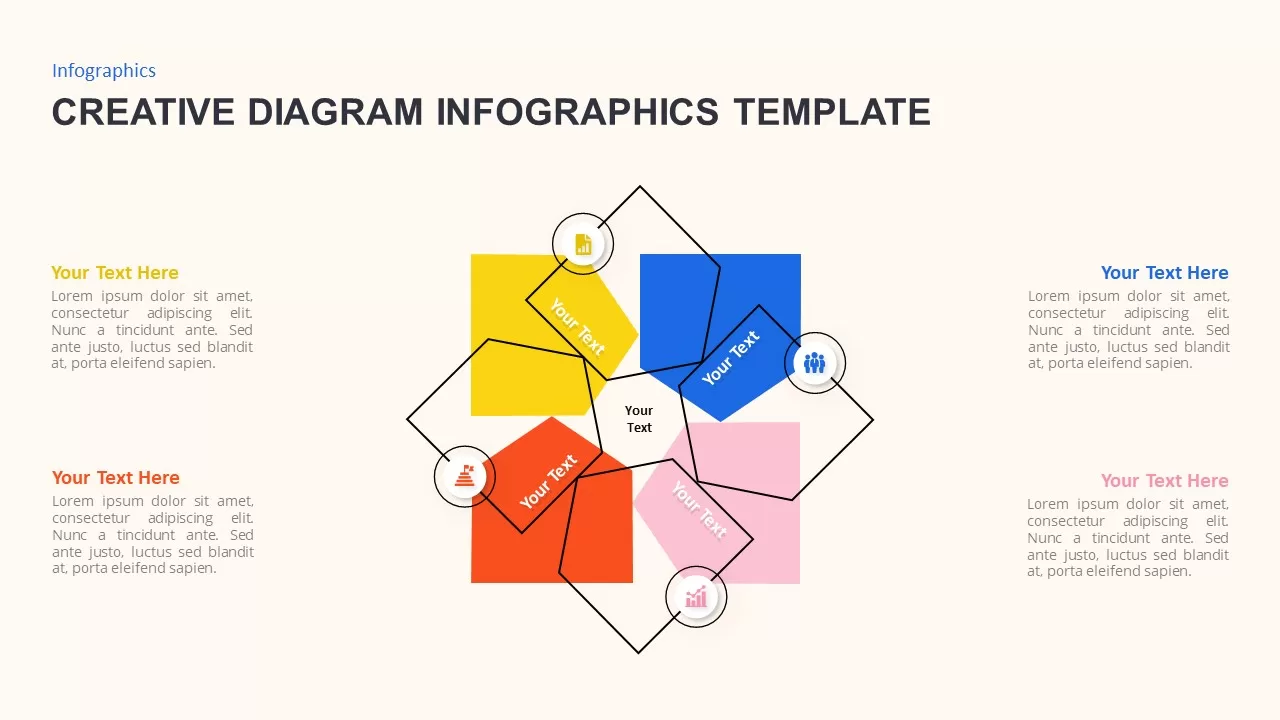
Versatile Creative Diagram Infographics Template for PowerPoint & Google Slides
Process
Creative Section Divider Slides Template for PowerPoint & Google Slides
Decks

Inspire Multipurpose Creative Deck PowerPoint Template for PowerPoint & Google Slides
Pitch Deck
Creative Studio PowerPoint Template for PowerPoint & Google Slides
Decks
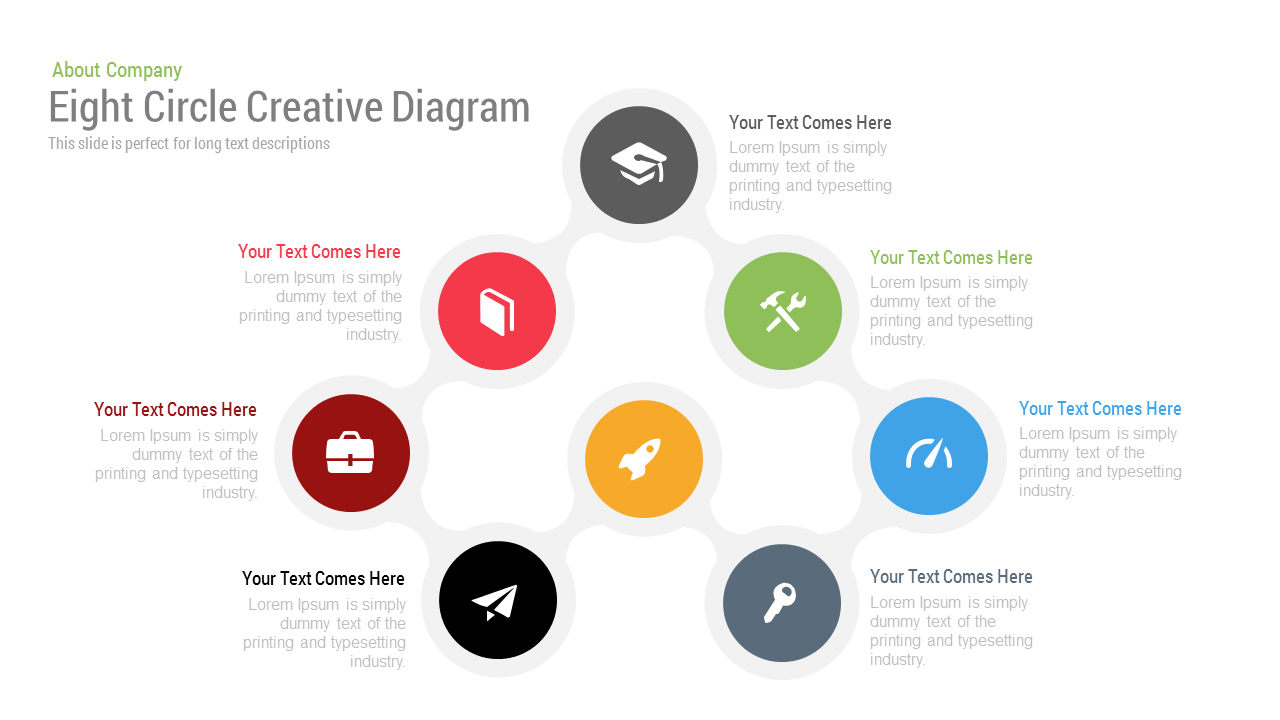
Free Eight Circle Creative Diagram template for PowerPoint & Google Slides
Circular
Free
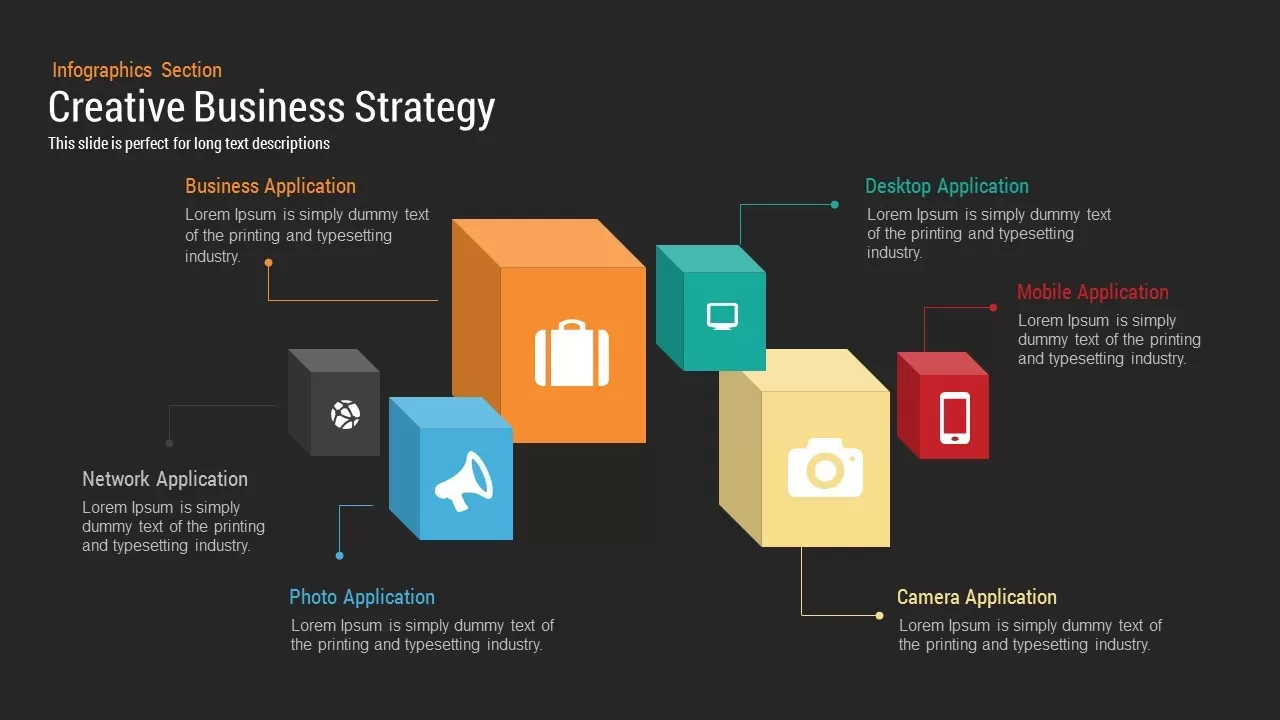
Creative Business Strategy Template for PowerPoint & Google Slides
Business Strategy

Creative data chart analytics template for PowerPoint & Google Slides
Charts
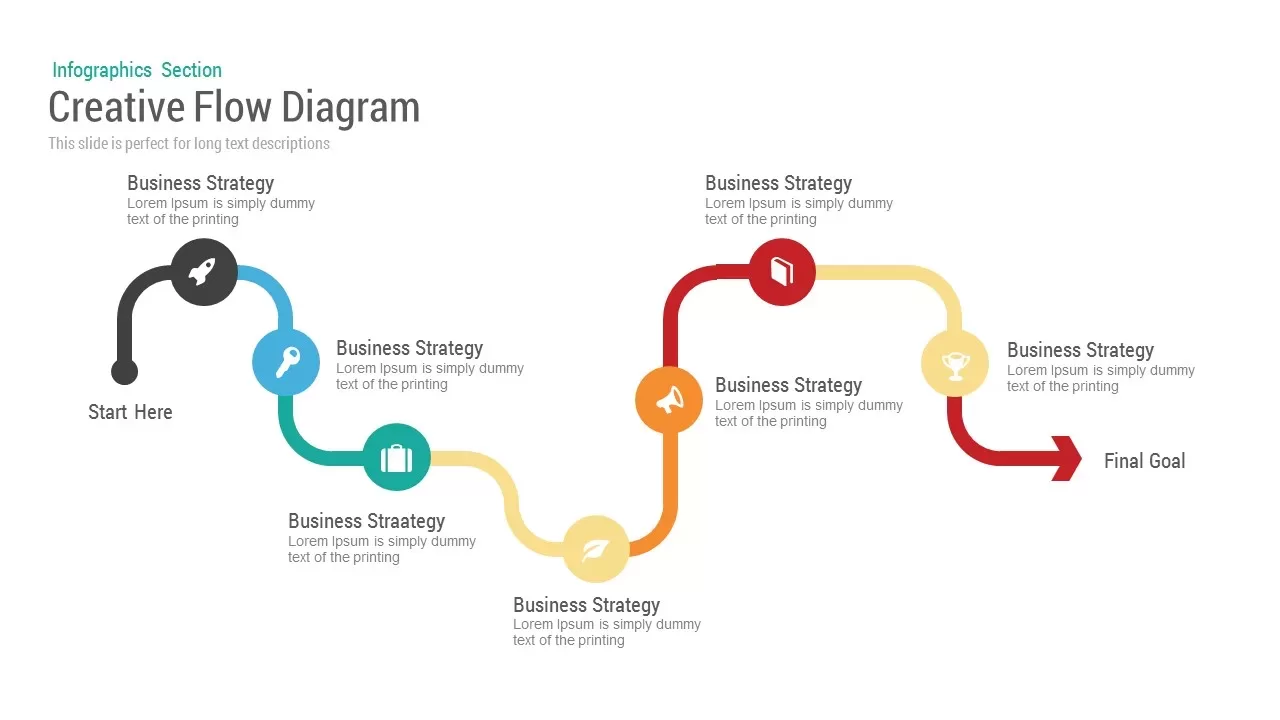
Creative flow diagram template for PowerPoint & Google Slides
Process
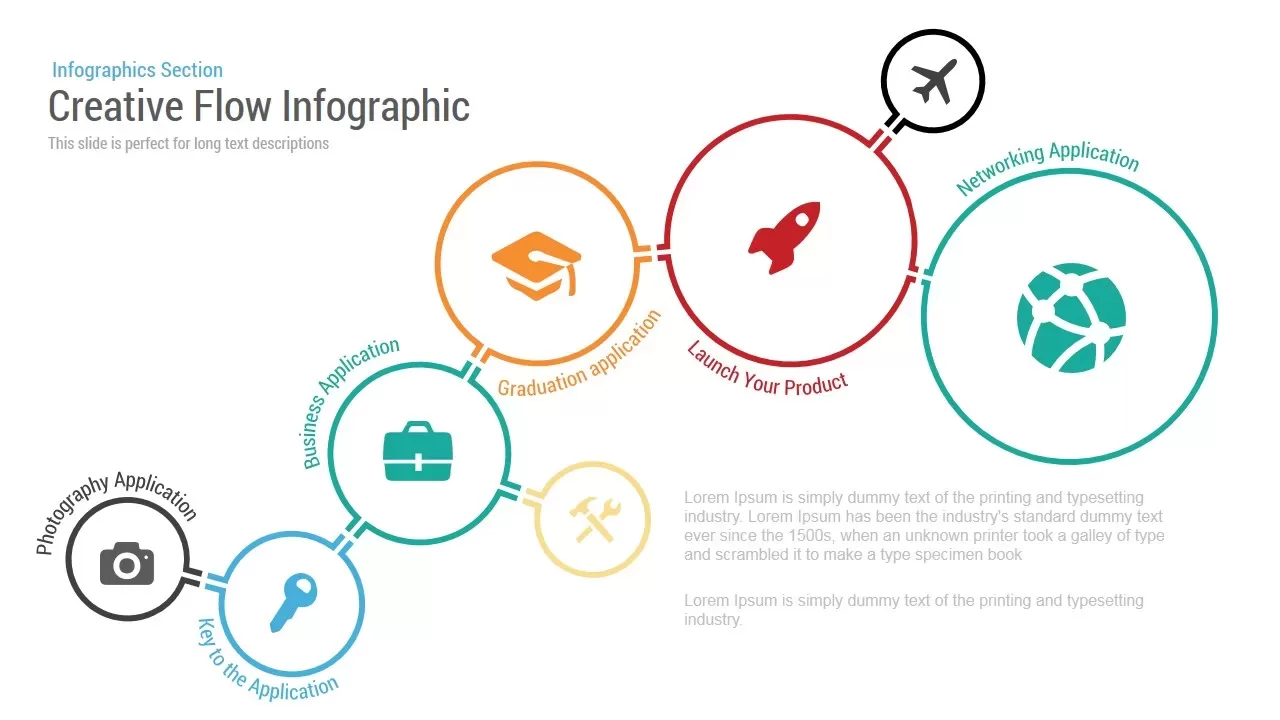
Creative Flow Infographic template for PowerPoint & Google Slides
Process
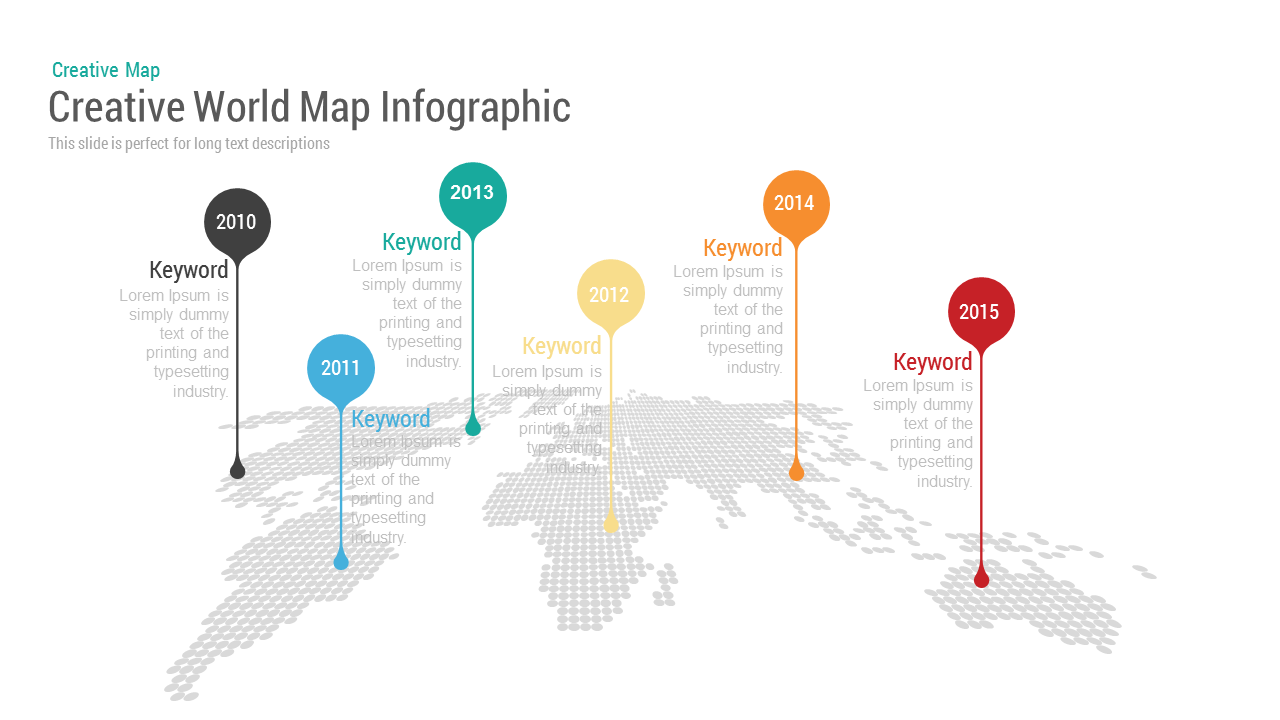
Creative World Map template for PowerPoint & Google Slides
World Maps
Creative Bar Chart template for PowerPoint & Google Slides
Charts
Creative Timeline template for PowerPoint & Google Slides
Timeline
Animated Creative Timeline template for PowerPoint & Google Slides
Timeline
Creative Roadmap template for PowerPoint & Google Slides
Infographics
Creative Pencil Timeline Infographic Template for PowerPoint & Google Slides
Timeline
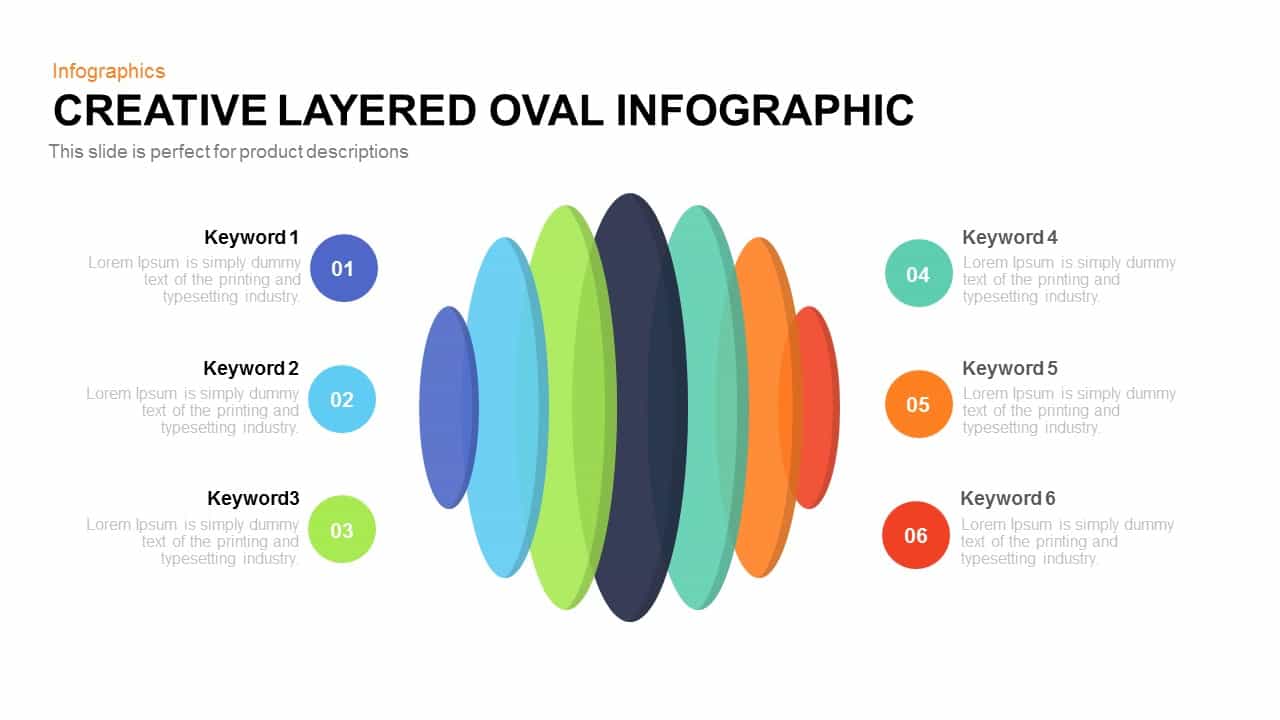
Creative Layered Oval Infographic Diagram Template for PowerPoint & Google Slides
Process
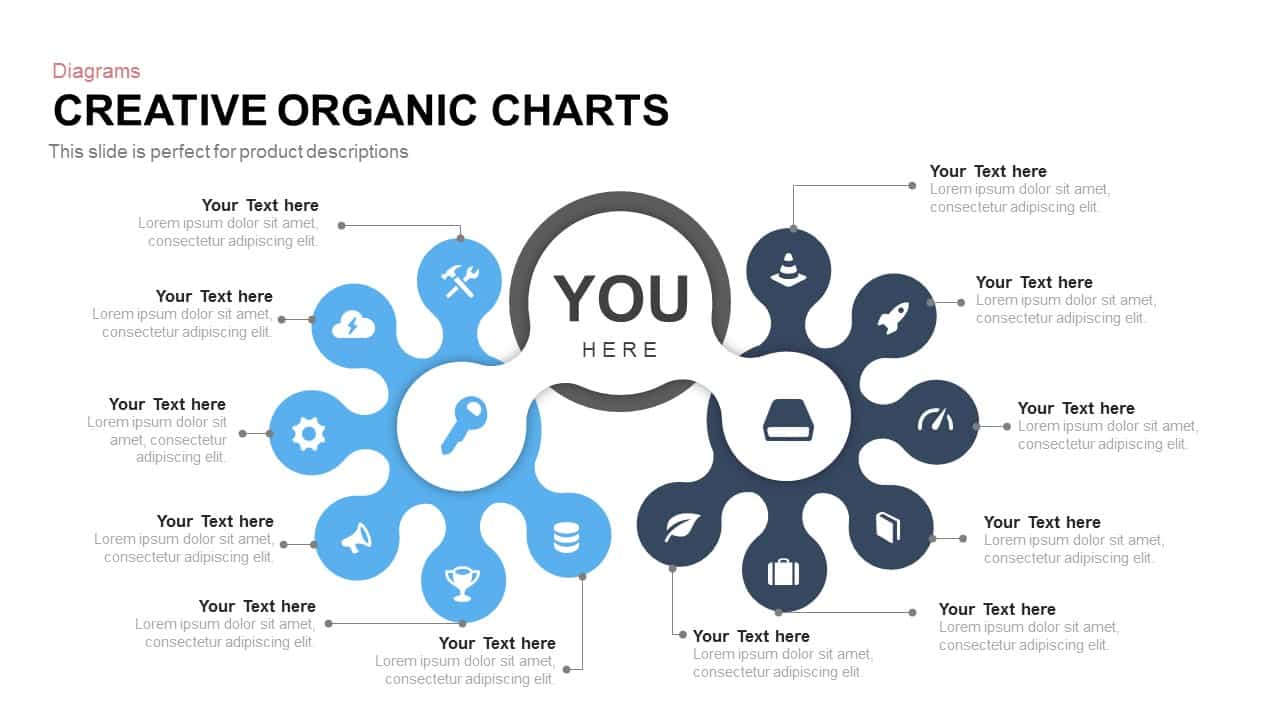
Creative Organic Hub-and-Spoke Diagram template for PowerPoint & Google Slides
Circular
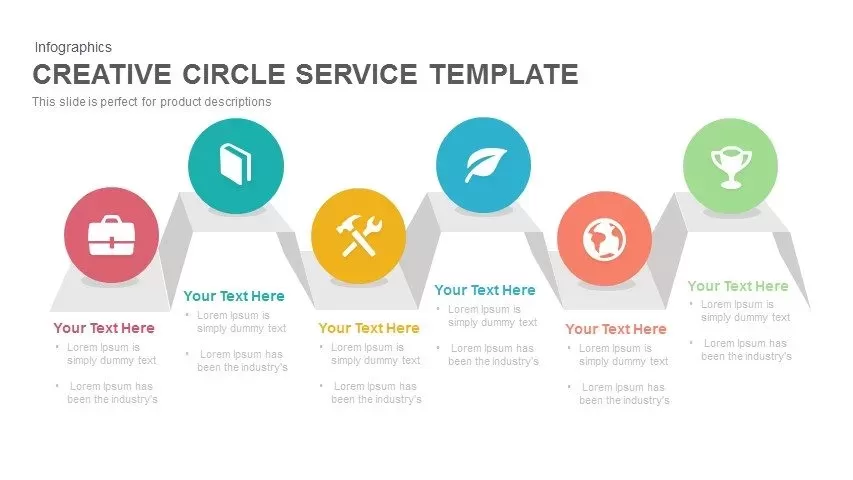
Creative Zigzag Circle Service Steps Template for PowerPoint & Google Slides
Process
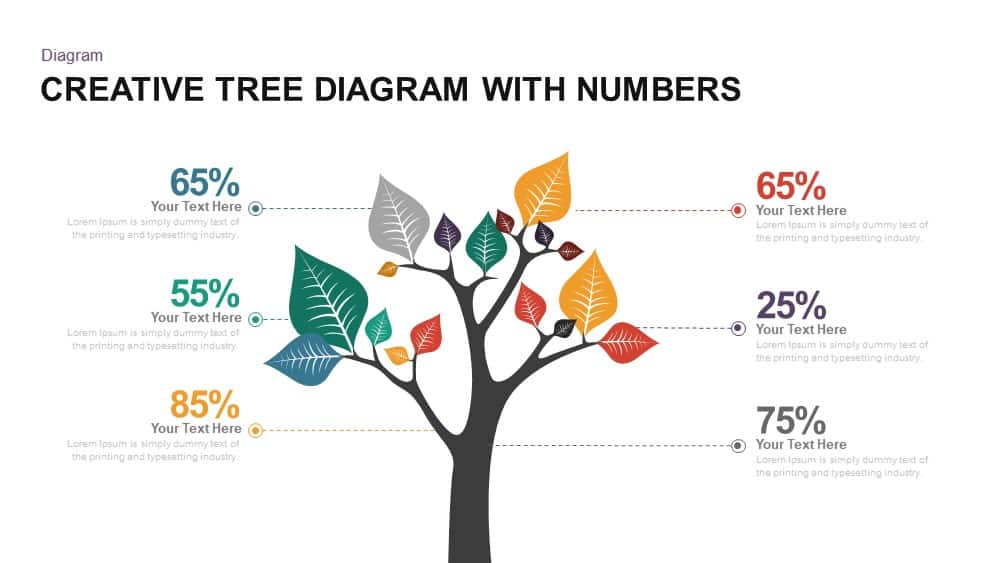
Creative Tree Diagram with Percentages Template for PowerPoint & Google Slides
Decision Tree
Creative Bubble Timeline Infographic Template for PowerPoint & Google Slides
Timeline
Creative Tree Infographic Diagram Template for PowerPoint & Google Slides
Infographics
Creative Three-Circle Venn Diagram Template for PowerPoint & Google Slides
Comparison

PIXELS – Free Creative Presentation Template for PowerPoint & Google Slides
Pitch Deck
Free
Creative Tree Diagram Infographic Template for PowerPoint & Google Slides
Decision Tree
Creative Tree Diagram template for PowerPoint & Google Slides
Process
Creative Tree Diagram Infographic Template for PowerPoint & Google Slides
Decision Tree
Animated Business Trends Creative Deck Template for PowerPoint & Google Slides
Pitch Deck
Creative Tips Slide Template for PowerPoint & Google Slides
Business
Creative Blue Blobs Abstract Title Slide Template for PowerPoint & Google Slides
Company Profile
Pop Art Creative Presentation Template for PowerPoint & Google Slides
Decks
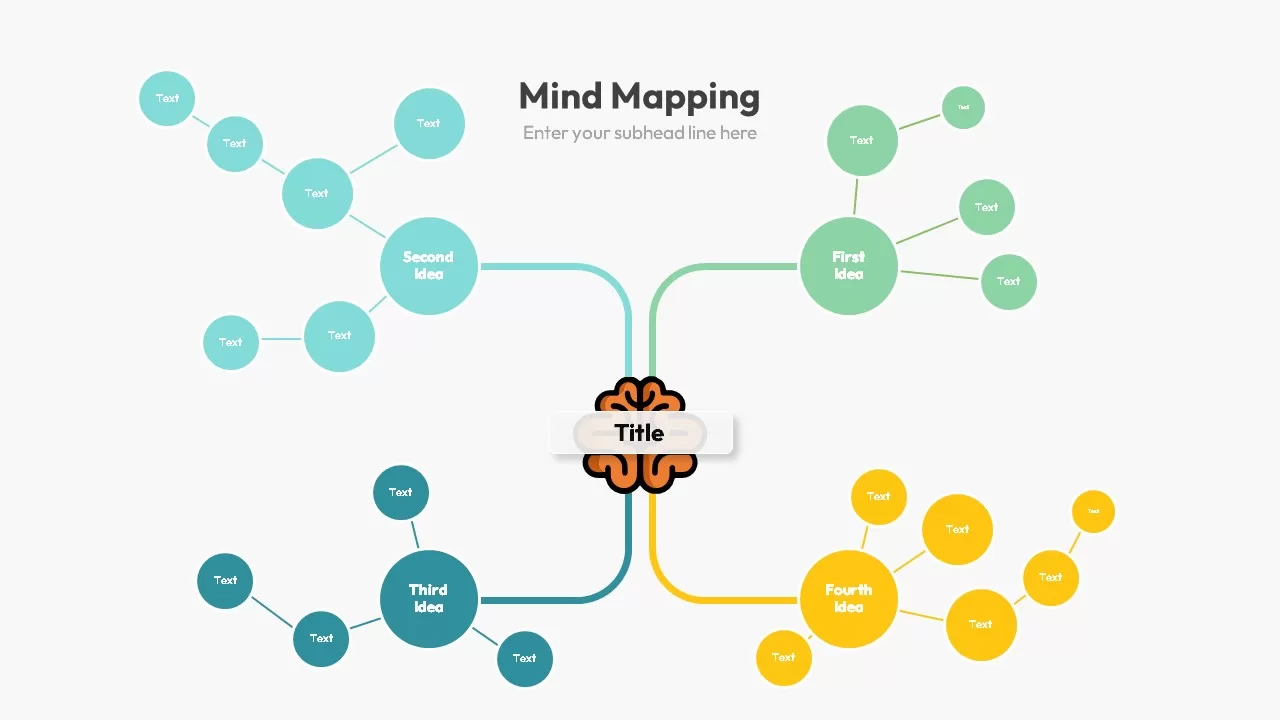
Creative Mind Mapping Template for PowerPoint & Google Slides
Mind Maps
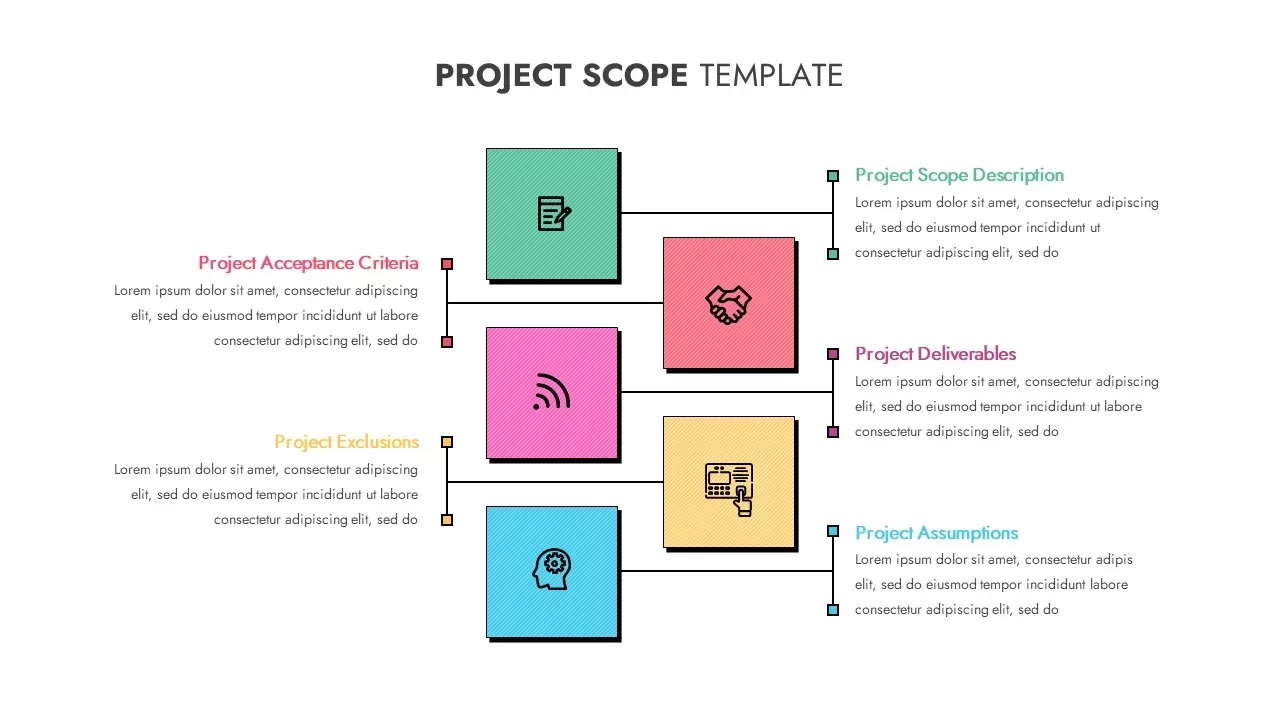
Creative Project Scope Template for PowerPoint & Google Slides
Project
Creative Polaroid Collage Photo Slide Template for PowerPoint & Google Slides
Graphics
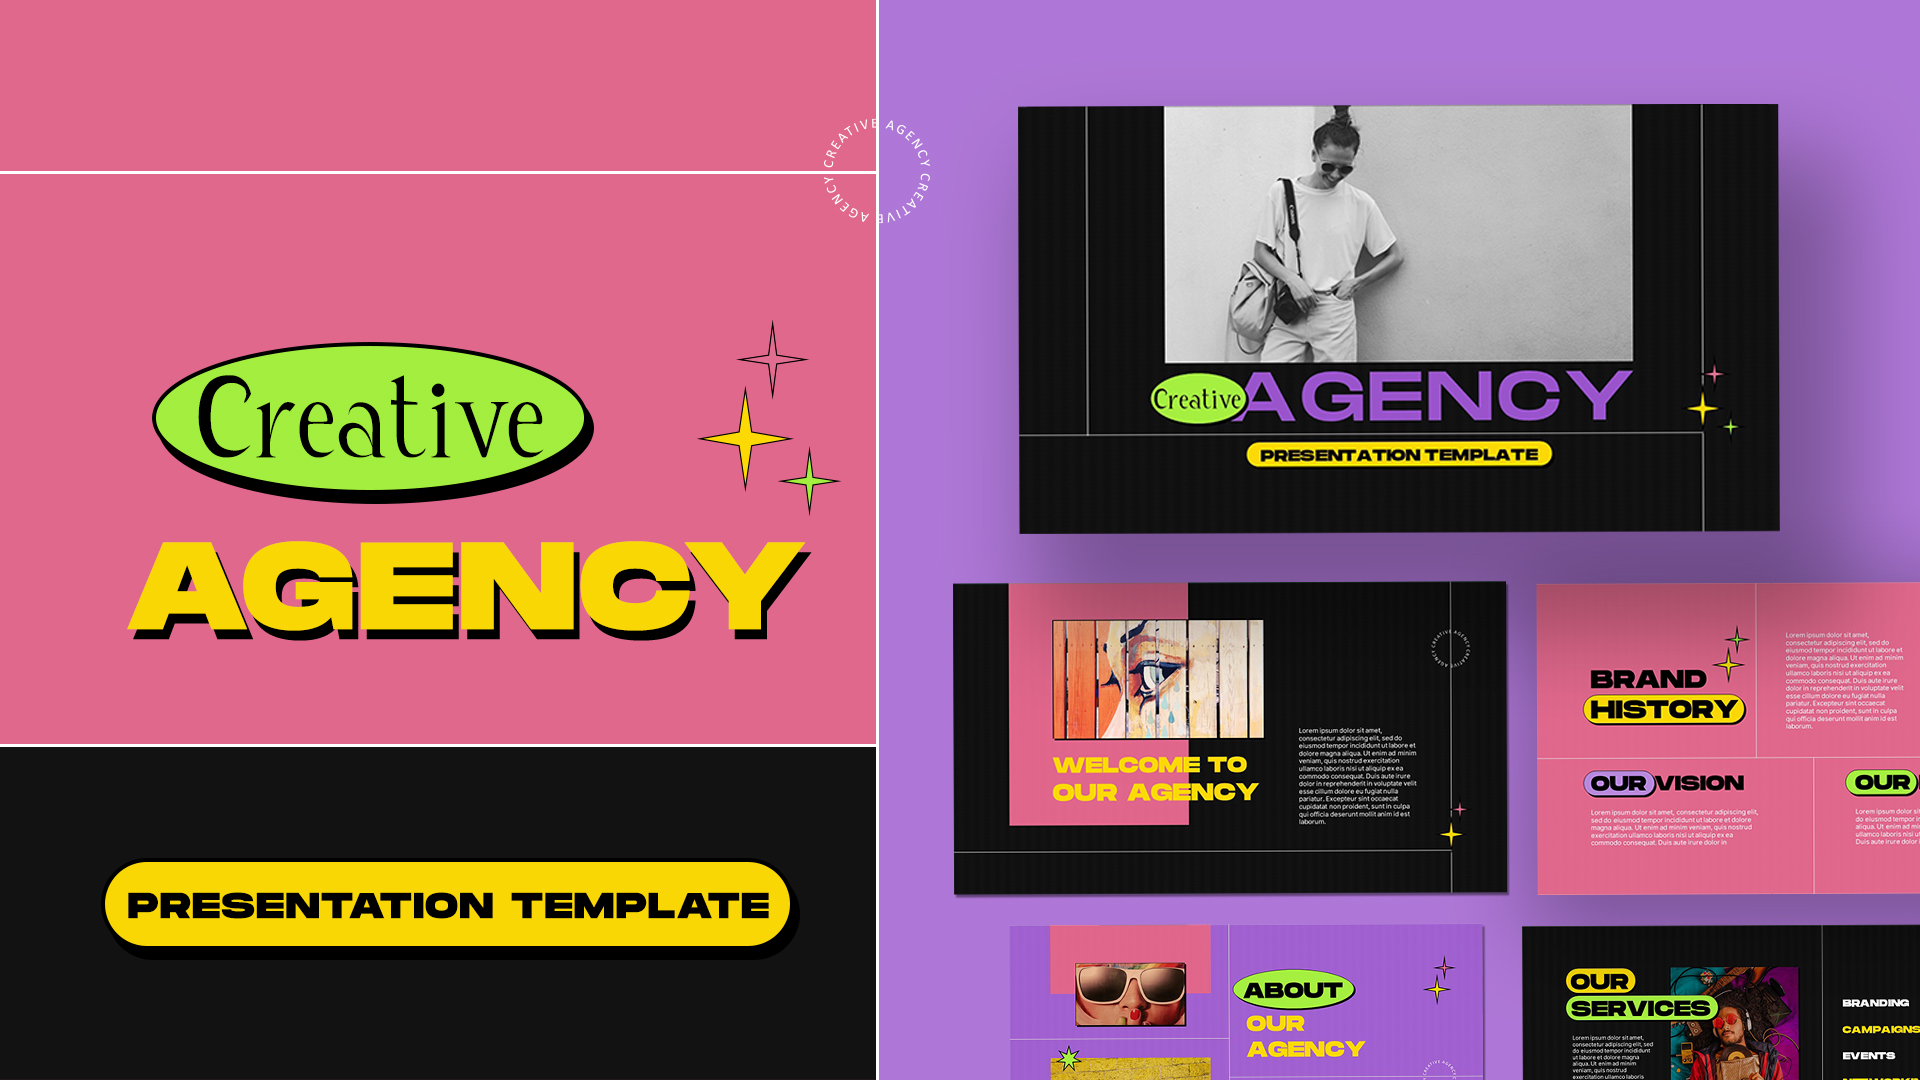
Creative Agency Visual Portfolio Template for PowerPoint & Google Slides
Company Profile
Modern Creative Business Pitch Deck Template for PowerPoint & Google Slides
Pitch Deck
Creative Books Theme Presentation Template for PowerPoint & Google Slides
Pitch Deck
Creative Power Analogy Metaphor Slide Template for PowerPoint & Google Slides
Leadership
Creative Doodle Transportation Theme Template for PowerPoint & Google Slides
Pitch Deck
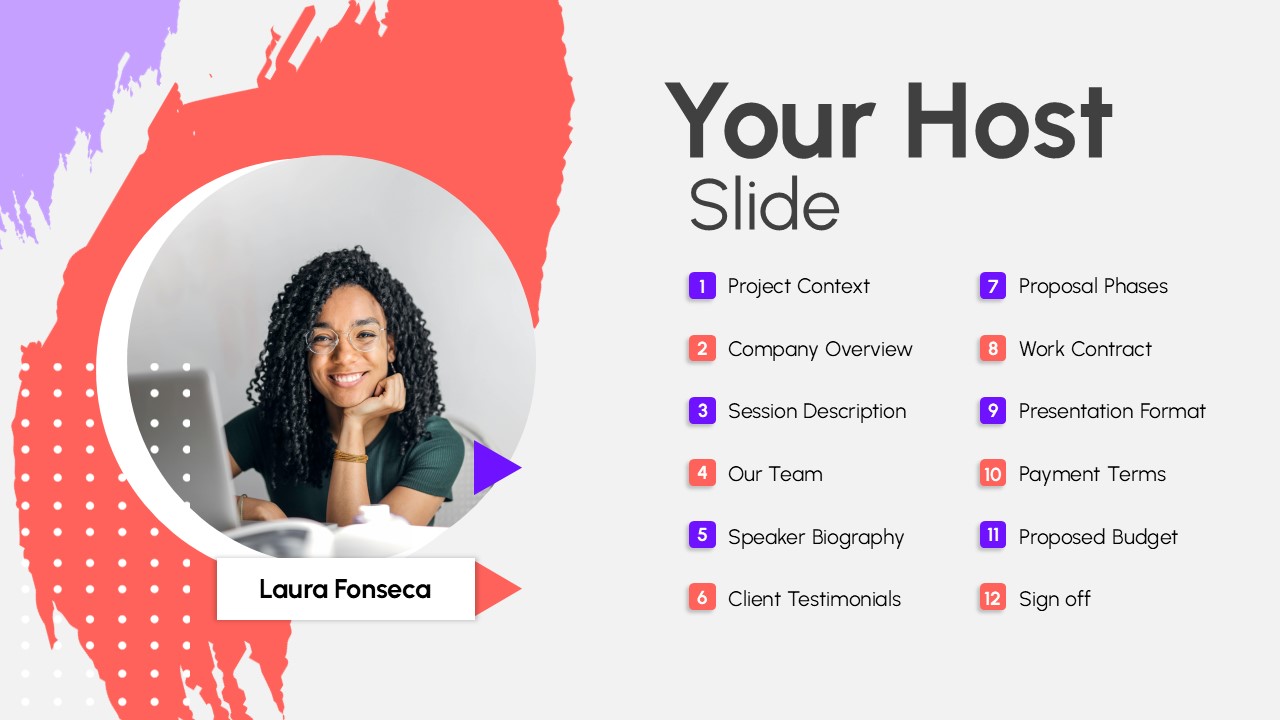
Creative Host Introduction Slide Template for PowerPoint & Google Slides
Our Team
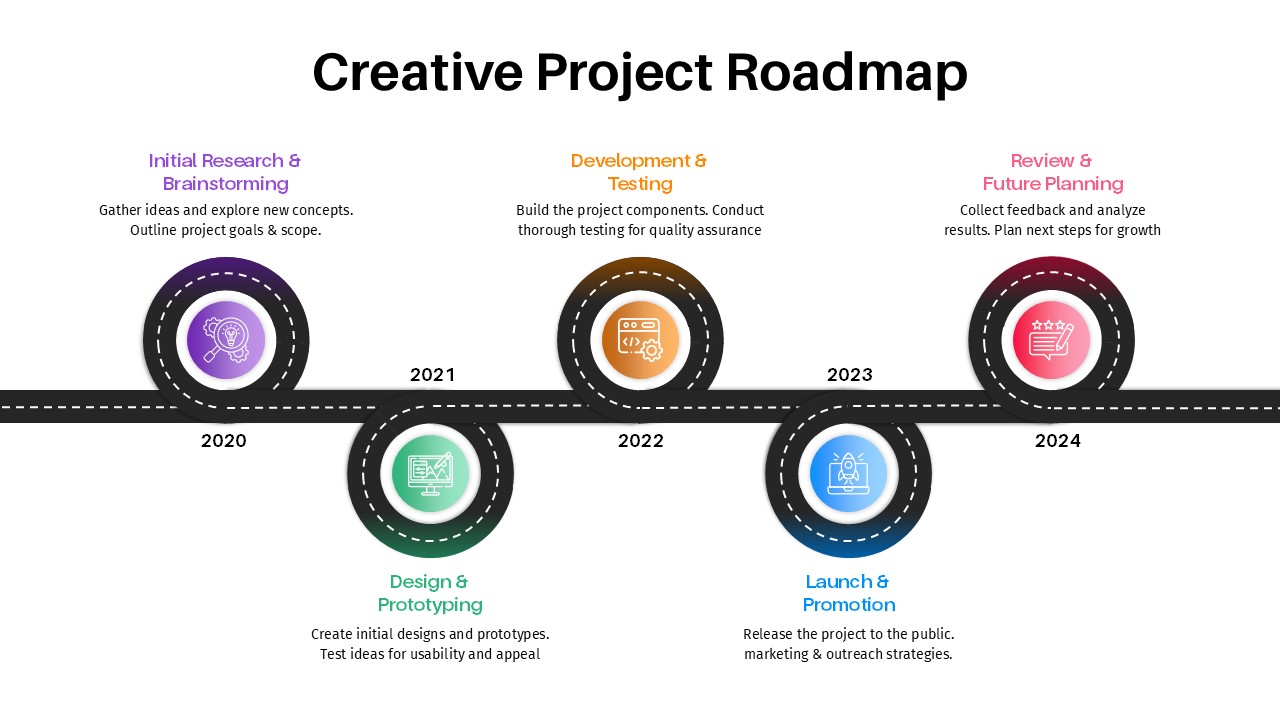
Creative Project Roadmap template for PowerPoint & Google Slides
Business
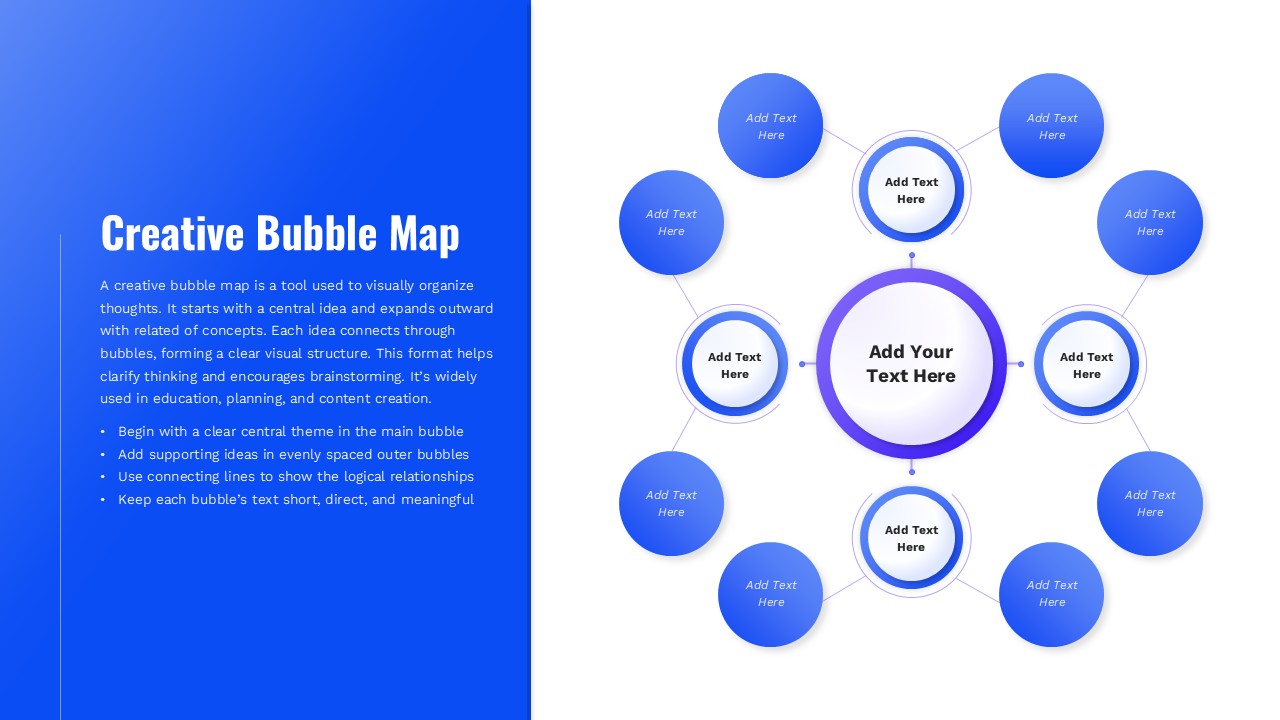
Creative Bubble Mind Map Template for PowerPoint & Google Slides
Mind Maps
Creative Table Template for PowerPoint & Google Slides
Table
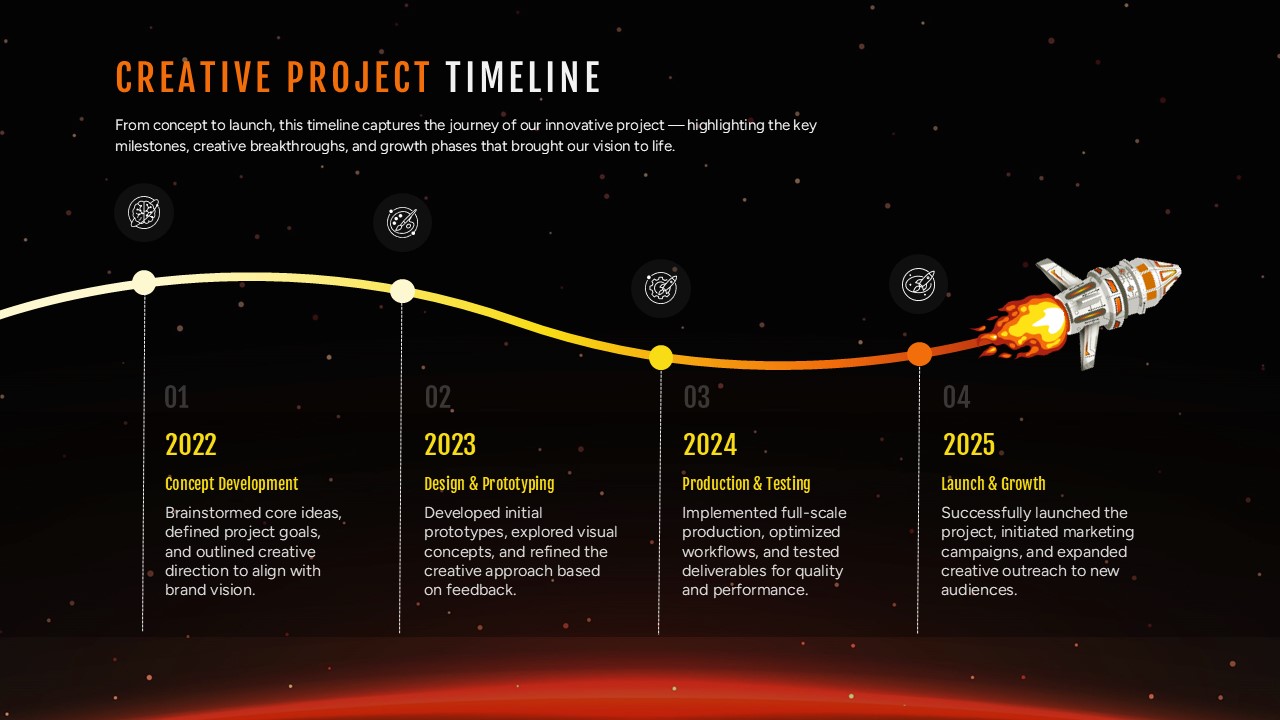
Creative Project Timeline Roadmap Template for PowerPoint & Google Slides
Timeline