Creative data chart analytics template for PowerPoint & Google Slides


Description
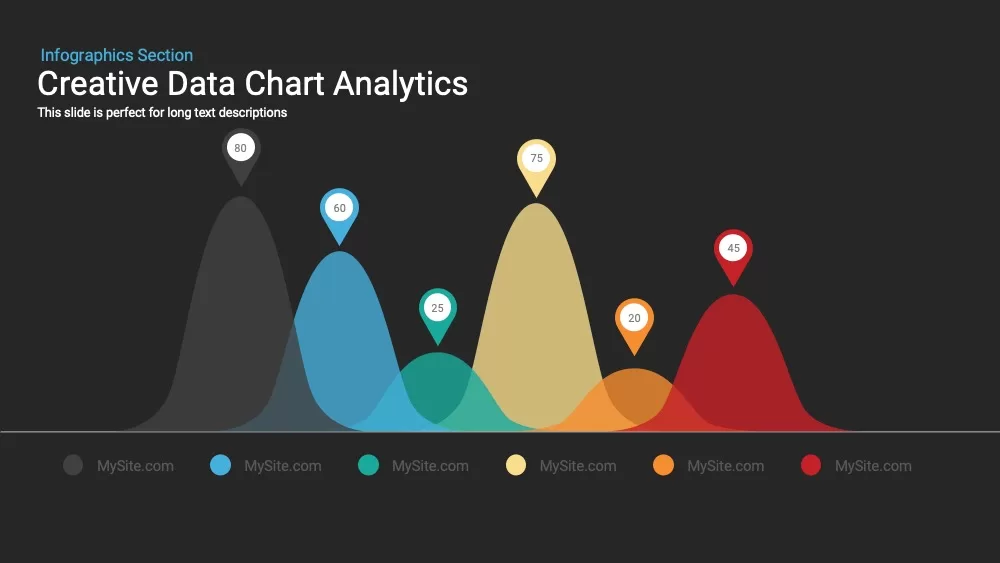
Present statistical insights with visual impact using this creative data chart analytics template. The slide features a colorful mountain-style data chart with six smooth peaks, each marked by a location pin and percentage value. The overlapping shapes create a layered gradient effect that adds depth without distracting from the numerical data. Beneath each chart peak, color-coded legends offer branding or data source labels. This visually engaging format is ideal for displaying comparative analytics, performance ranges, or audience segmentation. Whether you’re showcasing traffic metrics, survey results, or sales breakdowns, this modern infographic design adds clarity and professionalism to your report.
Who is it for
Perfect for data analysts, digital marketers, business consultants, startup founders, and educators who need to simplify complex datasets into engaging visuals. It’s especially useful for dashboard-style presentations, KPI reviews, or investor updates.
Other Uses
Easily customize the chart for market research reports, financial forecasting, campaign performance, or academic findings. Swap icons or tweak colors to align with your branding and use it as a quick data storytelling slide in broader decks.
Login to download this file

Item ID
SB00012
Related Templates

Data Analytics Dashboard Design template for PowerPoint & Google Slides
Bar/Column
Data Management and Analytics Diagram Template for PowerPoint & Google Slides
Circular

Free Data Analytics Dashboard Template for PowerPoint
Charts
Free

Product Usage Analytics Dashboard Chart Template for PowerPoint & Google Slides
Bar/Column

Dynamic Marketing Radar Chart Analytics Template for PowerPoint & Google Slides
Comparison
Creative Data Analysis Bar Chart template for PowerPoint & Google Slides
Bar/Column
Multi-Series Curved Line Graph Analytics Template for PowerPoint & Google Slides
Comparison Chart
E-commerce Analytics Dashboard Template for PowerPoint & Google Slides
Bar/Column
Business Dashboard Analytics & KPIs Template for PowerPoint & Google Slides
Bar/Column
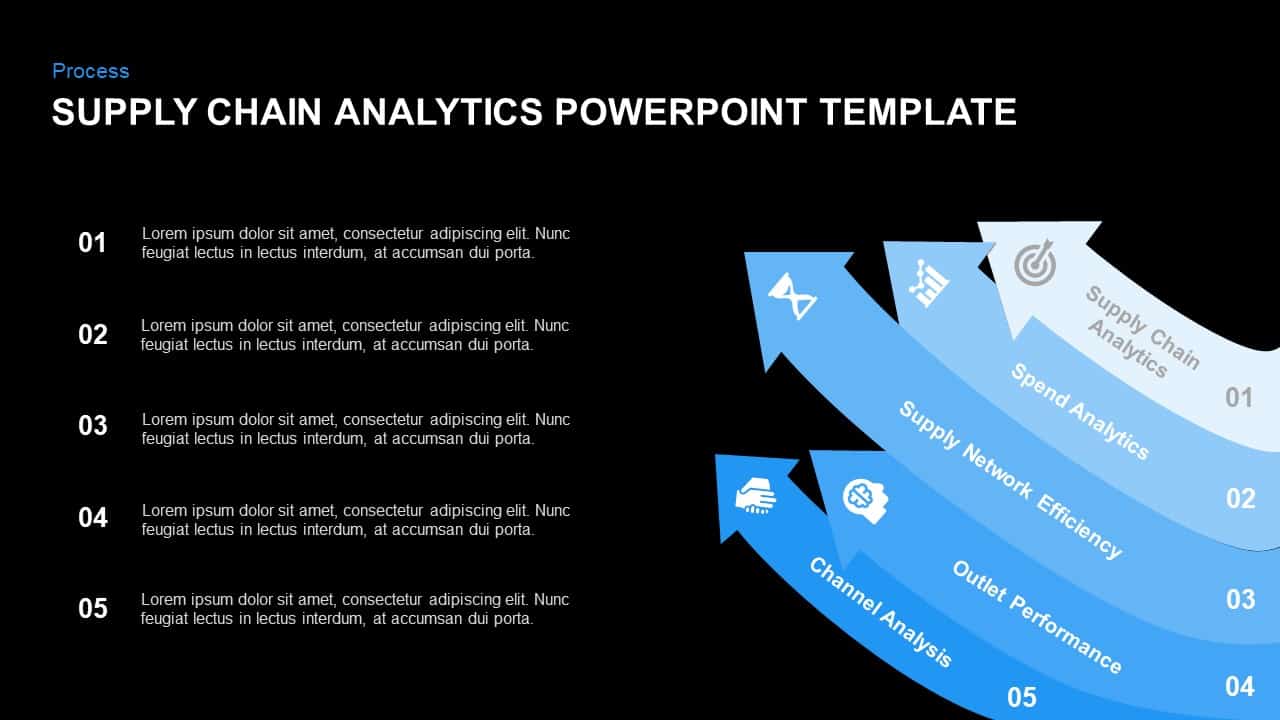
Supply Chain Analytics Process Template for PowerPoint & Google Slides
Process
Digital Marketing Analytics Presentation Template for PowerPoint & Google Slides
Digital Marketing
Social Media Analytics Dashboard Template for PowerPoint & Google Slides
Digital Marketing
Free TikTok Marketing Analytics Overview Template for PowerPoint & Google Slides
Company Profile
Free
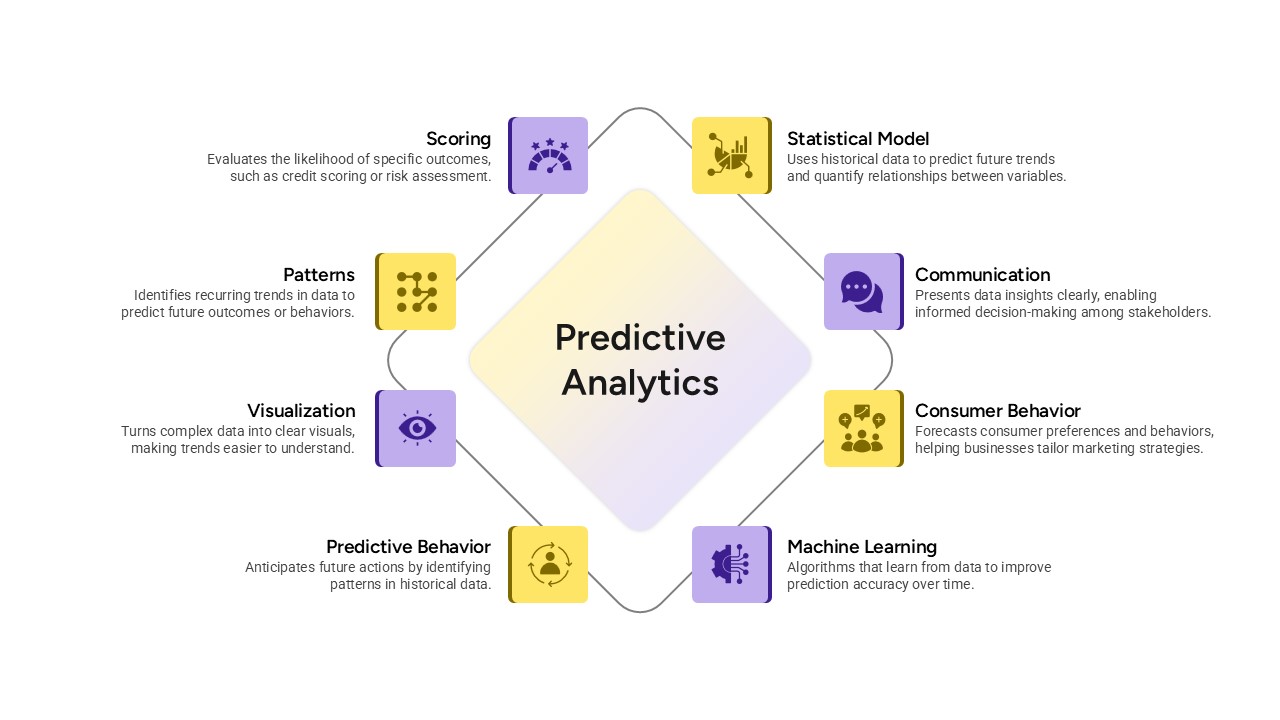
Predictive Analytics Diagram Template for PowerPoint & Google Slides
Process
Free Facebook Page Analytics Slide for PowerPoint & Google Slides
Customer Experience
Free
Creative Lab Beakers Data Infographic template for PowerPoint & Google Slides
Infographics
Mobile Data Analysis Chart template for PowerPoint & Google Slides
Charts
Circle Chart Data template for PowerPoint & Google Slides
Pie/Donut
3D Bar Chart Data Infographics Template for PowerPoint & Google Slides
Bar/Column
Pencil Bar Chart Data Analysis Template for PowerPoint & Google Slides
Bar/Column
3D Cone Chart Data Visualization template for PowerPoint & Google Slides
Bar/Column
Tornado Chart Data Comparison Slide Template for PowerPoint & Google Slides
Bar/Column
Donut Chart Data Breakdown template for PowerPoint & Google Slides
Pie/Donut
Waffle Chart Data Visualization Template for PowerPoint & Google Slides
Comparison Chart
Free Stacked Column Chart Data Visualization Template for PowerPoint & Google Slides
Bar/Column
Free
Simple Bar Chart Data Visualization Template for PowerPoint & Google Slides
Bar/Column
XY Bubble Chart Data Visualization Template for PowerPoint & Google Slides
Comparison Chart
Simple Area Chart Data Trends Analysis Template for PowerPoint & Google Slides
Comparison Chart
Data Over Time Line Chart template for PowerPoint & Google Slides
Charts
Waterfall Chart Data Visualization Template for PowerPoint & Google Slides
Comparison Chart
Multipurpose Spline Chart Data Trend Template for PowerPoint & Google Slides
Bar/Column
Interactive Jump Line Data Chart Template for PowerPoint & Google Slides
Comparison Chart
Segmented Scatter Chart Data Visualization Template for PowerPoint & Google Slides
Business Strategy
Data Analysis Bar Chart with Insights Template for PowerPoint & Google Slides
Bar/Column
Free
Bar Data Chart Slide for PowerPoint & Google Slides
Bar/Column
Weekly Data Chart Slide for PowerPoint & Google Slides
Comparison Chart

3D Column Chart with Data Table for PowerPoint & Google Slides
Bar/Column

Cone Data Chart for PowerPoint & Google Slides
Charts
Circle Strategy Creative Chart template for PowerPoint & Google Slides
Business Strategy
Creative SWOT Chart template for PowerPoint & Google Slides
SWOT
Creative Dynamic Gantt Chart Timeline Template for PowerPoint & Google Slides
Timeline
Creative Bar Chart template for PowerPoint & Google Slides
Charts
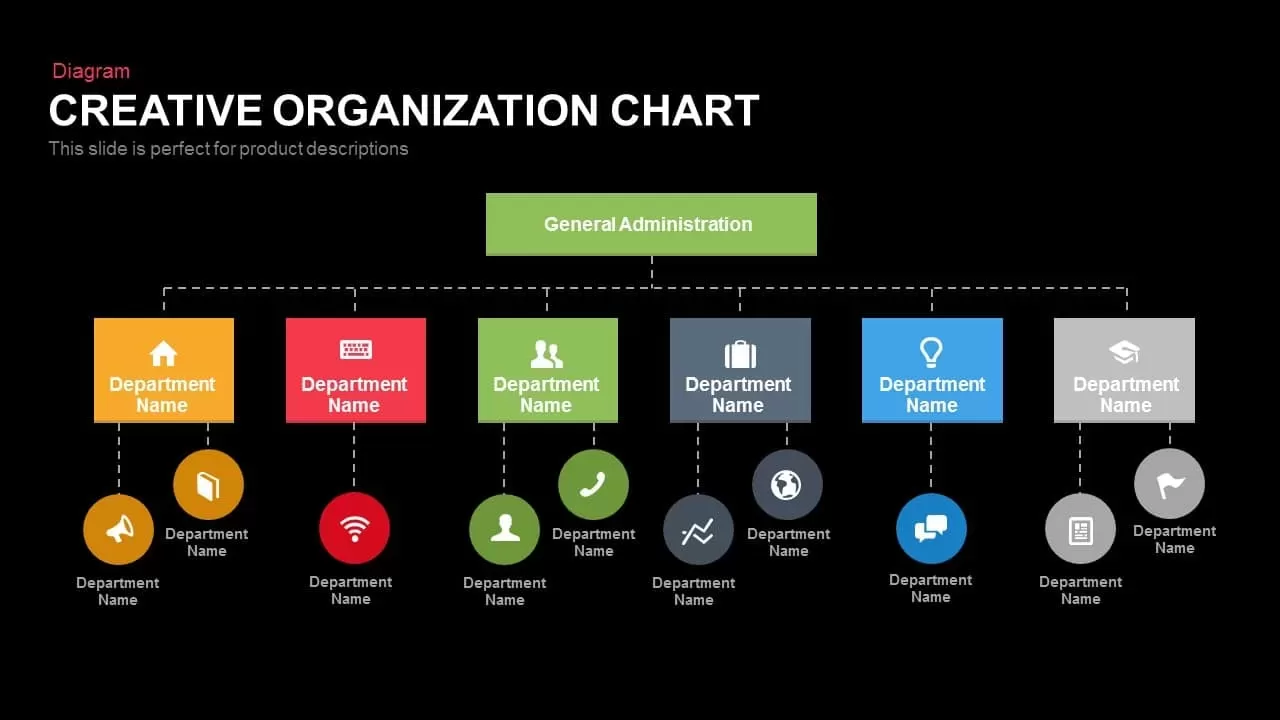
Creative Organization Chart Diagram Template for PowerPoint & Google Slides
Org Chart
Creative Organizational Chart Template for PowerPoint & Google Slides
Org Chart
Data-Driven Line Chart Diagram Template for PowerPoint
Comparison Chart
Clustered Column Chart Data Analysis Template for PowerPoint
Bar/Column
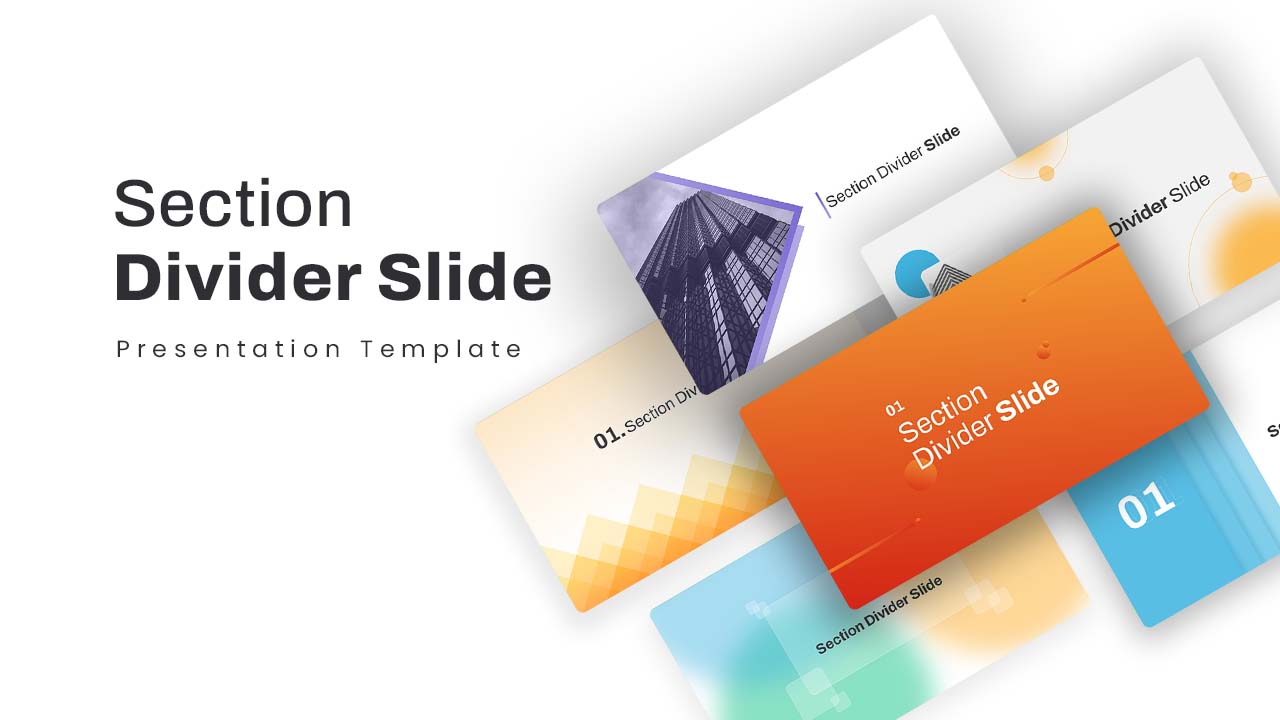
Creative Section Divider Slides Template for PowerPoint & Google Slides
Decks
Data Science PowerPoint Presentation Template for PowerPoint & Google Slides
Pitch Deck
Data Center PowerPoint Template for PowerPoint & Google Slides
Information Technology
World Map Data template for PowerPoint & Google Slides
World Maps

Smartphone Data User template for PowerPoint & Google Slides
Charts
Interactive US Population Data Map Slide Template for PowerPoint & Google Slides
World Maps
3D Stacked Infographic Layers Data Template for PowerPoint & Google Slides
Pyramid
Circle Graph Data Visualization Template for PowerPoint & Google Slides
Circular
Dynamic Data Dashboard Infographic Template for PowerPoint & Google Slides
Bar/Column
Gear Pie Diagram Data Visualization Template for PowerPoint & Google Slides
Pie/Donut
Data-Driven Marketing Cycle Diagram Template for PowerPoint & Google Slides
Customer Journey
Bottle Data Percentage Infographic Template for PowerPoint & Google Slides
Infographics
Immigration Data Dashboard Template for PowerPoint & Google Slides
Bar/Column
Leaf Infographic Data Visualization Template for PowerPoint & Google Slides
Infographics
Mobile Infographics Data Visualization Template for PowerPoint & Google Slides
Infographics
Data Migration Life Cycle Curved Diagram Template for PowerPoint & Google Slides
Process
Medical Infographics Data Visualization Template for PowerPoint & Google Slides
Health
DIKW Data to Wisdom Pyramid Model Template for PowerPoint & Google Slides
Pyramid
Data-driven GDP Growth Infographic Pack Template for PowerPoint & Google Slides
Infographics
KPI Dashboard Data Visualization Template for PowerPoint & Google Slides
Bar/Column
KPI Dashboard Data Overview Slide Template for PowerPoint & Google Slides
Bar/Column
North America Data Map Callouts Template for PowerPoint & Google Slides
World Maps
Professional Heatmap Data Visualization Template for PowerPoint & Google Slides
Infographics

Modern Big Data Infographic Deck Template for PowerPoint & Google Slides
Decks
Layered Data Governance Maturity Model Template for PowerPoint & Google Slides
Process
Editable Africa Map Infographic Data Template for PowerPoint & Google Slides
World Maps
UK Counties Map Data Visualization Template for PowerPoint & Google Slides
World Maps
Advanced Data Flow Diagram Pack Template for PowerPoint & Google Slides
Flow Charts
Free Big Data Network Visualization Template for PowerPoint & Google Slides
Circular
Free
Syria Regional Data Map Infographic Template for PowerPoint & Google Slides
World Maps
Data Lake Hub-and-Spoke Diagram Template for PowerPoint & Google Slides
Cloud Computing
ETL Data Pipeline Workflow Diagram Template for PowerPoint & Google Slides
Process
Data Privacy template for PowerPoint & Google Slides
Information Technology
Data Protection Strategies template for PowerPoint & Google Slides
Information Technology
Comprehensive Data & AI Capability Model Template for PowerPoint & Google Slides
AI
Data Flywheel Strategy template for PowerPoint & Google Slides
Business
Data Privacy and Compliance in ML template for PowerPoint & Google Slides
Technology
Data-Driven AI in Insurance Infographic Template for PowerPoint & Google Slides
Circular
AI and Data Ecosystem Map Template for PowerPoint & Google Slides
AI
Data Studio Insights template for PowerPoint & Google Slides
Business Report
Data Protection & Encryption in the Cloud Overview template for PowerPoint & Google Slides
Cloud Computing
Customer Data Platform Workflow Diagram Template for PowerPoint & Google Slides
Information Technology
Data-Driven Marketing Lifecycle Diagram Template for PowerPoint & Google Slides
Process
Data-Driven Decision Making overview template for PowerPoint & Google Slides
Business
First Party Data Overview Template for PowerPoint & Google Slides
Business
Data Governance Roles Pyramid Diagram Template for PowerPoint & Google Slides
Pyramid
Business Data Table Template for PowerPoint & Google Slides
Table
Colorful Business Data Comparison Table Template for PowerPoint & Google Slides
Table
Six Column Data Table Template for PowerPoint & Google Slides
Table
Data Gap Analysis Template for PowerPoint & Google Slides
Business
Data-Driven Sales Strategy Diagram Template for PowerPoint & Google Slides
Marketing
Mobile User Data Analysis Infographic for PowerPoint & Google Slides
Process
4 Business Data Infographics Diagram for PowerPoint & Google Slides
Process
Creative Studio PowerPoint Template for PowerPoint & Google Slides
Decks