Comparison Chart Presentation Templates for PowerPoint and Google Slides
Showcase differences, similarities, or performance metrics side-by-side with our Comparison Chart Presentation Templates for PowerPoint and Google Slides. These templates help you present comparisons in a visually structured way, making it easier for your audience to evaluate options, features, data points, or business performance. Whether you’re pitching products, analyzing competitors, or summarizing key statistics, comparison chart slides ensure clarity and visual impact.
All templates are fully editable and work across both Microsoft PowerPoint (PPT) and Google Slides, offering design flexibility for professionals, educators, marketers, and consultants.
![]() Filter
Filter
Filter
-

Product Feature Comparison Table Template for PowerPoint & Google Slides
Comparison Chart
-

Free Versatile Product Comparison Chart Template for PowerPoint & Google Slides
Charts
Free
-

Comparison Pricing Table Infographic Template for PowerPoint & Google Slides
Comparison Chart
-
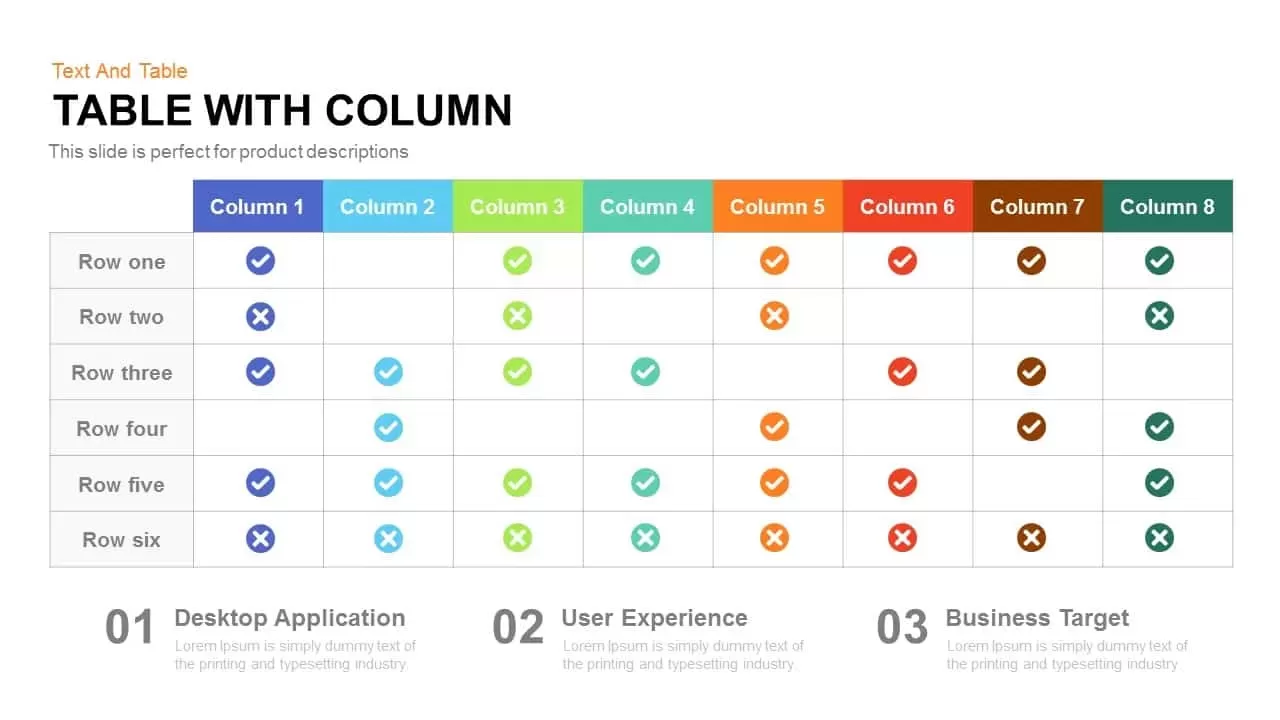
Table with Columns template for PowerPoint & Google Slides
Comparison Chart
-

Business Timeline Comparison Bar Chart Template for PowerPoint & Google Slides
Comparison Chart
-

Vendor Comparison Analysis template for PowerPoint & Google Slides
Comparison Chart
-

Comparison Donut Chart PowerPoint Template and Keynote
Pie/Donut
-

Four-Tier Pricing Comparison Table Template for PowerPoint & Google Slides
Comparison
-

Circular Product Comparison Chart Template for PowerPoint & Google Slides
Comparison Chart
-
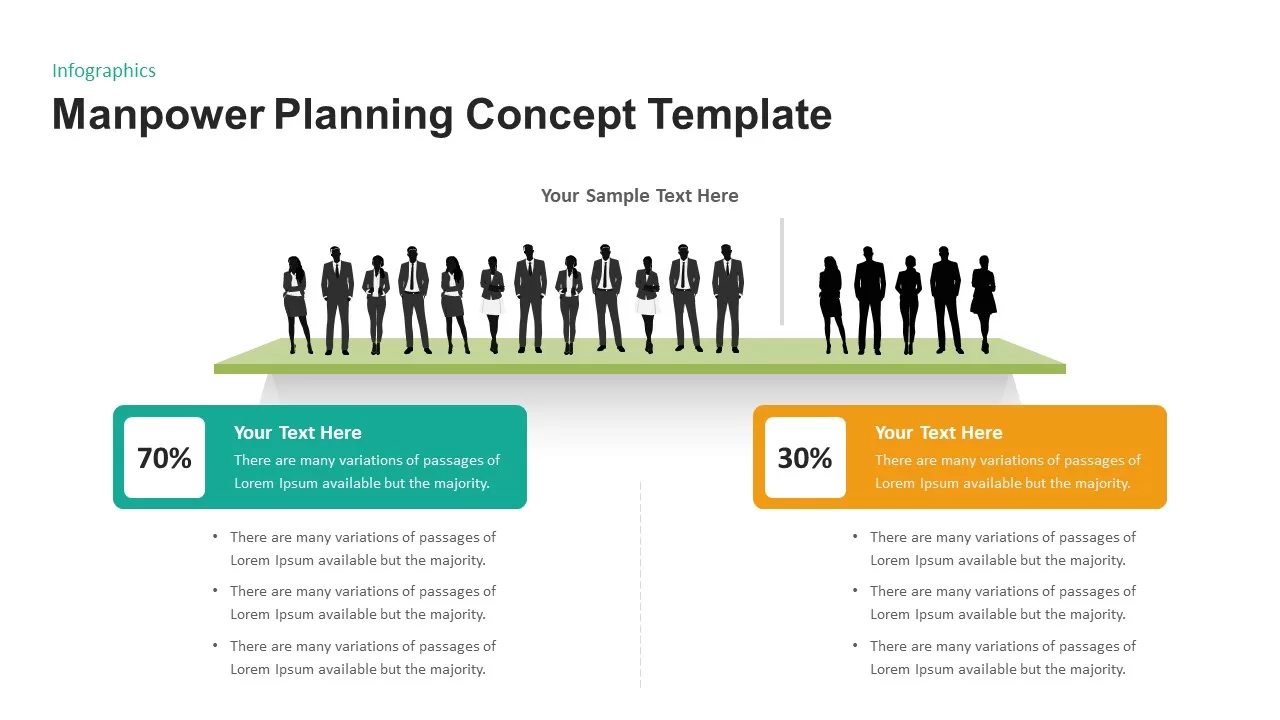
Manpower Planning Concept Comparison Template for PowerPoint & Google Slides
Comparison Chart
-

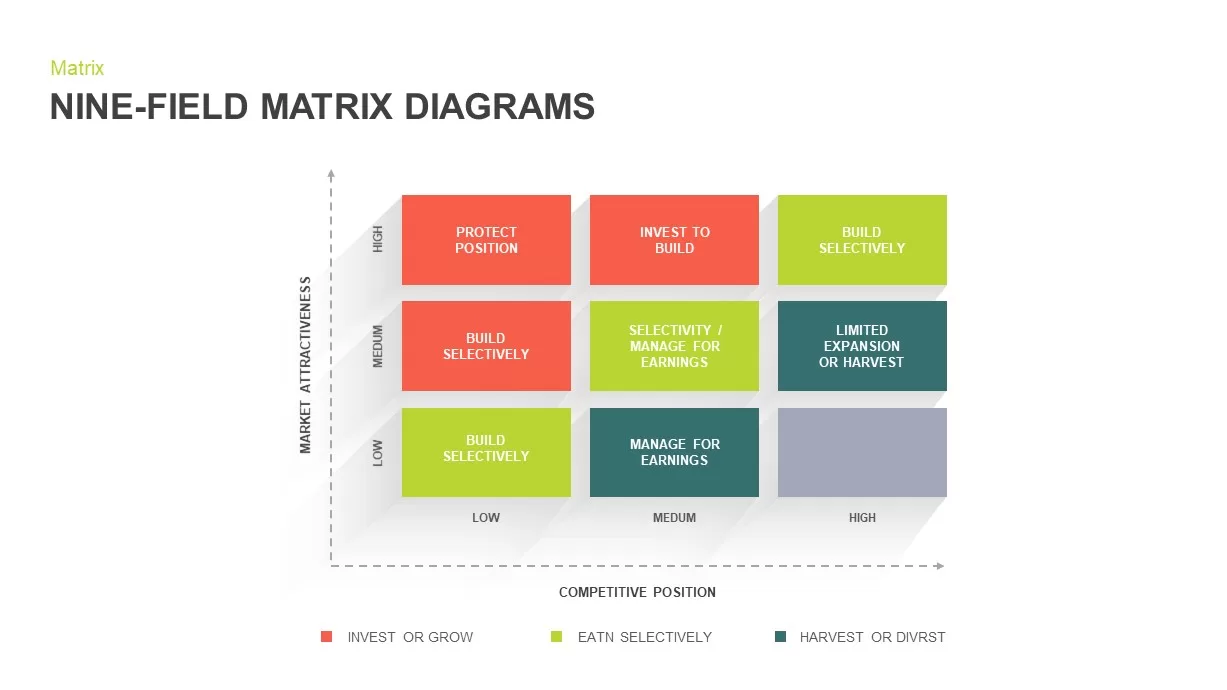
Nine-Field Matrix Diagrams Collection Template for PowerPoint & Google Slides
Comparison Chart
-

Capital Structure Dynamic Split Chart Template for PowerPoint & Google Slides
Comparison Chart
-
Eisenhower Matrix Task Prioritization Template for PowerPoint & Google Slides
Comparison Chart
-
Risk Management Heat Map Diagram Template for PowerPoint & Google Slides
Comparison Chart
-
Comparison Chart Overview template for PowerPoint & Google Slides
Comparison Chart
-

Pros & Cons Arrow Diagram template for PowerPoint & Google Slides
Comparison Chart
-
Data Analytics Dashboard Design template for PowerPoint & Google Slides
Bar/Column
-
Social Media Metrics template for PowerPoint & Google Slides
Comparison Chart
-
Marketing Strategy Arrow Infographic Template for PowerPoint & Google Slides
Comparison
-
Market Development Matrix Chart Template for PowerPoint & Google Slides
Comparison Chart
-
Speedometer Infographic Gauge Comparison Template for PowerPoint & Google Slides
Comparison
-
Blank Comparison Chart Template for PowerPoint & Google Slides
Comparison Chart
-
Year-over-Year Performance Comparison Template for PowerPoint & Google Slides
Comparison Chart
-
Materiality Assessment Matrix Diagram Template for PowerPoint & Google Slides
Risk Management
-

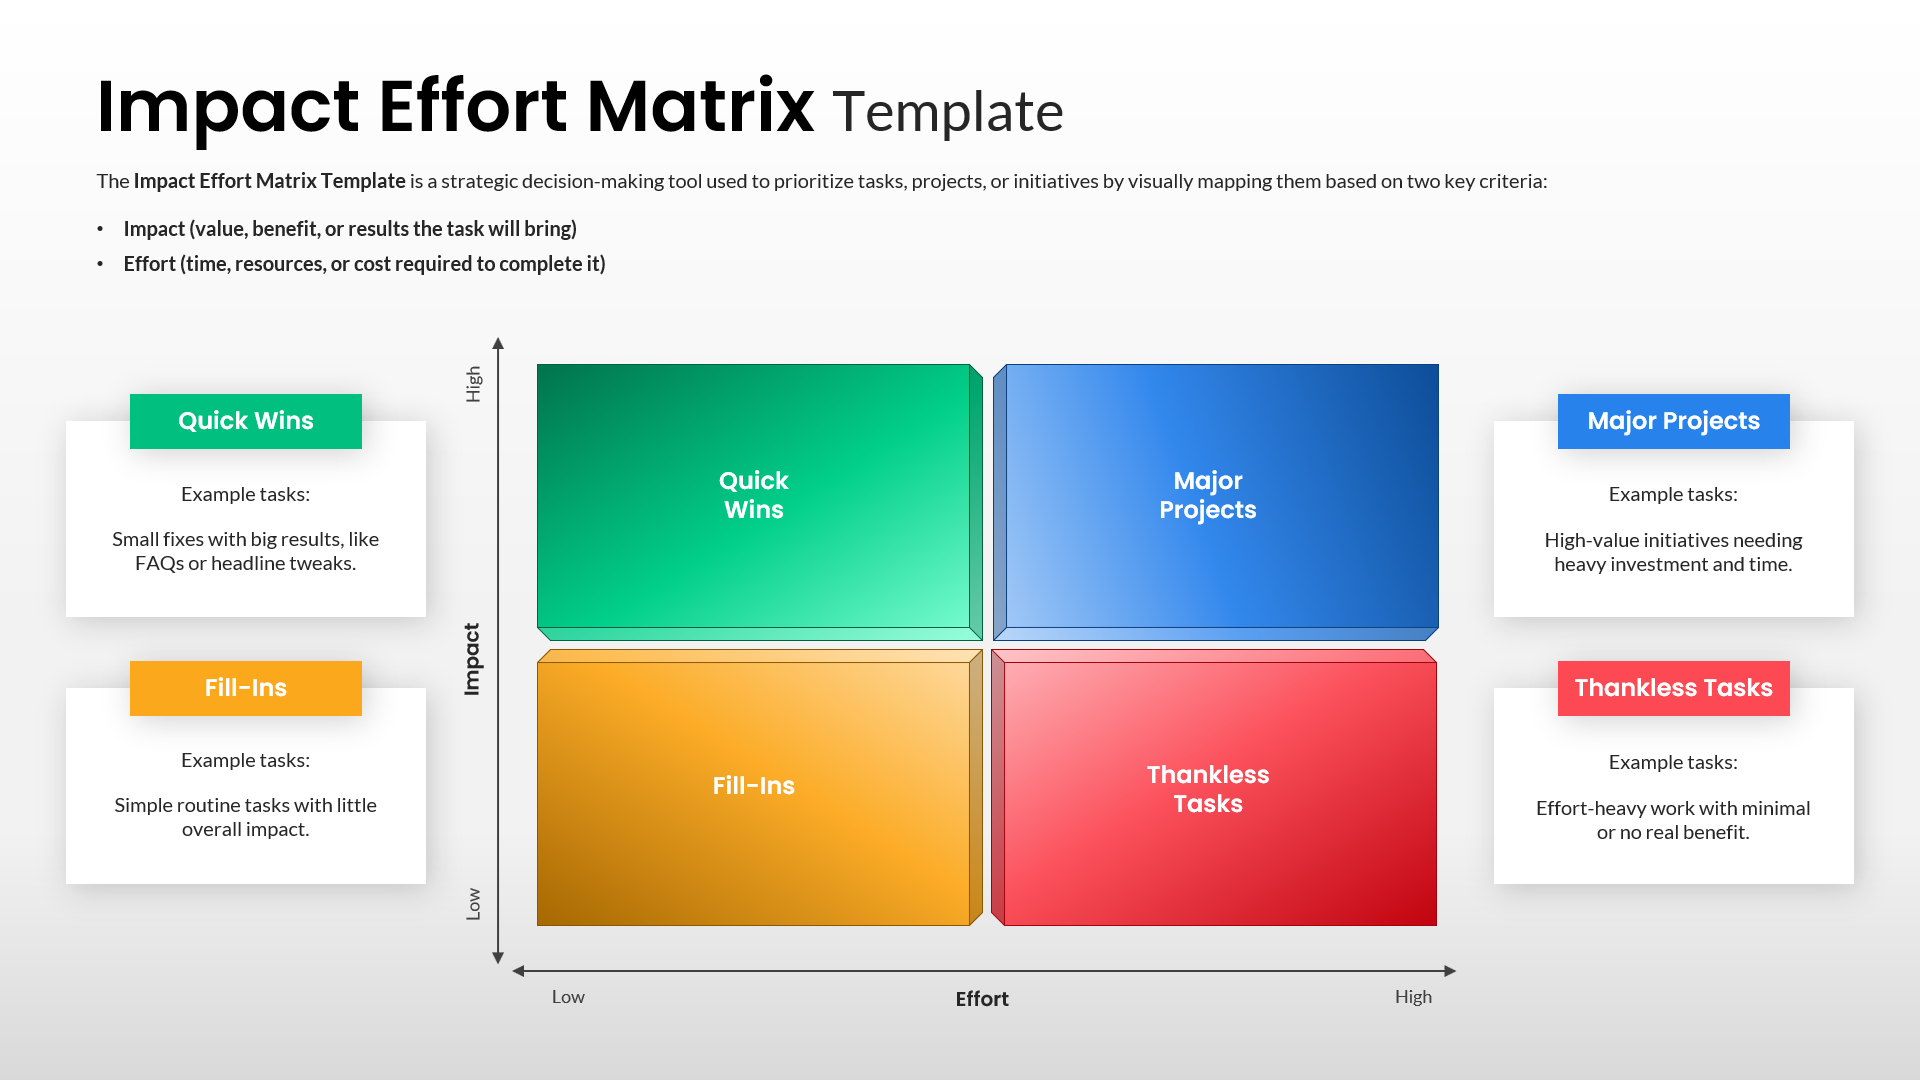
Impact Effort Matrix Template for PowerPoint & Google Slides
Comparison Chart
-
Six Column Data Table Template for PowerPoint & Google Slides
Table
-
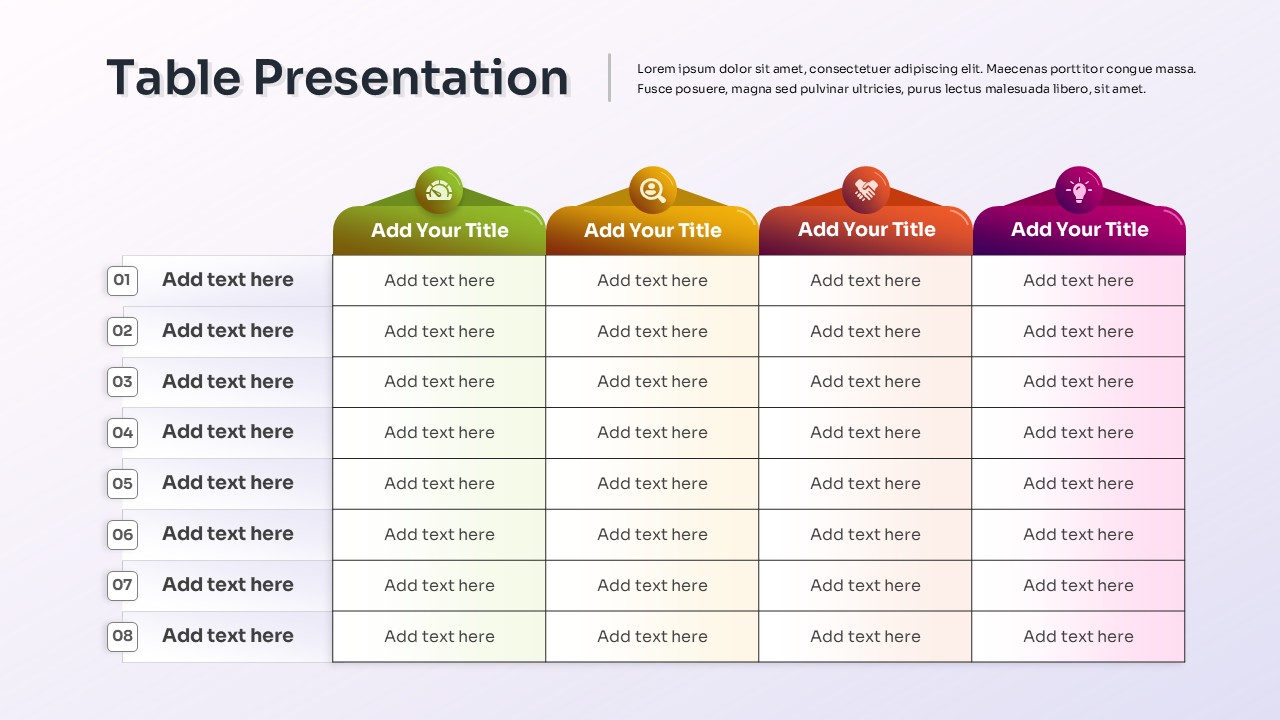
Colorful Table Presentation Template for PowerPoint & Google Slides
Table
-
Pros and Cons Comparison Table Template for PowerPoint & Google Slides
Comparison Chart
-
Quarterly Comparison Pie Chart Template for PowerPoint & Google Slides
Pie/Donut
-
Five Column Comparison Table Layout Template for PowerPoint & Google Slides
Comparison
-
Colorful Four-Column Table Layout Template for PowerPoint & Google Slides
Table
-
Colorful Business Data Comparison Table Template for PowerPoint & Google Slides
Table
-
Cohort Analysis Retention Dashboard Template for PowerPoint & Google Slides
Comparison Chart
-
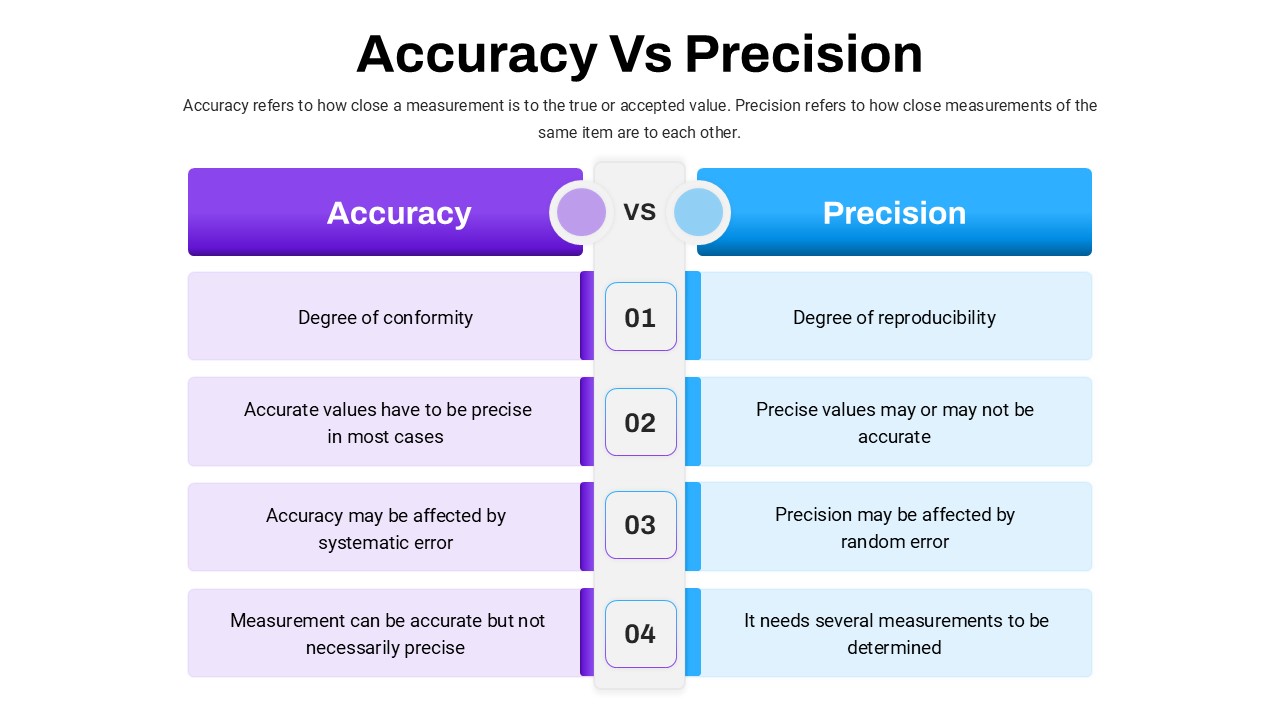
Accuracy Vs Precision Comparison Template for PowerPoint & Google Slides
Comparison Chart
-
Virtualization Architecture Comparison Template for PowerPoint & Google Slides
Comparison Chart