


Comparison Chart Presentation Templates for PowerPoint and Google Slides
Showcase differences, similarities, or performance metrics side-by-side with our Comparison Chart Presentation Templates for PowerPoint and Google Slides. These templates help you present comparisons in a visually structured way, making it easier for your audience to evaluate options, features, data points, or business performance. Whether you’re pitching products, analyzing competitors, or summarizing key statistics, comparison chart slides ensure clarity and visual impact.
All templates are fully editable and work across both Microsoft PowerPoint (PPT) and Google Slides, offering design flexibility for professionals, educators, marketers, and consultants.
![]() Filter
Filter
Filter
-

Feasibility Matrix Comparison Chart Template for PowerPoint & Google Slides
Comparison Chart
Premium
-
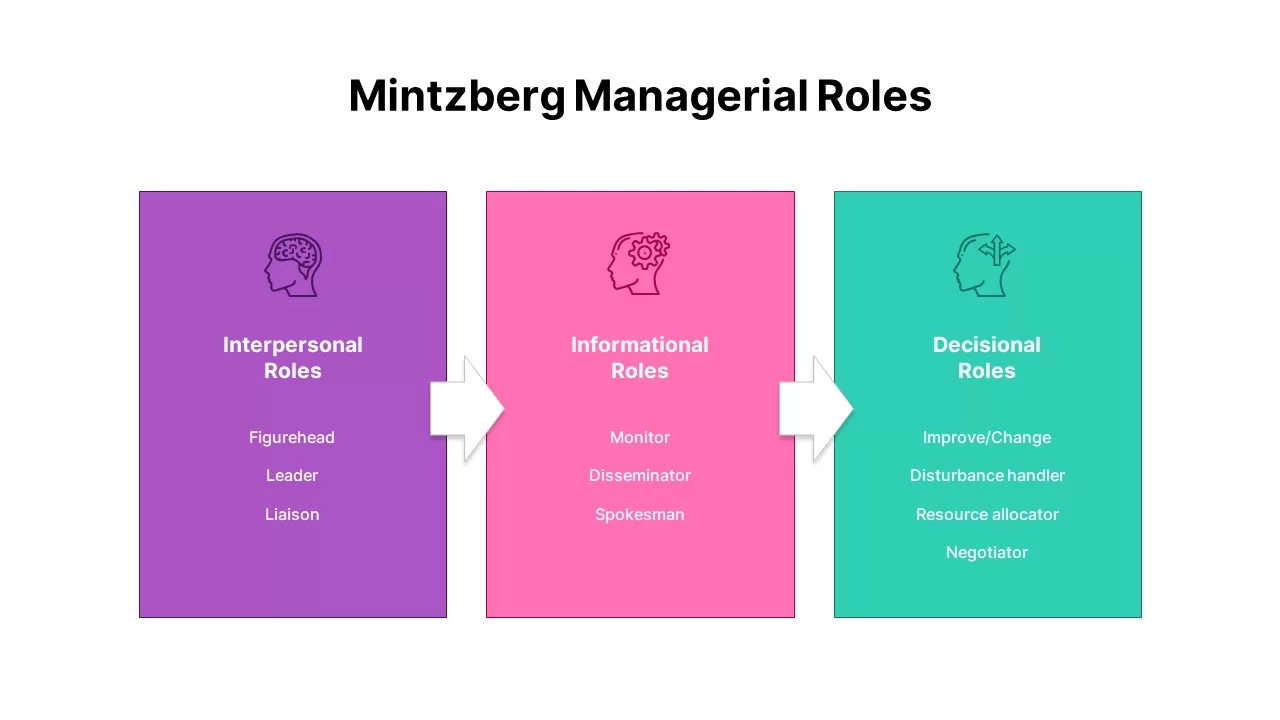
Mintzberg Managerial Roles Infographic Template for PowerPoint & Google Slides
Comparison Chart
Premium
-

Risk Management Heat Map Diagram Template for PowerPoint & Google Slides
Comparison Chart
Premium
-

Weekly Data Chart Slide for PowerPoint & Google Slides
Comparison Chart
Premium