


Comparison Chart Presentation Templates for PowerPoint and Google Slides
Showcase differences, similarities, or performance metrics side-by-side with our Comparison Chart Presentation Templates for PowerPoint and Google Slides. These templates help you present comparisons in a visually structured way, making it easier for your audience to evaluate options, features, data points, or business performance. Whether you’re pitching products, analyzing competitors, or summarizing key statistics, comparison chart slides ensure clarity and visual impact.
All templates are fully editable and work across both Microsoft PowerPoint (PPT) and Google Slides, offering design flexibility for professionals, educators, marketers, and consultants.
![]() Filter
Filter
Filter
-
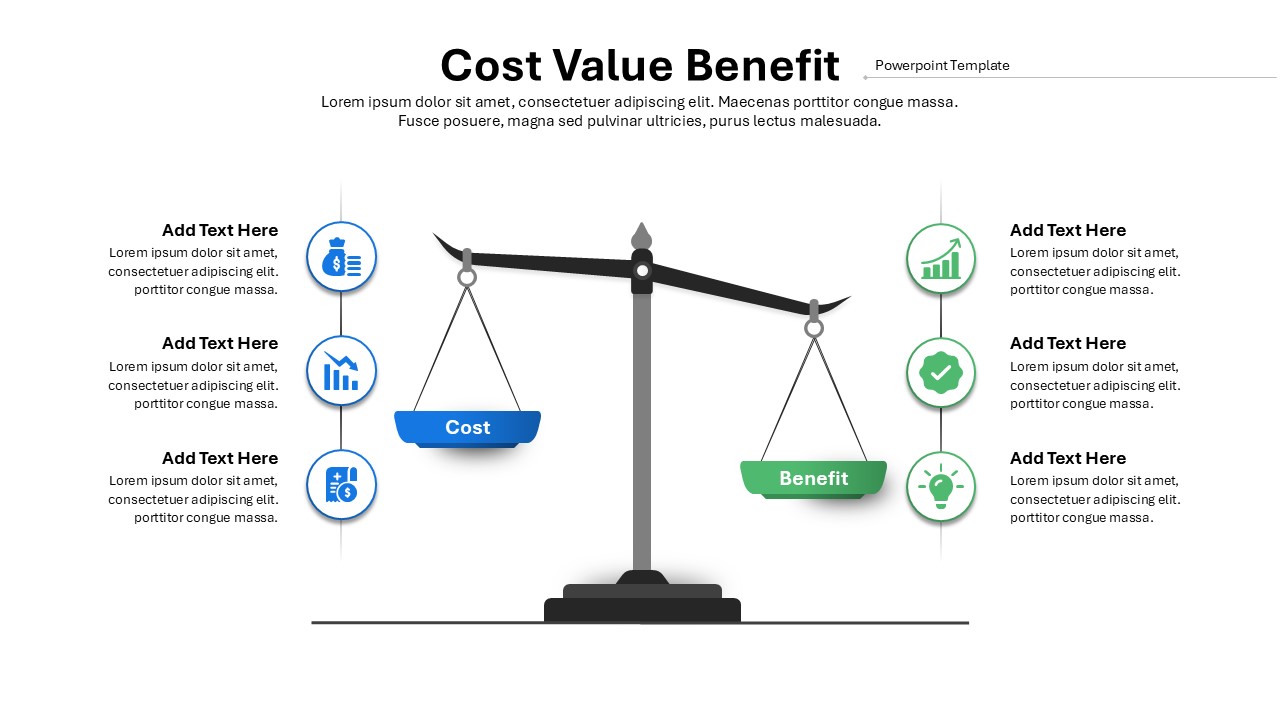
Cost vs Benefit template for PowerPoint & Google Slides
Charts
Premium
-
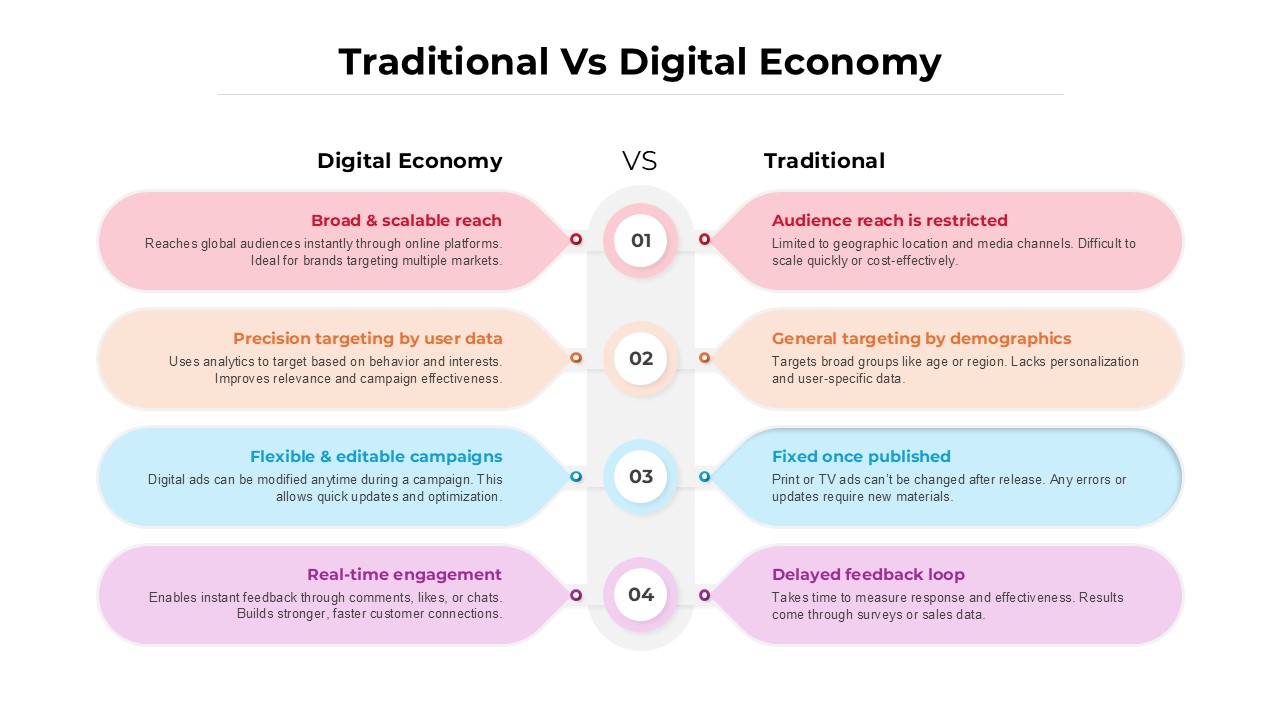
Traditional vs Digital Economy Template for PowerPoint & Google Slides
Comparison
Premium
-

Market Share Comparison Diagram Template for PowerPoint & Google Slides
Comparison Chart
Premium
-

Cost-Volume-Profit Analysis Diagram Template for PowerPoint & Google Slides
Finance
Premium
-
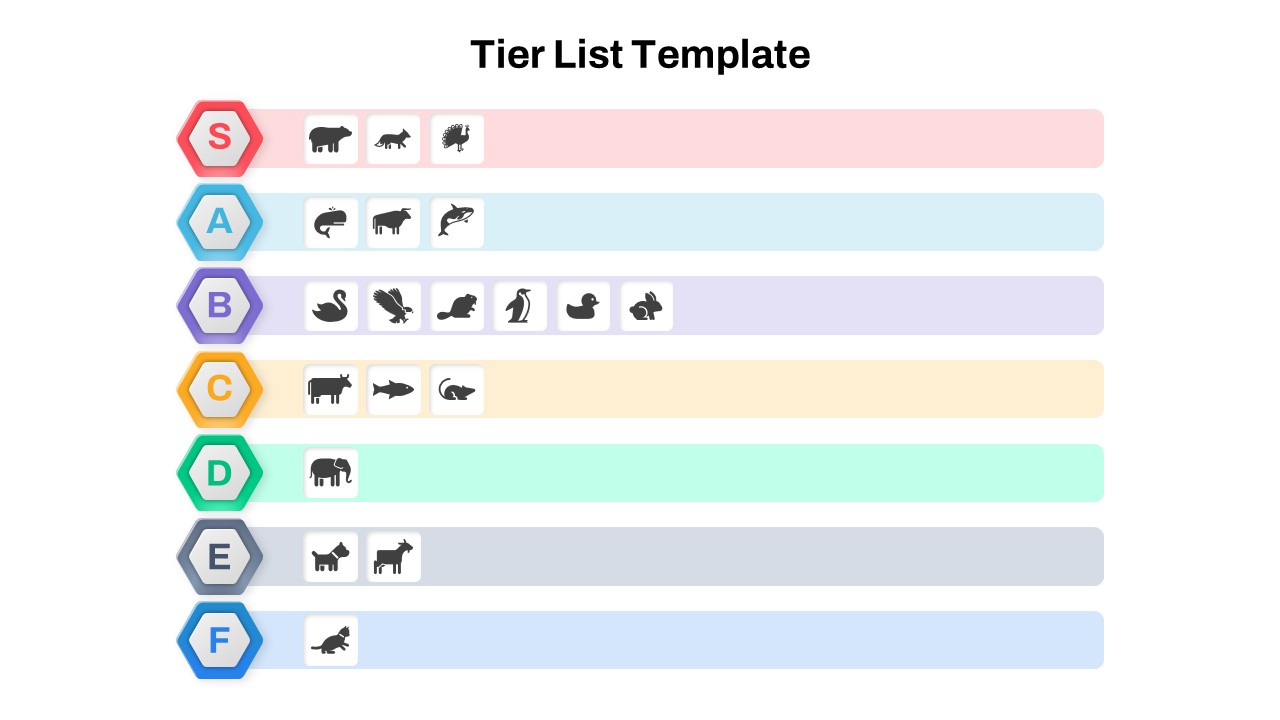
Modern Tier List Template for PowerPoint & Google Slides
Comparison
Premium
-

Free Versatile Product Comparison Chart Template for PowerPoint & Google Slides
Comparison Chart
Free
-

Freight Logistics Dashboard Infographic Template for PowerPoint & Google Slides
Comparison Chart
Premium
-
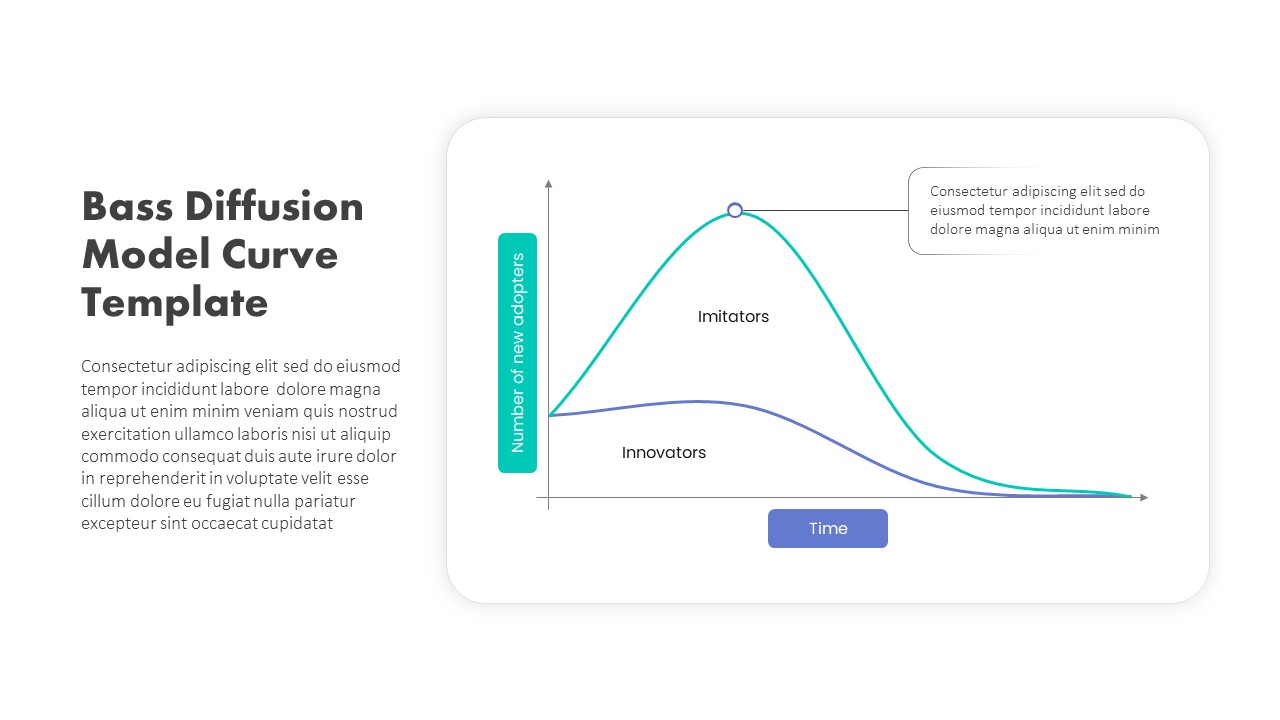
Bass Diffusion Model Curve for Adoption Template for PowerPoint & Google Slides
Comparison Chart
Premium
-
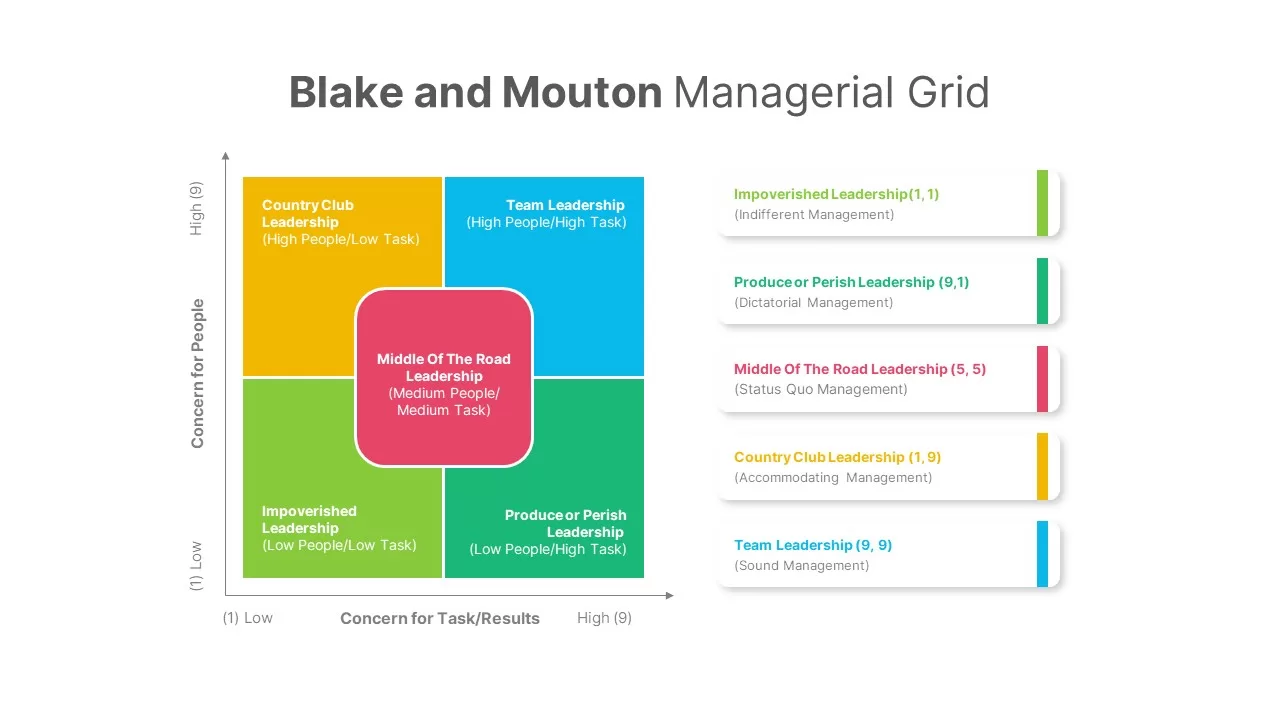
Free Blake and Mouton Leadership Grid Template for PowerPoint & Google Slides
Comparison Chart
Free
-

Data Analytics Dashboard Design template for PowerPoint & Google Slides
Bar/Column
Premium
-

Speedometer Infographic Gauge Comparison Template for PowerPoint & Google Slides
Comparison
Premium
-
Market Development Matrix Chart Template for PowerPoint & Google Slides
Comparison Chart
Premium
-
Multi-Series Curved Line Graph Analytics Template for PowerPoint & Google Slides
Comparison Chart
Premium


