Circle Abstract Shape Infographics Template for PowerPoint & Google Slides


Description
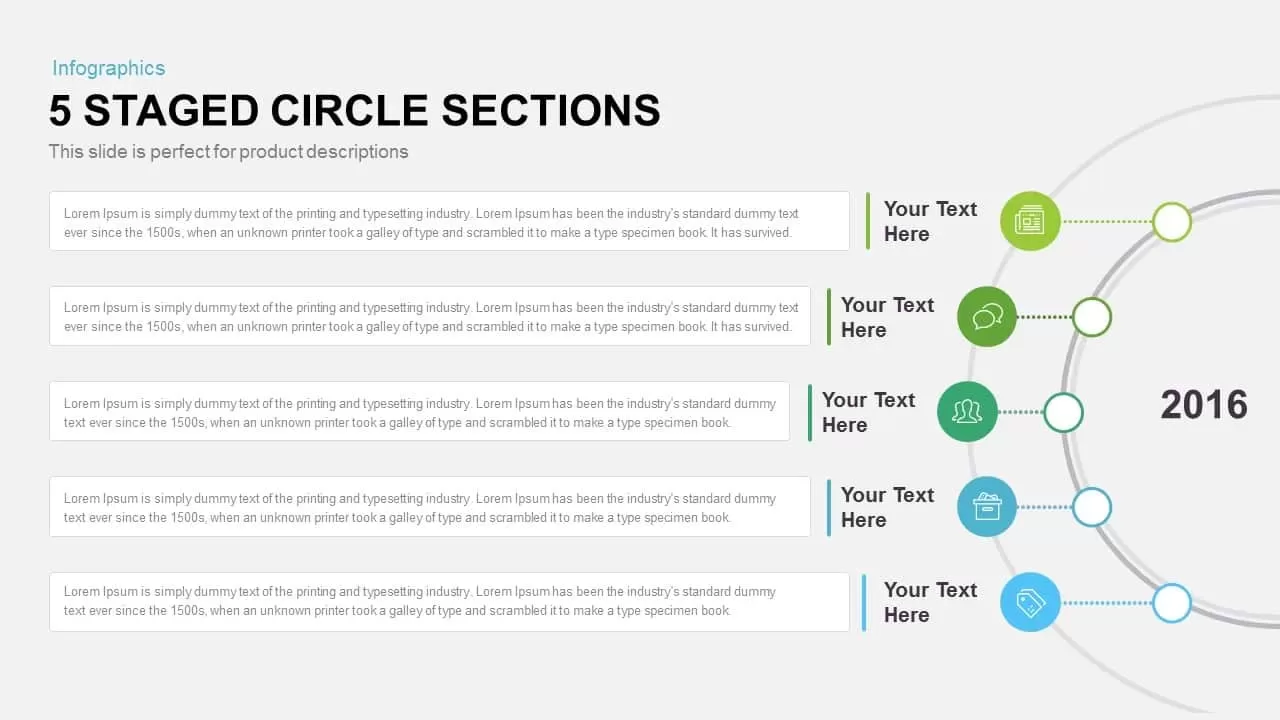
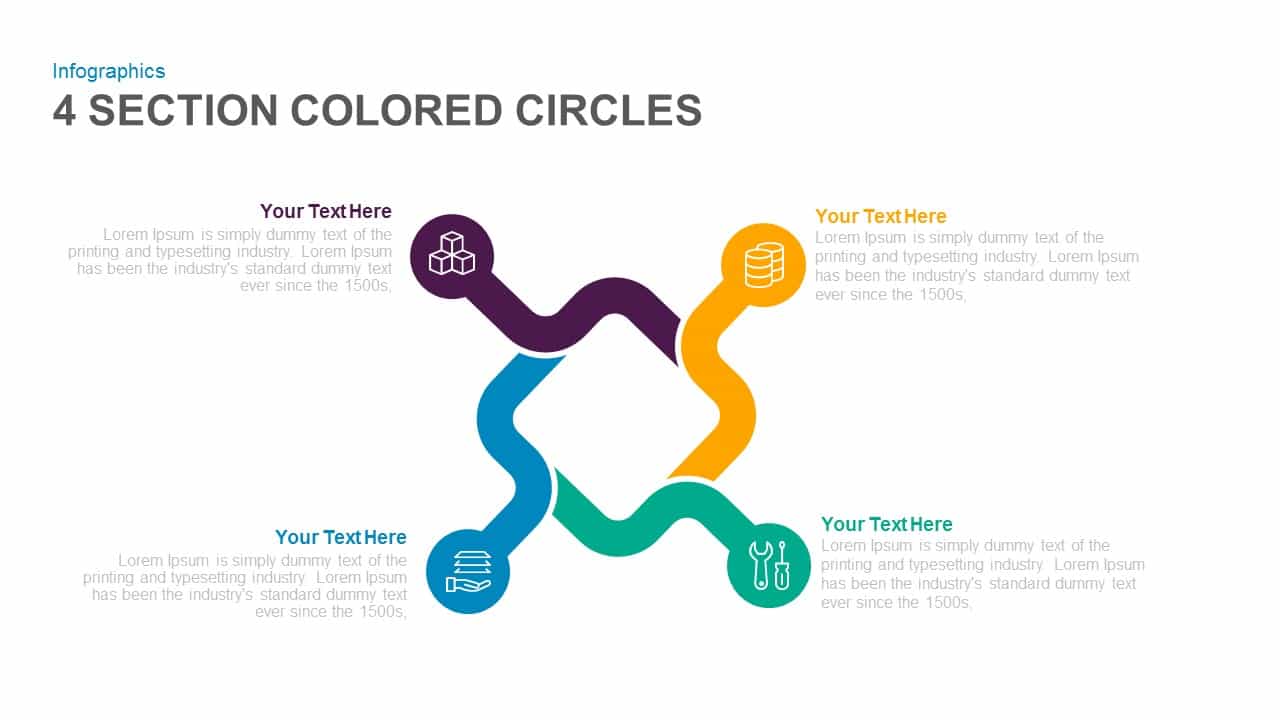
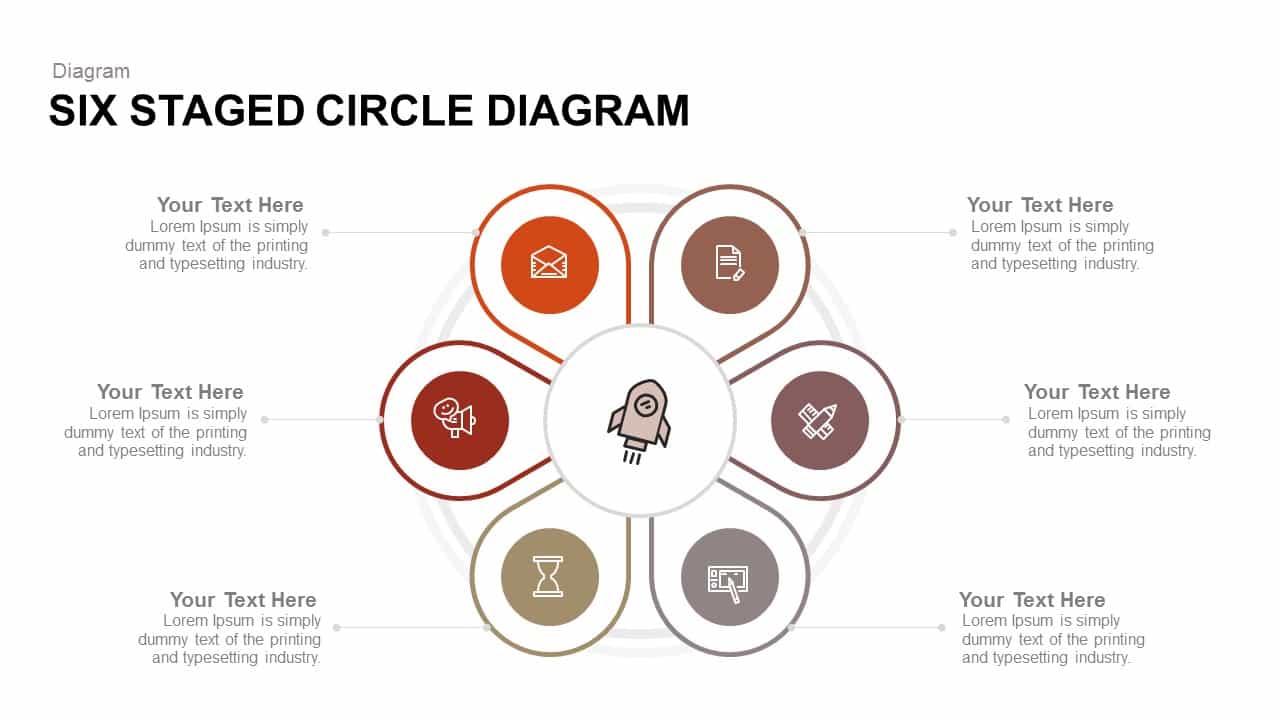
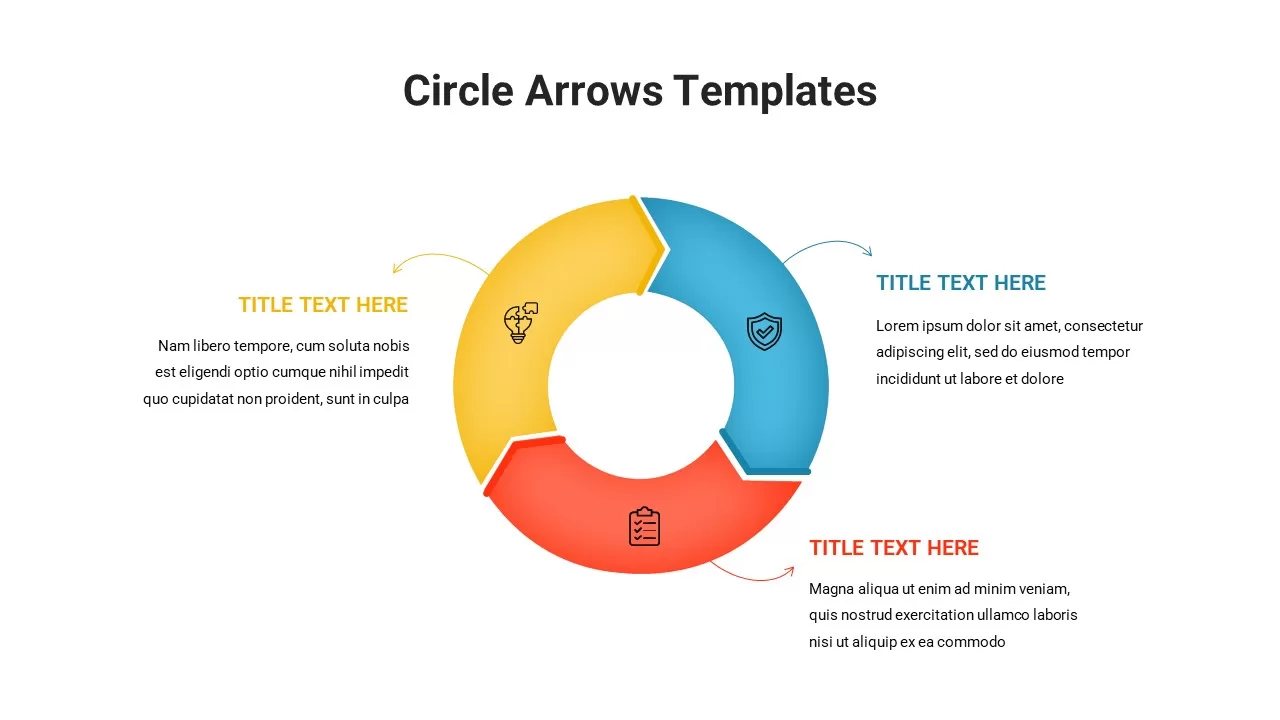
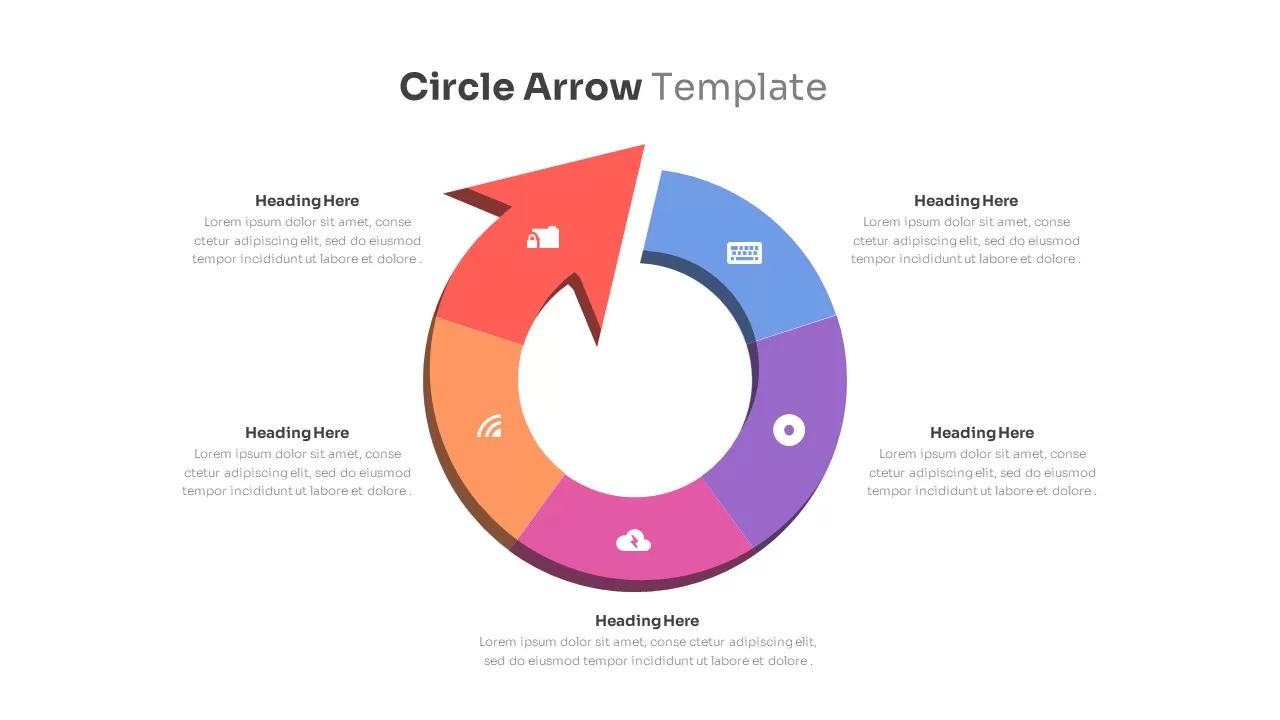
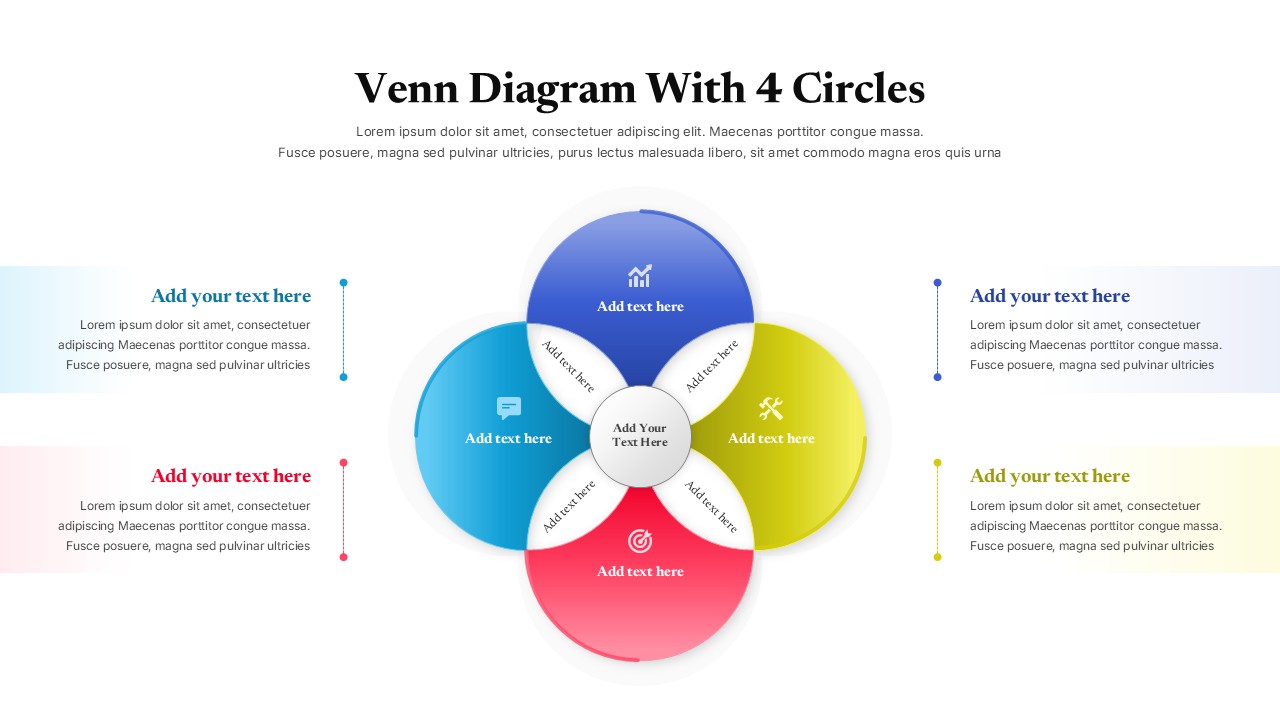
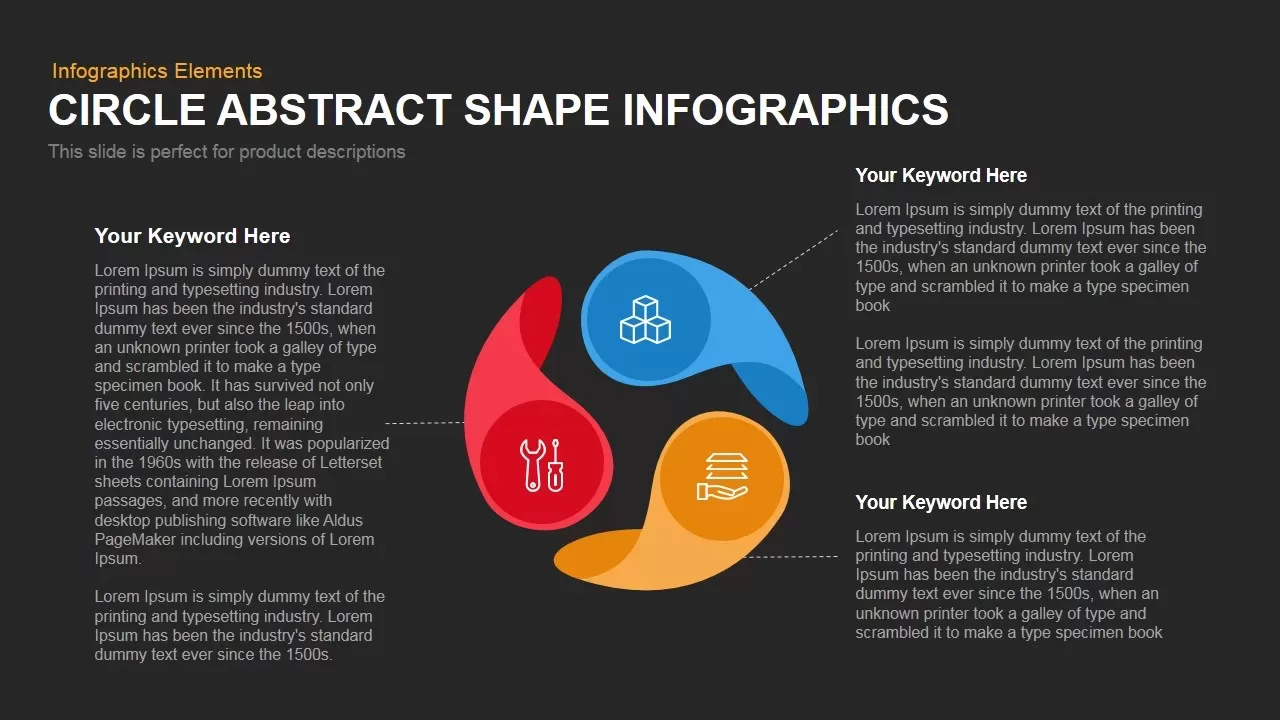
Leverage this versatile circle infographic slide to illustrate processes, categories, or product features in a single, cohesive diagram. At the center, four abstract curved segments form a 360° loop—each rendered in a bold green, blue, orange, or red palette with subtle 3D bevel edges and drop shadows for enhanced depth. Dotted guide lines extend from each segment to surrounding text placeholders positioned along the slide margins, creating clear visual associations between labels and their corresponding graphic elements. Every segment supports a customizable icon placeholder, headline, and descriptive text area for concise point summaries or detailed explanations.
Designed on fully editable master slides, this template provides vector-based shapes, icons, and connector dots that can be recolored, resized, or rearranged to suit any branding guideline. Use alignment and distribution tools to add or remove segments, adjust segment angles, or reposition callouts without disrupting the underlying layout. Swap placeholder icons with your own symbols, update headlines with actionable keywords, and format body text to highlight key metrics or insights. The clean white backdrop and professional sans-serif typography ensure crisp legibility, even when presenting complex information.
Optimized for both PowerPoint and Google Slides, the slide preserves formatting integrity across file formats and screen resolutions. Take advantage of built-in theme controls for one-click color scheme updates, and apply entrance animations to reveal each segment sequentially—guiding audience focus through every step of your narrative. This circle abstract shape infographic is ideally suited for product roadmaps, strategic frameworks, lifecycle analyses, and any presentation requiring a circular visualization of multi-step processes. Integrate it into broader decks to maintain cohesive design language and streamline slide creation with consistent master layouts.
Who is it for
Project managers, product strategists, and marketing teams will use this slide to break down complex processes, feature comparisons, or customer journeys. Consultants and trainers can adapt it for workshop activities, methodology overviews, or educational modules.
Other Uses
Repurpose this layout for lifecycle management, innovation cycles, or resource allocation plans. Replace icons and labels to visualize supply chain stages, quality assurance protocols, or stakeholder engagement frameworks.
Login to download this file

Item ID
SB00104
Related Templates

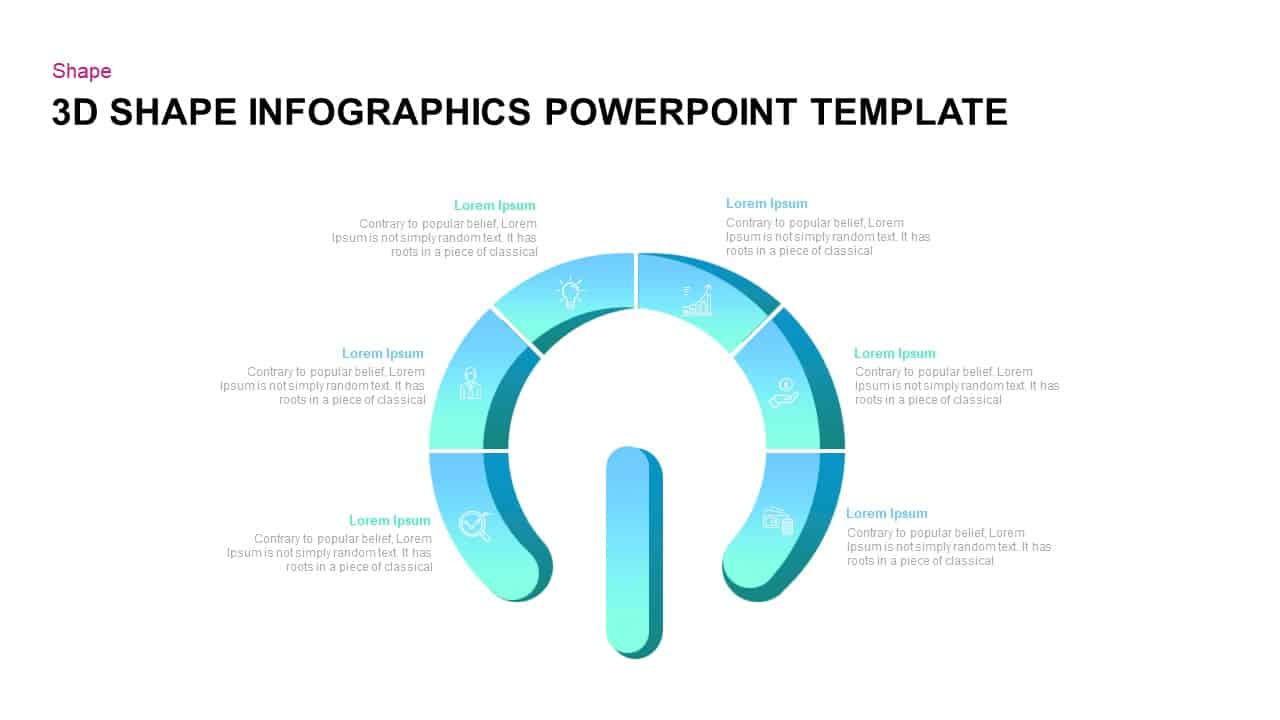
Versatile 3D Modular Shape Infographics Template for PowerPoint & Google Slides
Infographics
Stopwatch Shape Infographics for PowerPoint & Google Slides
Process
Pentagon Shape 5 Arrows Pointing Out template for PowerPoint & Google Slides
Arrow
3D Shape Linear Process Flow Diagram Template for PowerPoint & Google Slides
Process
Editable Four-Section 3D Shape Diagram Template for PowerPoint & Google Slides
Comparison
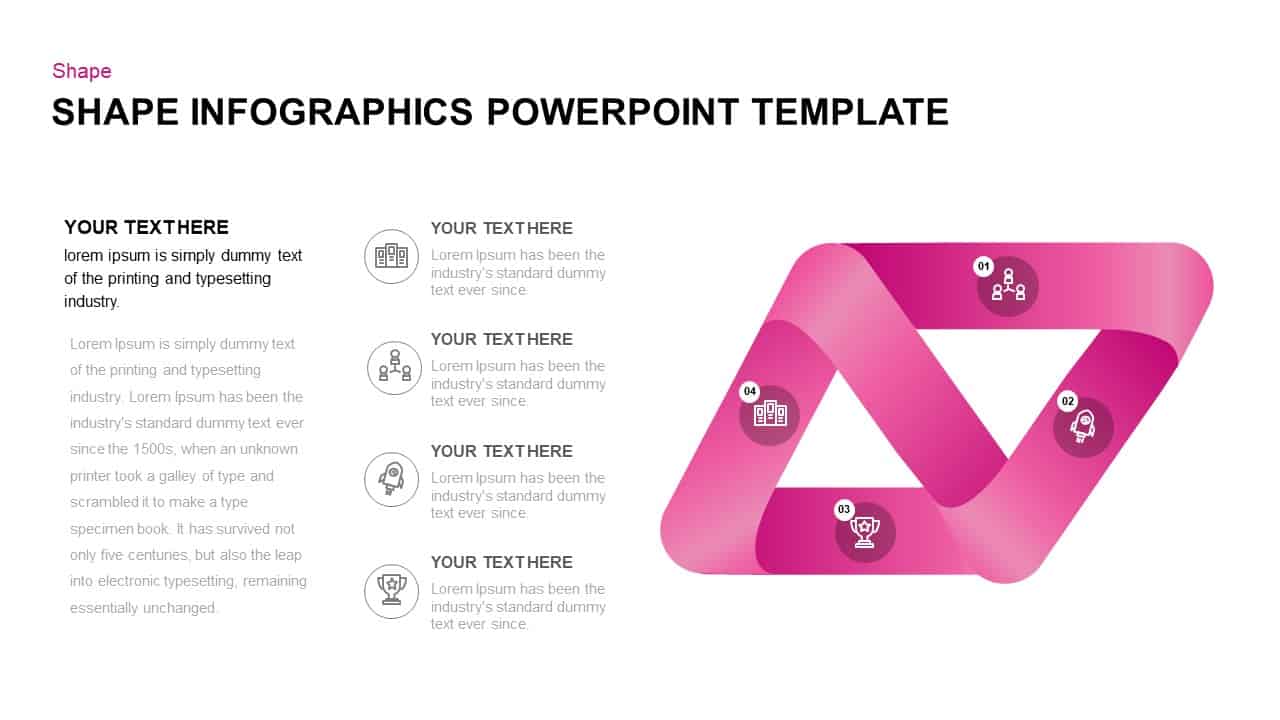
3D Segmented Shape Infographic Template for PowerPoint & Google Slides
Circular
Shape Loop Four-Step Infographic Slide Template for PowerPoint & Google Slides
Process
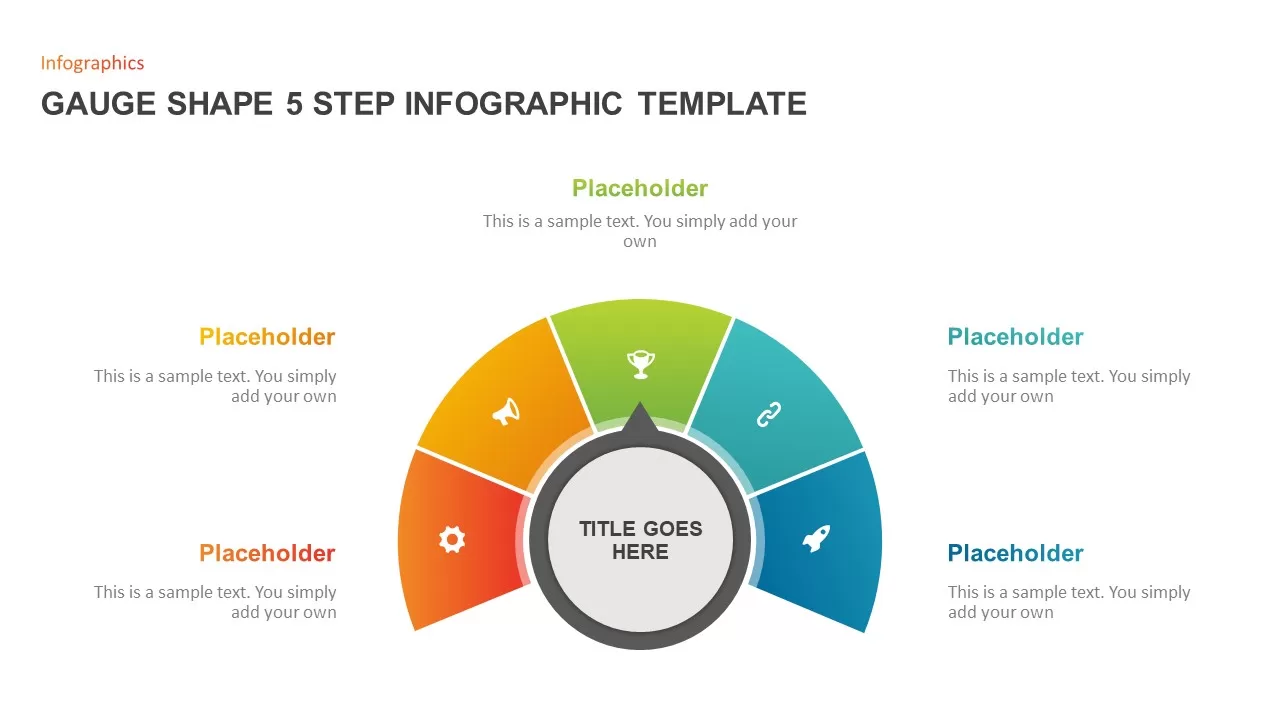
Gauge Shape 5-Step Infographic Diagram Template for PowerPoint & Google Slides
Process
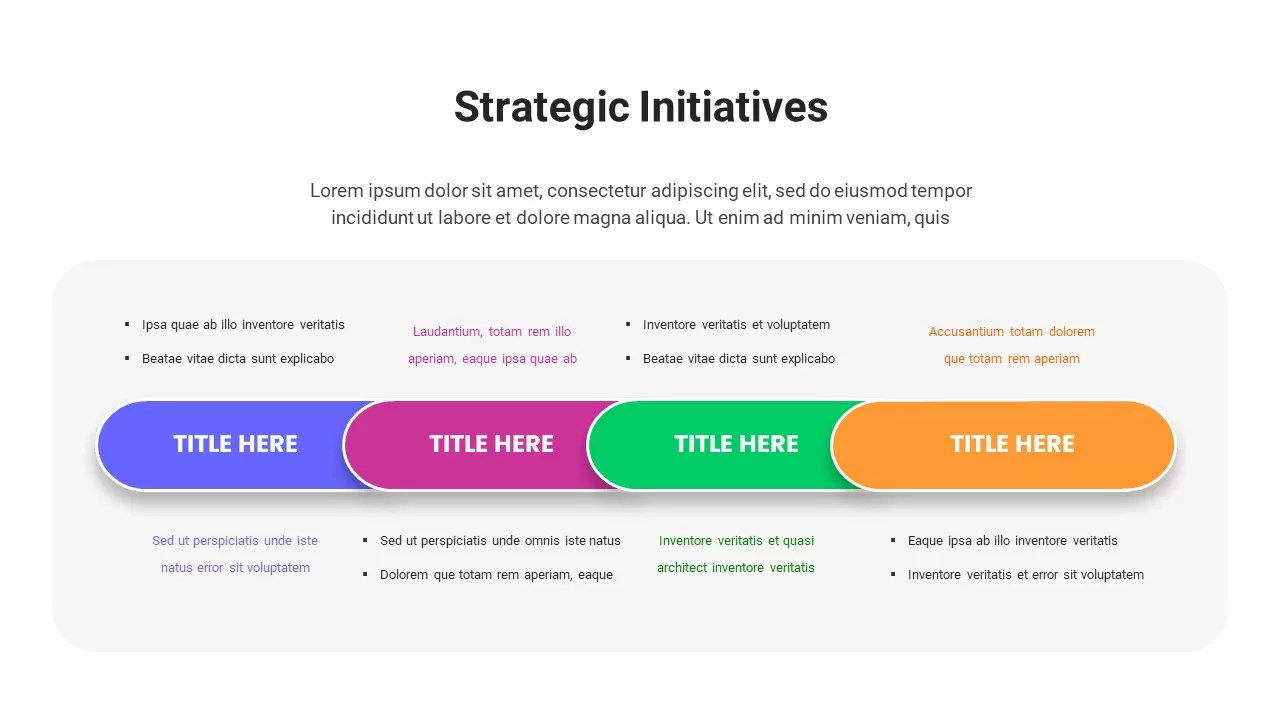
Strategic Initiatives Pill Shape Slide Template for PowerPoint & Google Slides
Pitch Deck
Fluid-Shape Cover Slide Template for PowerPoint & Google Slides
Company Profile
Arrow Types Shape Library Editable Template for PowerPoint & Google Slides
Arrow
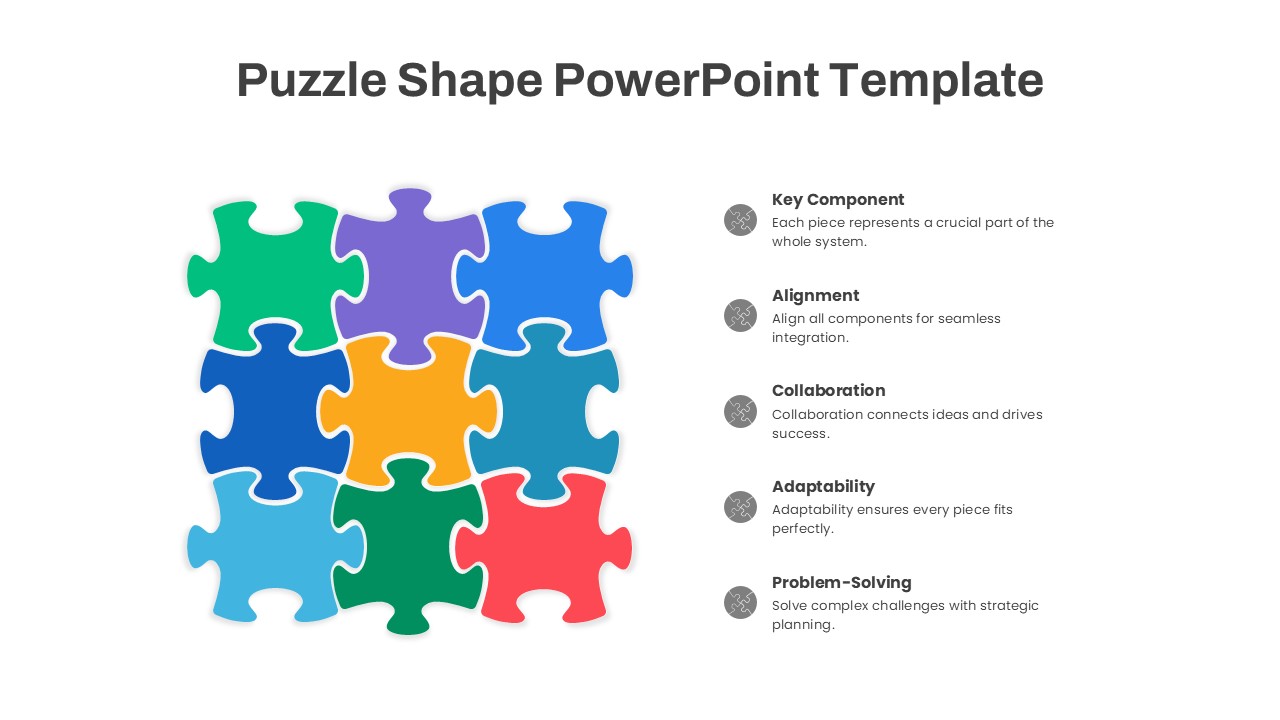
Puzzle Shape Diagram with Five Elements Template for PowerPoint & Google Slides
Circular
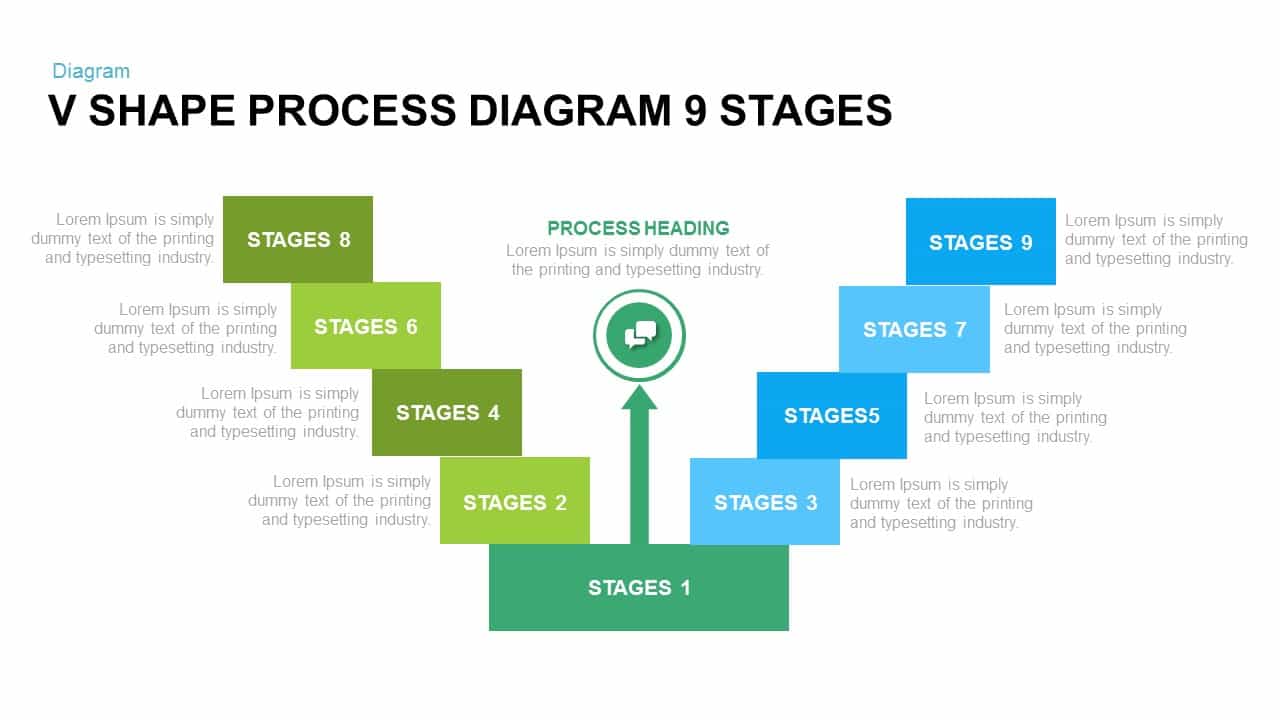
V Shape Process Diagram 9 Stages for PowerPoint & Google Slides
Infographics
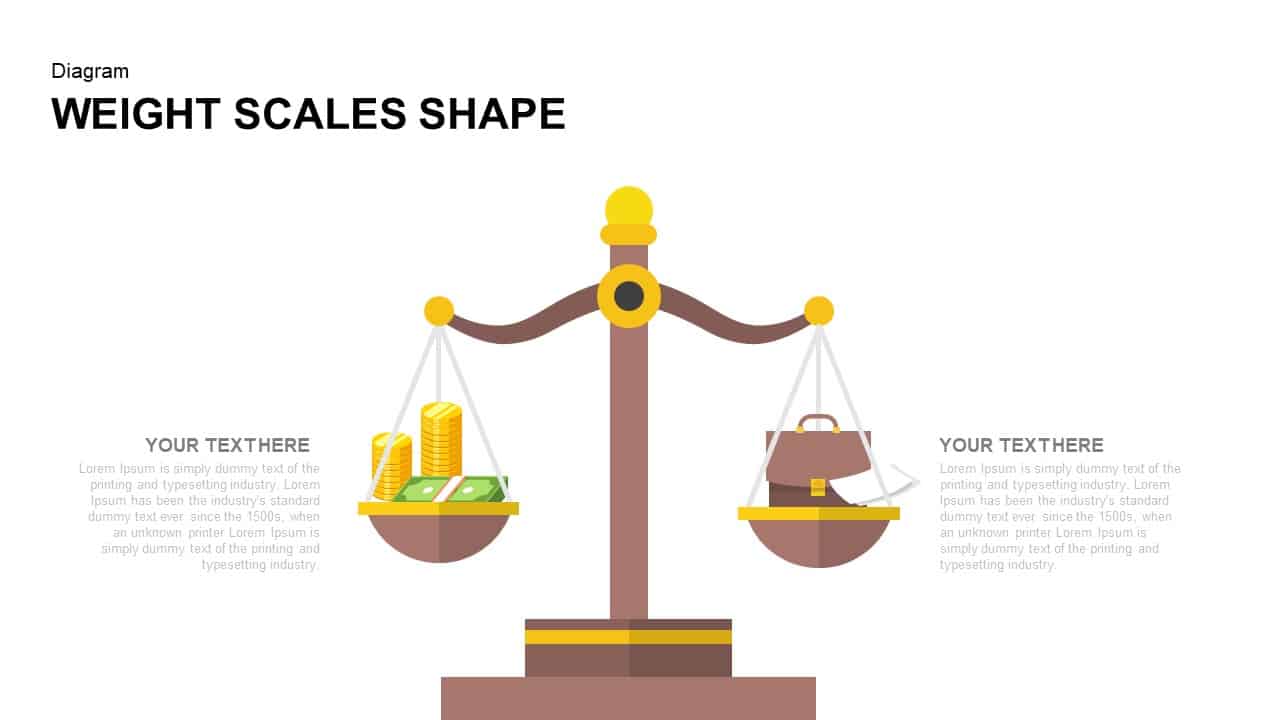
Weight Scales Shape Diagram for PowerPoint & Google Slides
Comparison
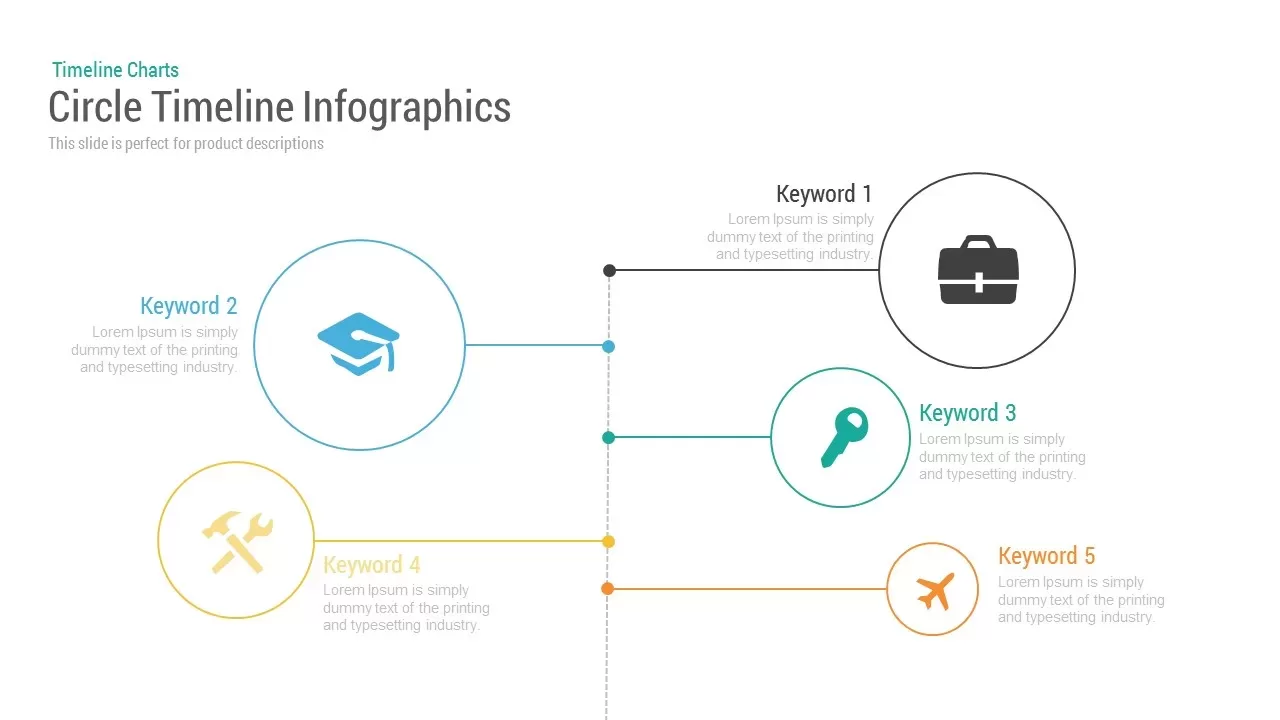
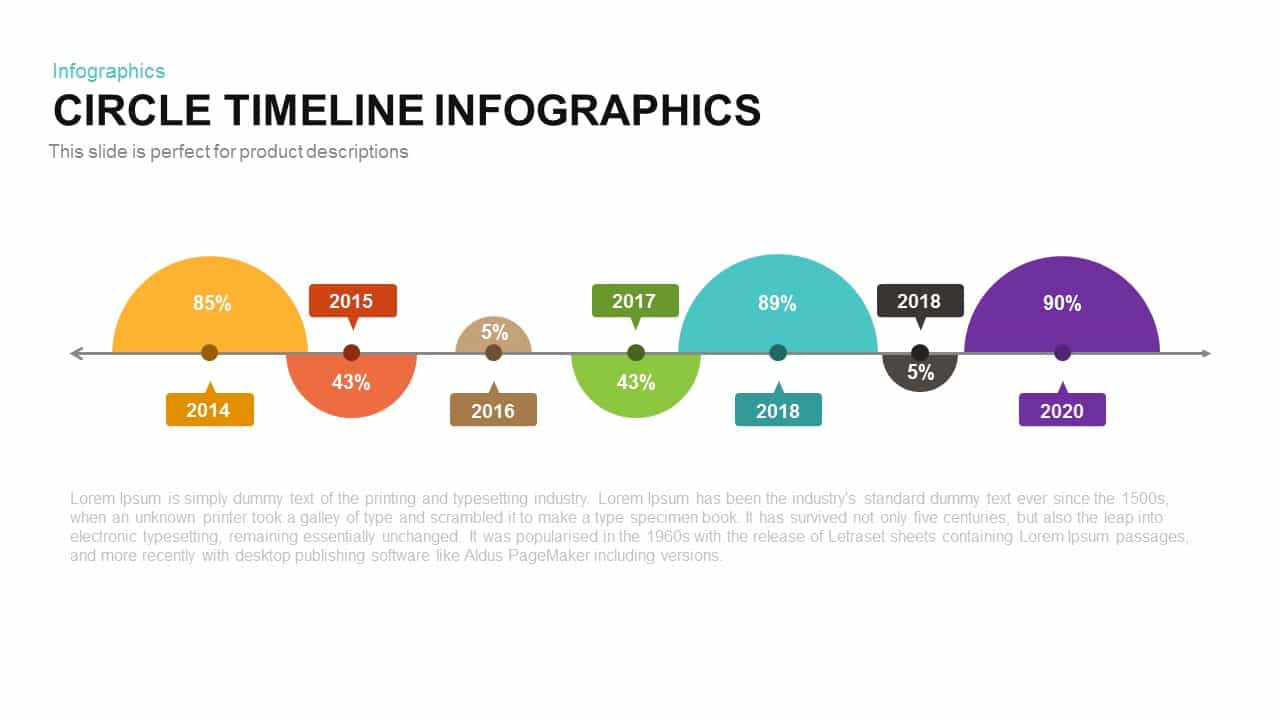
Circle Timeline Infographics template for PowerPoint & Google Slides
Timeline

Dynamic Circle Timeline Infographics template for PowerPoint & Google Slides
Timeline

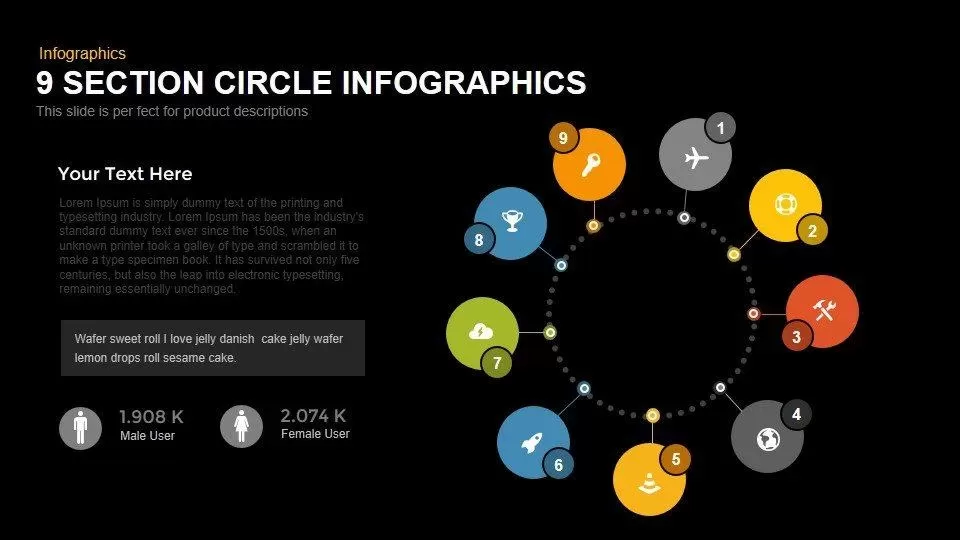
Modern 9-Section Circle Infographics Template for PowerPoint & Google Slides
Circular
Create Your Own Abstract Photo Mask Template for PowerPoint & Google Slides
Pitch Deck
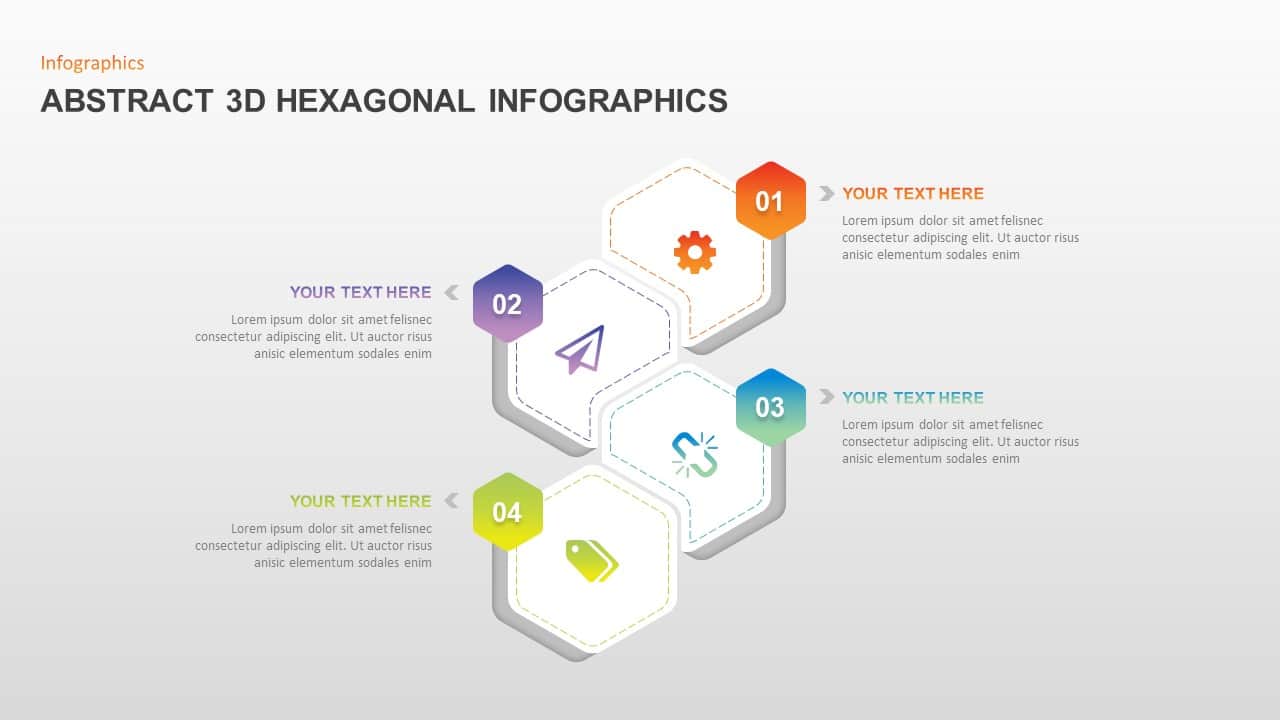
Abstract 3D Hexagonal 4-Step Infographic Template for PowerPoint & Google Slides
Process
Creative Blue Blobs Abstract Title Slide Template for PowerPoint & Google Slides
Company Profile
Free Black & White Abstract Backgrounds Template for PowerPoint & Google Slides
Pitch Deck
Free
Abstract Geometric Gradient Presentation Template for PowerPoint & Google Slides
Pitch Deck

Abstract Gradient Presentation Template for PowerPoint & Google Slides
Pitch Deck
Free Blue Hexagonal Abstract Presentation Template for PowerPoint & Google Slides
Pitch Deck
Free
Dynamic Abstract Corporate Theme Template for PowerPoint & Google Slides
Decks

Modern Abstract Blue Wave Theme Template for PowerPoint & Google Slides
Decks
Abstract Dark Gradient Presentation Template for PowerPoint & Google Slides
Pitch Deck
Soft Abstract Minimal Background Theme for PowerPoint & Google Slides
Company Profile
Vibrant Abstract Gradient Theme for PowerPoint & Google Slides
Decks
Abstract Neon Slide Deck for PowerPoint & Google Slides
Decks

Gradient Abstract Business Deck for PowerPoint & Google Slides
Decks
Creative Abstract Theme for PowerPoint & Google Slides
Decks
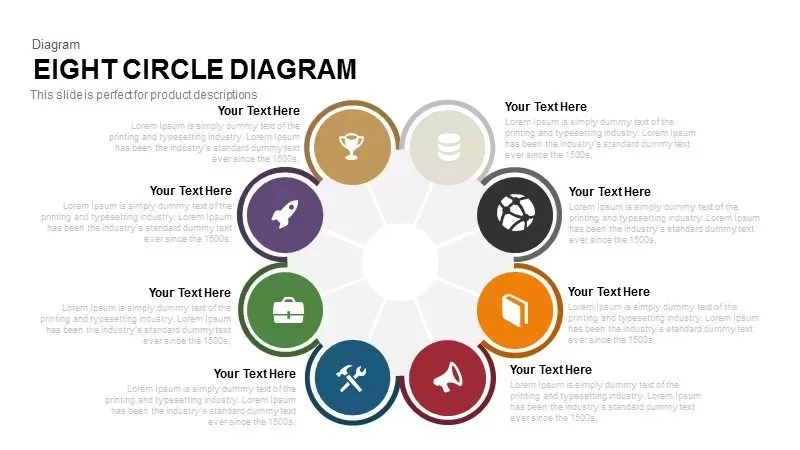
Free Eight Circle Creative Diagram template for PowerPoint & Google Slides
Circular
Free
3D Circle Sample template for PowerPoint & Google Slides
Circular
Circle Strategy Creative Chart template for PowerPoint & Google Slides
Business Strategy
Circle Chart Data template for PowerPoint & Google Slides
Pie/Donut
Four Circle Service template for PowerPoint & Google Slides
Process
Circle Spider Diagram Representation Template for PowerPoint & Google Slides
Circular
Circle Segment Sales Metrics Infographic Template for PowerPoint & Google Slides
Circular
Circle Graph Data Visualization Template for PowerPoint & Google Slides
Circular
Modern Circle SWOT Analysis Diagram Template for PowerPoint & Google Slides
SWOT
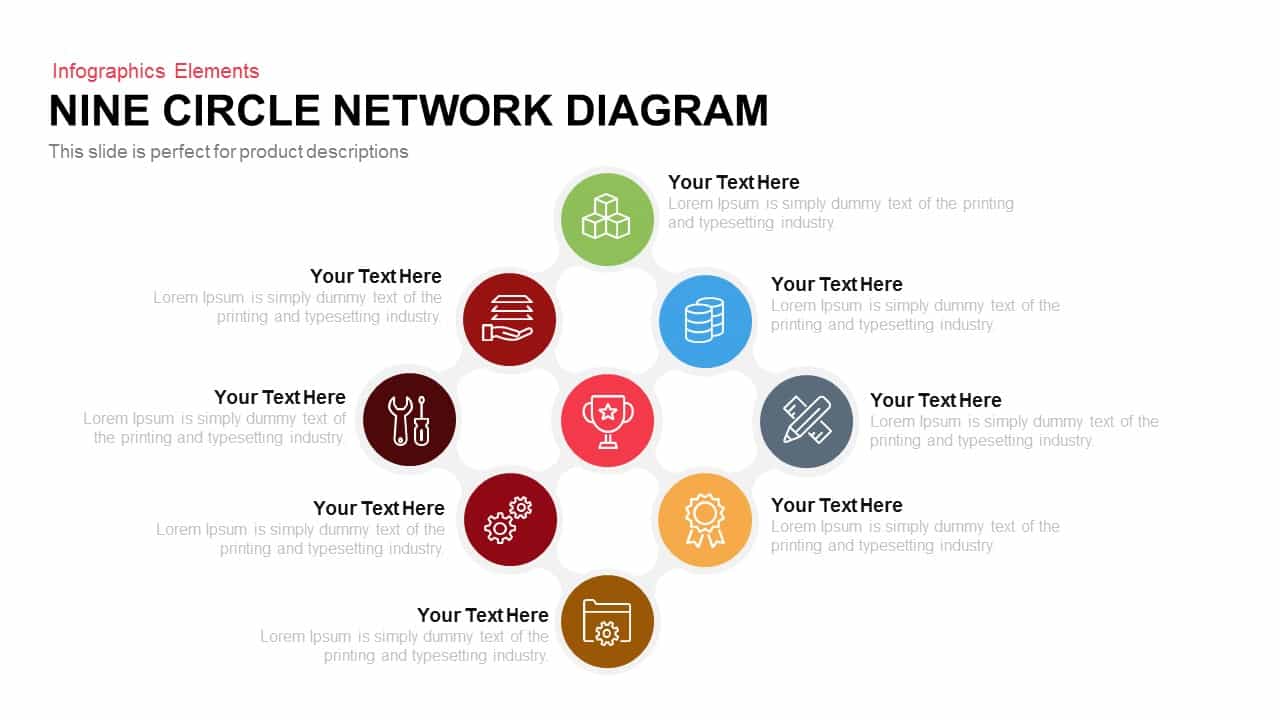
Modern Nine Circle Network Diagram Template for PowerPoint & Google Slides
Circular
Alternating Circle Timeline Diagram Template for PowerPoint & Google Slides
Timeline
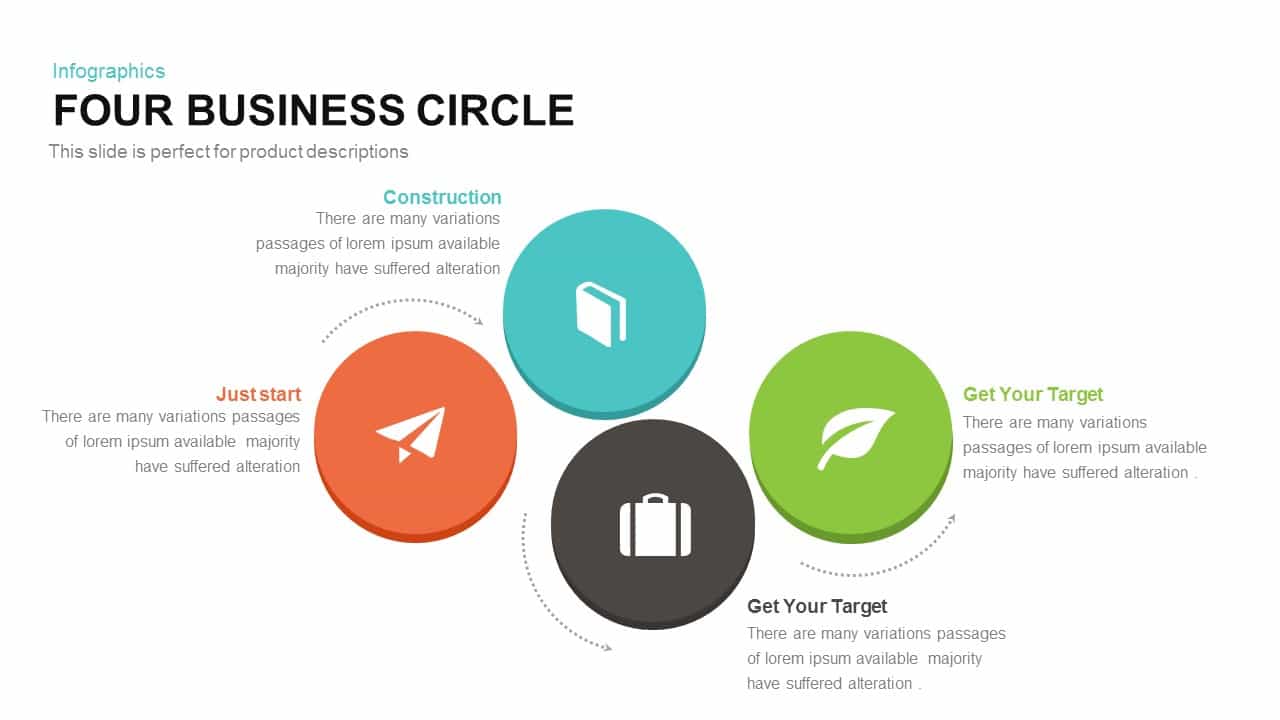
Four-Circle Business Process Infographic Template for PowerPoint & Google Slides
Circular
Three Circle Arrow Process Diagram template for PowerPoint & Google Slides
Circular
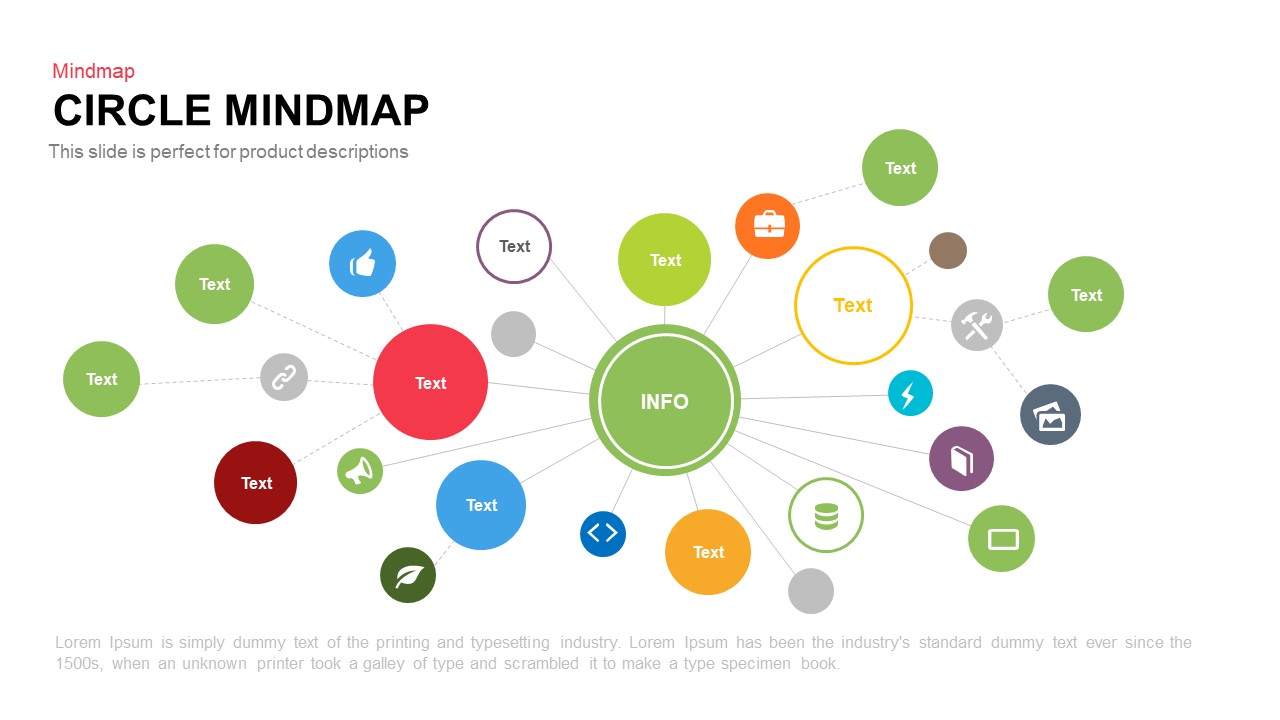
Circle Mindmap template for PowerPoint & Google Slides
Mind Maps
Multi-Segment Circle Split Diagram template for PowerPoint & Google Slides
Circular
Eight Circle Diagram Template for PowerPoint & Google Slides
Circular

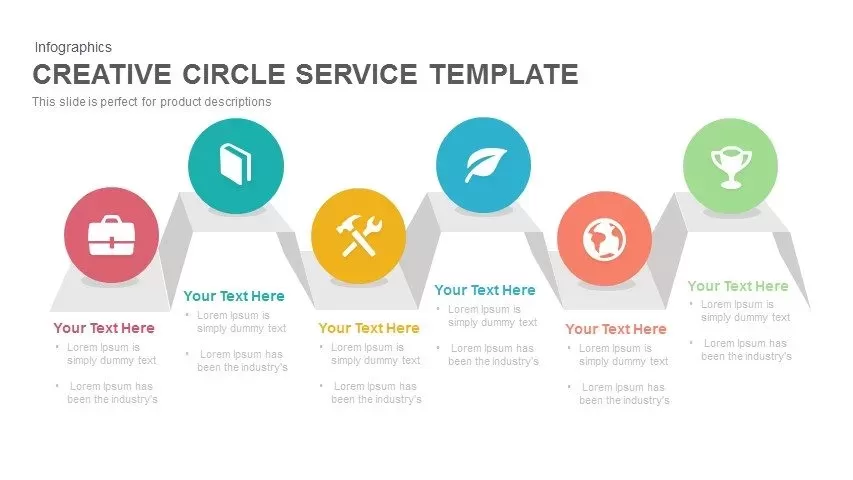
Creative Zigzag Circle Service Steps Template for PowerPoint & Google Slides
Process
Multi-layout Circle Spoke Diagram Template for PowerPoint & Google Slides
Circular
Four-Circle Venn Process Diagram template for PowerPoint & Google Slides
Process
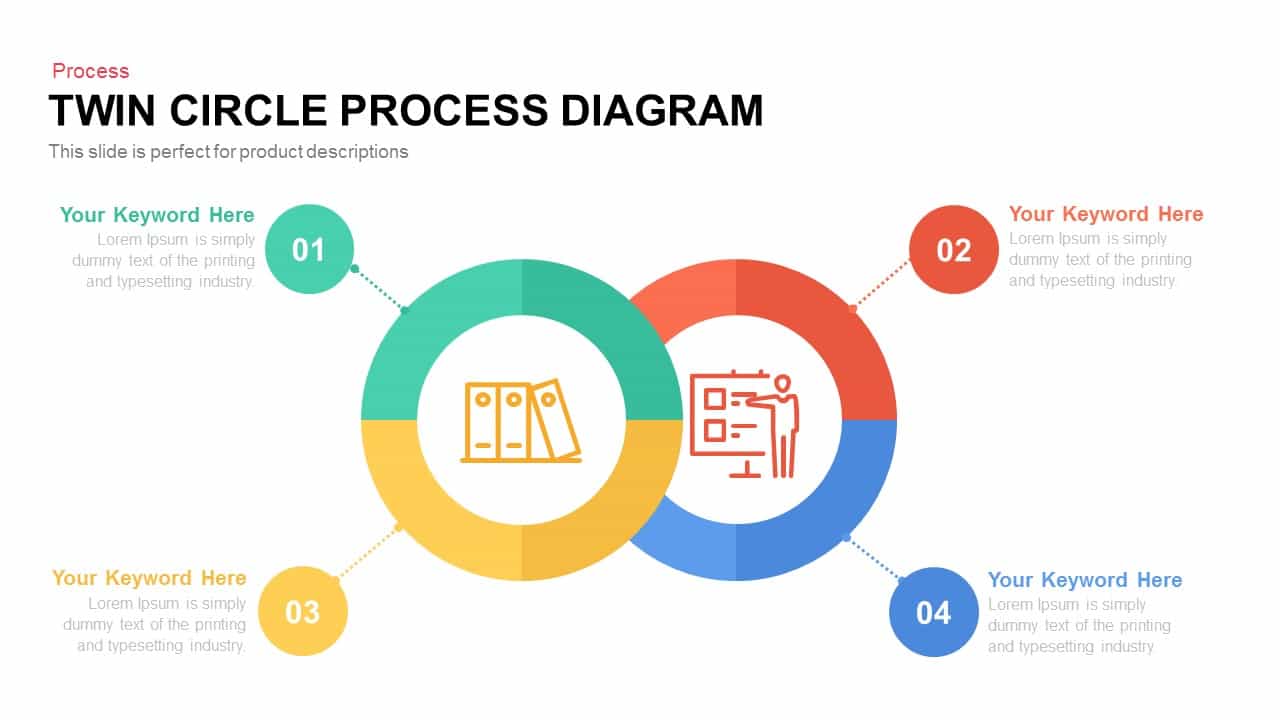
Editable Twin Circle Process Diagram Template for PowerPoint & Google Slides
Process
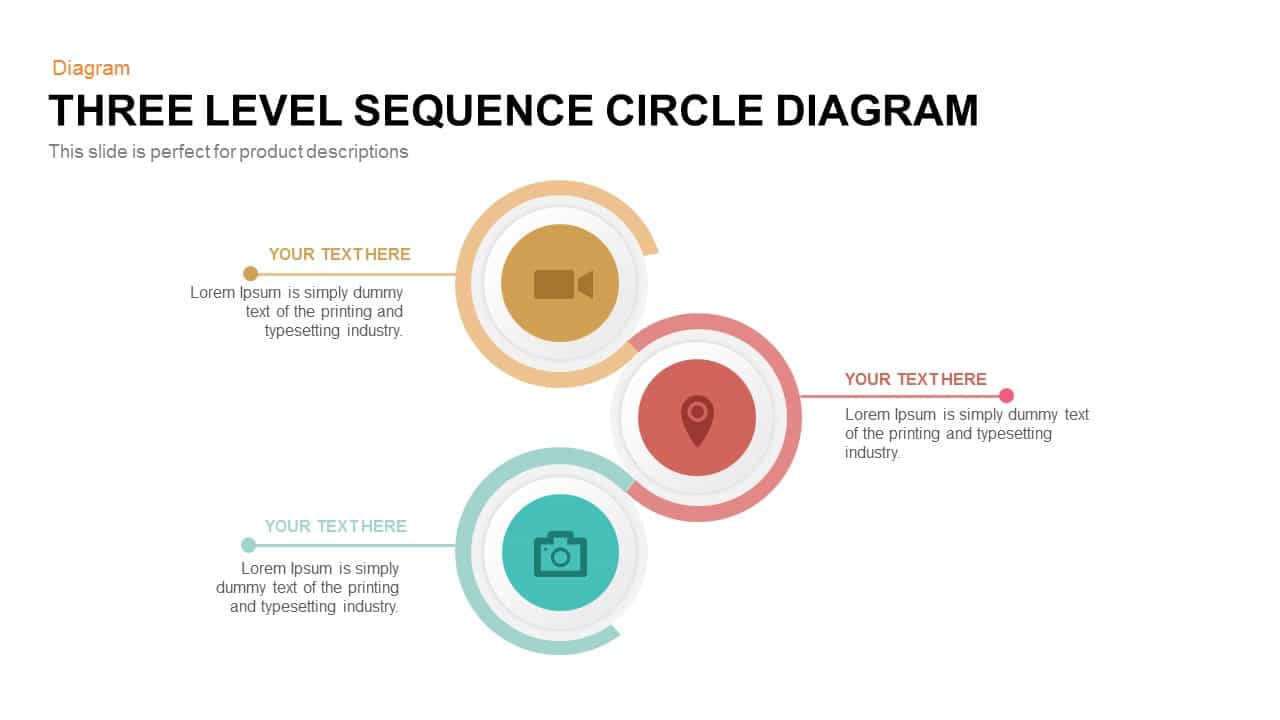
Three-Level Sequence Circle Diagram Template for PowerPoint & Google Slides
Circular
Five-Staged Circle Sections Diagram Template for PowerPoint & Google Slides
Circular
Five-Stage Semi-Circle Diagram Template for PowerPoint & Google Slides
Process
Five-Stage Circle Arrow Diagram Template for PowerPoint & Google Slides
Circular
Two-Stage Semi-Circle Diagram Overview Template for PowerPoint & Google Slides
Circular
Three-Circle Diagram Infographic Template for PowerPoint & Google Slides
Circular
Modern Multi-Section Circle Diagram Template for PowerPoint & Google Slides
Circular
Six-Stage Semi-Circle Diagram with Icons Template for PowerPoint & Google Slides
Circular
Four-Circle Hub and Spoke Diagram Template for PowerPoint & Google Slides
Process
Four-Section Colored Circle Infographic Template for PowerPoint & Google Slides
Circular
Six Staged Circle Diagram template for PowerPoint & Google Slides
Circular
Five-Point Circle Timeline Diagram Template for PowerPoint & Google Slides
Timeline

Three-Circle Process Infographic Template for PowerPoint & Google Slides
Circular
Six-Stage Circle Process Diagram Template for PowerPoint & Google Slides
Process
Four-Stage Agenda Circle Diagram Slide Template for PowerPoint & Google Slides
Agenda
Creative Three-Circle Venn Diagram Template for PowerPoint & Google Slides
Comparison
Six-Circle Process Infographic Diagram Template for PowerPoint & Google Slides
Circular
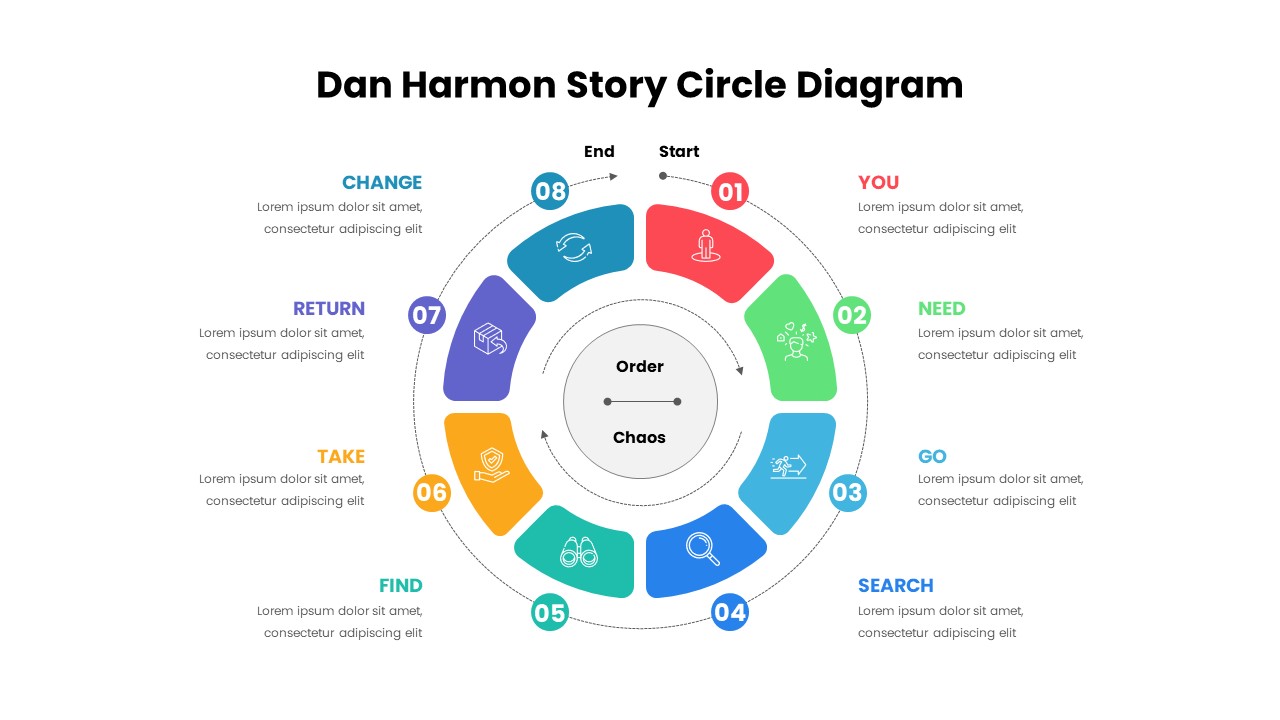
Dan Harmon Story Circle Diagram Template for PowerPoint & Google Slides
Circular
Circle Arrows Diagram template for PowerPoint & Google Slides
Process
Circle Arrows Process Flow template for PowerPoint & Google Slides
Process
Circle Arrow Process Flow template for PowerPoint & Google Slides
Process
Circle Arrow Process Flow template for PowerPoint & Google Slides
Process
Four-Stage Circle Arrow Infographic Template for PowerPoint & Google Slides
Circular
Four-Stage Circle Arrow Infographic Template for PowerPoint & Google Slides
Circular
Five Circle Venn Diagram for Template for PowerPoint & Google Slides
Circular
8 Circle Venn Diagram Infographic Design Template for PowerPoint & Google Slides
Circular
Professional 6 Circle Venn Diagram Template for PowerPoint & Google Slides
Circular
Free Graduation Photo Collage Circle Slide Template for PowerPoint & Google Slides
Decks
Free
Blue Circle Mobile Apps Presentation Template for PowerPoint & Google Slides
Information Technology
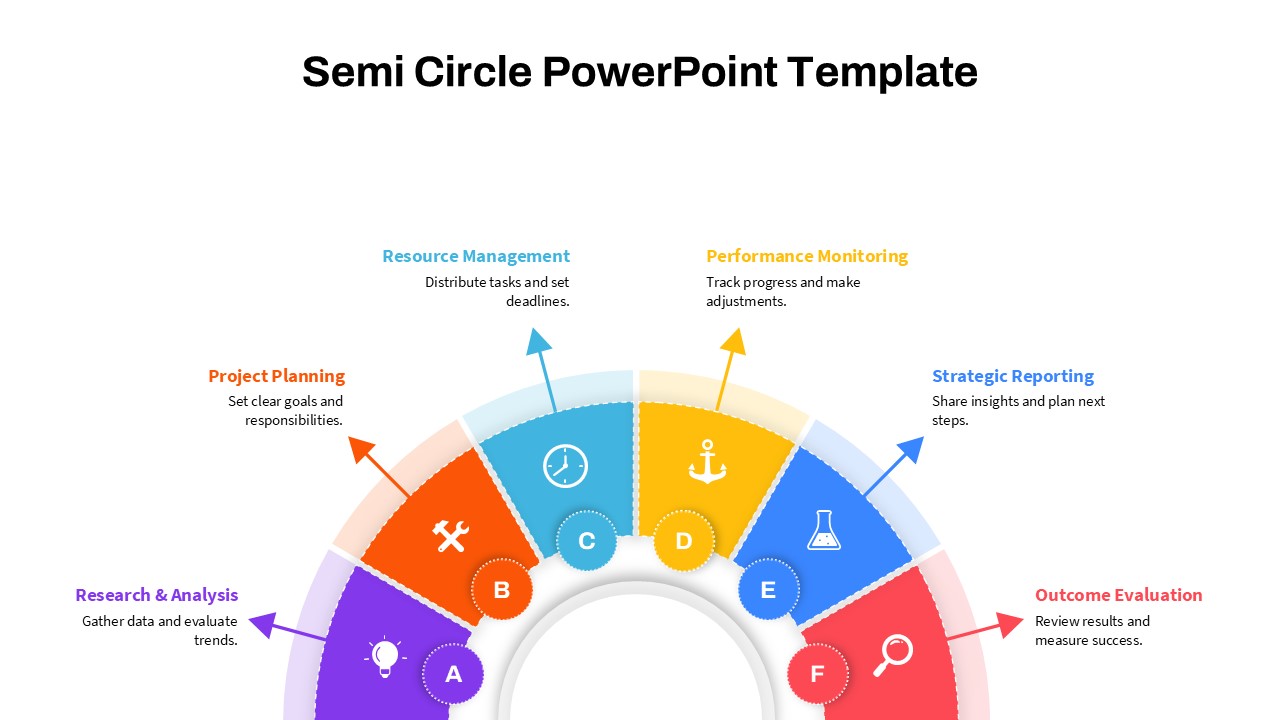
Modern Semi Circle Infographic Template for PowerPoint & Google Slides
Circular
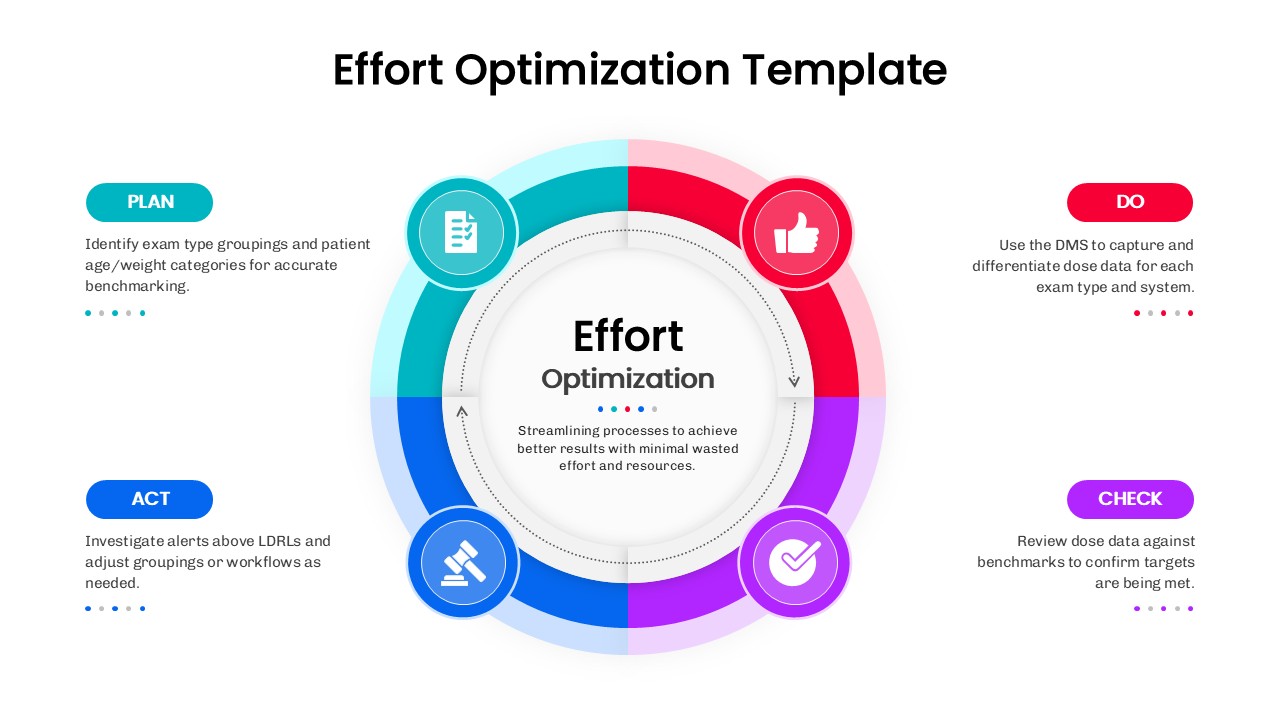
Effort Optimization PDCA Circle Diagram Template for PowerPoint & Google Slides
Circular
Four Linked Circle Diagram for PowerPoint & Google Slides
Process
Arrow Circle Flow Diagram for PowerPoint & Google Slides
Infographics
Creative Circle Elements for PowerPoint & Google Slides
Infographics
4 Circle Process for PowerPoint & Google Slides
Process

Company Features Circle Diagram for PowerPoint & Google Slides
Process
Colorful Venn Diagram with 4 Circle for PowerPoint & Google Slides
Circular
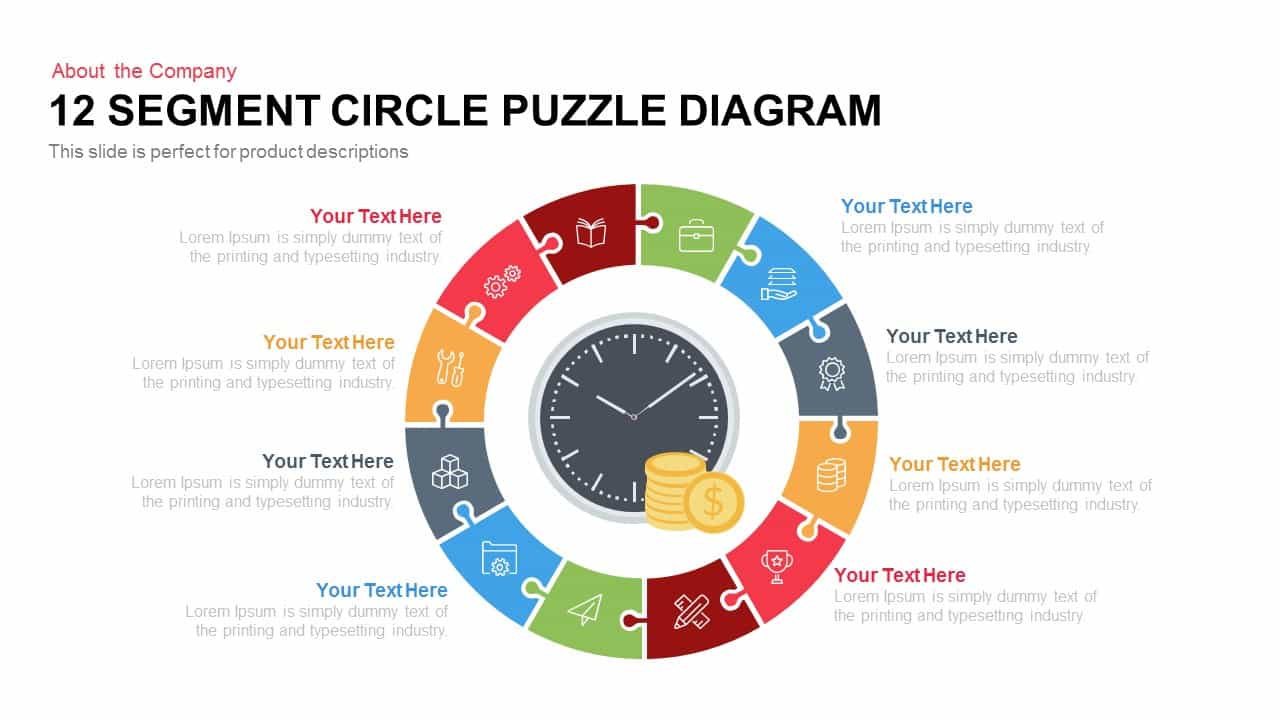
12 Segment Circle Puzzle Diagram Template for PowerPoint and Keynote
Circular
3D Bar Chart Data Infographics Template for PowerPoint & Google Slides
Bar/Column
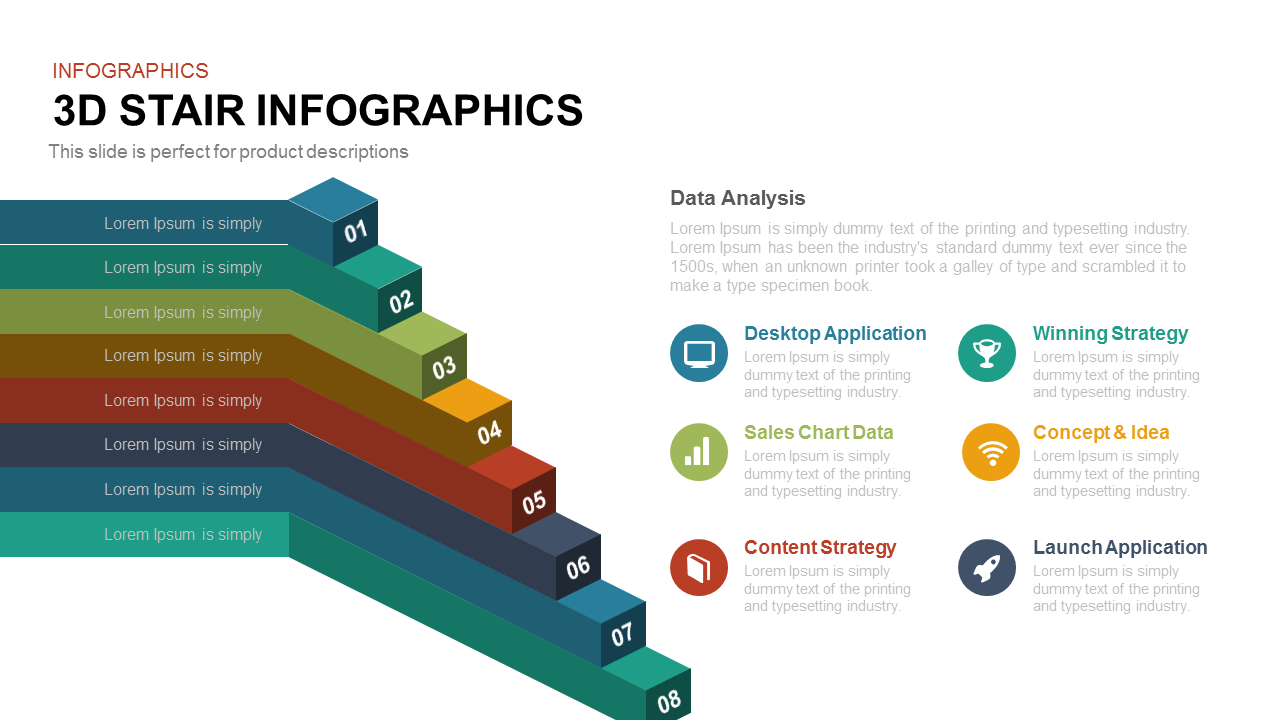
8-Step 3D Stair Infographics Slide template for PowerPoint & Google Slides
Process
Five Arrow Infographics Diagram Template for PowerPoint & Google Slides
Arrow
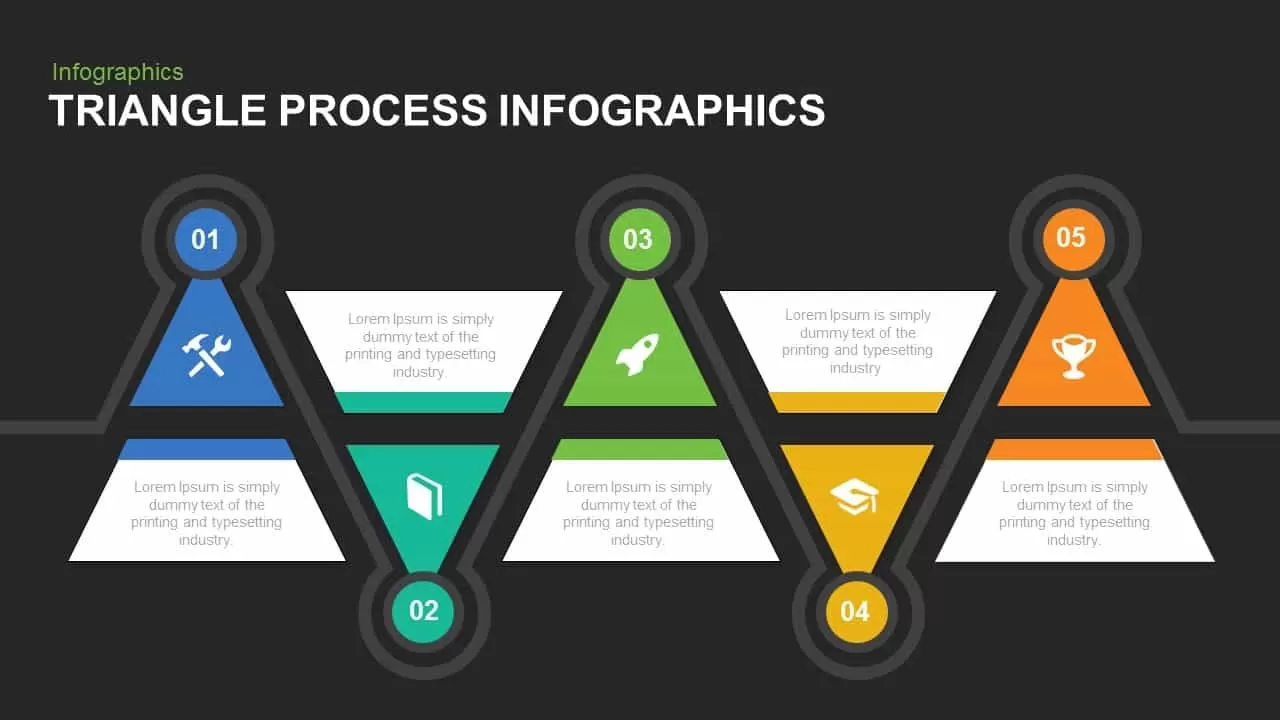
Triangle Process Infographics template for PowerPoint & Google Slides
Process
Free Bulb Puzzle Infographics Diagram Template for PowerPoint & Google Slides
Process
Free
Scrum Process & Roles Infographics Template for PowerPoint & Google Slides
Scrum
Cube Core Infographics Template for PowerPoint & Google Slides
Process
Creative Cycle Process Infographics Template for PowerPoint & Google Slides
Process
Free Colorful Timeline Infographics Template for PowerPoint & Google Slides
Timeline
Free
Technology Tree Infographics Template for PowerPoint & Google Slides
AI