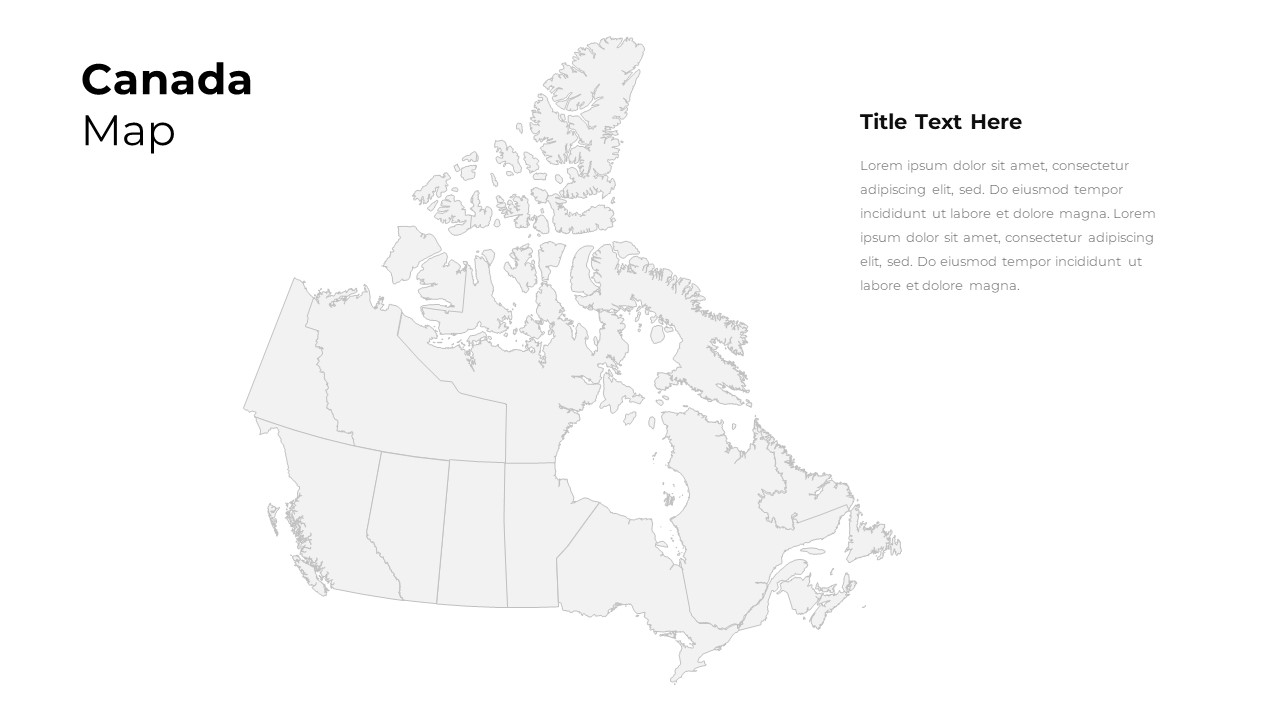
Canada Provinces Map Multi-Layout Template for PowerPoint & Google Slides
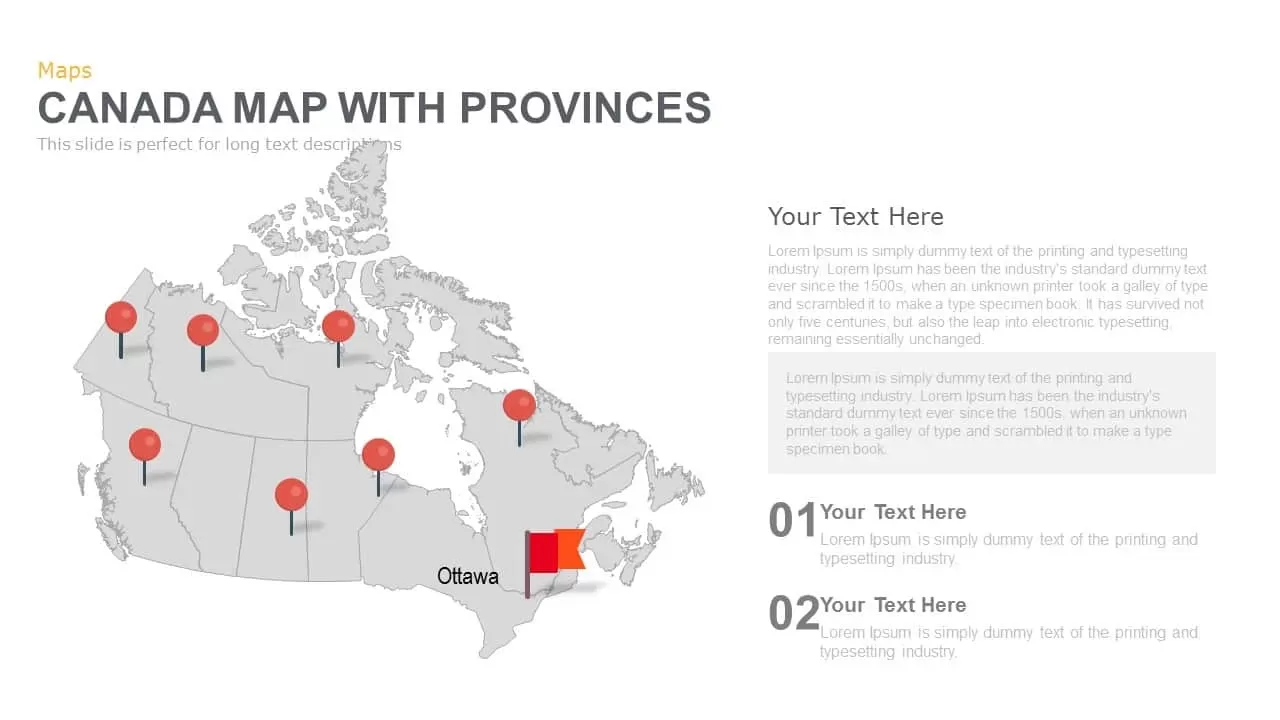
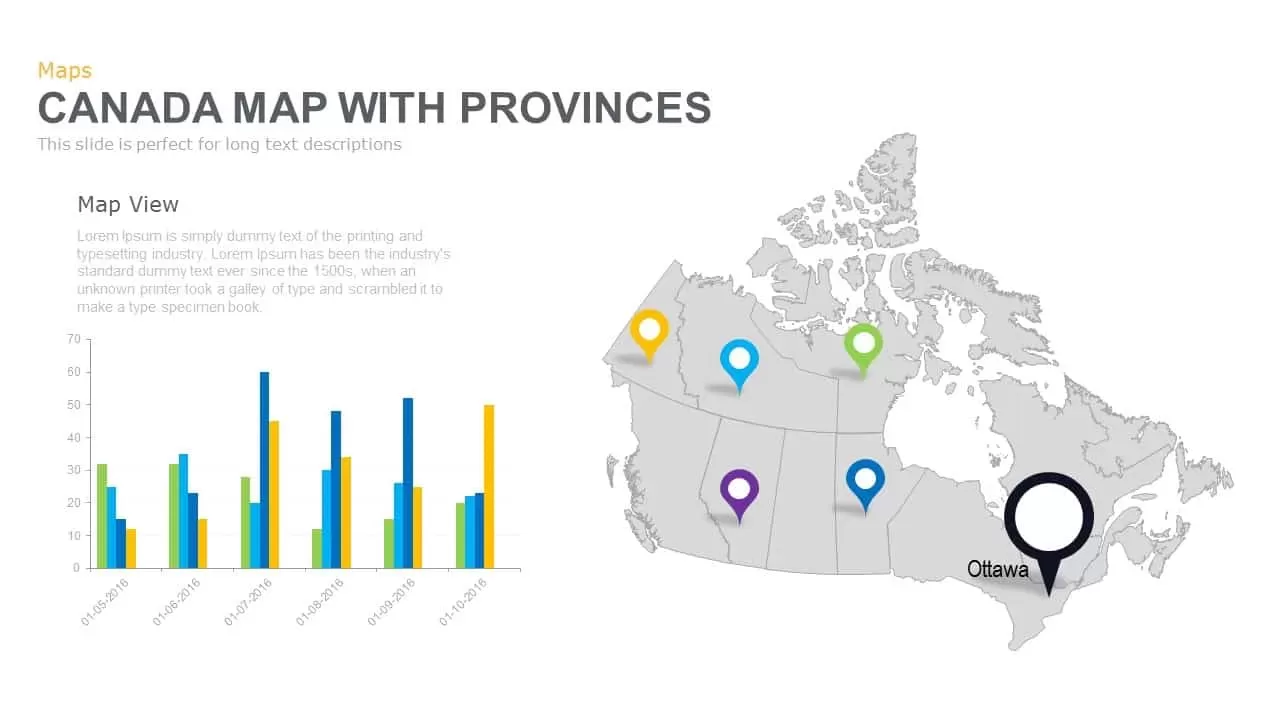

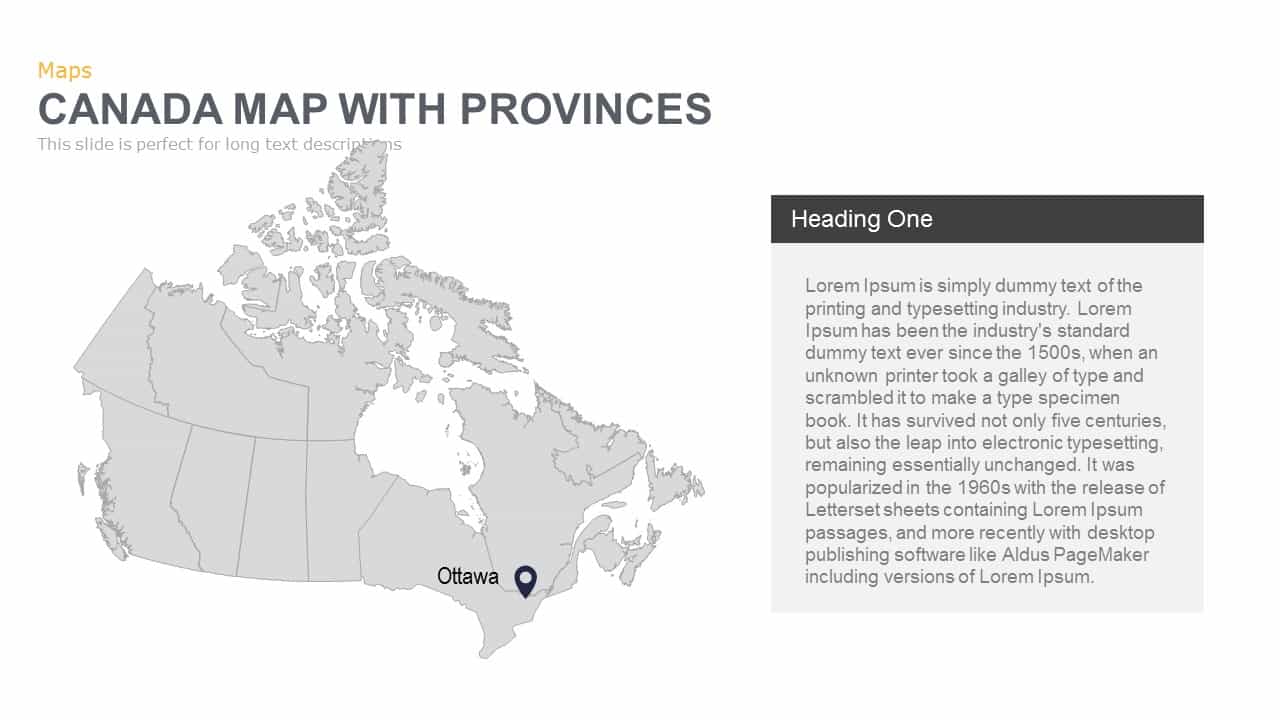
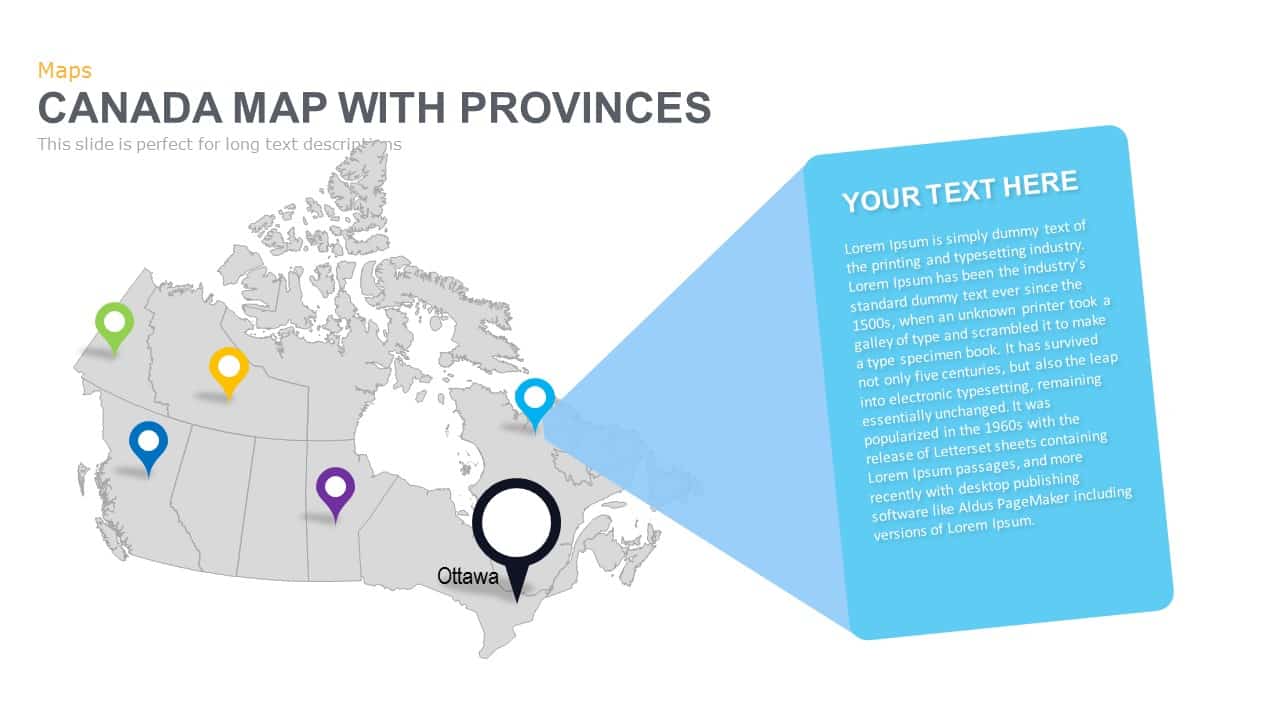

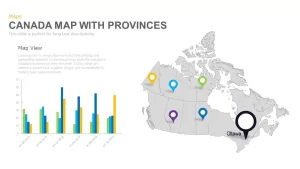
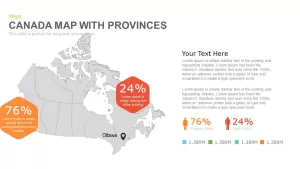
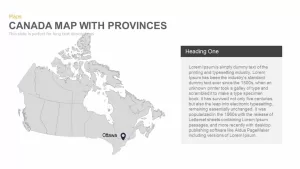

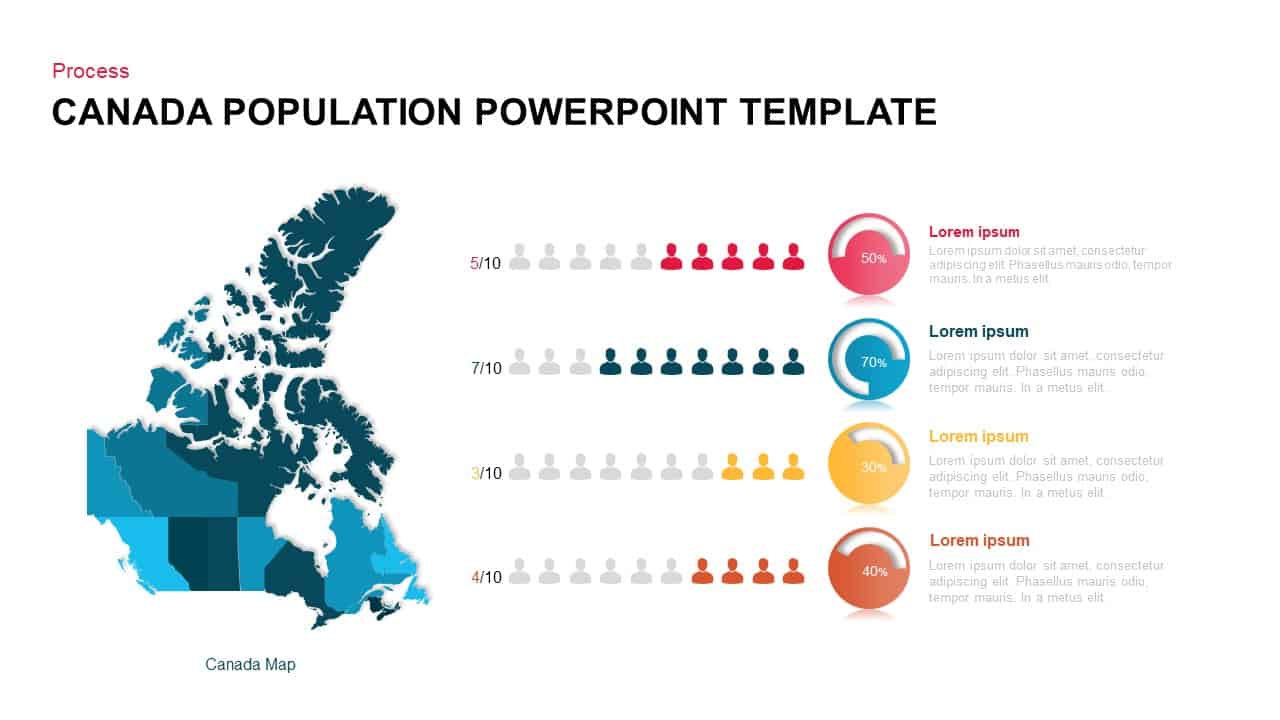
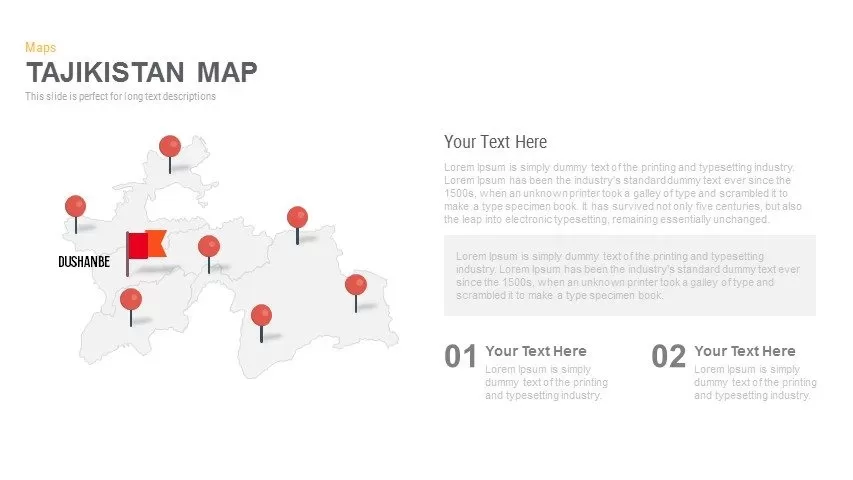
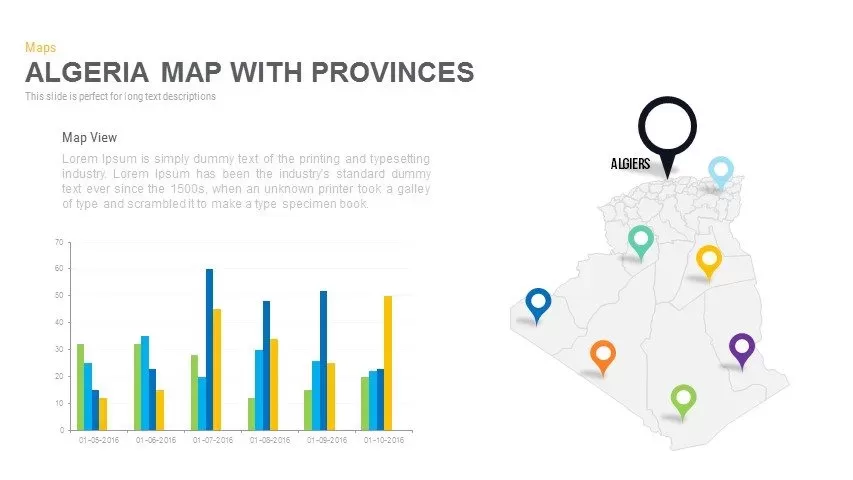
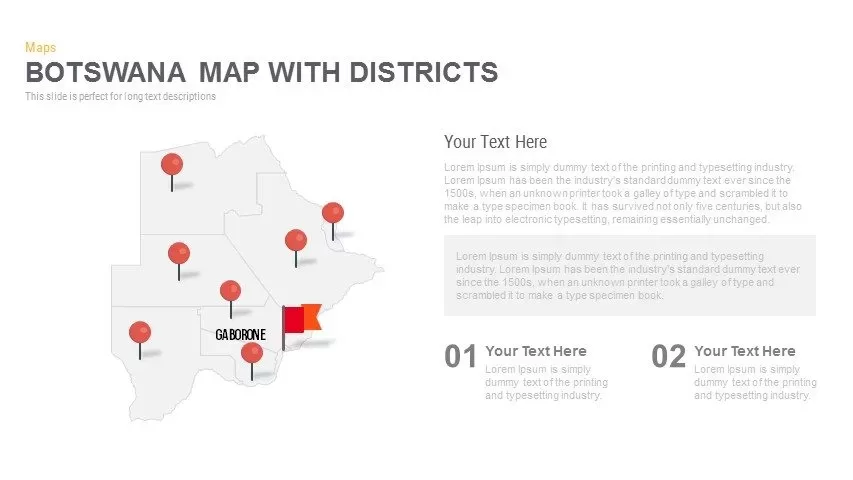
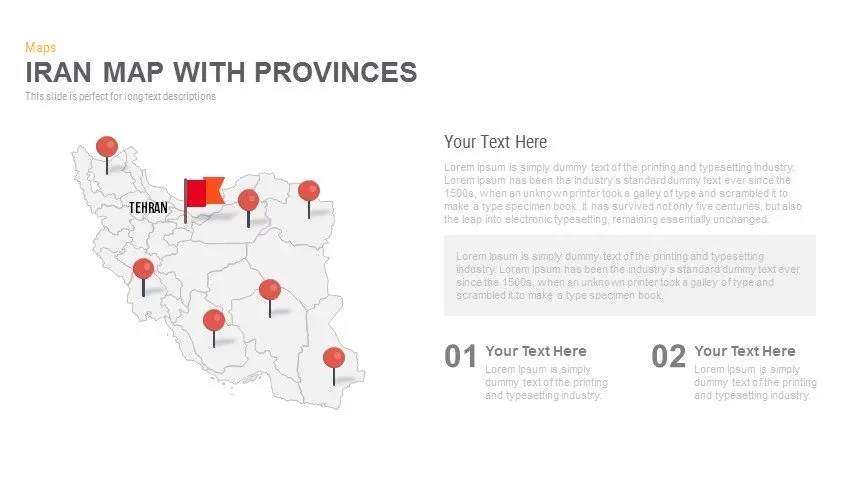
This slide deck offers a versatile Canada map layout with five fully editable slides to visualize regional data, annotations, and analytics. Slide one displays a grayscale Canada silhouette overlaid with red location pins marking seven key provinces and a flagship flag icon at Ottawa, accompanied by a two-column text area for detailed narratives or long-form descriptions. Slide two transforms those pins into multicolored markers and introduces a large pop-out callout box for highlighting a specific province’s insights, complete with customizable background tint and typography. Slide three pairs the right-aligned map with a left-side bar chart, enabling side-by-side comparisons of provincial metrics over time through three color-coded data series. Slide four rebalances the layout by shifting narrative text and headline to the left and the map to the right, maintaining consistent pin markers for storytelling or executive summaries. The final slide superimposes bold percentage callouts—76% and 24%—onto two provinces, paired with gender-icon breakdowns and a legend for four color categories, ideal for demographic or user-segmentation displays. All slides feature flat-design aesthetics, uniform gray map fill, vibrant accent colors, and clean sans-serif typography. Master slides ensure that map shapes, pin icons, callout panels, charts, and text placeholders can be resized, recolored, or repositioned without affecting slide integrity.
Who is it for
Market researchers, sales directors, regional planners, and business development teams can leverage this deck to present territory performance, demographic breakdowns, and sales territories across Canada. Consultants, educators, and government agencies will find the diverse layouts invaluable for stakeholder briefings, grant proposals, and classroom presentations.
Other Uses
Repurpose the pop-out callout slide for event planning, site selection, or investment pitching. Use the bar chart integration to compare quarterly sales, population growth, or resource allocation by province. Adapt the percentage callouts for donor segmentation, voter turnout analyses, or regional satisfaction surveys.
Login to download this file

Item ID
SB00472
Related Templates

Customizable Canada Map Outline Template for PowerPoint & Google Slides
World Maps
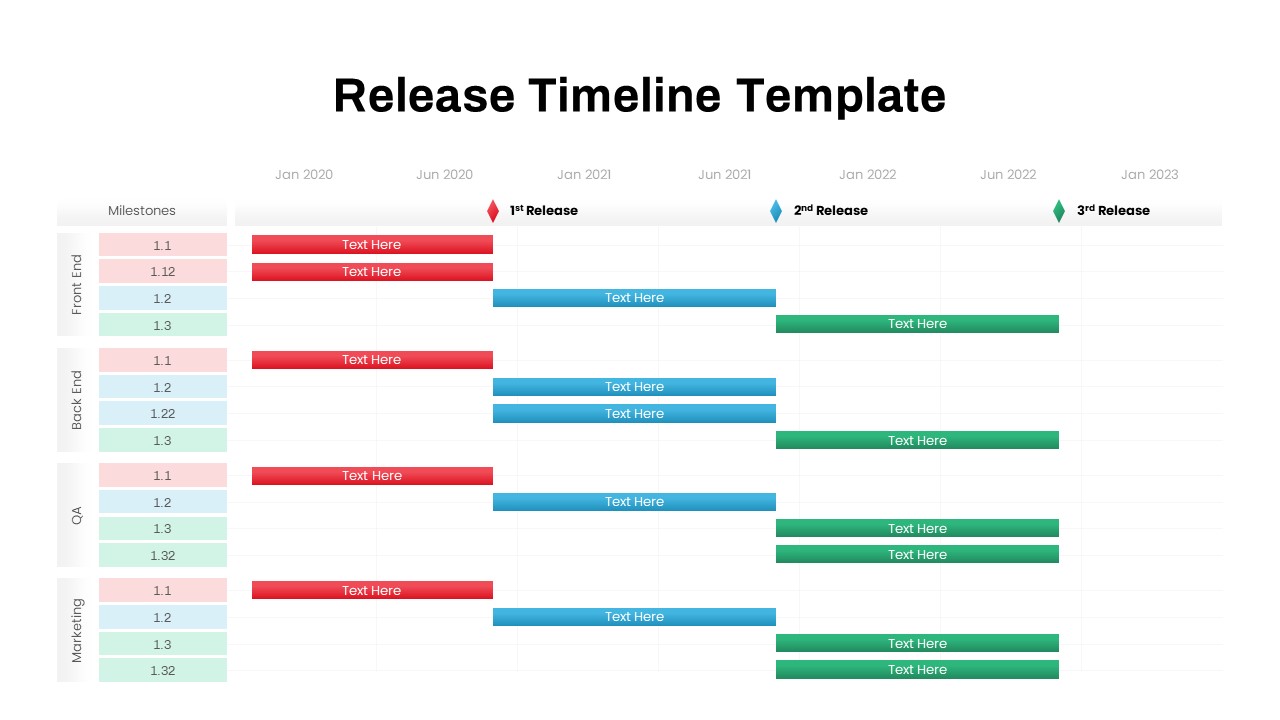
Multi-Team Multi-Phase Release Timeline Template for PowerPoint & Google Slides
Timeline
Multi-layout Circle Spoke Diagram Template for PowerPoint & Google Slides
Circular
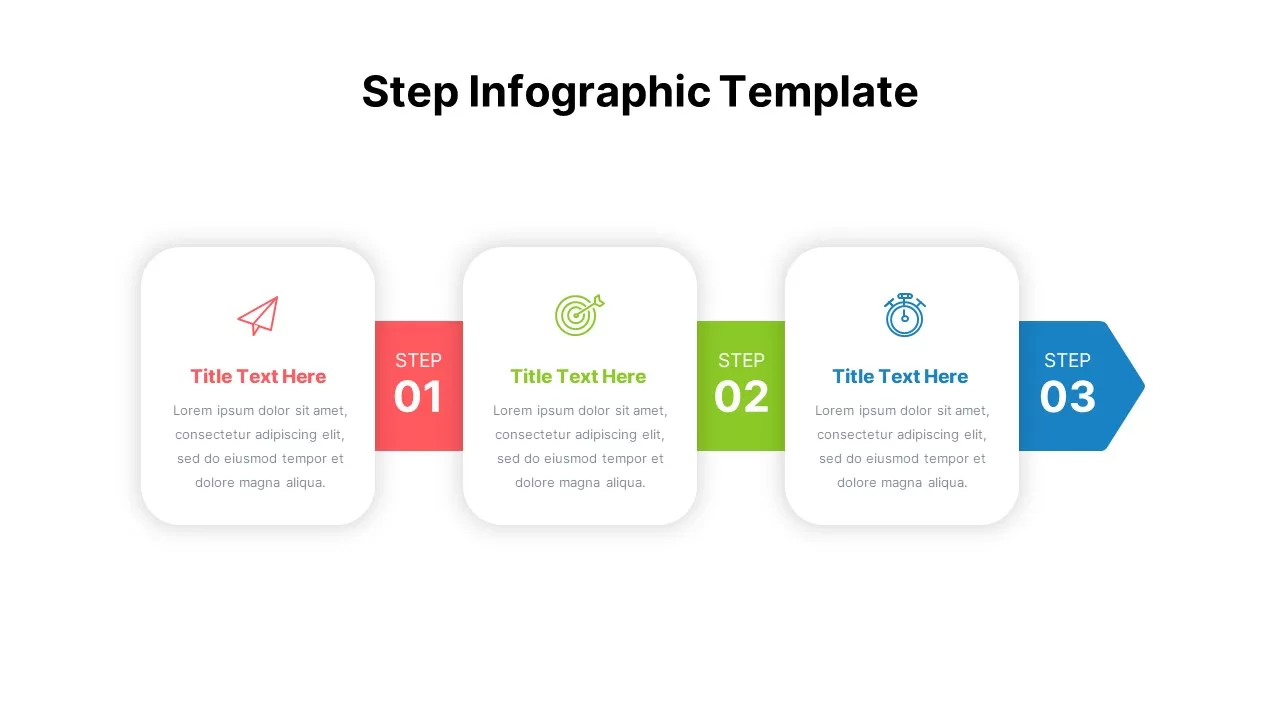
Multi-Step Infographic Process Layout Template for PowerPoint & Google Slides
Process
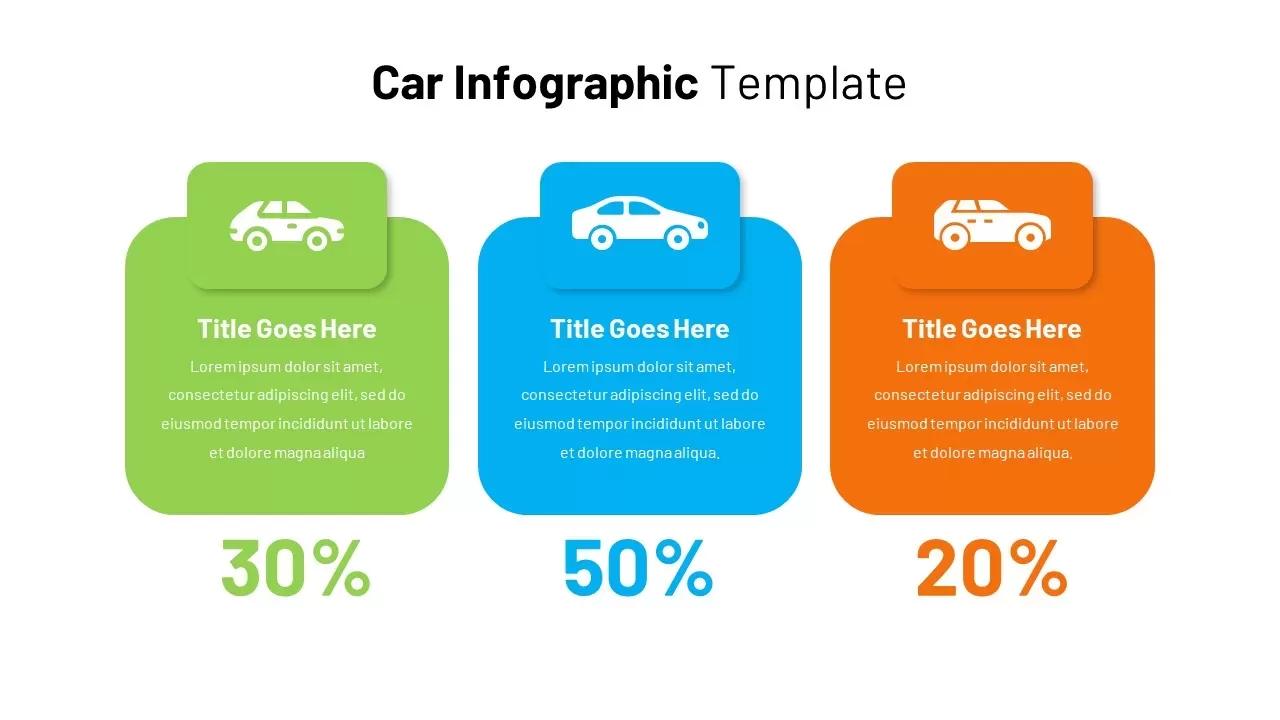
Automotive Infographic Multi-Layout Template for PowerPoint & Google Slides
Comparison
Multi-Color Milestone Timeline Layout Template for PowerPoint & Google Slides
Timeline
Canada Population Infographics Template for PowerPoint & Google Slides
World Maps
Azerbaijan Map with Provinces & Callouts Template for PowerPoint & Google Slides
World Maps

North Korea Map with Provinces Infographic Pack Template for PowerPoint & Google Slides
Maps
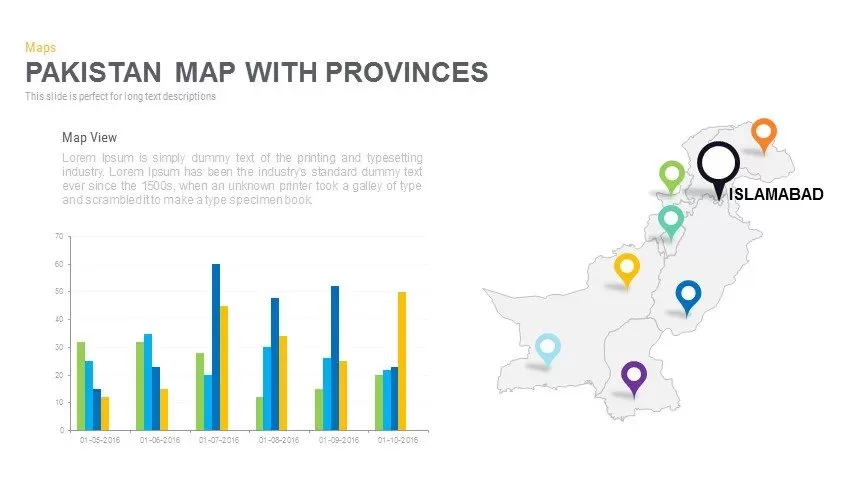
Pakistan Provinces Map Infographic Pack Template for PowerPoint & Google Slides
Maps
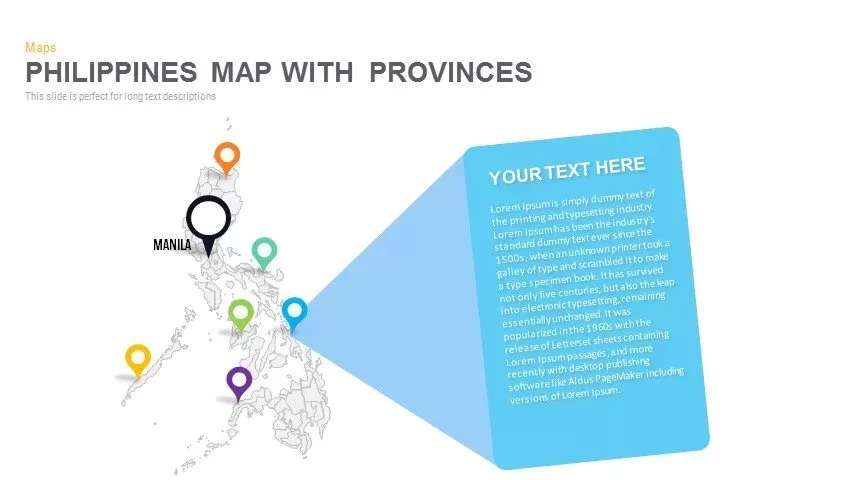
Philippines Map with Provinces Pack Template for PowerPoint & Google Slides
Maps
Editable Tajikistan Provinces Map Pack Template for PowerPoint & Google Slides
Maps
Thailand Provinces Map Infographic Pack Template for PowerPoint & Google Slides
Maps
Vietnam Provinces Map Infographic Pack Template for PowerPoint & Google Slides
Maps
Algeria Map with Provinces Pack Template for PowerPoint & Google Slides
Maps
Angola Provinces Map Slide Pack Template for PowerPoint & Google Slides
World Maps
Angola Map with Provinces Slide Pack Template for PowerPoint & Google Slides
World Maps
Iran Map with Provinces Slide Pack Template for PowerPoint & Google Slides
World Maps
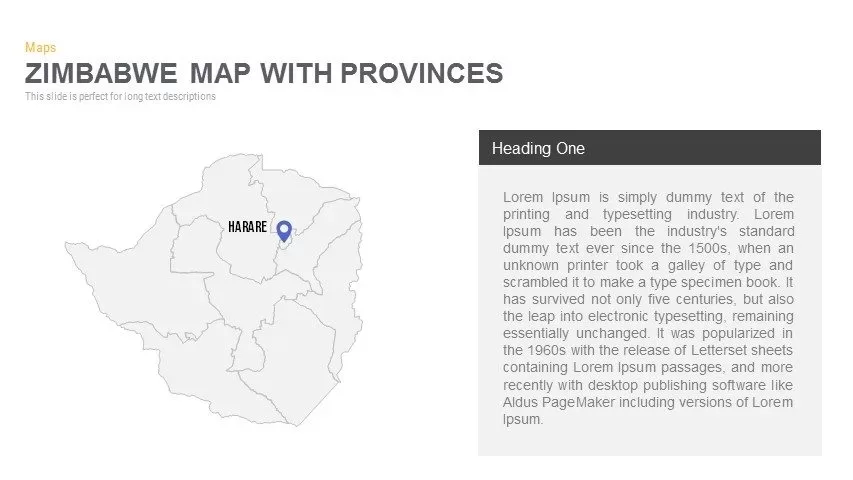
Zimbabwe Map with Provinces Slide Pack Template for PowerPoint & Google Slides
World Maps
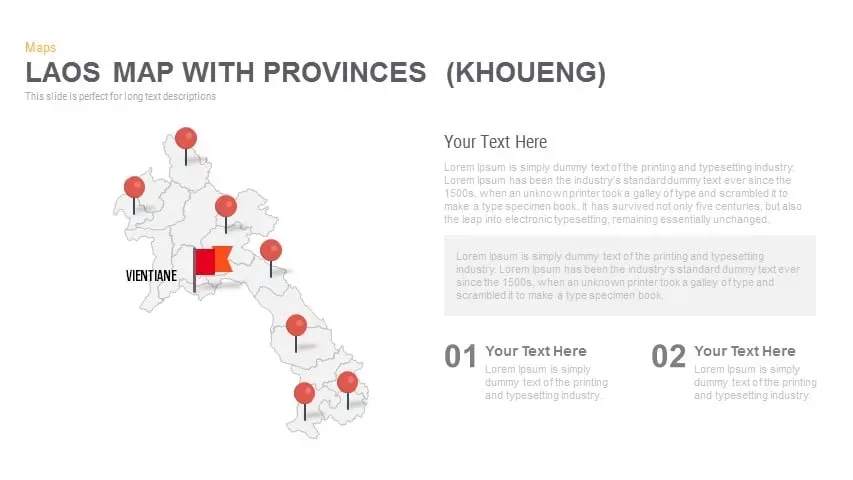
Laos Map with Provinces (Khoueng) Overview for PowerPoint & Google Slides
World Maps
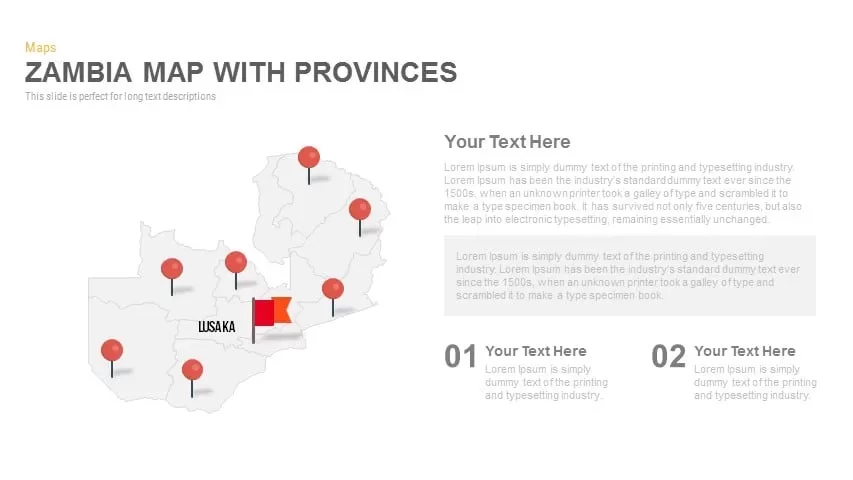
Zambia Map with Provinces Overview for PowerPoint & Google Slides
World Maps
Simple Multi-Branch Mind Map Template for PowerPoint & Google Slides
Mind Maps

Multi-Cluster Mind Map Infographic Template for PowerPoint & Google Slides
Mind Maps
Colorful Multi-Branch Mind Map Slide Template for PowerPoint & Google Slides
Mind Maps
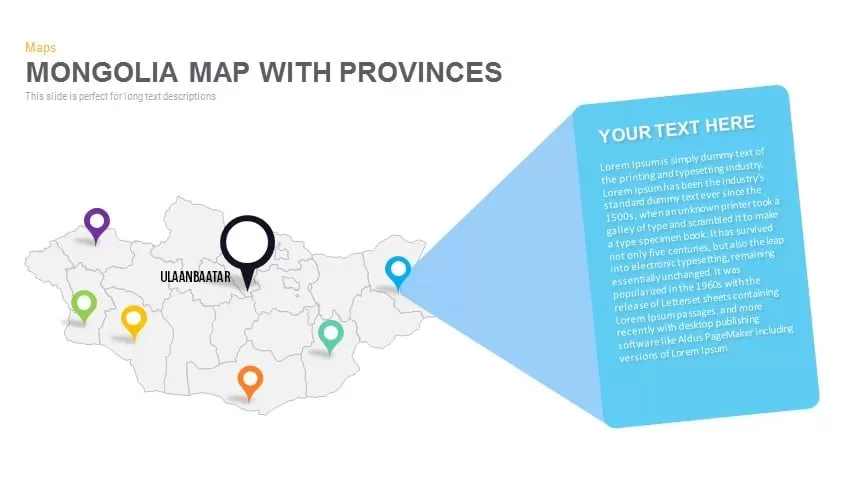
Mongolia Map With provinces PowerPoint and Keynote template
Maps
Smart Multi-Purpose PowerPoint Template for PowerPoint & Google Slides
Company Profile
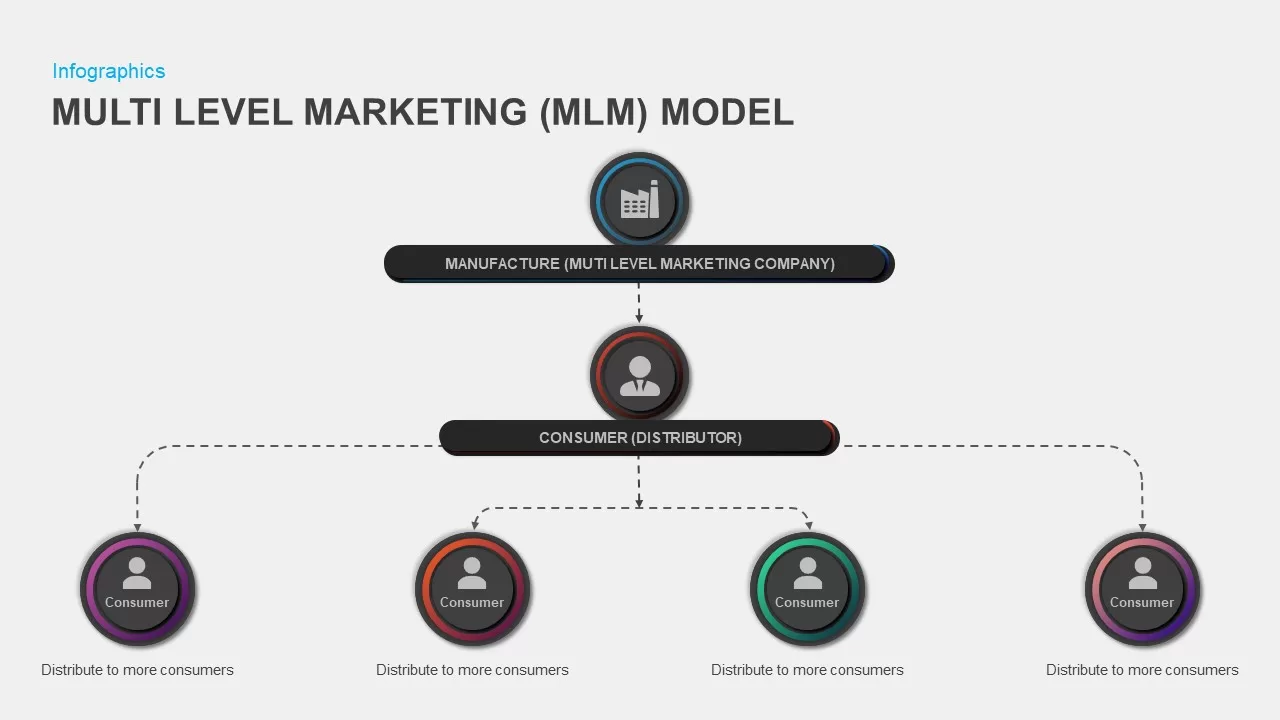
Multi-Level Marketing PowerPoint Template for PowerPoint & Google Slides
Business Models
Multi-Series Curved Line Graph Analytics Template for PowerPoint & Google Slides
Comparison Chart
Multi-Segment Circle Split Diagram template for PowerPoint & Google Slides
Circular
Horizontal Multi-Level Hierarchy Chart template for PowerPoint & Google Slides
Org Chart
Multi-Stage Timeline Infographics Template for PowerPoint & Google Slides
Timeline
Modern Multi-Section Circle Diagram Template for PowerPoint & Google Slides
Circular
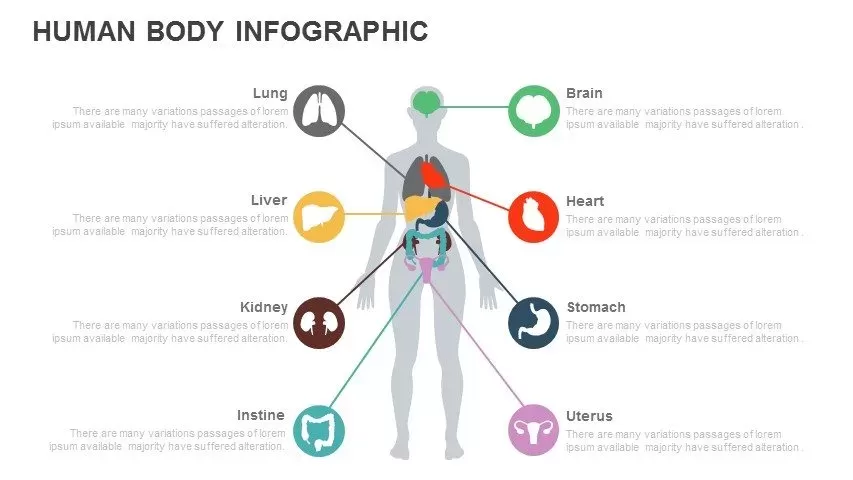
Multi-Organ Human Body Infographic Template for PowerPoint & Google Slides
Comparison
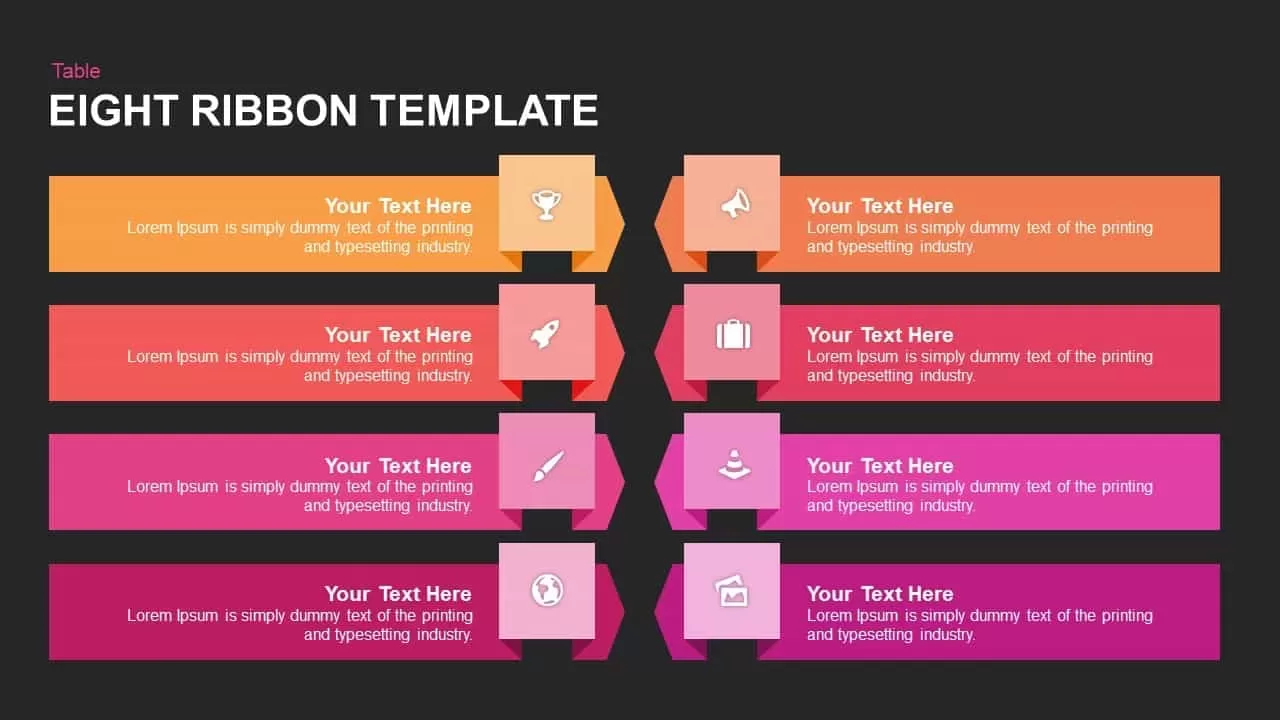
Multi-Color Eight-Step Ribbon Diagram Template for PowerPoint & Google Slides
Process
Multi-Style Presentation Agenda Template for PowerPoint & Google Slides
Agenda
Multi-Year Timeline Infographic Template for PowerPoint & Google Slides
Timeline
Multi-Style Project Life Cycle Diagram Template for PowerPoint & Google Slides
Process
Multi-Functional Presentation Template for PowerPoint & Google Slides
Pitch Deck
Multi-Purpose Corporate Infographic Template for PowerPoint & Google Slides
Company Profile
Free
Multi-Color Enneagram Circular Diagram Template for PowerPoint & Google Slides
Circular
Multi-Item Agenda Hub-and-Spoke Diagram Template for PowerPoint & Google Slides
Agenda
Doodle Multi Presentation Template for PowerPoint & Google Slides
Company Profile

Free Multi-Year Arrow Timeline Infographic Template for PowerPoint & Google Slides
Timeline
Free
Free Multi-Level Roadmap Infographic Template for PowerPoint & Google Slides
Roadmap
Free
Free Circular Multi-Step Flow Chart Diagram Template for PowerPoint & Google Slides
Flow Charts
Free
Multi-Style Flow Infographic Slide template for PowerPoint & Google Slides
Process
Multi-Color Five-Step Curved Arrow Template for PowerPoint & Google Slides
Process
Multi-Series Stacked Bar Chart Template for PowerPoint & Google Slides
Bar/Column
Animated Multi-Gear Cluster Infographic Template for PowerPoint & Google Slides
Process
Versatile 12-Month Multi-Style Timeline Template for PowerPoint & Google Slides
Timeline
Minimal Multi-Year Column Chart Template for PowerPoint & Google Slides
Bar/Column
Editable Multi-Series Peak Line Chart Template for PowerPoint & Google Slides
Comparison Chart
Multi-Style Event Timeline Agenda Template for PowerPoint & Google Slides
Timeline
Multi-Series Line Chart with Icons Template for PowerPoint & Google Slides
Comparison Chart
Multi-Series Vertical Dot Chart Template for PowerPoint & Google Slides
Comparison Chart
Delivery Timeline Multi-Row Template for PowerPoint & Google Slides
Timeline
Multi-Variation Thermometer Chart Template for PowerPoint & Google Slides
Bar/Column
Interactive Multi-Use Cost Comparison Template for PowerPoint & Google Slides
Comparison
Multi-Style Clock Chart Diagram Template for PowerPoint & Google Slides
Circular
Multi-Variation Circular Chart Diagram Template for PowerPoint & Google Slides
Circular
Free Editable Multi-Step Ribbon Agenda Slide Template for PowerPoint & Google Slides
Agenda
Free
Multi-Phase Research Roadmap Infographic Template for PowerPoint & Google Slides
Roadmap
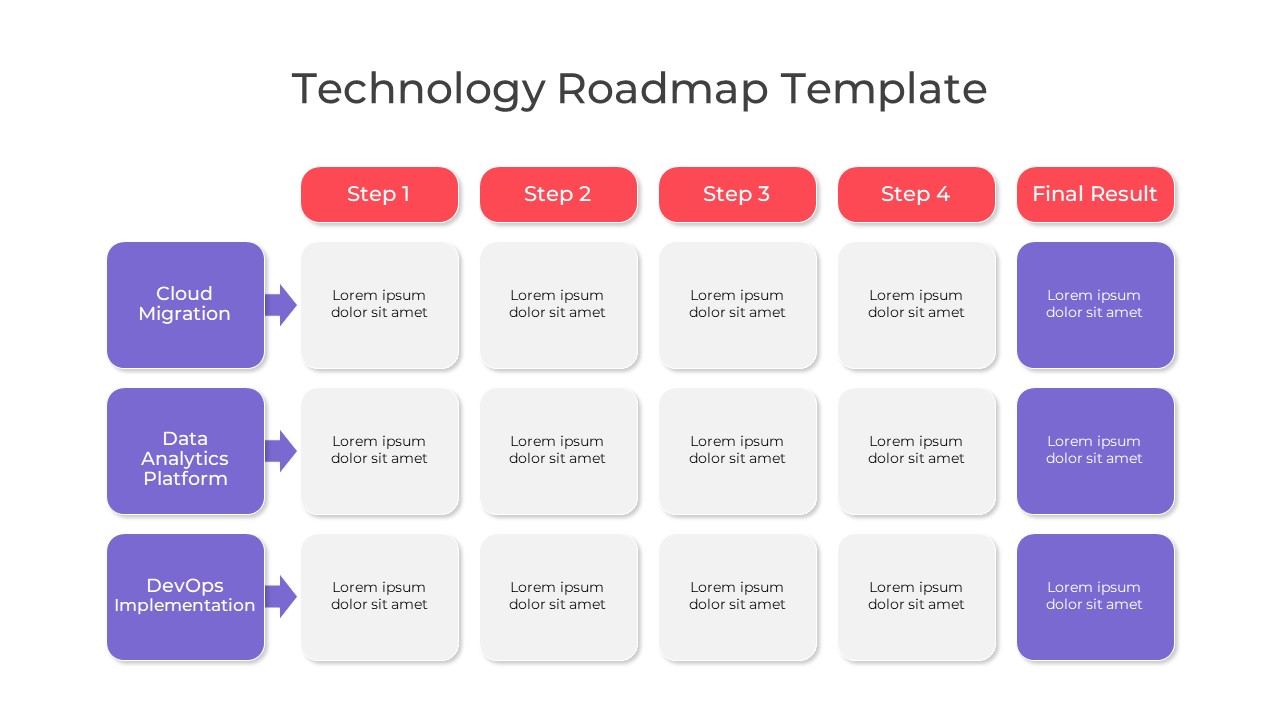
Multi-Color Technology Roadmap Template Pack for PowerPoint & Google Slides
Roadmap
Modern Multi-Color Polar Chart Diagram Template for PowerPoint & Google Slides
Charts
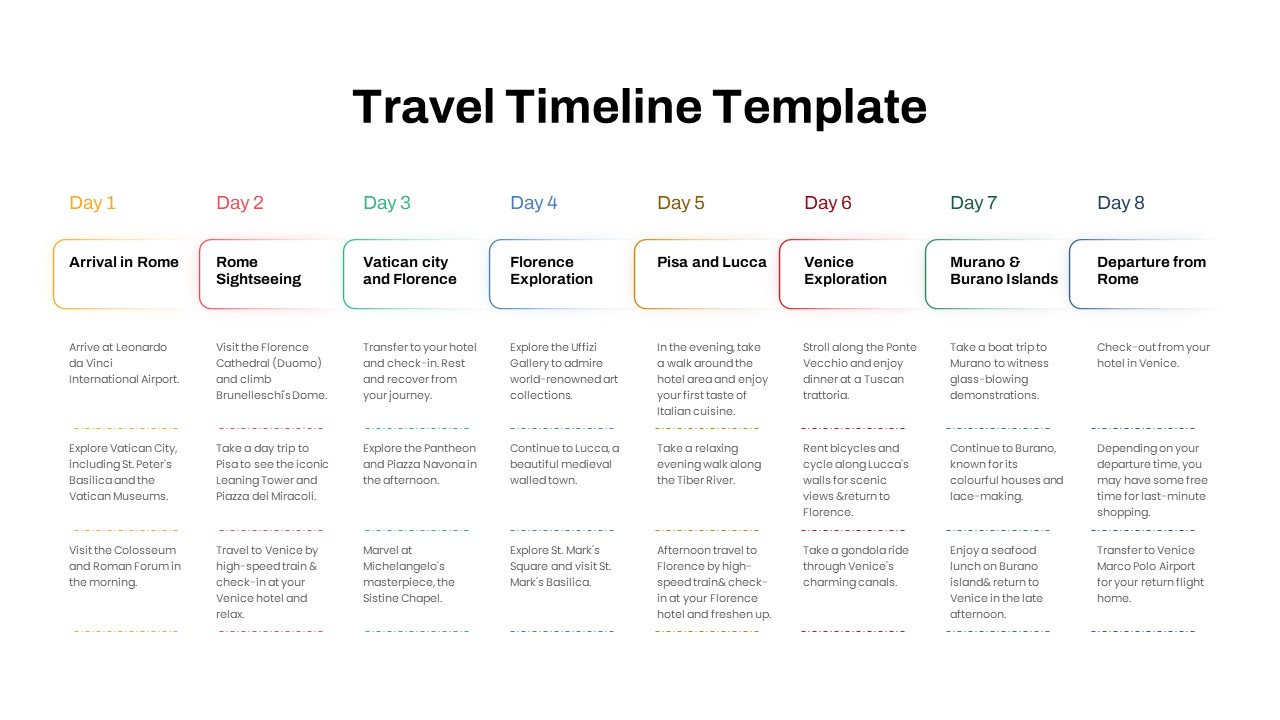
Free Elegant Multi-Day Travel Timeline Template for PowerPoint & Google Slides
Timeline
Free
Multi-Level Wheel Chart Diagram template for PowerPoint & Google Slides
Pie/Donut
Multi-Level Colorful Pyramid Chart Template for PowerPoint & Google Slides
Pyramid
Free Multi-Step Funnel Infographic Slide Pack Template for PowerPoint & Google Slides
Funnel
Free
Free Minimal Multi-Color Table of Contents Template for PowerPoint & Google Slides
Agenda
Free
Multi-color Curved Timeline Roadmap Template for PowerPoint & Google Slides
Timeline
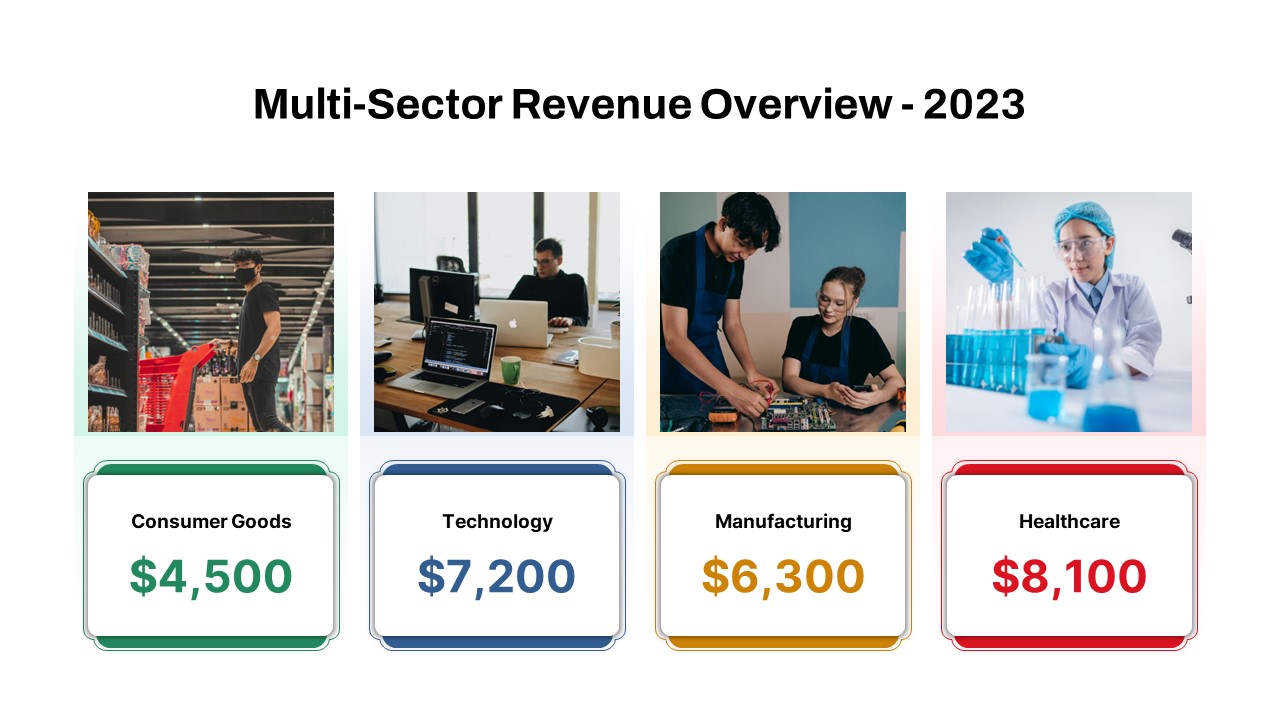
Multi-Sector Revenue Breakdown Cards Template for PowerPoint & Google Slides
Comparison
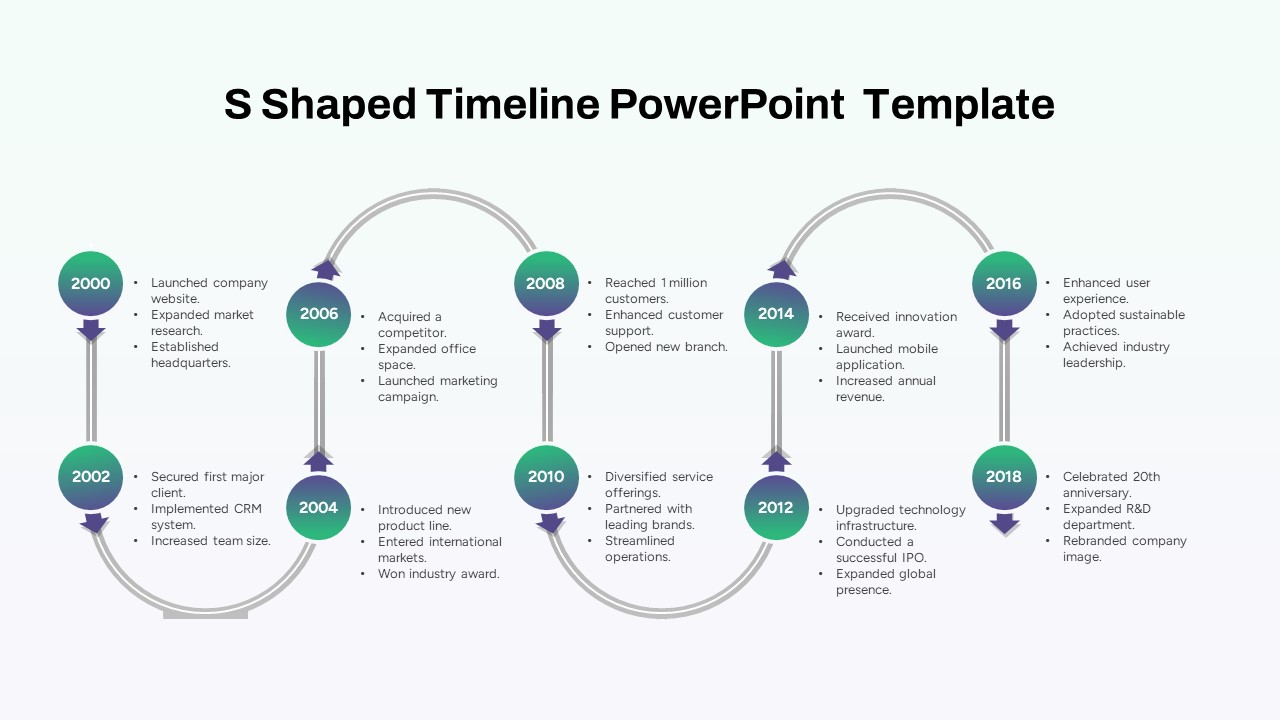
Multi-Year S-Shaped Roadmap Timeline Template for PowerPoint & Google Slides
Timeline
Multi-Style Board of Directors Profile Template for PowerPoint & Google Slides
Our Team
Multi-Point Diagram Presentation Template for PowerPoint & Google Slides
Process
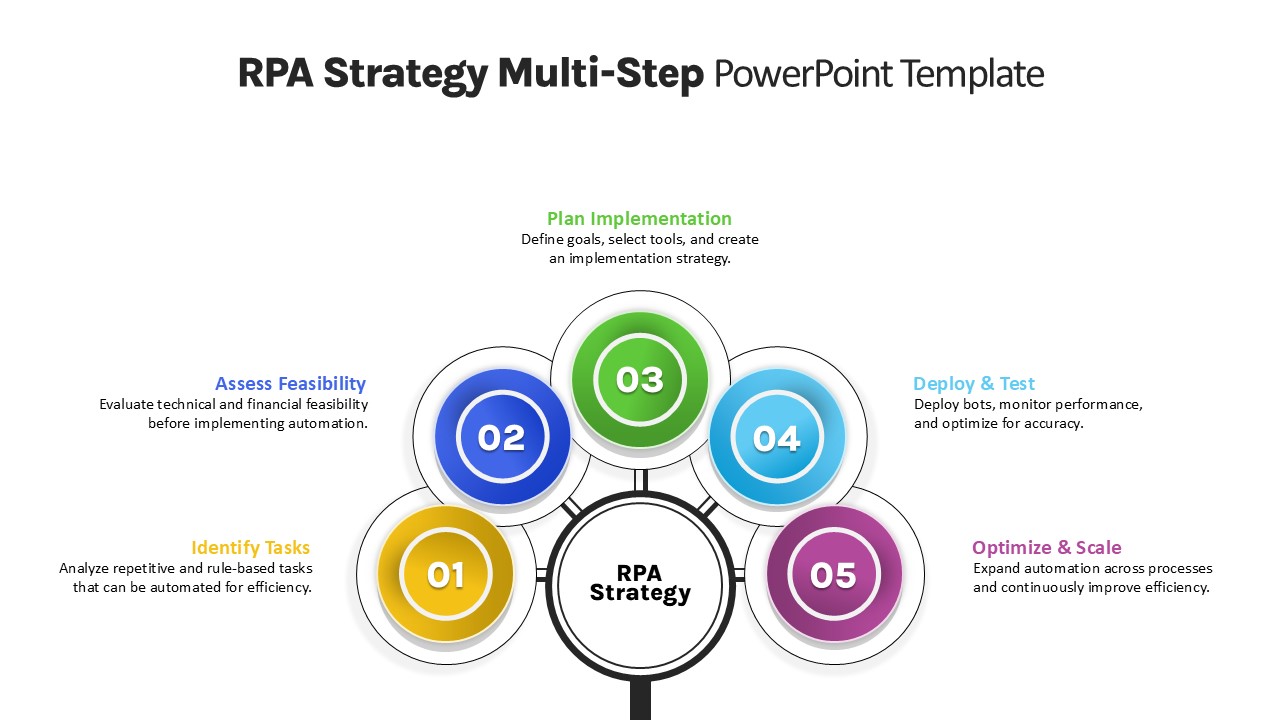
RPA Strategy Multi-Step Diagram Template for PowerPoint & Google Slides
Process
Animated Multi-Milestone Roadmap Template for PowerPoint & Google Slides
Roadmap
Multi-Column Table Presentation Template for PowerPoint & Google Slides
Table
Six-Row Multi-Column Table Presentation Template for PowerPoint & Google Slides
Table
Multi Color SWOT Analysis Quadrant Template for PowerPoint & Google Slides
SWOT
Client Testimonials Feedback Layout Template for PowerPoint & Google Slides
Infographics
Modern 5-Stage Folder Agenda Layout Template for PowerPoint & Google Slides
Agenda
Free Comic Book Panel Layout Template for PowerPoint & Google Slides
Free
Free
Four-Step Business Agenda Slide Layout Template for PowerPoint & Google Slides
Agenda
3D Five-Step Roadmap Diagram Slide Layout Template for PowerPoint & Google Slides
Roadmap
Six-Part Hexagon Infographic Layout Template for PowerPoint & Google Slides
Infographics
Photo Gallery Team Introduction Layout Template for PowerPoint & Google Slides
Graphics
Elegant Diamond Photo Grid Layout Template for PowerPoint & Google Slides
Graphics
Modern Mosaic Photo Grid Layout Template for PowerPoint & Google Slides
Graphics
Creative Photo Collage Grid Layout Template for PowerPoint & Google Slides
Graphics
Dessert Photo Collage Grid Layout Template for PowerPoint & Google Slides
Graphics
Modern Cosmetics Photo Collage Layout Template for PowerPoint & Google Slides
Graphics
Three-Step Reference Slide Layout Template for PowerPoint & Google Slides
Infographics
Free Elegant Executive Quote Slide Layout Template for PowerPoint & Google Slides
Our Team
Free
Free Balanced Scorecard Quadrant KPI Layout Template for PowerPoint & Google Slides
Employee Performance
Free
Free Q&A Layout with Four Answer Pods Template for PowerPoint & Google Slides
Free
Free

Medical Hexagon Layout Presentation Template for PowerPoint & Google Slides
Health
Today’s Panelists Profile Layout Template for PowerPoint & Google Slides
Our Team
Versatile 6 Options Infographic Layout Template for PowerPoint & Google Slides
Process
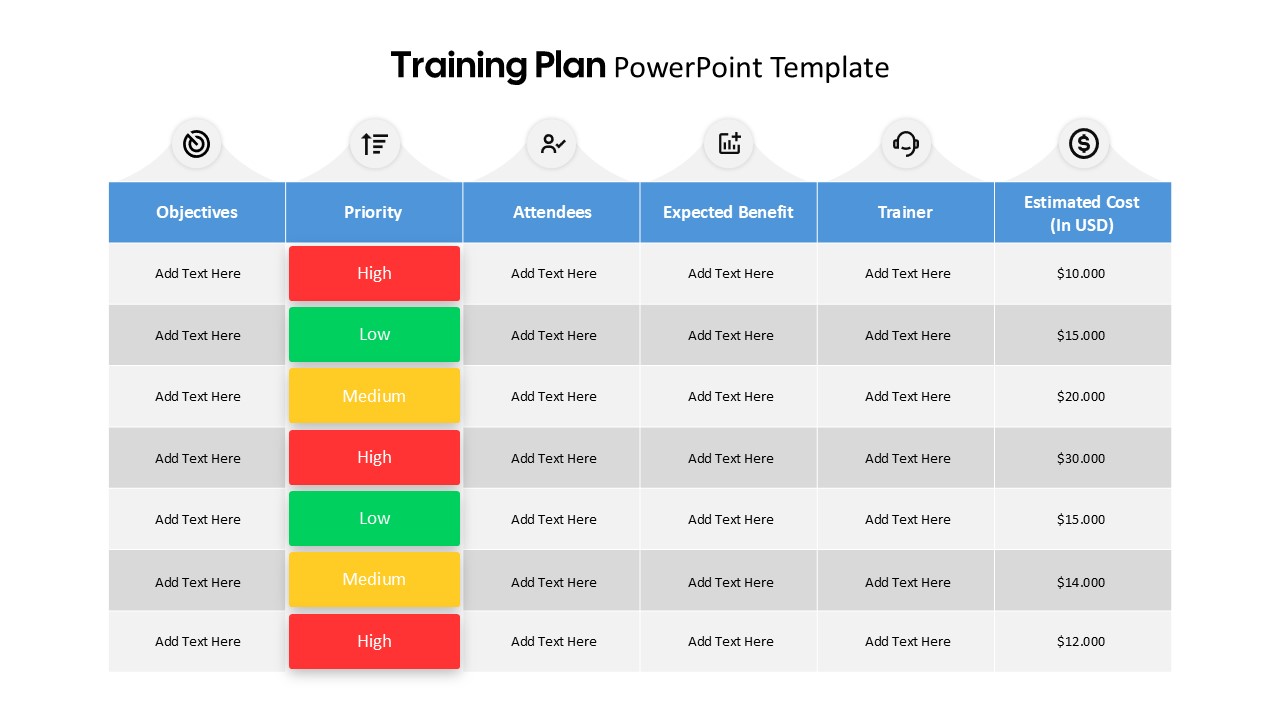
Training Plan Table Layout Template for PowerPoint & Google Slides
Employee Performance
Team & Expertise Profile Layout Template for PowerPoint & Google Slides
Our Team