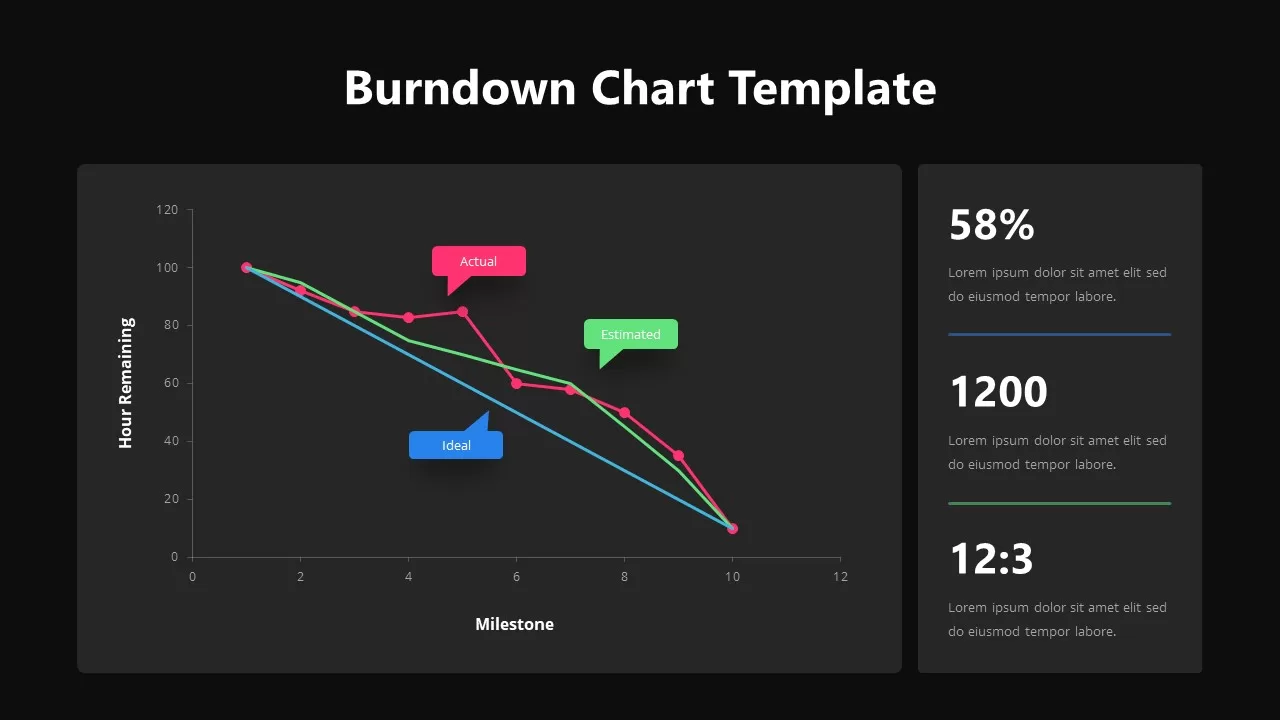
Burndown Chart Template for PowerPoint & Google Slides


Description
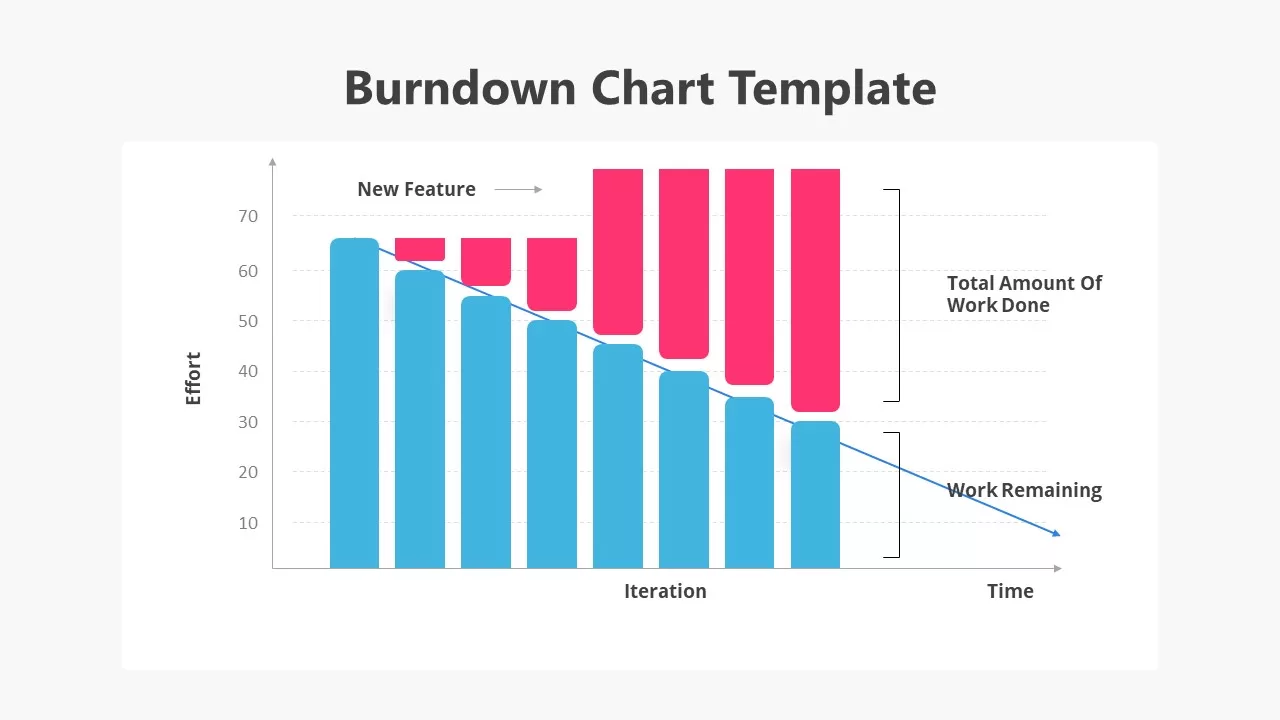
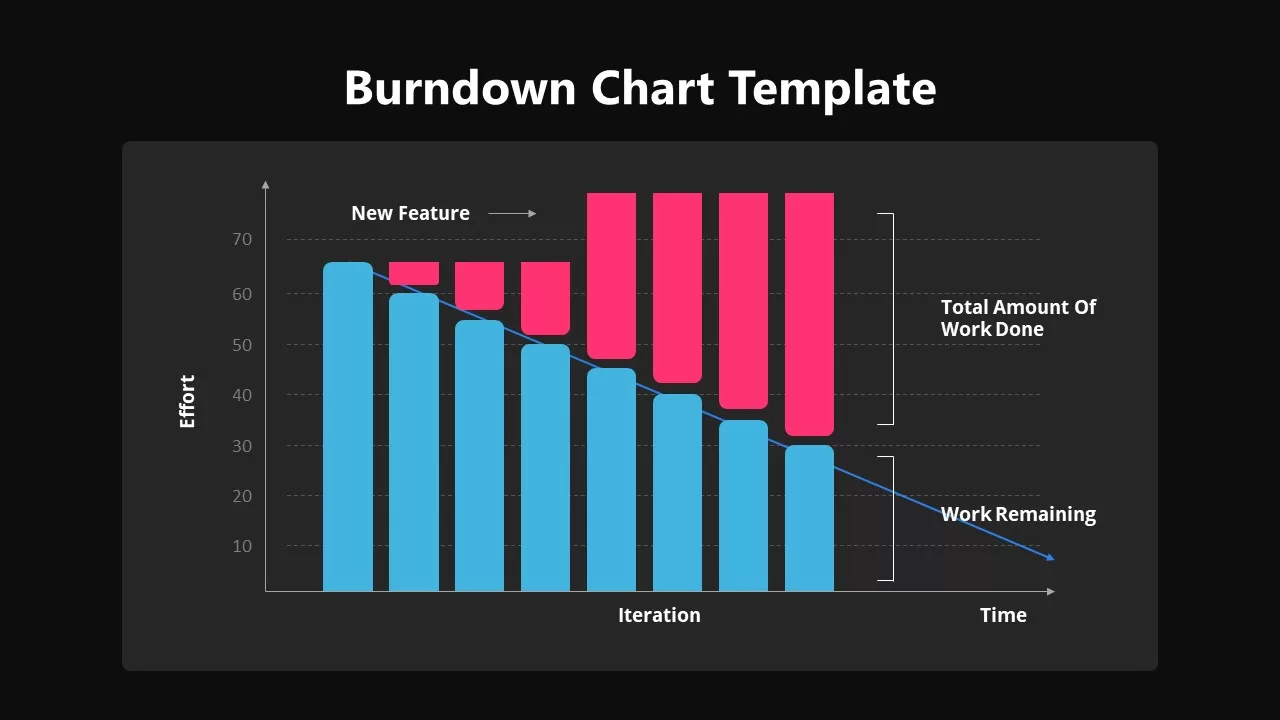
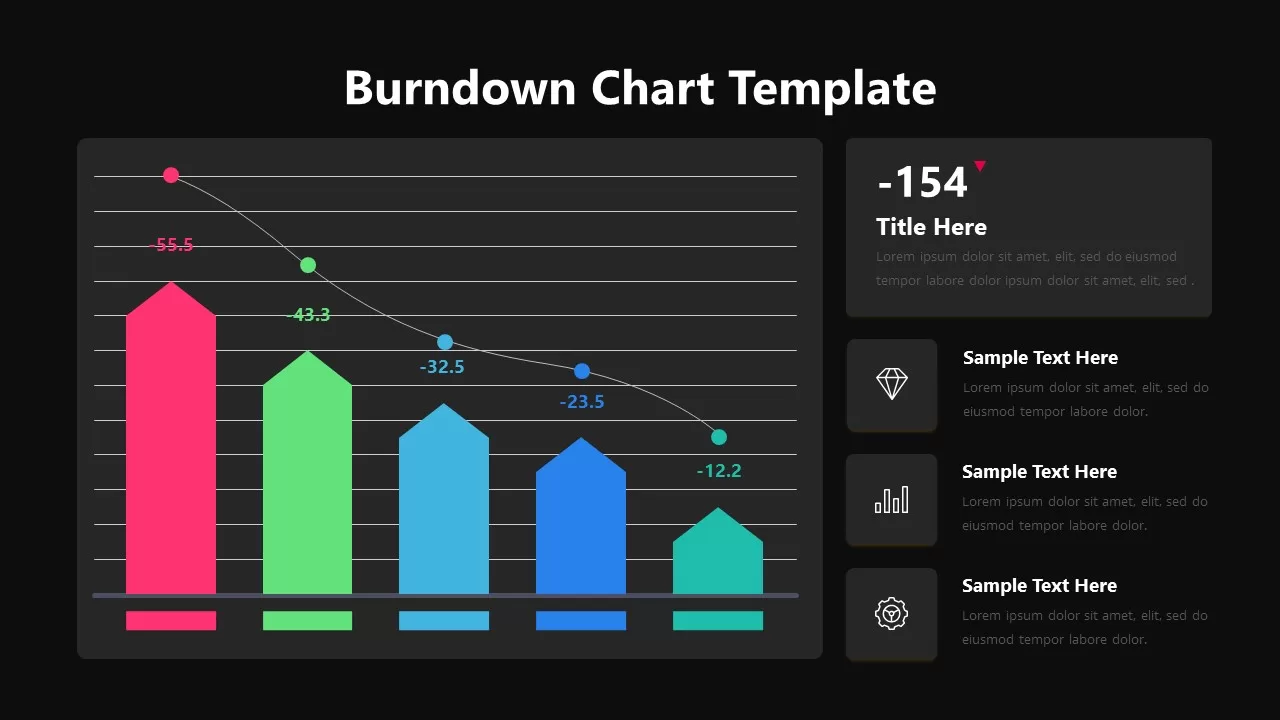
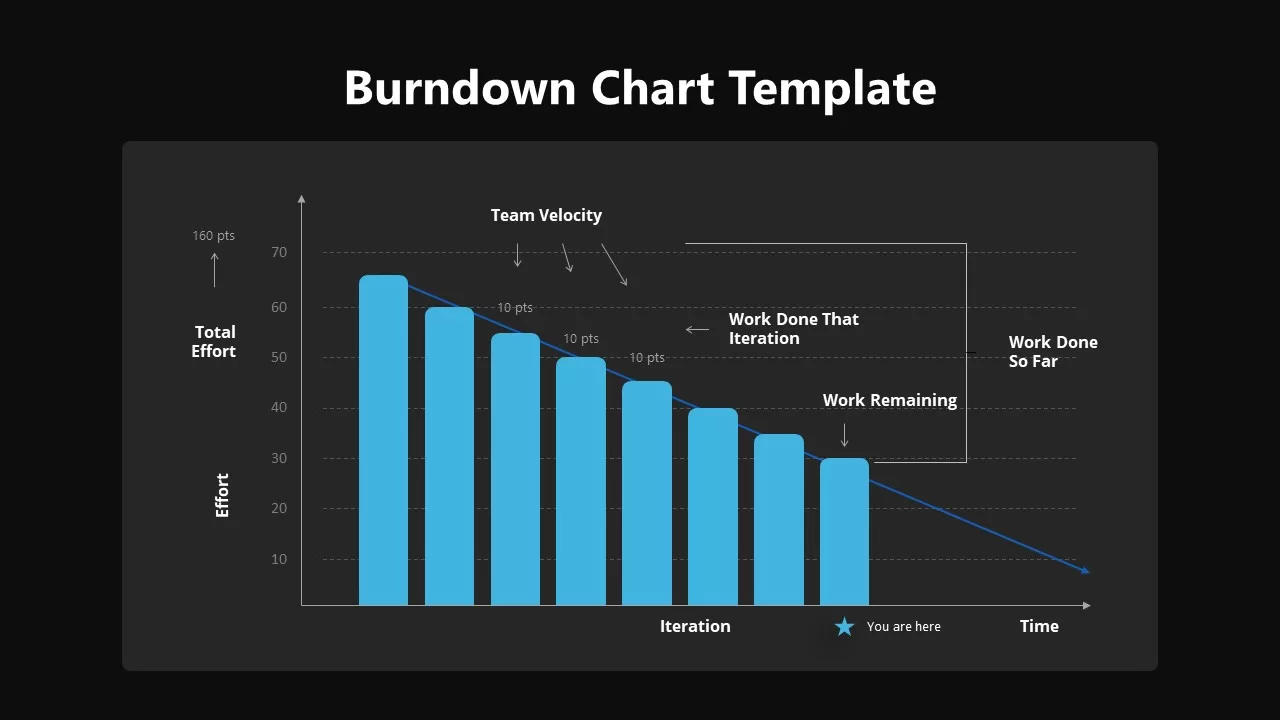
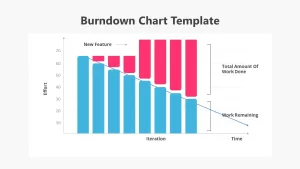
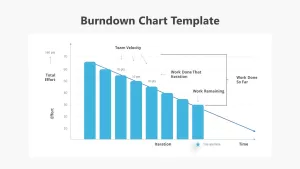
The Burndown Chart Template provides a clean and modern design to visualize project progress over time. Perfect for tracking the remaining effort against the planned milestones, this template displays your data in easily understandable charts, whether you are measuring effort, time, or progress. The template is ideal for teams working on agile projects, such as Scrum, where tracking work completion in real time is critical.
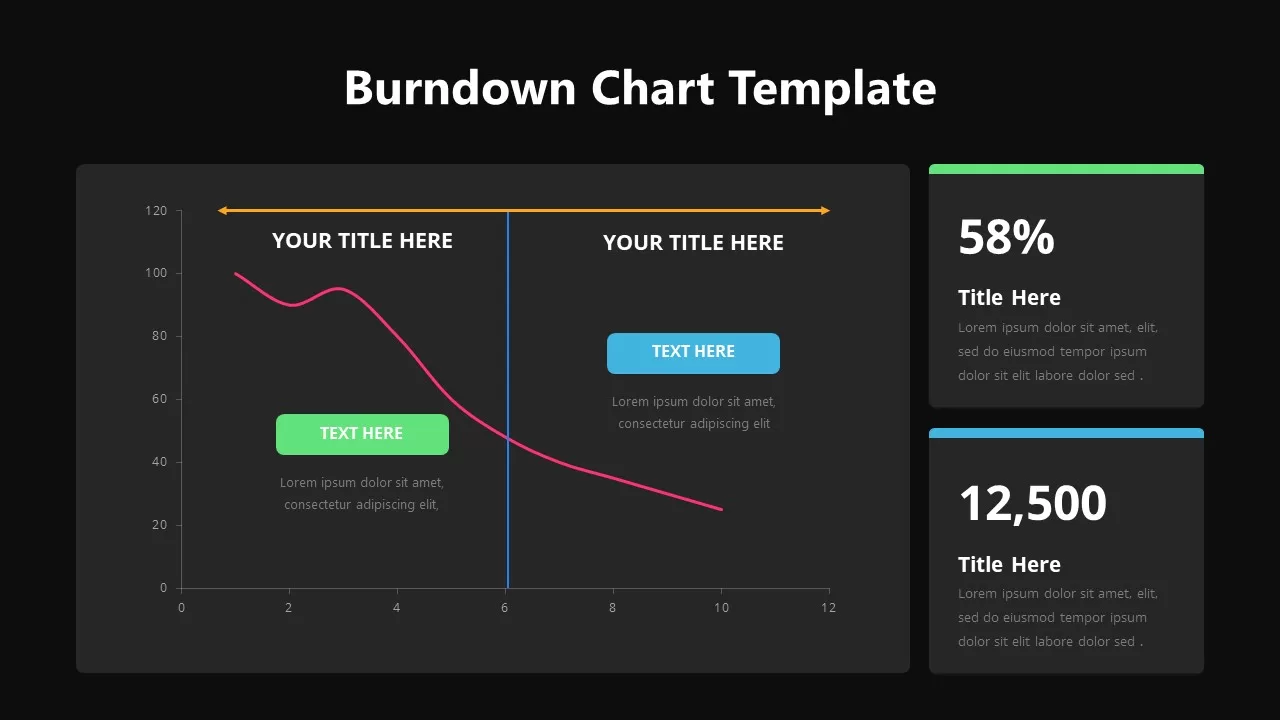
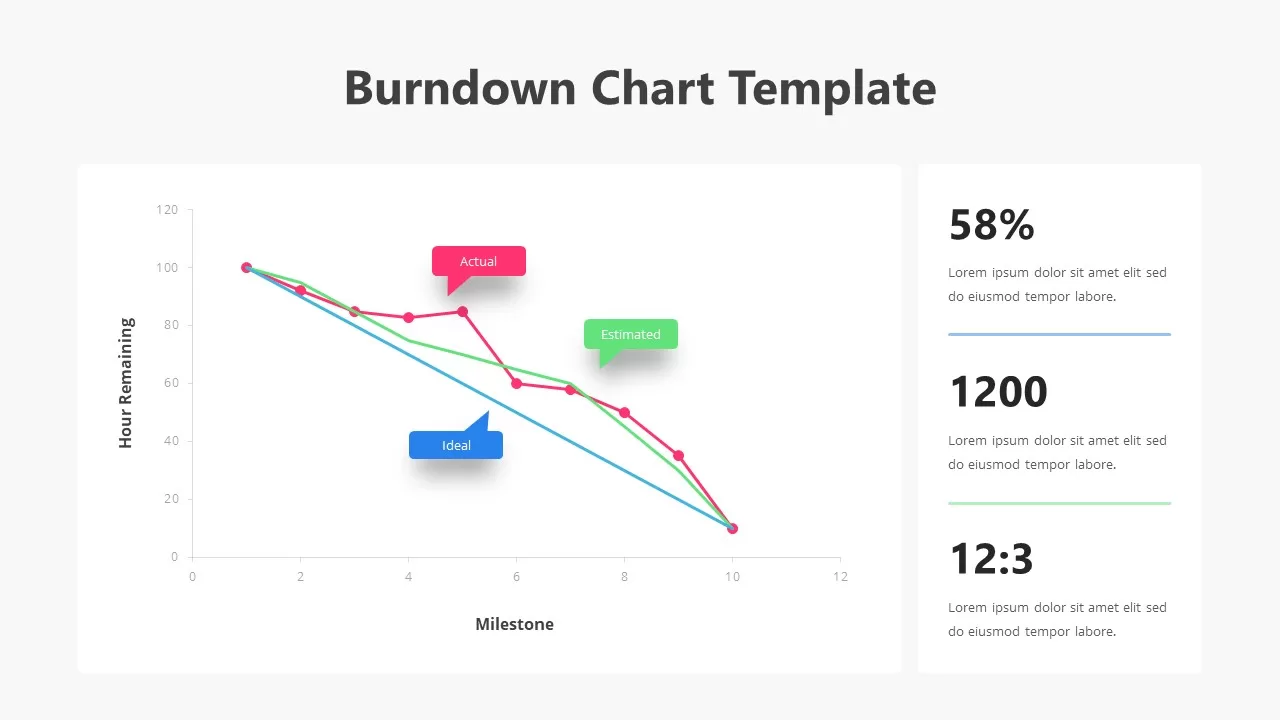
The template includes several editable charts, such as line graphs and bar charts, to help you compare the actual progress with estimated or ideal outcomes. With fully customizable text boxes and data placeholders, you can tailor the presentation to fit your project’s unique details. This visually engaging template enables you to represent key metrics like total work, work done so far, work remaining, and team velocity, all with clear, colorful graphics. It’s a great tool for project managers and teams to communicate progress to stakeholders and make data-driven decisions in real-time.
Who is it for
This Burndown Chart Template is ideal for project managers, Scrum masters, agile teams, and anyone involved in tracking project progress. It’s especially useful for teams working in software development, product management, or any field using agile methodologies. Consultants, trainers, and business analysts can also leverage this template to present project progress in meetings, workshops, or client briefings.
Other Uses
In addition to tracking agile project progress, this template can also be adapted for performance tracking, budget monitoring, or any project that involves milestones and timelines. You can use the charts to represent various types of progress, like sales goals, milestone achievements, or personal development tracking. Whether for internal team communication or client presentations, the burndown chart can easily be customized for different uses.
Login to download this file

Item ID
SB02163
Related Templates

Quad Chart Infographic Pack of 8 Slides Template for PowerPoint & Google Slides
Comparison Chart
Free Professional Gantt Chart Pack – 4 Slides Template for PowerPoint & Google Slides
Gantt Chart
Free
Free 3D Pie Chart template for PowerPoint & Google Slides
Pie/Donut
Free
Mobile Data Analysis Chart template for PowerPoint & Google Slides
Charts
Creative Data Analysis Bar Chart template for PowerPoint & Google Slides
Bar/Column
Donut Chart template for PowerPoint & Google Slides
Pie/Donut
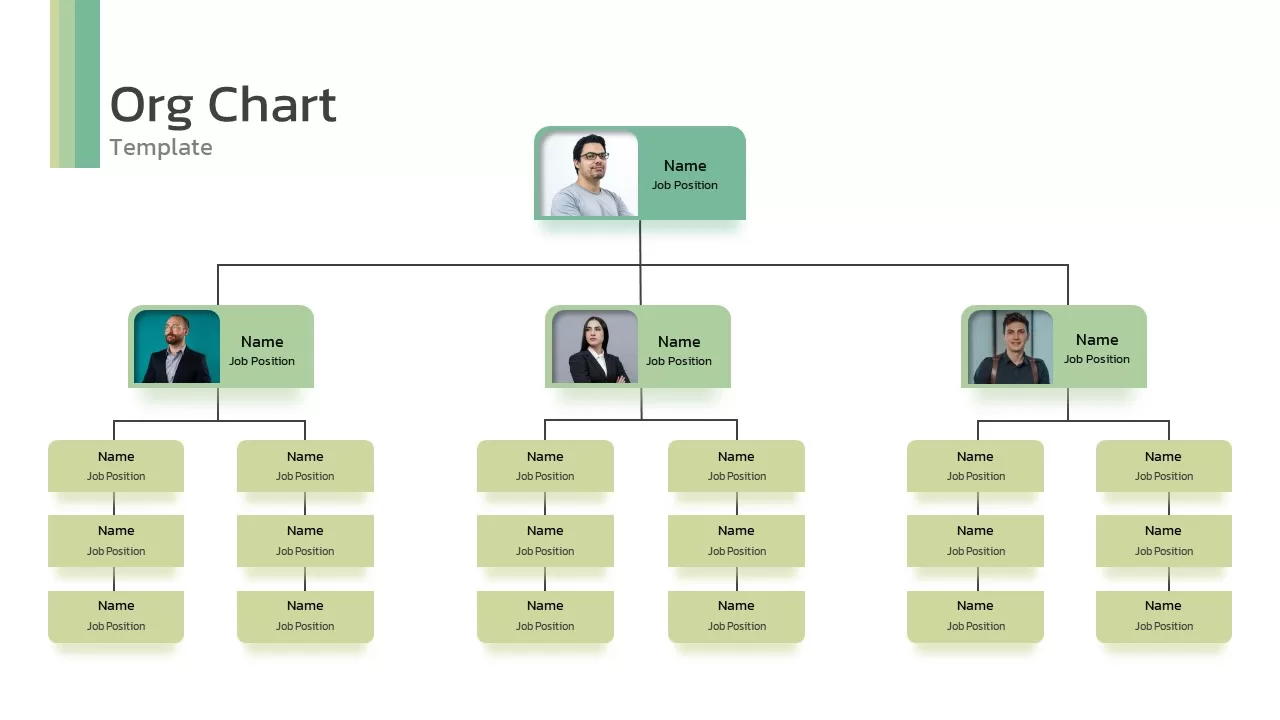
Organization Chart template for PowerPoint & Google Slides
Org Chart
Donut Chart Split Template for PowerPoint & Google Slides
Charts
Comparison Bar Chart template for PowerPoint & Google Slides
Comparison Chart
Three-Year Bar Chart template for PowerPoint & Google Slides
Charts
3D Cylinder Bar Chart Template for PowerPoint & Google Slides
Bar/Column
Isometric Organization Chart Diagram Template for PowerPoint & Google Slides
Org Chart
Success Key Diagram with Donut Chart Template for PowerPoint & Google Slides
Pie/Donut
Market Development Matrix Chart Template for PowerPoint & Google Slides
Comparison Chart
Business Opportunity Pie Chart Template for PowerPoint & Google Slides
Pie/Donut
Relationship Chart template for PowerPoint & Google Slides
Flow Charts
Horizontal Multi-Level Hierarchy Chart template for PowerPoint & Google Slides
Org Chart

Monthly Reports Bar Chart template for PowerPoint & Google Slides
Bar/Column

Product Usage Analytics Dashboard Chart Template for PowerPoint & Google Slides
Bar/Column
Sales vs Budget Performance Chart Template for PowerPoint & Google Slides
Bar/Column
Company Objective Linear Chart Template for PowerPoint & Google Slides
Flow Charts

Multilevel Hierarchy Organization Chart template for PowerPoint & Google Slides
Org Chart
Organization Chart Overview template for PowerPoint & Google Slides
Org Chart
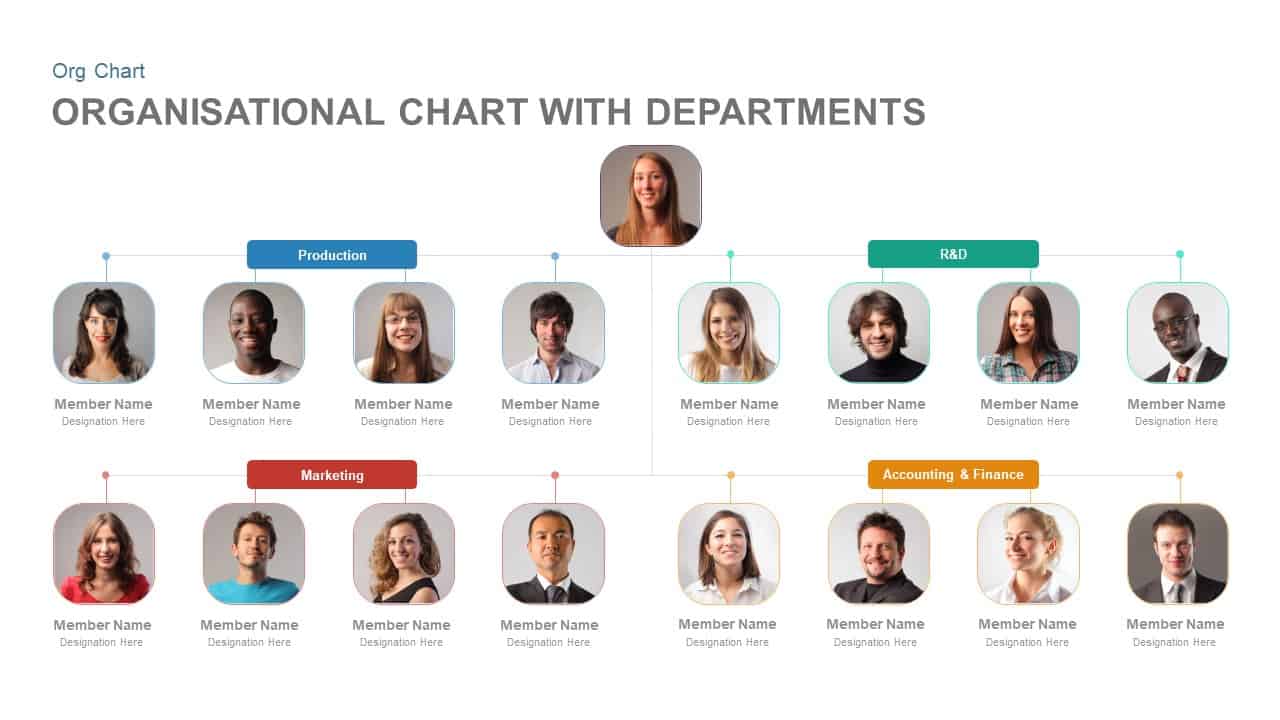
Organisational Chart with Departments Template for PowerPoint & Google Slides
Org Chart
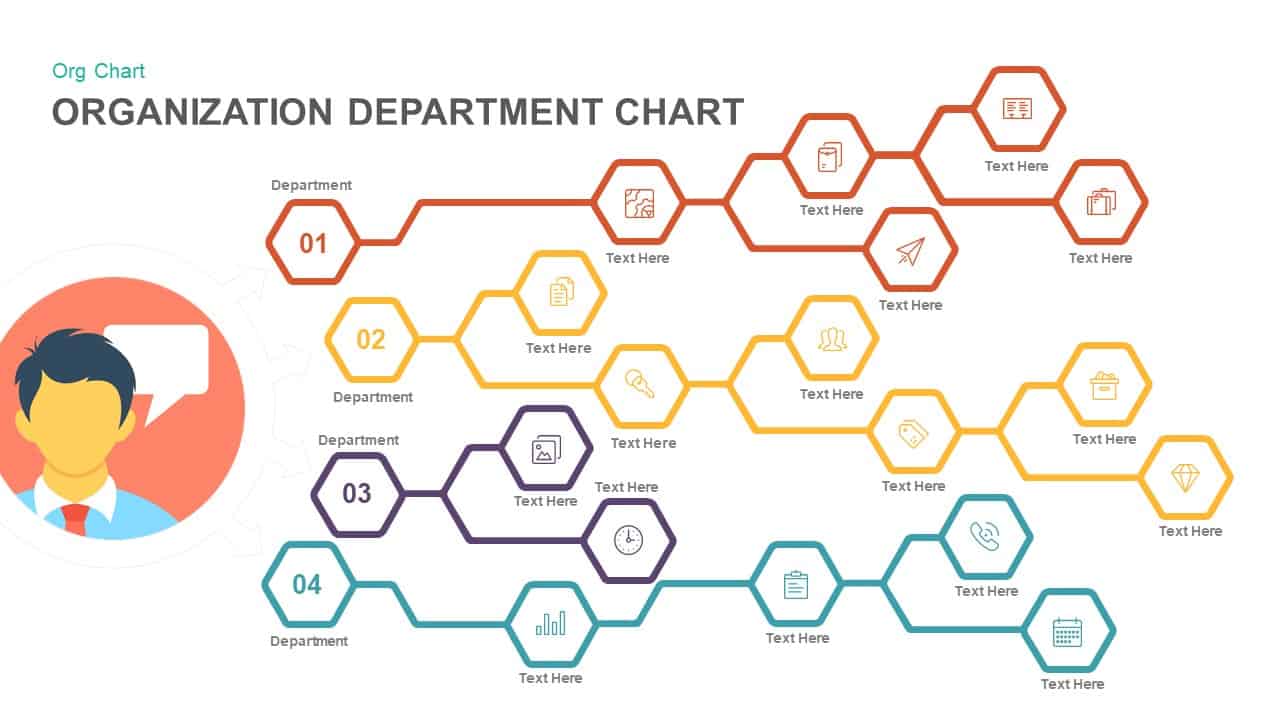
Organization Department Hexagon Chart Template for PowerPoint & Google Slides
Org Chart
Corporate Organizational Chart Hierarchy Template for PowerPoint & Google Slides
Org Chart
For and Against Vote Count Bar Chart Template for PowerPoint & Google Slides
Bar/Column
Entertainment Industry Revenue Bar Chart Template for PowerPoint & Google Slides
Bar/Column
Car Sales Market Share Pie Chart Template for PowerPoint & Google Slides
BCG
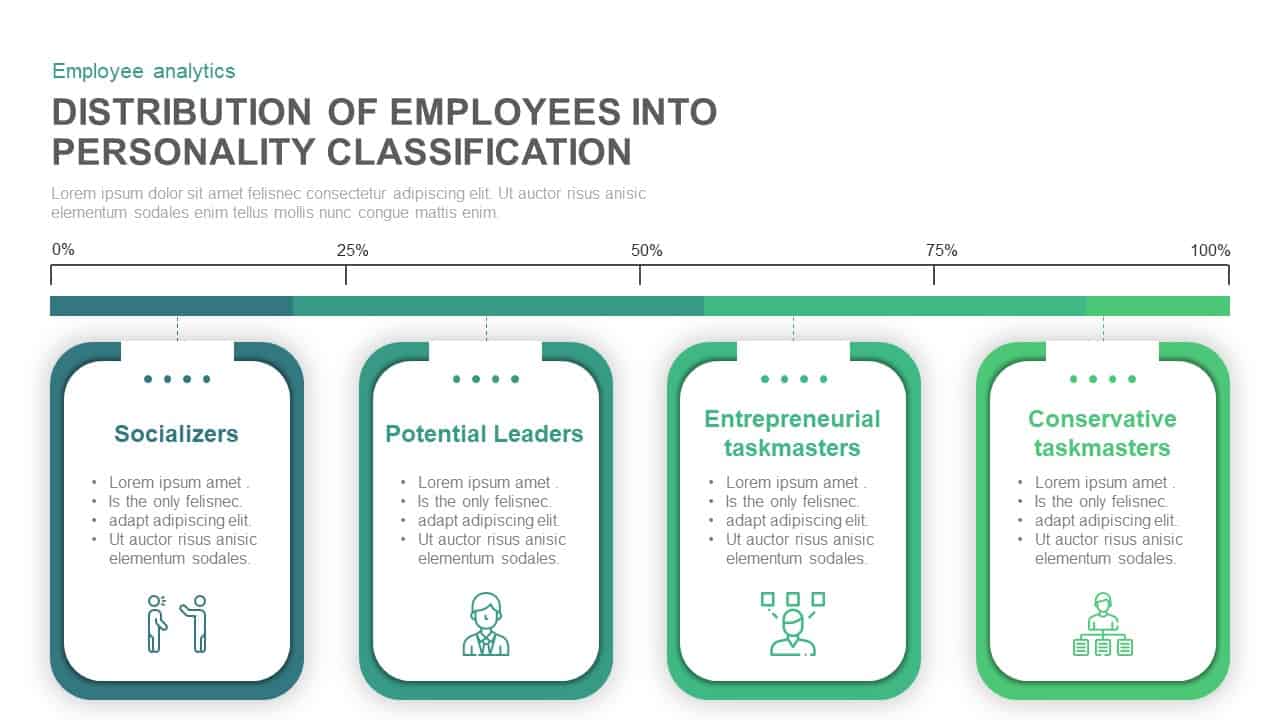
Employee Personality Distribution Chart Template for PowerPoint & Google Slides
Bar/Column

BMI Category Comparison Chart Template for PowerPoint & Google Slides
Comparison
Circular Product Comparison Chart Template for PowerPoint & Google Slides
Comparison Chart
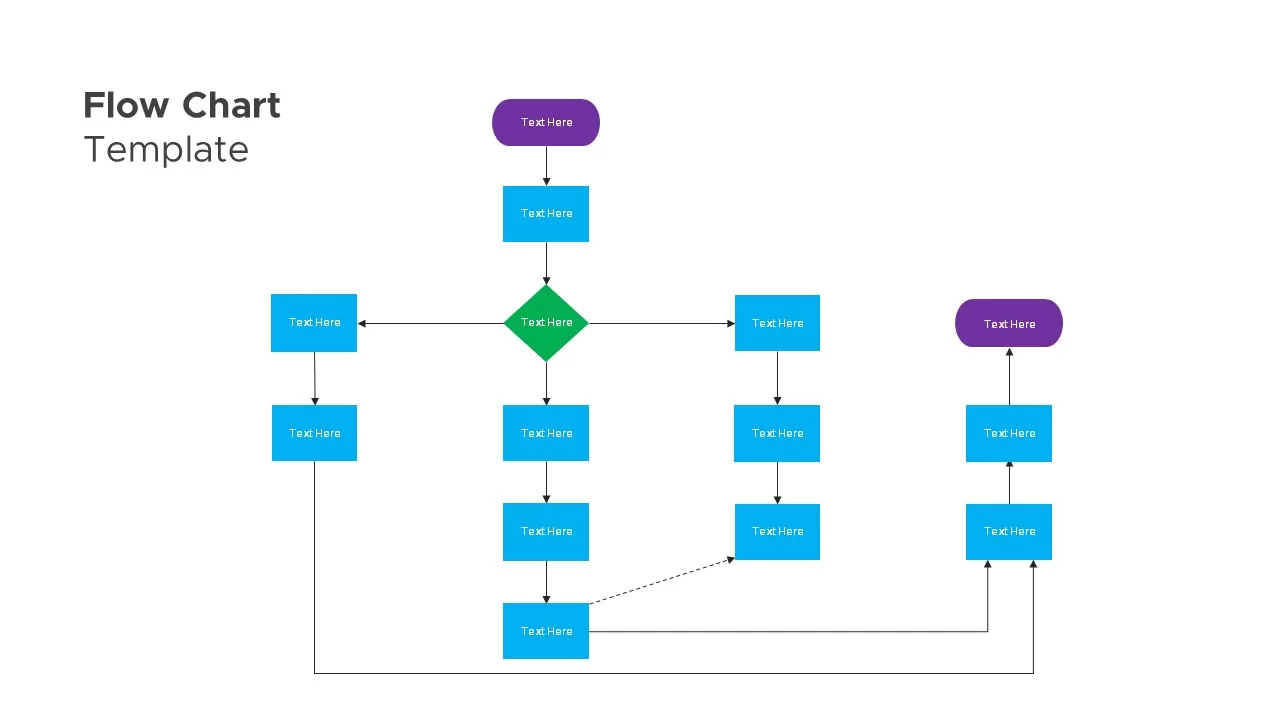
Flow Chart Diagram Template for PowerPoint & Google Slides
Flow Charts
Creative Organizational Chart Template for PowerPoint & Google Slides
Org Chart
30-60-90 Day Donut Chart Plan Infographic Template for PowerPoint & Google Slides
Timeline
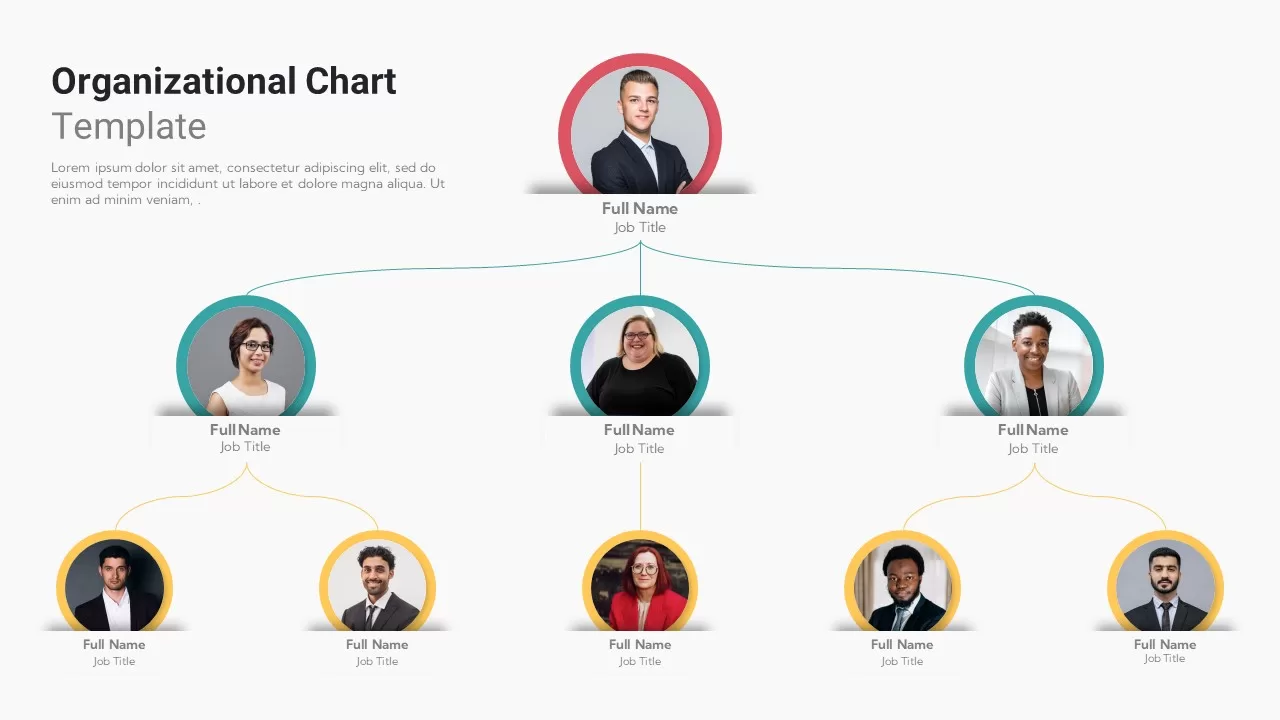
Modern Photo-Based Organizational Chart Template for PowerPoint & Google Slides
Org Chart
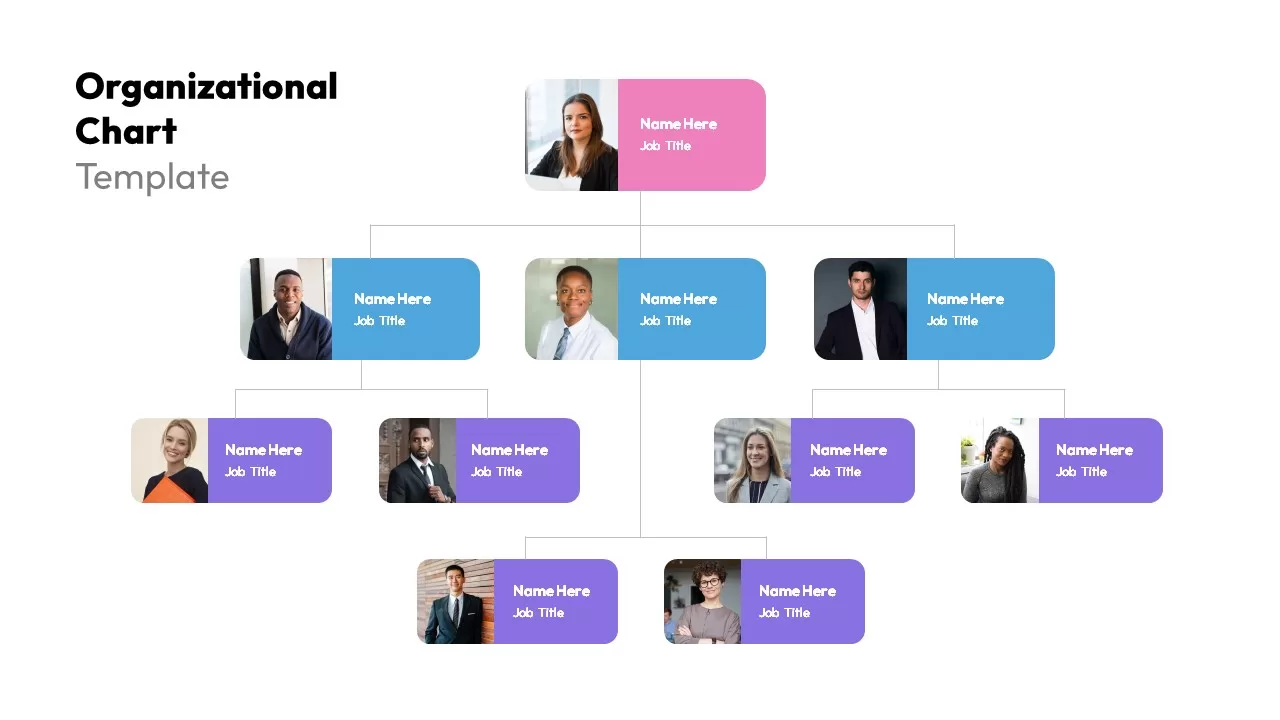
Modern Image-Based Organizational Chart Template for PowerPoint & Google Slides
Infographics
Organizational Chart Overview template for PowerPoint & Google Slides
Org Chart
Org Chart Structure template for PowerPoint & Google Slides
Org Chart
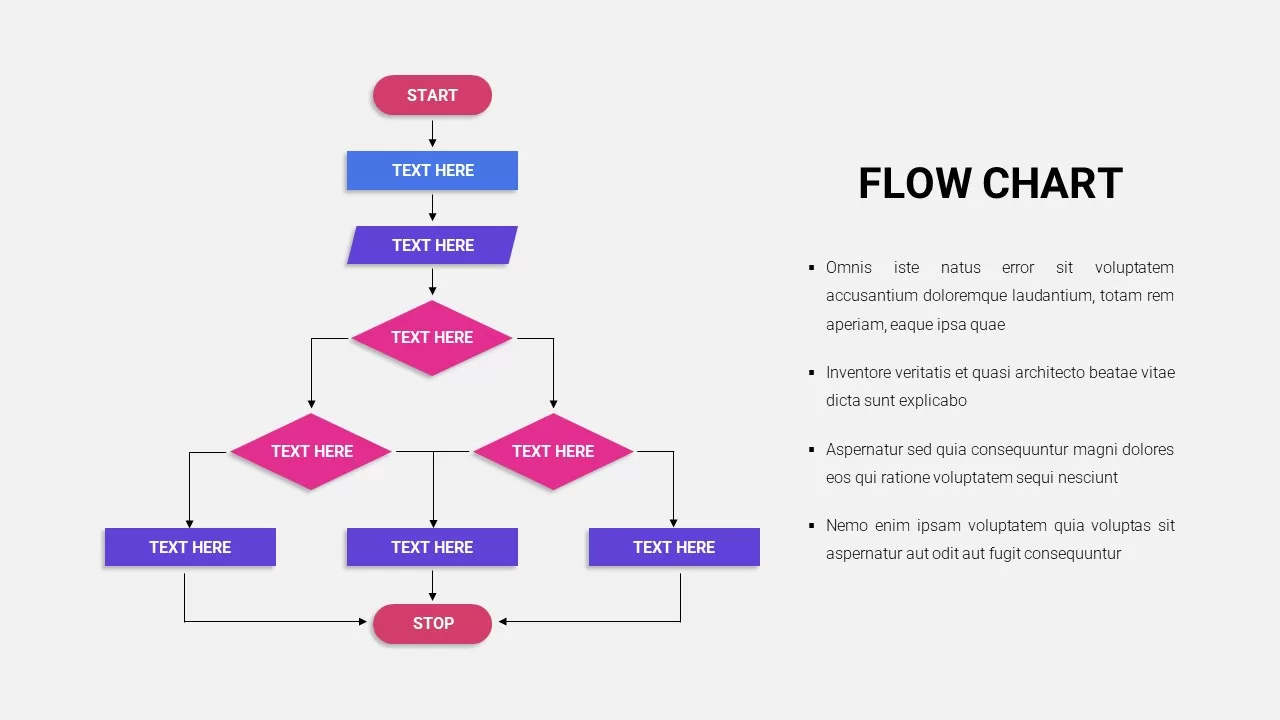
Flow Chart Template for PowerPoint & Google Slides
Flow Charts
Flow Chart Template for PowerPoint & Google Slides
Flow Charts
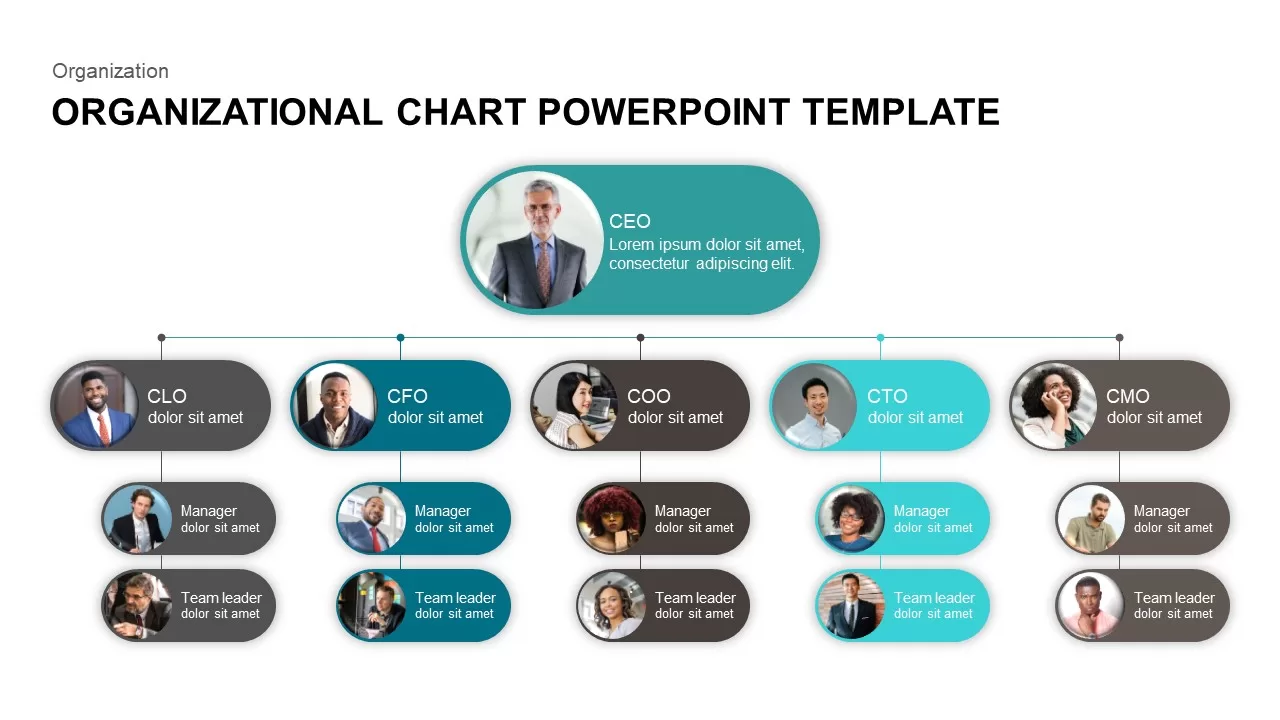
Organizational Chart template for PowerPoint & Google Slides
Org Chart
Free Circular Multi-Step Flow Chart Diagram Template for PowerPoint & Google Slides
Flow Charts
Free
Free Curved Arrow Progress Chart template for PowerPoint & Google Slides
Project
Free
Interactive Project Gantt Chart Timeline Template for PowerPoint & Google Slides
Gantt Chart
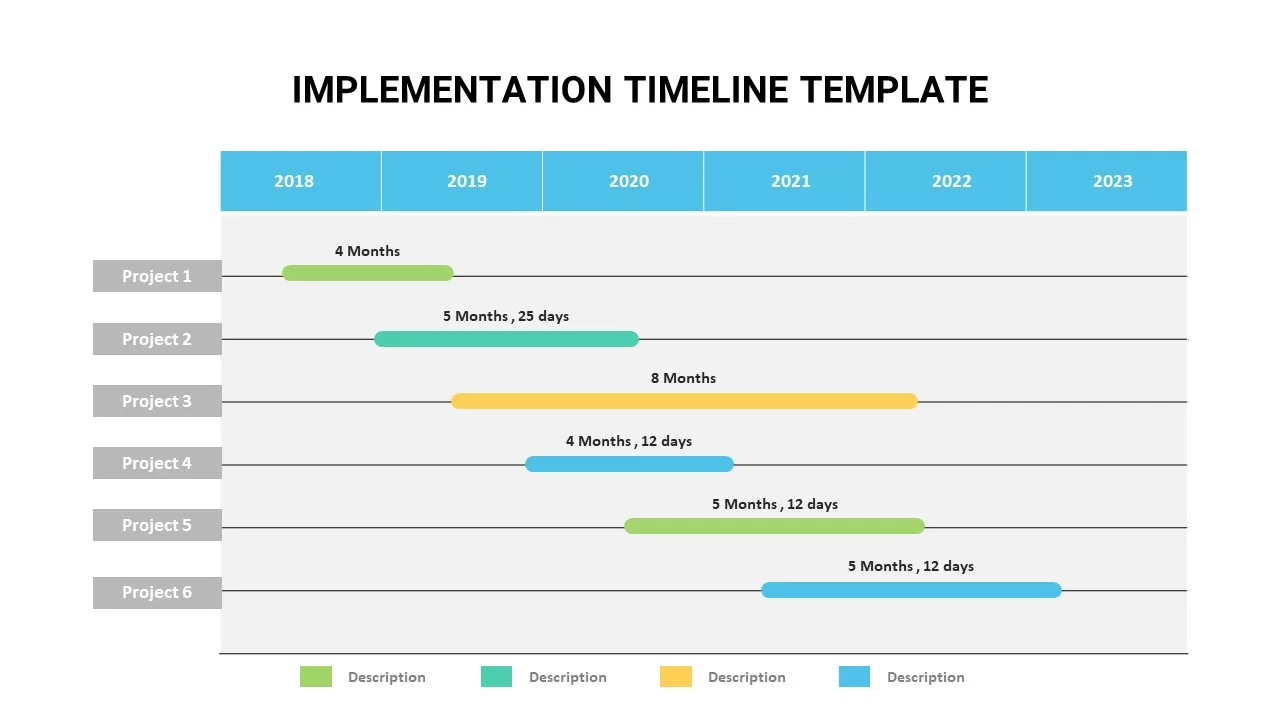
Animated Implementation Timeline Chart Template for PowerPoint & Google Slides
Timeline
Dynamic Benchmarking Comparison Chart Template for PowerPoint & Google Slides
Comparison Chart
Functional Organization Chart Structure Template for PowerPoint & Google Slides
Org Chart
Modern Divisional Organization Chart Template for PowerPoint & Google Slides
Org Chart
C-Suite Executive Org Chart Diagram Template for PowerPoint & Google Slides
Org Chart
Free Stacked Column Chart Data Visualization Template for PowerPoint & Google Slides
Bar/Column
Free
Animated Clustered Bar Chart Template for PowerPoint & Google Slides
Bar/Column
Animated Stacked Bar Chart Template for PowerPoint & Google Slides
Bar/Column
Clustered Bar Chart Comparison Template for PowerPoint & Google Slides
Bar/Column
Editable Multi-Series Peak Line Chart Template for PowerPoint & Google Slides
Comparison Chart
XY Bubble Chart Data Visualization Template for PowerPoint & Google Slides
Comparison Chart
Simple Area Chart Data Trends Analysis Template for PowerPoint & Google Slides
Comparison Chart
Data Over Time Line Chart template for PowerPoint & Google Slides
Charts
Business Timeline Comparison Bar Chart Template for PowerPoint & Google Slides
Comparison Chart
Growth Curve Line Chart Visualization Template for PowerPoint & Google Slides
Charts
Grouped Column Chart Comparison Template for PowerPoint & Google Slides
Bar/Column
Multiple Line Chart Comparison Template for PowerPoint & Google Slides
Comparison Chart
Rectangle Area Chart with Gradient Fill Template for PowerPoint & Google Slides
Comparison Chart
Multi-Series Line Chart with Icons Template for PowerPoint & Google Slides
Comparison Chart
Waterfall Chart Data Visualization Template for PowerPoint & Google Slides
Comparison Chart
Year-over-Year Stacked Gender Bar Chart Template for PowerPoint & Google Slides
Bar/Column
Animated Hexagon Org Chart Diagram Template for PowerPoint & Google Slides
Org Chart
Stacked Waterfall Chart Template for PowerPoint & Google Slides
Bar/Column
Population Age Distribution Pyramid Chart Template for PowerPoint & Google Slides
Pyramid
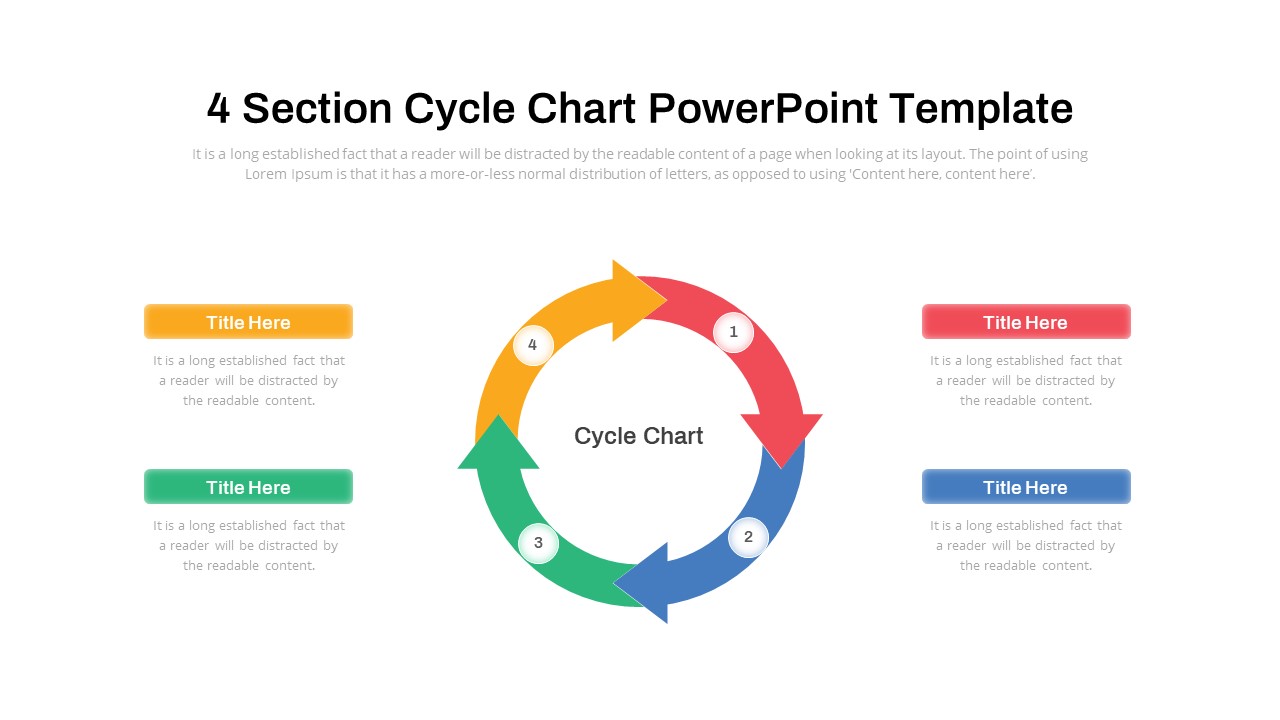
Cycle Chart Template for PowerPoint & Google Slides
Circular
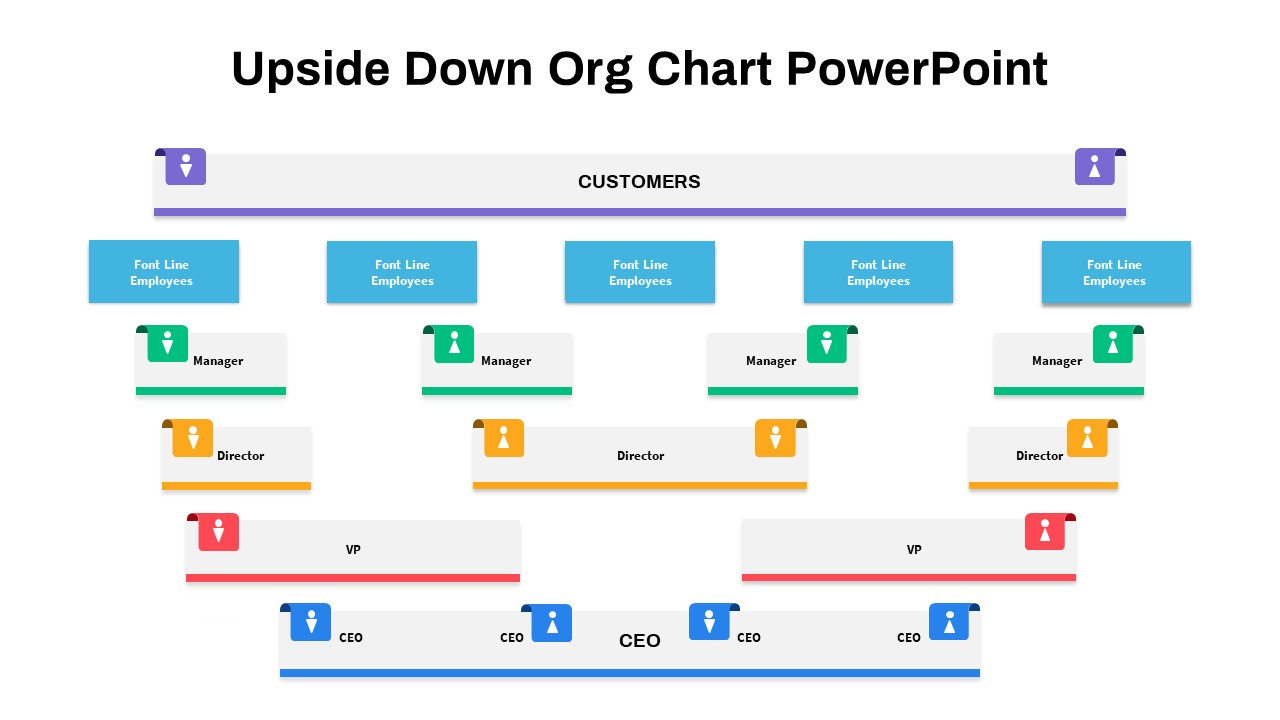
Upside-Down Organizational Chart Diagram Template for PowerPoint & Google Slides
Org Chart
Multi-Variation Thermometer Chart Template for PowerPoint & Google Slides
Bar/Column
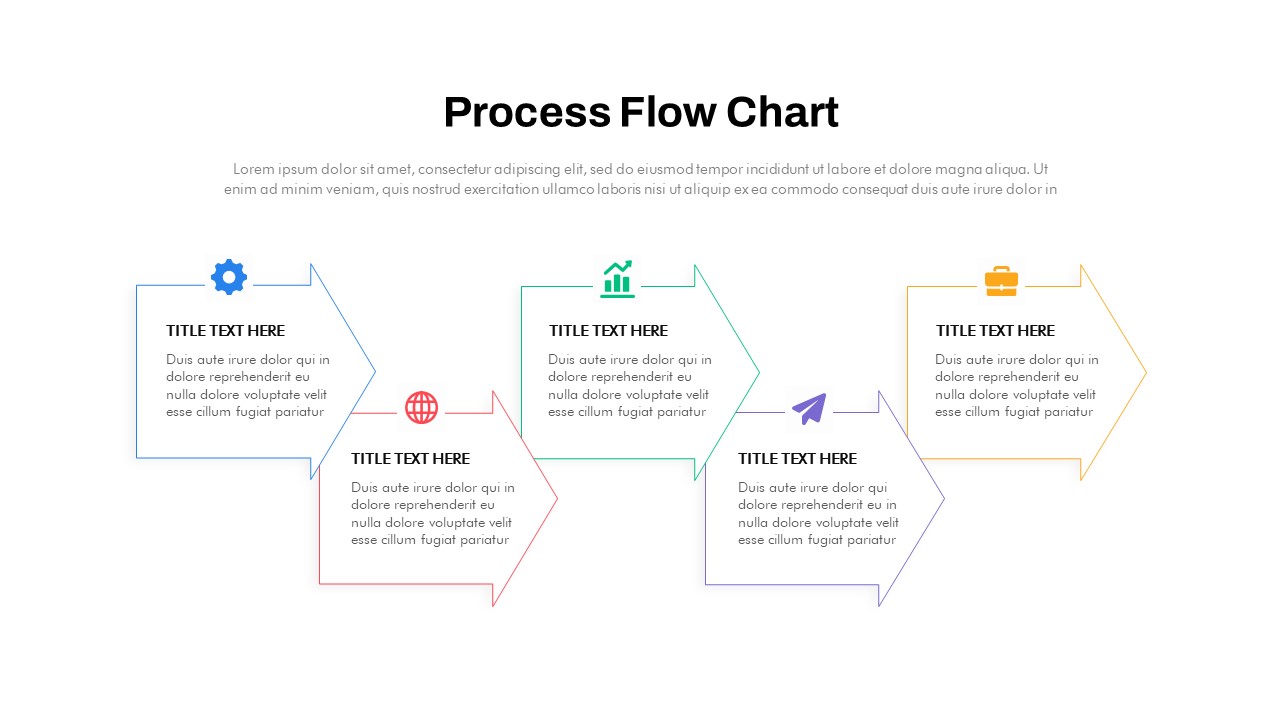
Wastewater Treatment Process Flow Chart Template for PowerPoint & Google Slides
Flow Charts
Animated Process Flow Chart Template for PowerPoint & Google Slides
Infographics
Multi-Level Wheel Chart Diagram template for PowerPoint & Google Slides
Pie/Donut
Interactive Jump Line Data Chart Template for PowerPoint & Google Slides
Comparison Chart
Free Versatile Product Comparison Chart Template for PowerPoint & Google Slides
Charts
Free
Dynamic Bar-of-Pie Chart Comparison Template for PowerPoint & Google Slides
Pie/Donut
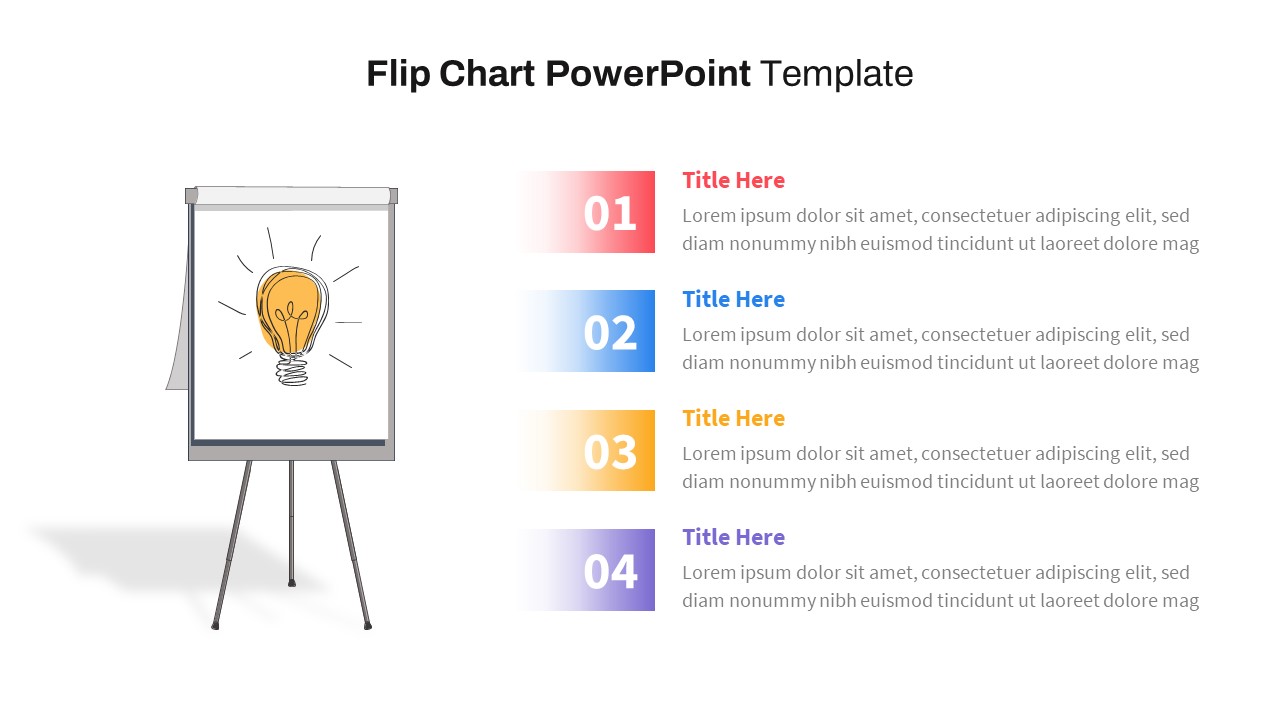
Flip Chart Four-Step List Layout Template for PowerPoint & Google Slides
Process
Free Corporate Hierarchy Organizational Chart Template for PowerPoint & Google Slides
Org Chart
Free
Quarterly Credit Loss Provisions Chart Template for PowerPoint & Google Slides
Bar/Column
Expanding Margins Analysis Bar Chart Template for PowerPoint & Google Slides
Charts
Annual Growth Trend Analysis Chart template for PowerPoint & Google Slides
Business Report
Dynamic Financial Analysis Line Chart Template for PowerPoint & Google Slides
Finance
Quarterly Sales Review Bar Chart Template for PowerPoint & Google Slides
Bar/Column
Professional Table of Organization Chart Template for PowerPoint & Google Slides
Org Chart
Competitor Comparison Chart Design Template for PowerPoint & Google Slides
Comparison
Profile Comparison Chart template for PowerPoint & Google Slides
Comparison Chart
Sales Growth Comparison Chart & Table Template for PowerPoint & Google Slides
Bar/Column
Event Planning Gantt Chart template for PowerPoint & Google Slides
Business
Feasibility Matrix Comparison Chart Template for PowerPoint & Google Slides
Comparison Chart
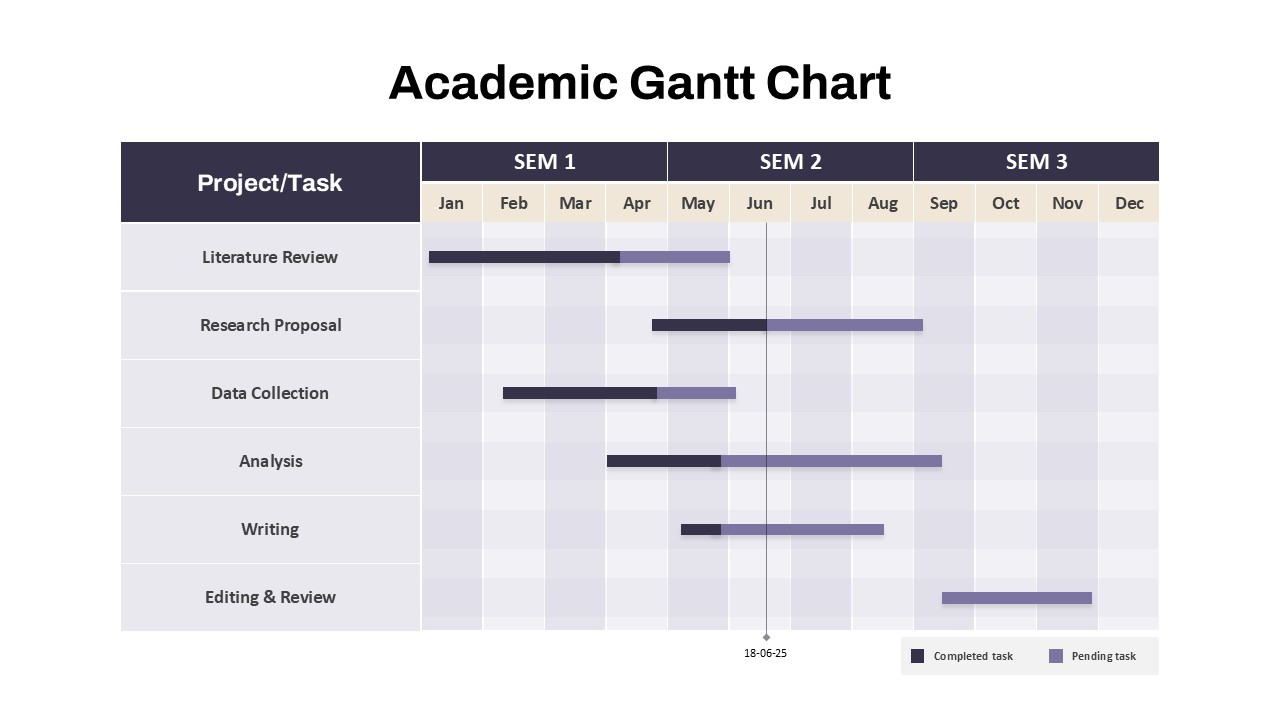
Academic Gantt Chart template for PowerPoint & Google Slides
Business
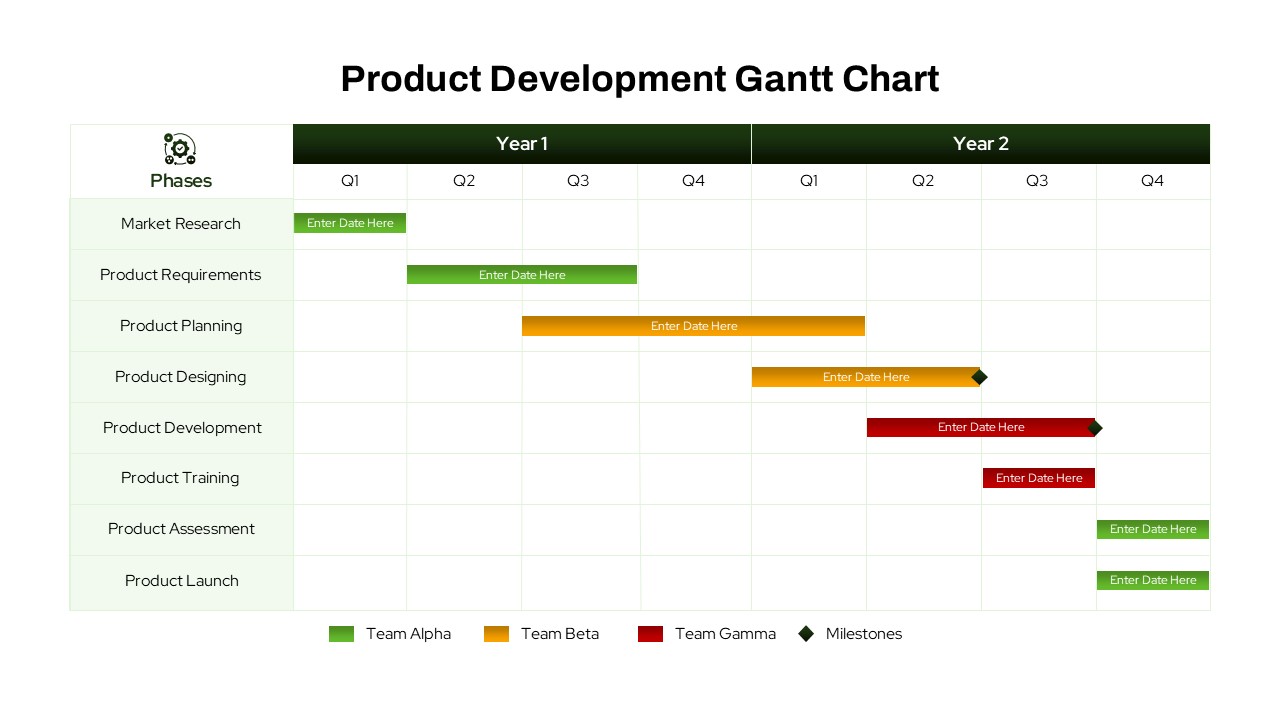
Product Development Gantt Chart template for PowerPoint & Google Slides
Gantt Chart
Bar Gantt Chart Template for PowerPoint & Google Slides
Gantt Chart
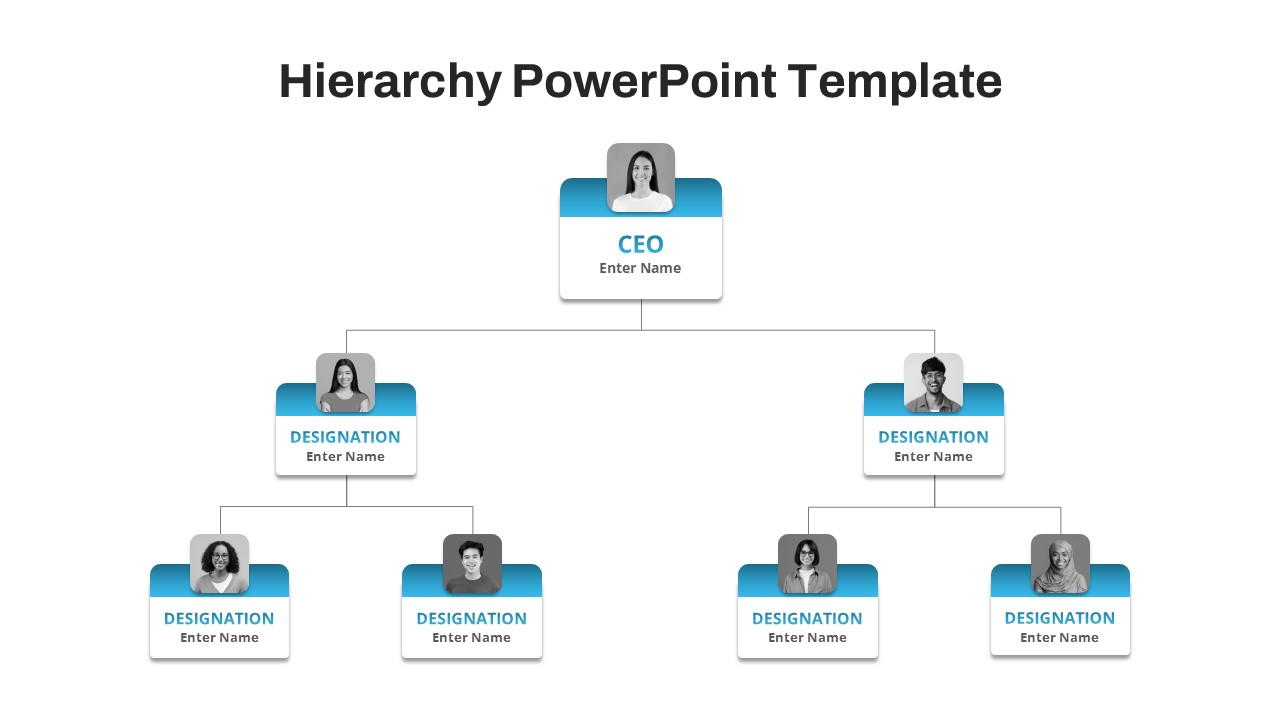
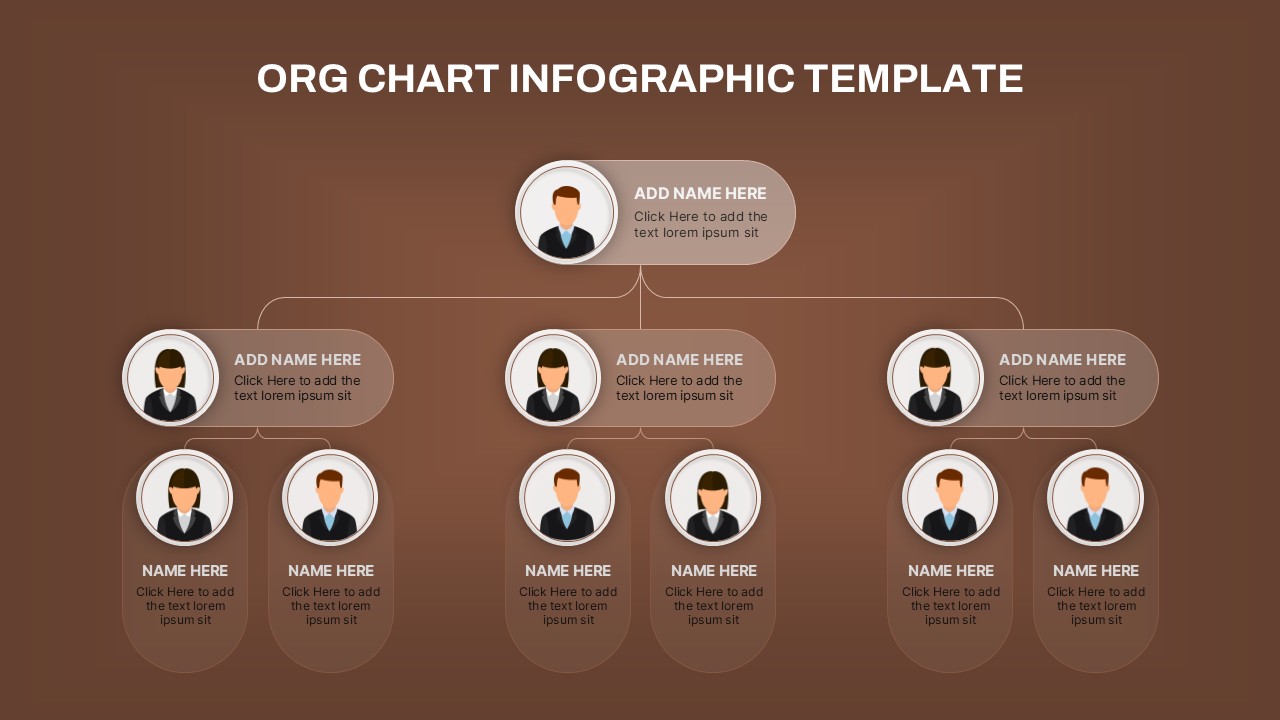
Hierarchical Org Chart Infographic Template for PowerPoint & Google Slides
Org Chart
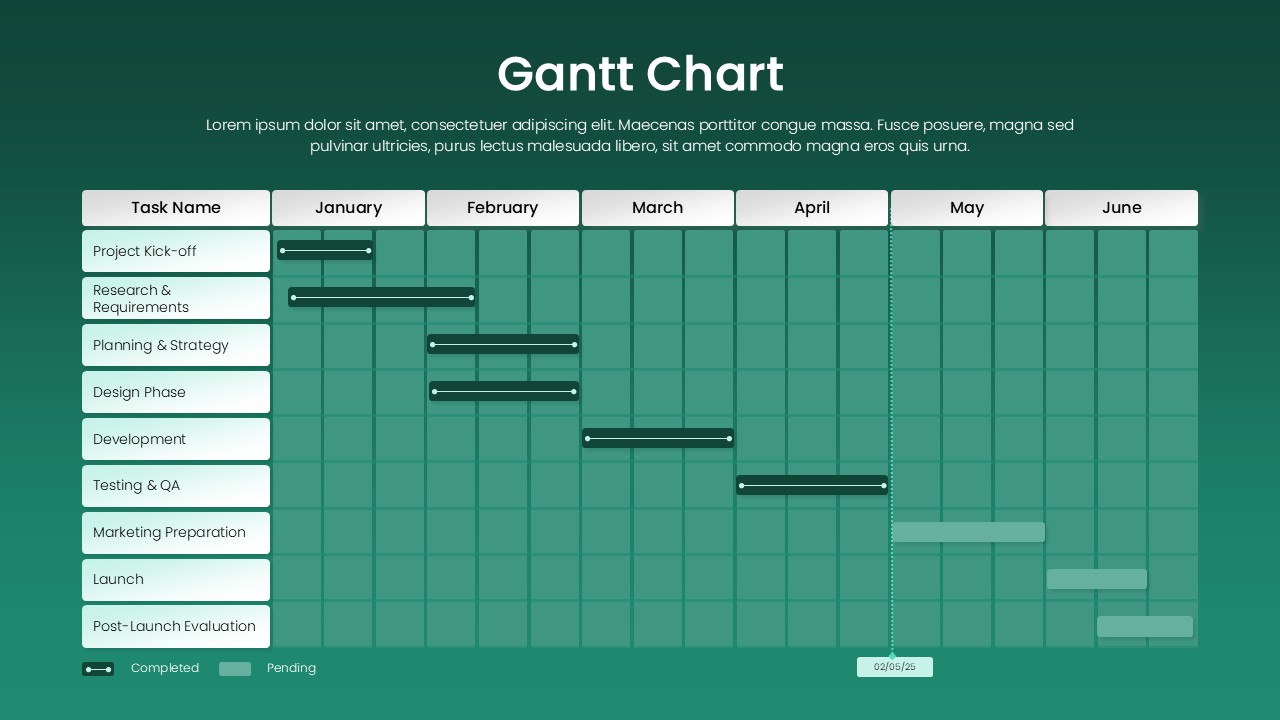
Green Gantt Chart Template for PowerPoint & Google Slides
Gantt Chart
Colorful Annual Gantt Chart Project Planner Template for PowerPoint & Google Slides
Gantt Chart
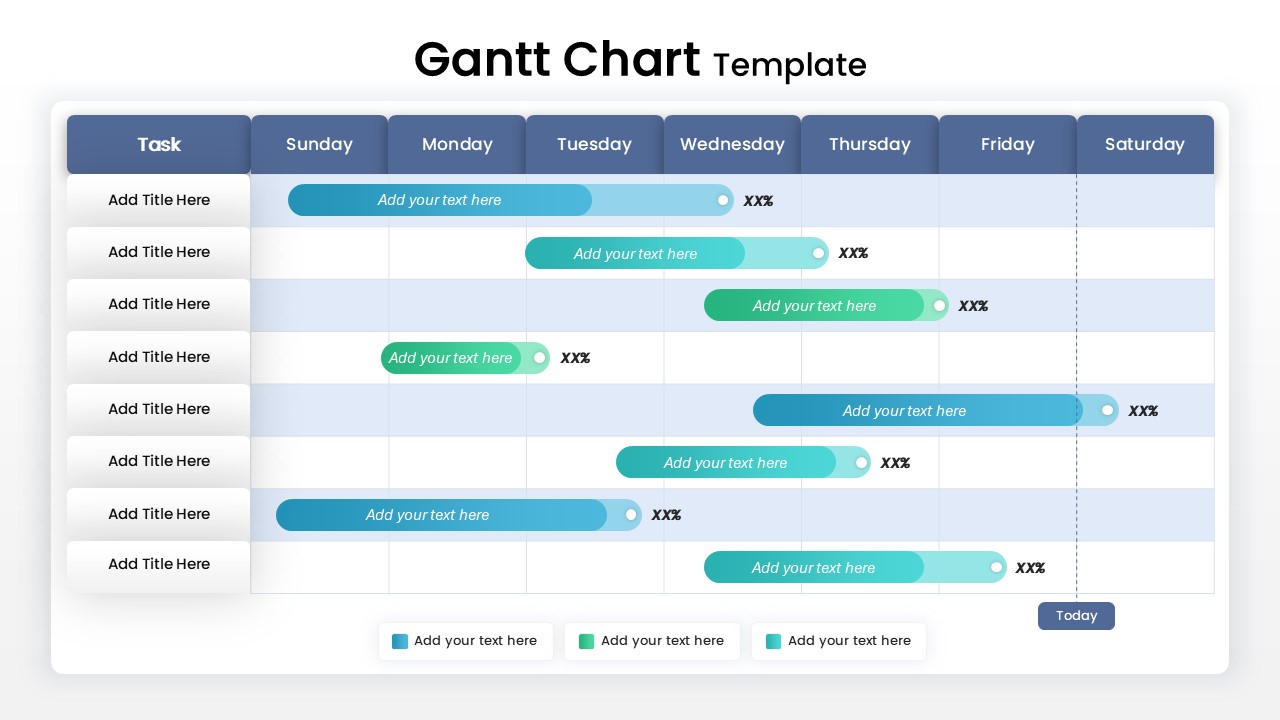
Weekly Gantt Chart with Milestones Template for PowerPoint & Google Slides
Gantt Chart
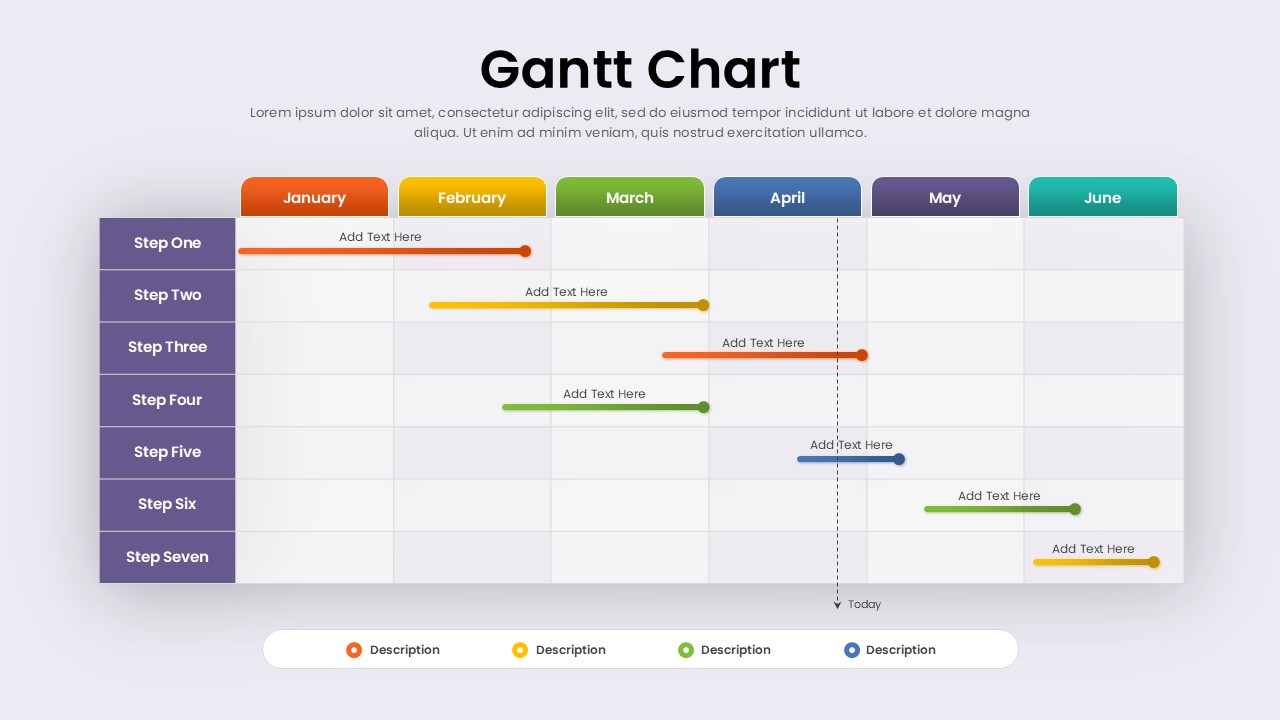
7 Step 6 Month Gantt Chart Timeline Template for PowerPoint & Google Slides
Gantt Chart
Three Segment Donut Chart KPI Infographic Template for PowerPoint & Google Slides
Pie/Donut