Brain Hub-and-Spoke Infographic template for PowerPoint & Google Slides
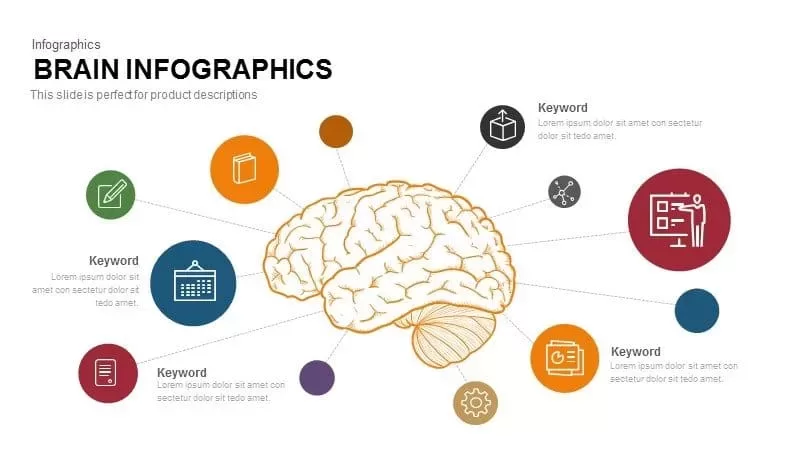

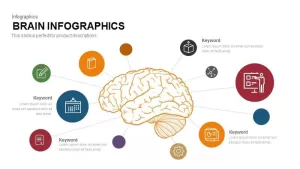
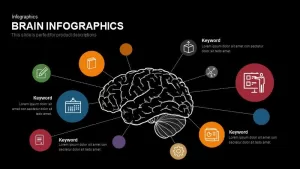
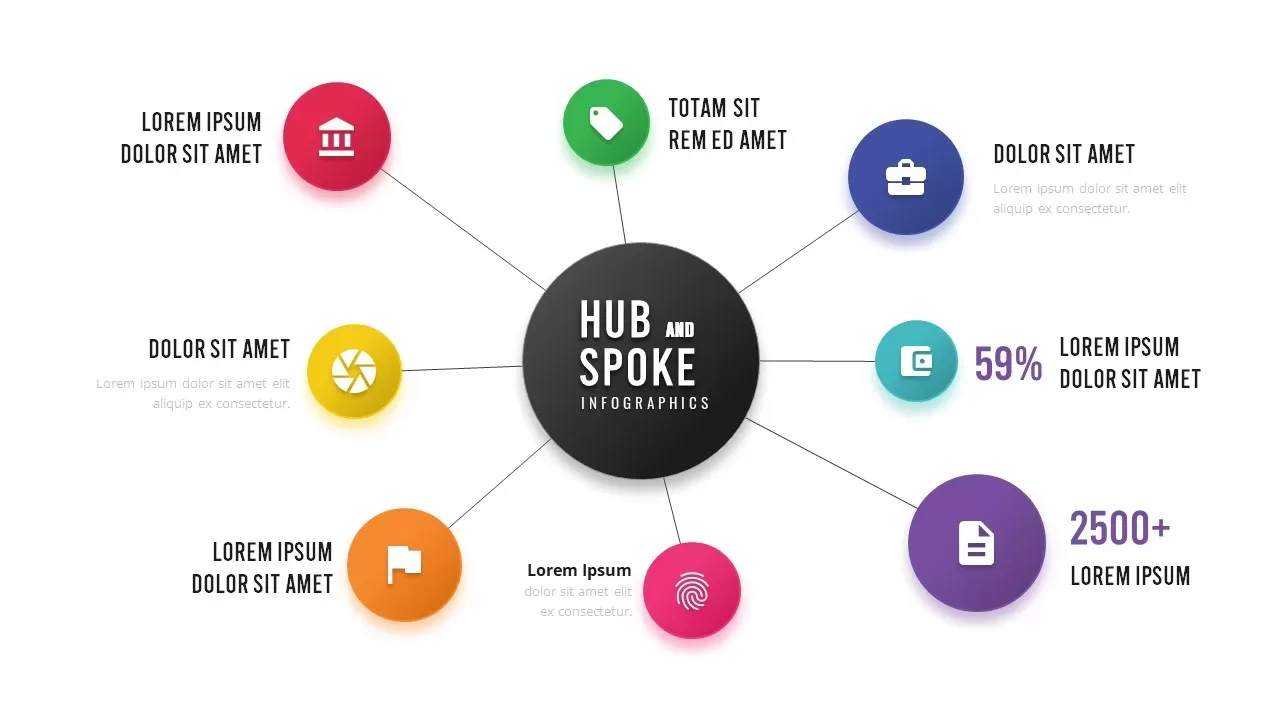
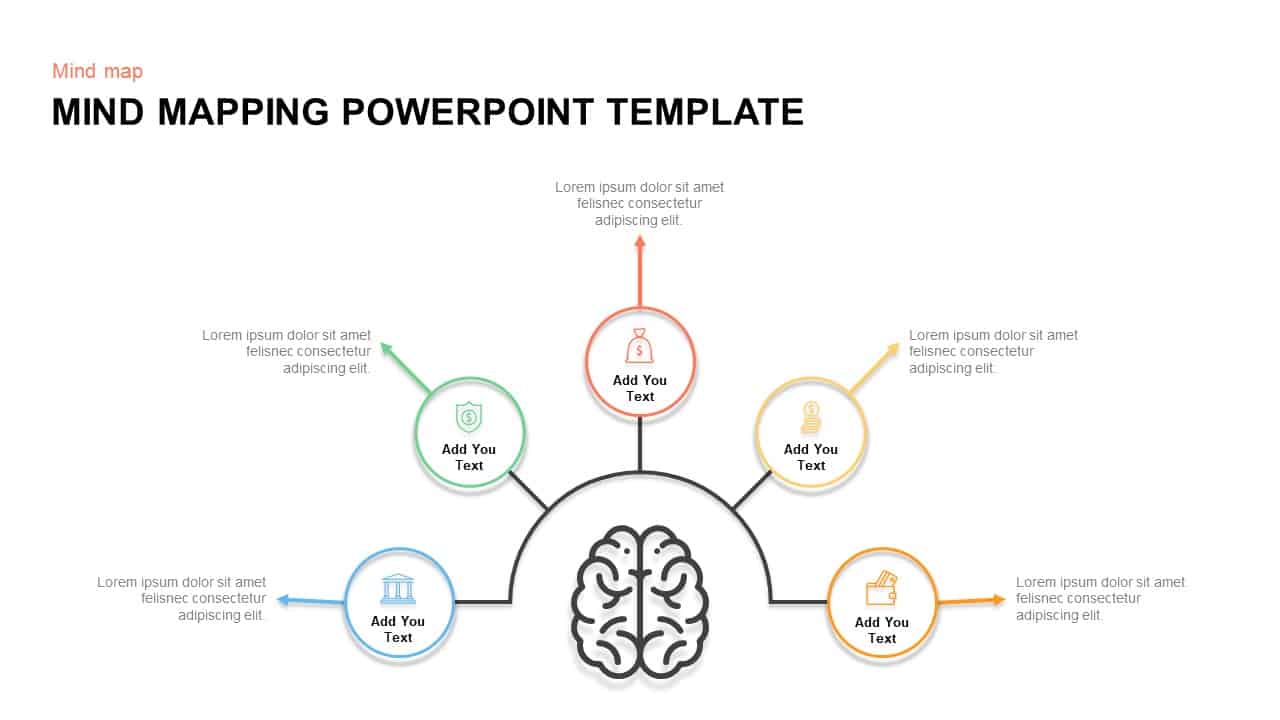
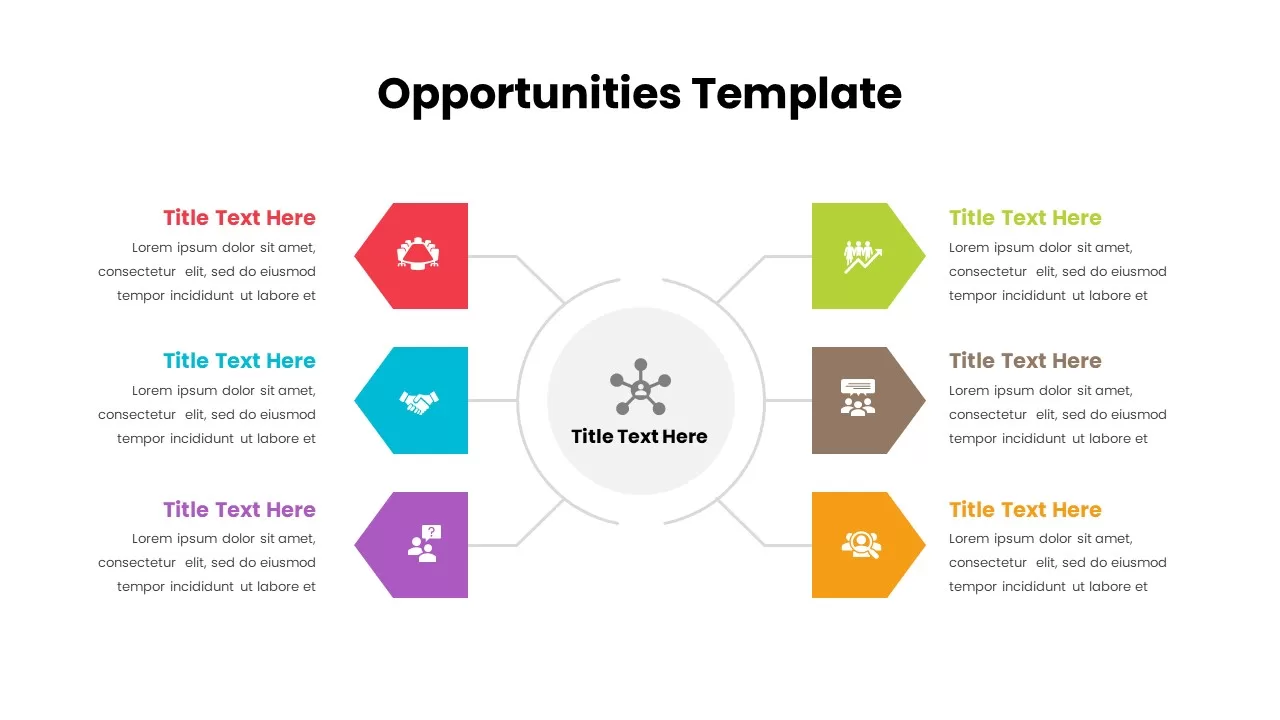
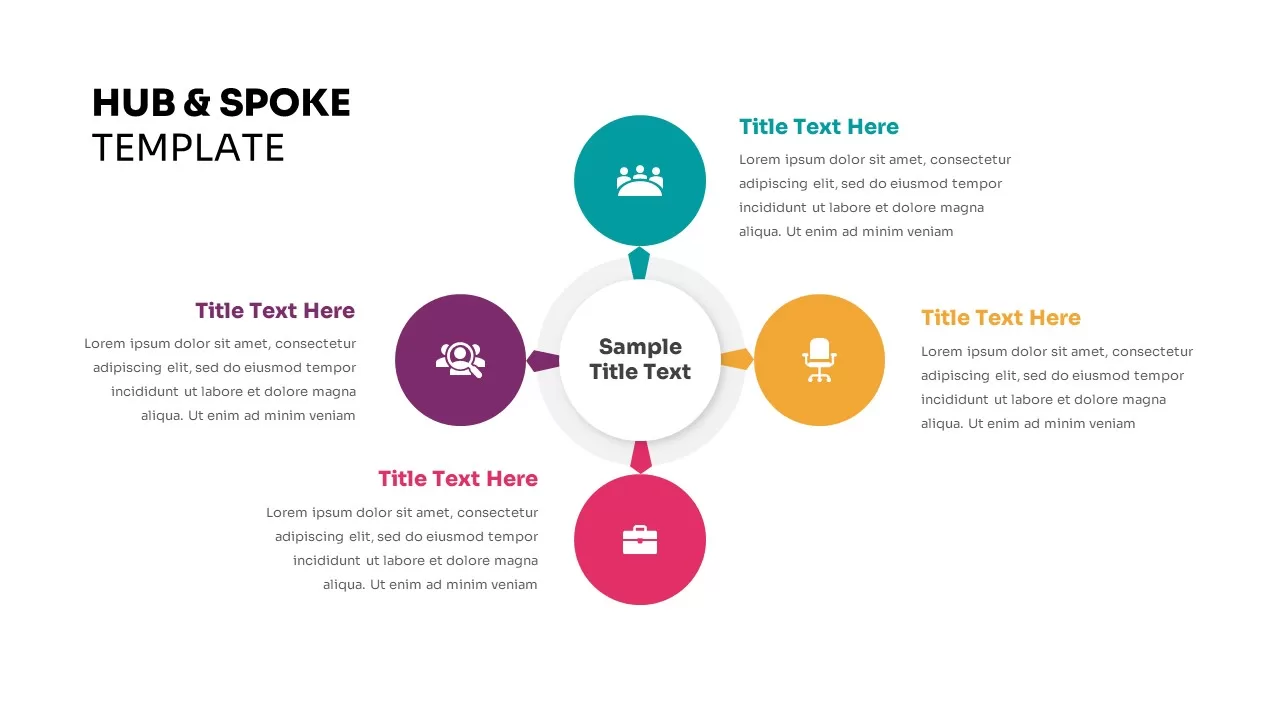
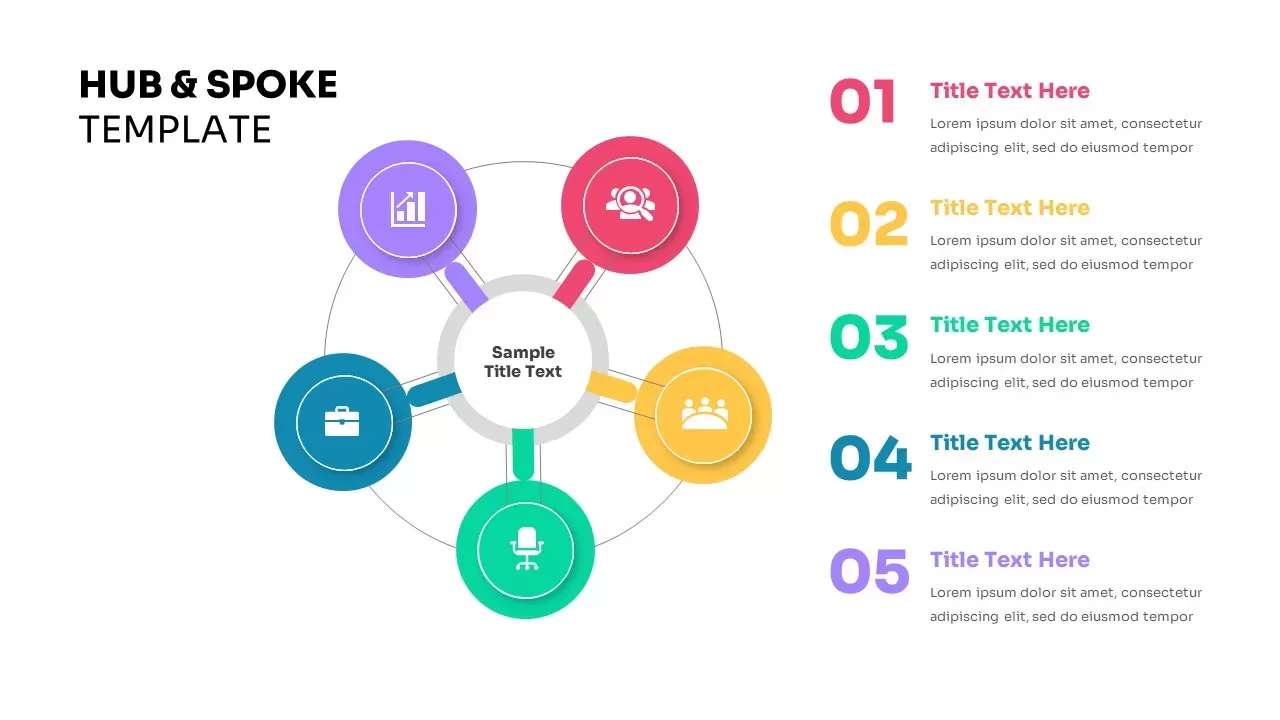
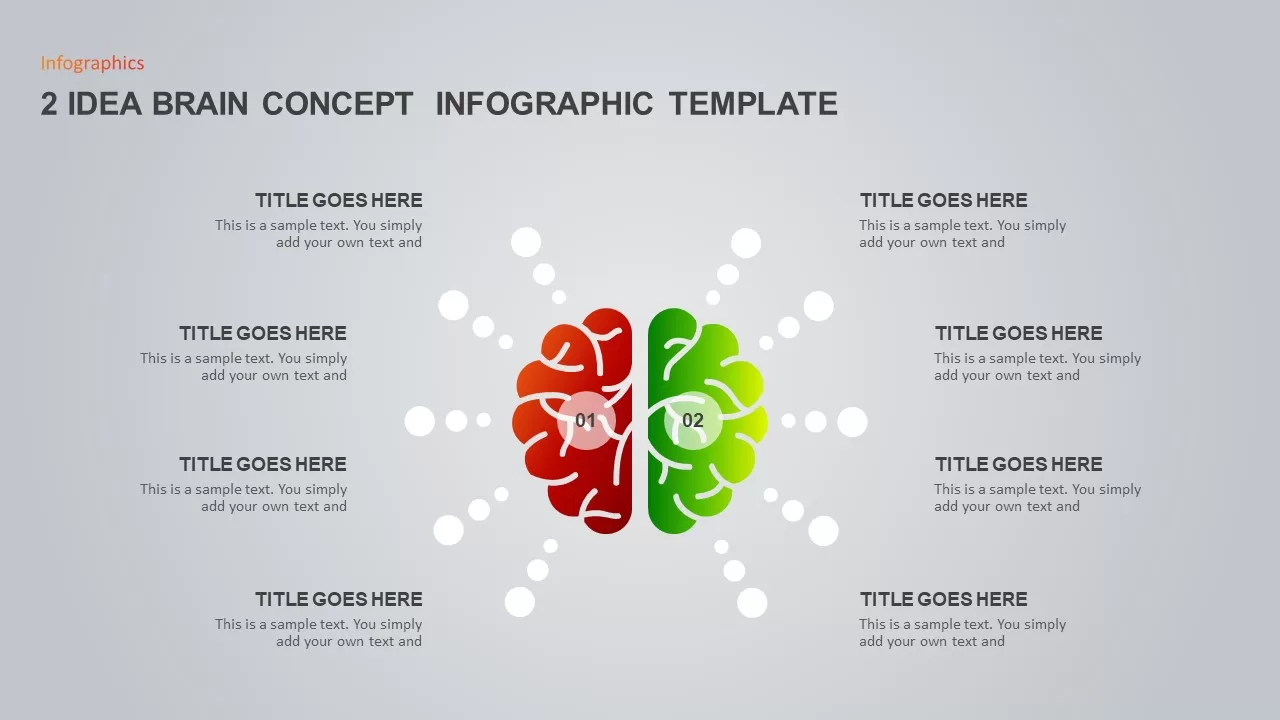
Introduce dynamic data relationships with this Brain Hub-and-Spoke infographic slide, featuring a central brain illustration that symbolizes core ideas and cognitive processes. Six primary colored circles—green, blue, maroon, dark gray, red, and orange—each containing a distinct line icon (pencil, calendar, smartphone, cube, presentation board, timer)—radiate from the central graphic via dotted connector lines. Additional small accent circles provide a balanced visual rhythm. The minimalist line art style of the brain contrasts with the vivid color fills of the nodes, guiding audience focus to each category. Editable text placeholders adjacent to each spoke allow you to annotate key topics, data points, or feature descriptions.
This slide is built entirely with native PowerPoint and Google Slides vector shapes and master layouts, ensuring effortless customization. Swap icons seamlessly to match your content, adjust circle sizes or colors to align with brand guidelines, and modify connector styles to emphasize hierarchy or flow. Because it uses editable shapes rather than static images, you can maintain pixel-perfect clarity at any screen resolution and apply smooth entrance or emphasis animations to individual elements for enhanced storytelling. The central hub remains fully scalable, allowing you to re-center the diagram or expand the number of spokes directly within the master slide without losing alignment.
Ideal for illuminating market segments, product feature clusters, or departmental workflows, this diagram provides a flexible framework for conceptual mapping. Marketing teams can showcase customer personas, R&D groups highlight technology pillars, and HR leaders outline organizational competencies. Consultants leverage the hub-and-spoke metaphor to present strategic models, while educators visualize complex concepts and course modules. Whether you are planning stakeholder workshops, executive briefings, or training sessions, this hub-and-spoke design enhances comprehension and engagement by linking individual topics back to a unifying core.
Who is it for
Marketing professionals, product managers, and business strategists will appreciate this slide for mapping product categories, feature sets, or service pillars within a centralized framework. Consultants and analysts can present strategic models and process flows, while HR leaders use the hub-and-spoke layout to outline organizational competencies. Educators and trainers will find the radial design useful for concept mapping, workshop planning, and instructional modules.
Other Uses
Use this brain infographic to visualize stakeholder personas, customer journey stages, or technology ecosystems. Adapt nodes to showcase departmental functions, research findings, market segmentation, or KPI categories. Duplicate spokes to expand idea clusters, recolor nodes by theme, or integrate into executive summaries and pitch decks. With its flexible radial structure, this slide becomes a versatile tool for presentations across marketing, operations, consulting, and education.
Login to download this file

Item ID
SB00339
Related Templates

Brain Gear Hub-and-Spoke Infographics template for PowerPoint & Google Slides
Org Chart
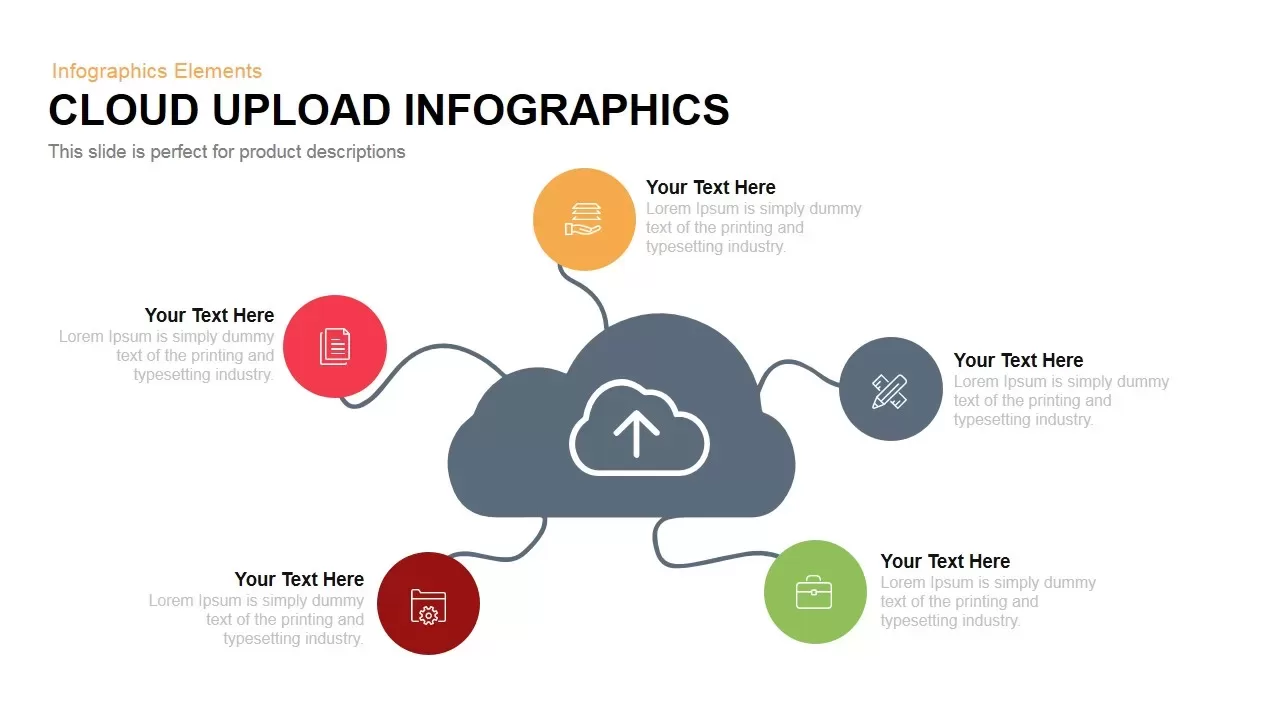
Cloud Upload Hub-and-Spoke Infographic Template for PowerPoint & Google Slides
Circular

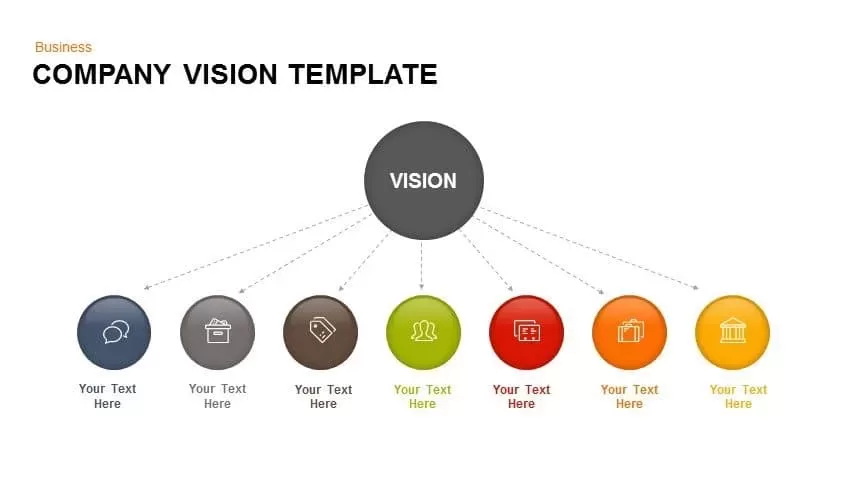
Company Vision Hub and Spoke Infographic Template for PowerPoint & Google Slides
Vision and Mission
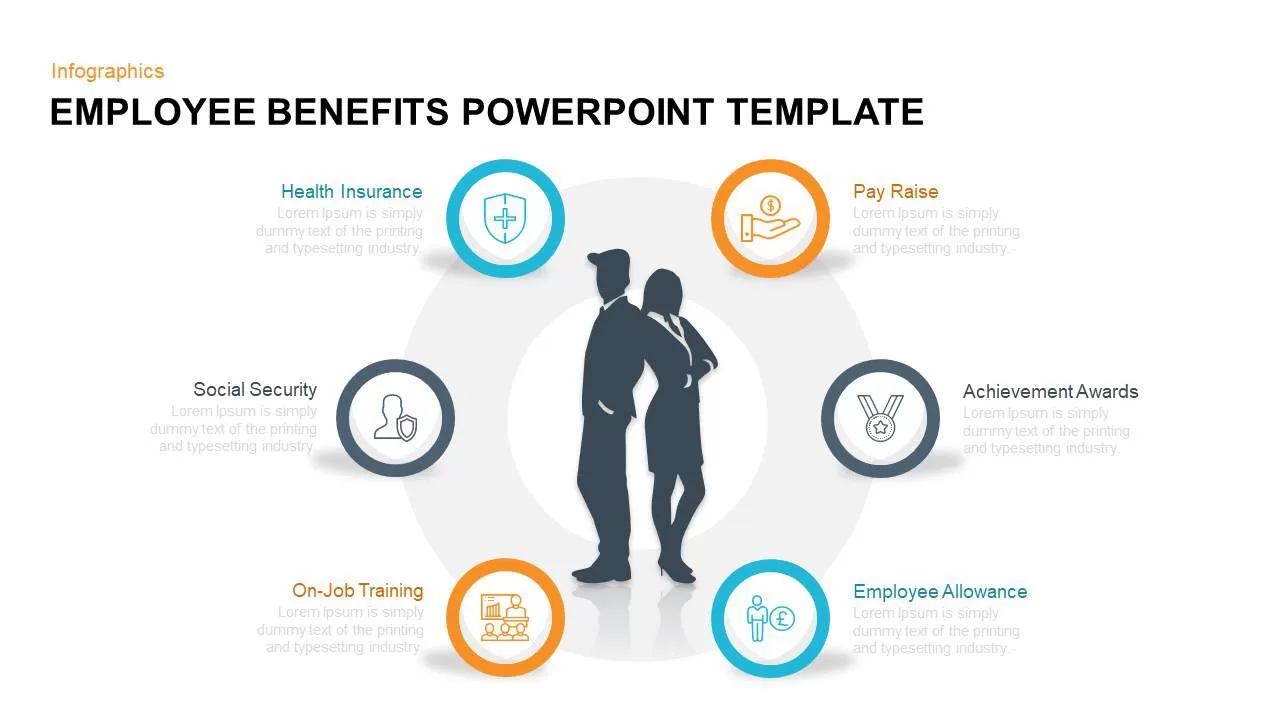
Employee Benefits Hub and Spoke Infographic Template for PowerPoint & Google Slides
HR
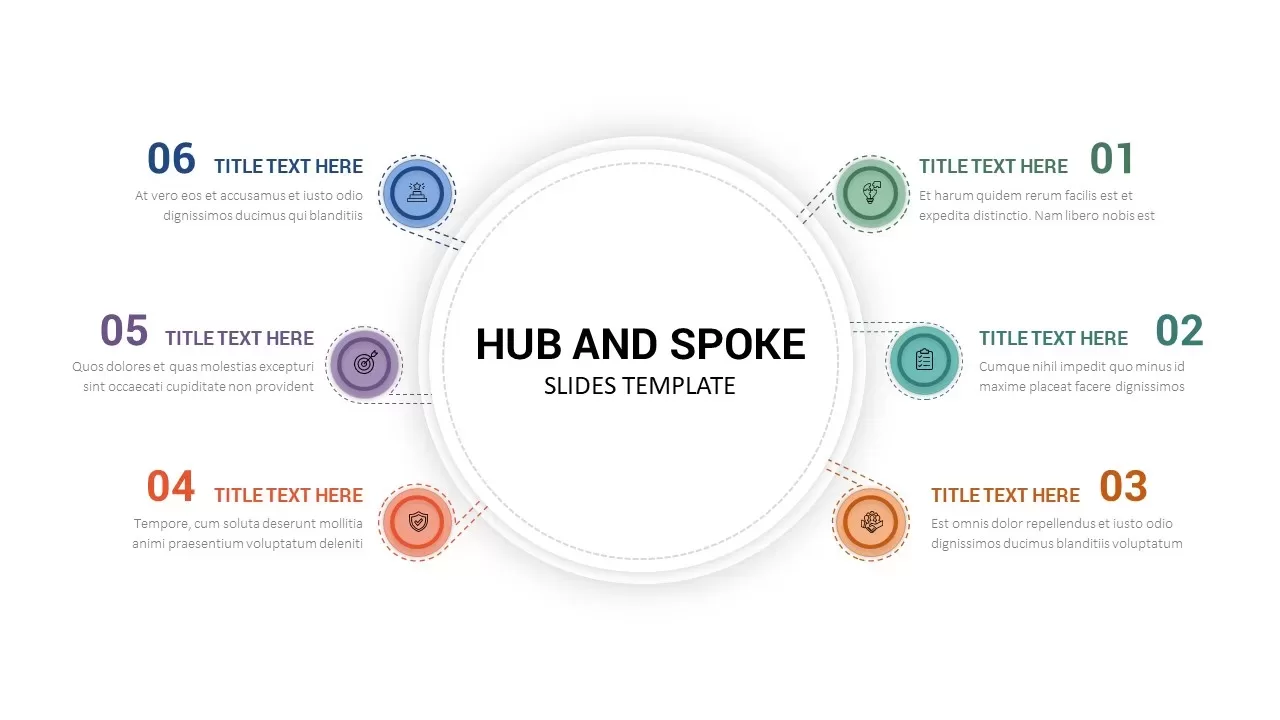
Hub & Spoke Infographic Diagram Template for PowerPoint & Google Slides
Process
Colorful Hub-and-Spoke Infographic Template for PowerPoint & Google Slides
Circular
Colorful Hub-and-Spoke Infographic Template for PowerPoint & Google Slides
Circular
Hub-and-Spoke Infographic Layout Template for PowerPoint & Google Slides
Circular
Dynamic Hub-and-Spoke Infographic Diagram Template for PowerPoint & Google Slides
Circular
Dynamic Circular Hub-and-Spoke Infographic Template for PowerPoint & Google Slides
Circular
Lungs Hub-and-Spoke Infographic Template for PowerPoint & Google Slides
Health
Free Radiation Hub and Spoke Infographic Template for PowerPoint & Google Slides
Circular
Free
Vaccination Hub-and-Spoke Infographic Template for PowerPoint & Google Slides
Circular
Free Social Media Hub-and-Spoke Infographic Template for PowerPoint & Google Slides
Circular
Free
Creative Organic Hub-and-Spoke Diagram template for PowerPoint & Google Slides
Circular
Email Marketing Hub and Spoke Diagram template for PowerPoint & Google Slides
Circular
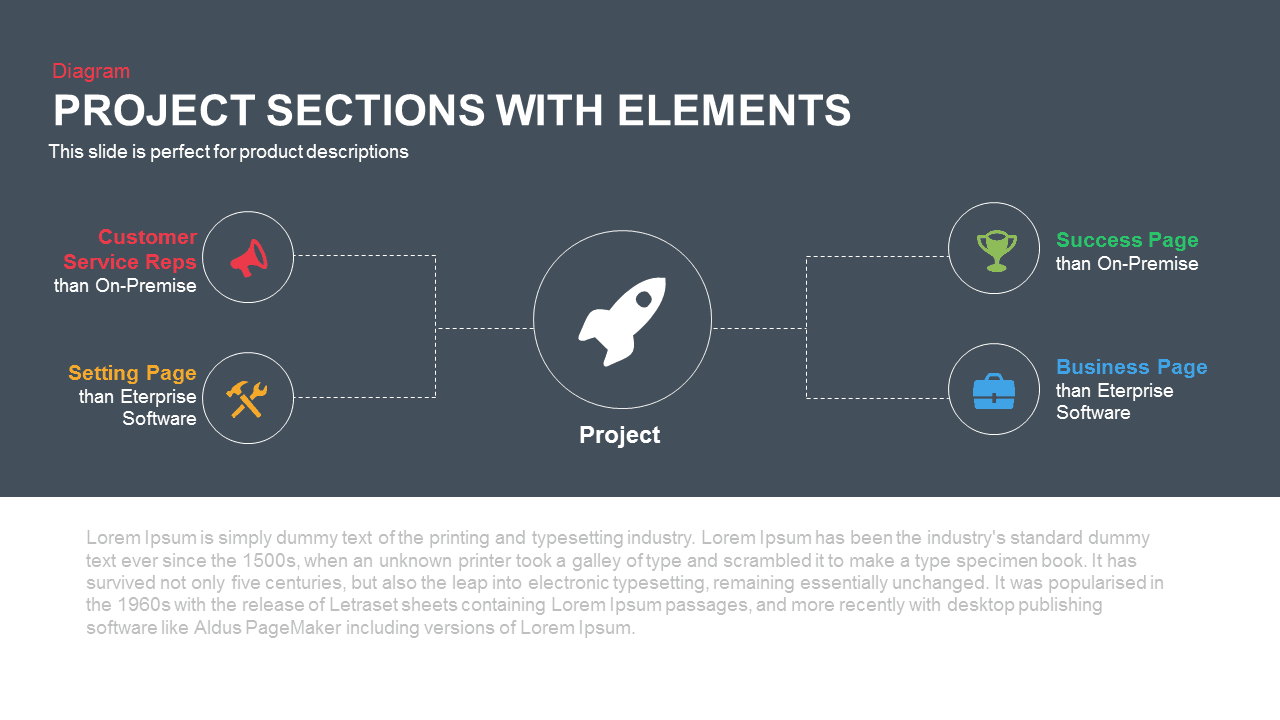
Project Sections Hub-and-Spoke Diagram template for PowerPoint & Google Slides
Flow Charts
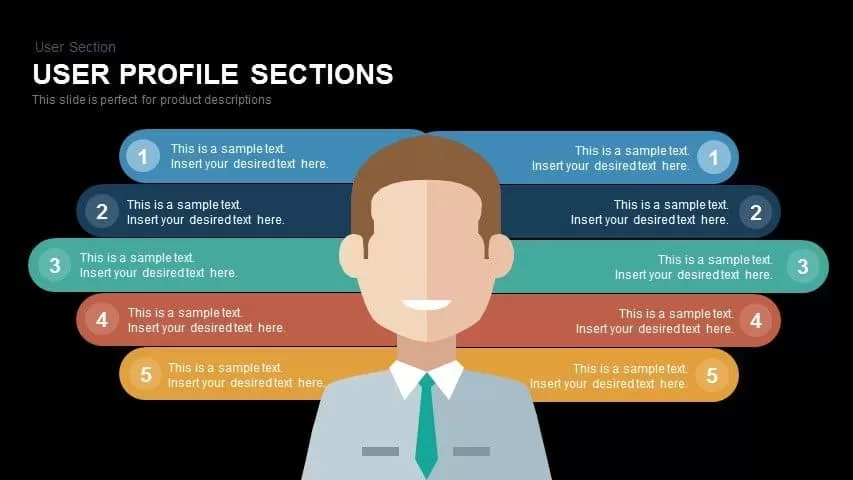
User Profile Hub-and-Spoke Diagram Template for PowerPoint & Google Slides
Our Team

Cloud Computing Hub and Spoke Diagram Template for PowerPoint & Google Slides
Cloud Computing
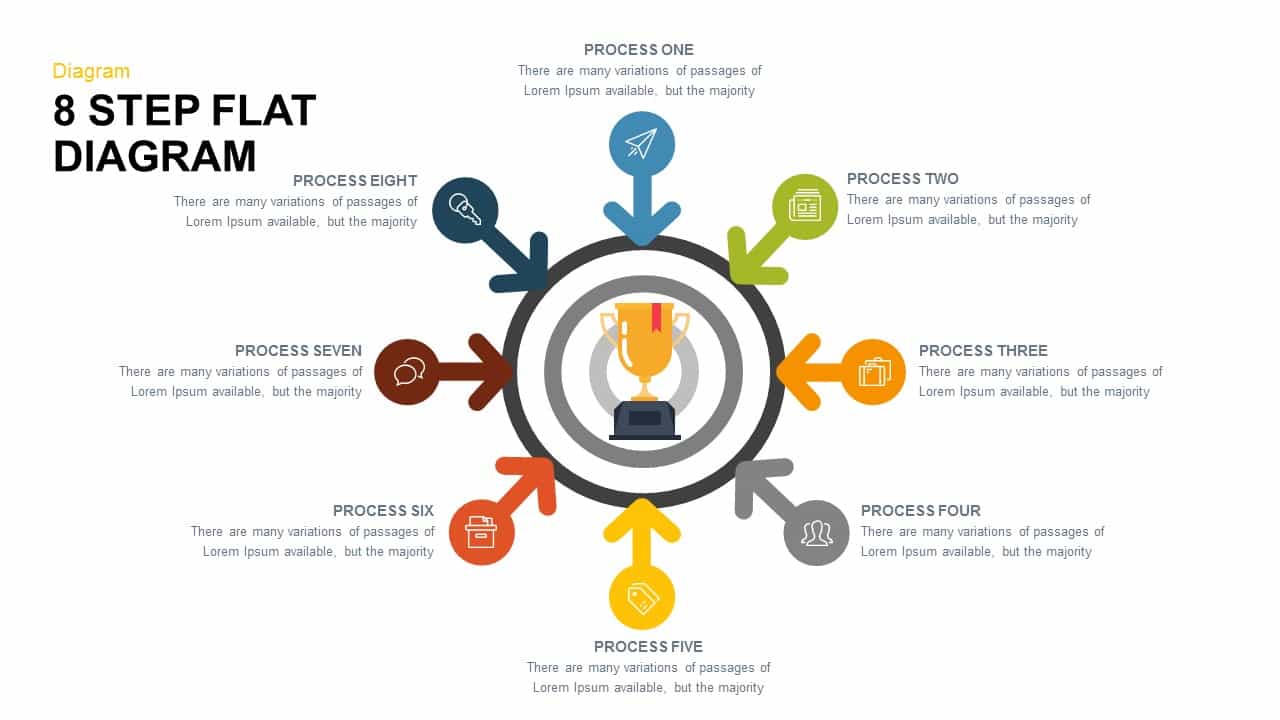
Eight-Step Hub and Spoke Diagram Template for PowerPoint & Google Slides
Process
Four-Circle Hub and Spoke Diagram Template for PowerPoint & Google Slides
Process
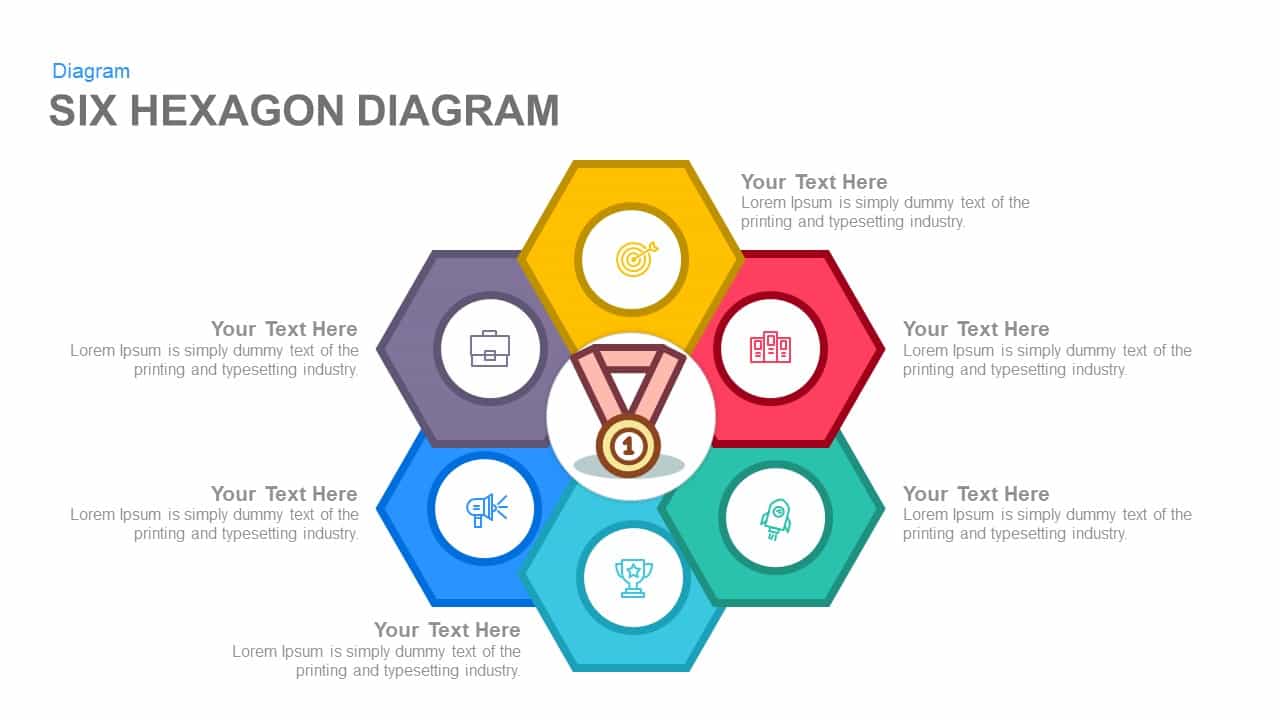
Six Hexagon Hub-and-Spoke Diagram Template for PowerPoint & Google Slides
Process

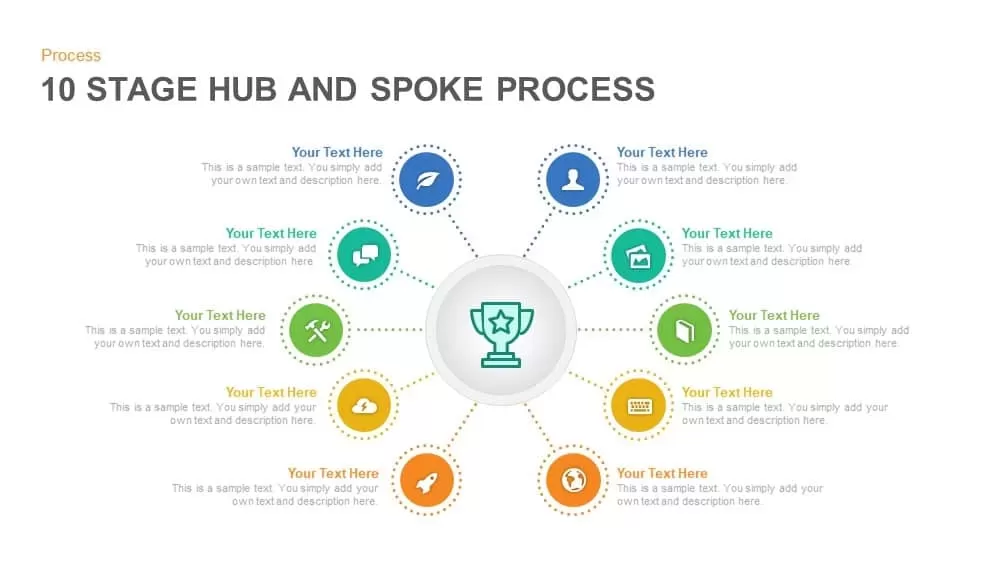
Ten-Stage Hub and Spoke Process Diagram Template for PowerPoint & Google Slides
Process
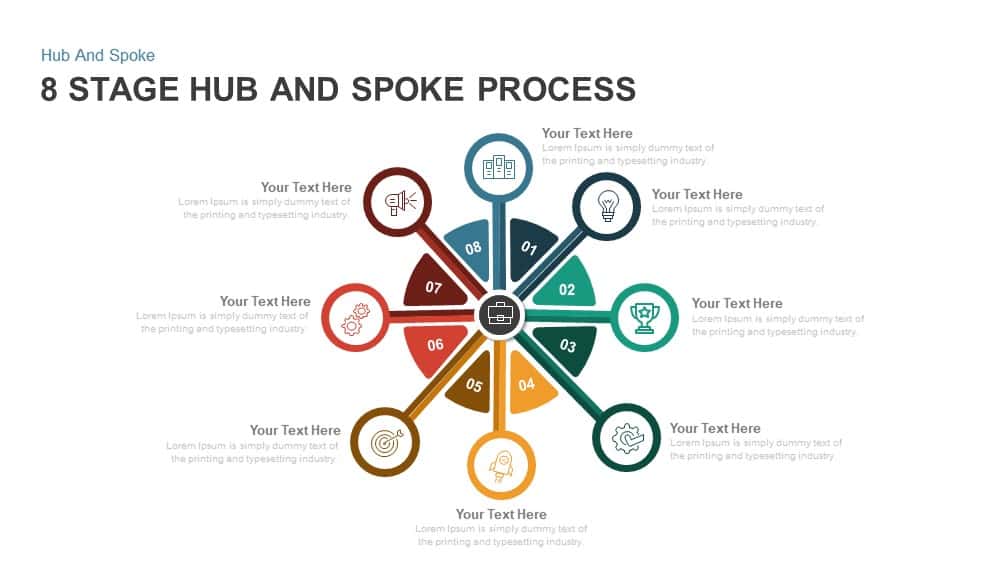
Eight-Stage Hub & Spoke Process Template for PowerPoint & Google Slides
Process
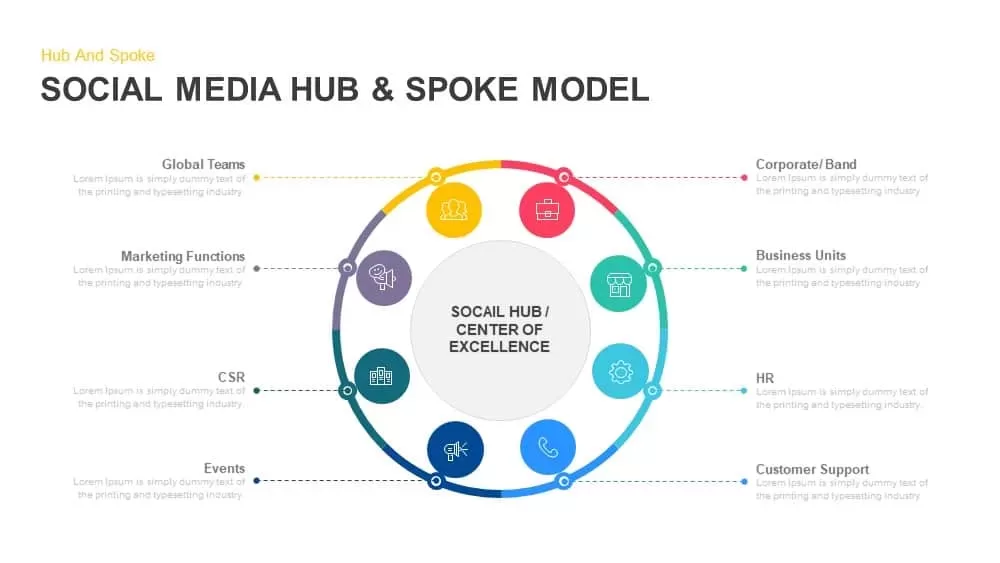
Social Media Hub & Spoke Model Template for PowerPoint & Google Slides
Process
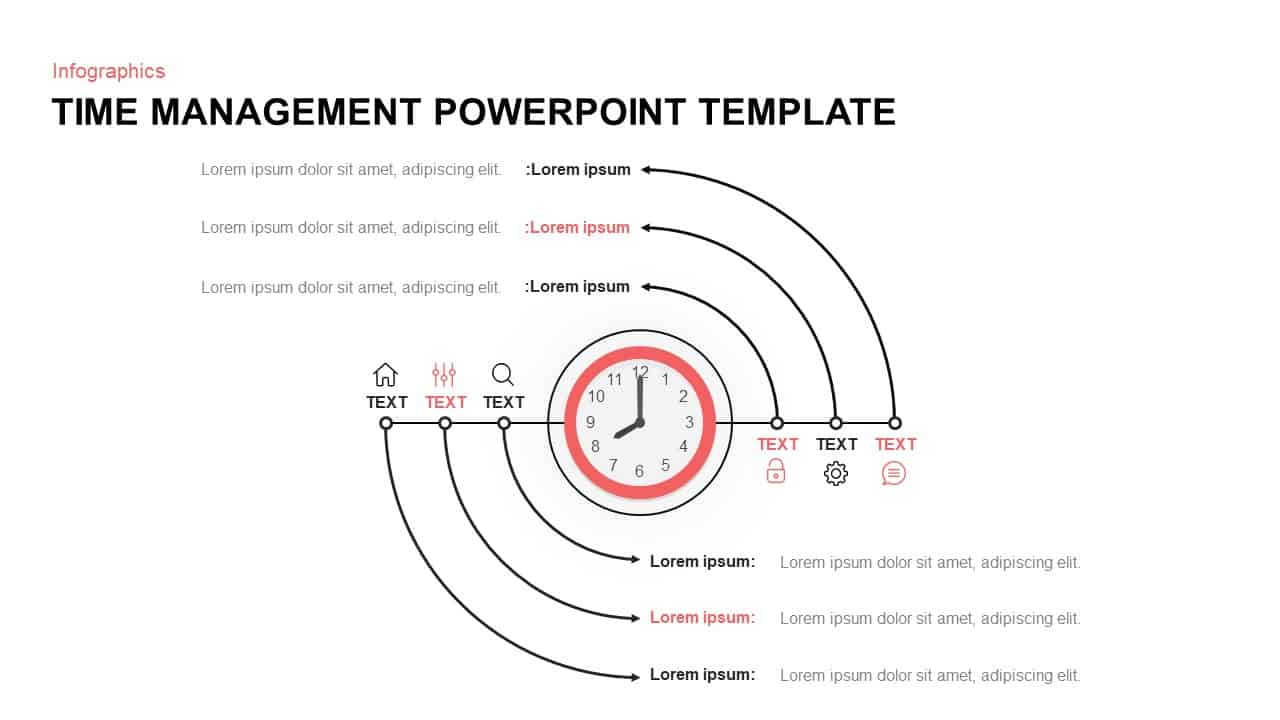
Hub and Spoke Time Management Process Template for PowerPoint & Google Slides
Process
Mind Mapping Hub and Spoke Diagram Template for PowerPoint & Google Slides
Mind Maps
Mind Mapping Hub and Spoke Diagram Template for PowerPoint & Google Slides
Mind Maps
Project Manager Roles Hub-Spoke Process Template for PowerPoint & Google Slides
Process
Technology Services Hub-Spoke Diagram Template for PowerPoint & Google Slides
Information Technology
Team Building Hub-and-Spoke Analysis Template for PowerPoint & Google Slides
Process
Customer-Centric Hub and Spoke Diagram Template for PowerPoint & Google Slides
Customer Experience
ADDIE Model Hub and Spoke Diagram Template for PowerPoint & Google Slides
Process

Operating Model Hub-and-Spoke Diagram Template for PowerPoint & Google Slides
Business Models
Multi-Item Agenda Hub-and-Spoke Diagram Template for PowerPoint & Google Slides
Agenda
Market Landscape Hub and Spoke Diagram Template for PowerPoint & Google Slides
Infographics
Four-Arrow Curved Hub-and-Spoke Diagram Template for PowerPoint & Google Slides
Arrow
Challenges & Opportunities Hub-Spoke Template for PowerPoint & Google Slides
Circular
Opportunities Hub-and-Spoke Comparison Diagram Template for PowerPoint & Google Slides
Opportunities Challenges
Opportunities Hub-and-Spoke Diagram Template for PowerPoint & Google Slides
Circular
Three-Step Hub and Spoke Diagram Template for PowerPoint & Google Slides
Circular
Five-Node Hub and Spoke Diagram Template for PowerPoint & Google Slides
Business Strategy
Four-Point Hub and Spoke Diagram Template for PowerPoint & Google Slides
Business Strategy
6 Stage Hub and Spoke Stages template for PowerPoint & Google Slides
Business Models
Five-Node Hub & Spoke Diagram Process Template for PowerPoint & Google Slides
Business Models
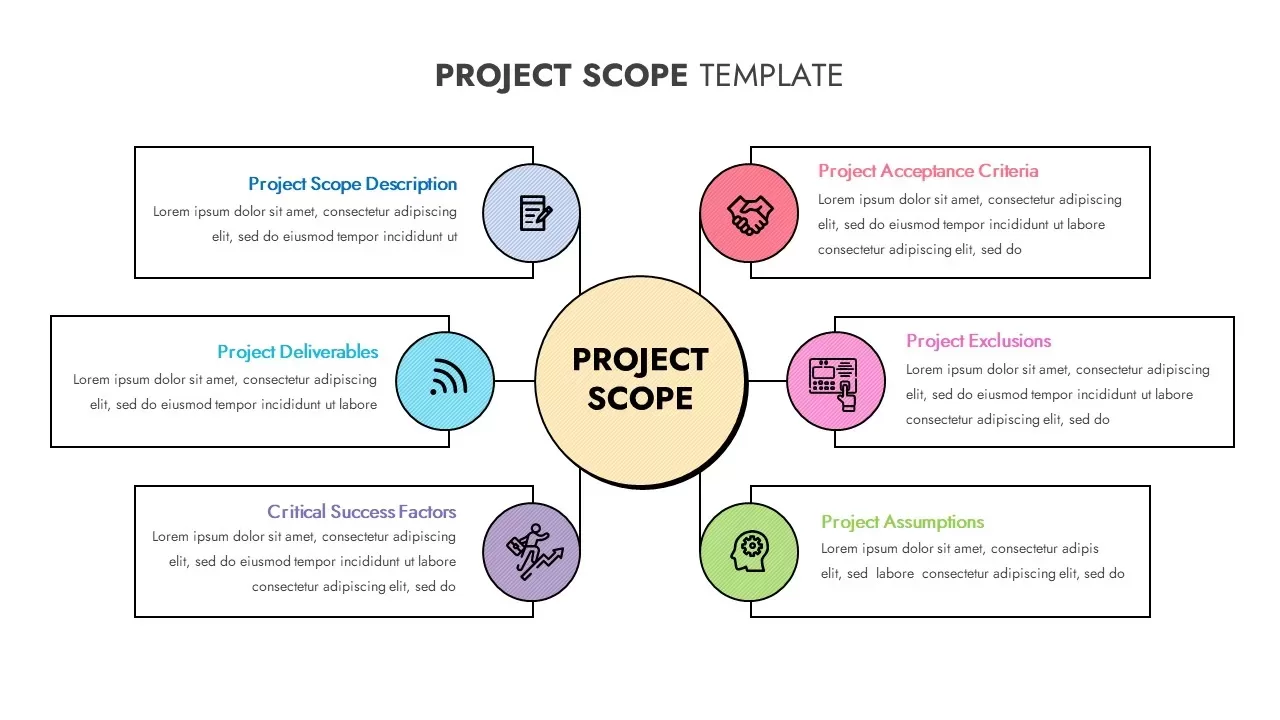
Project Scope Hub & Spoke Layout Template for PowerPoint & Google Slides
Process
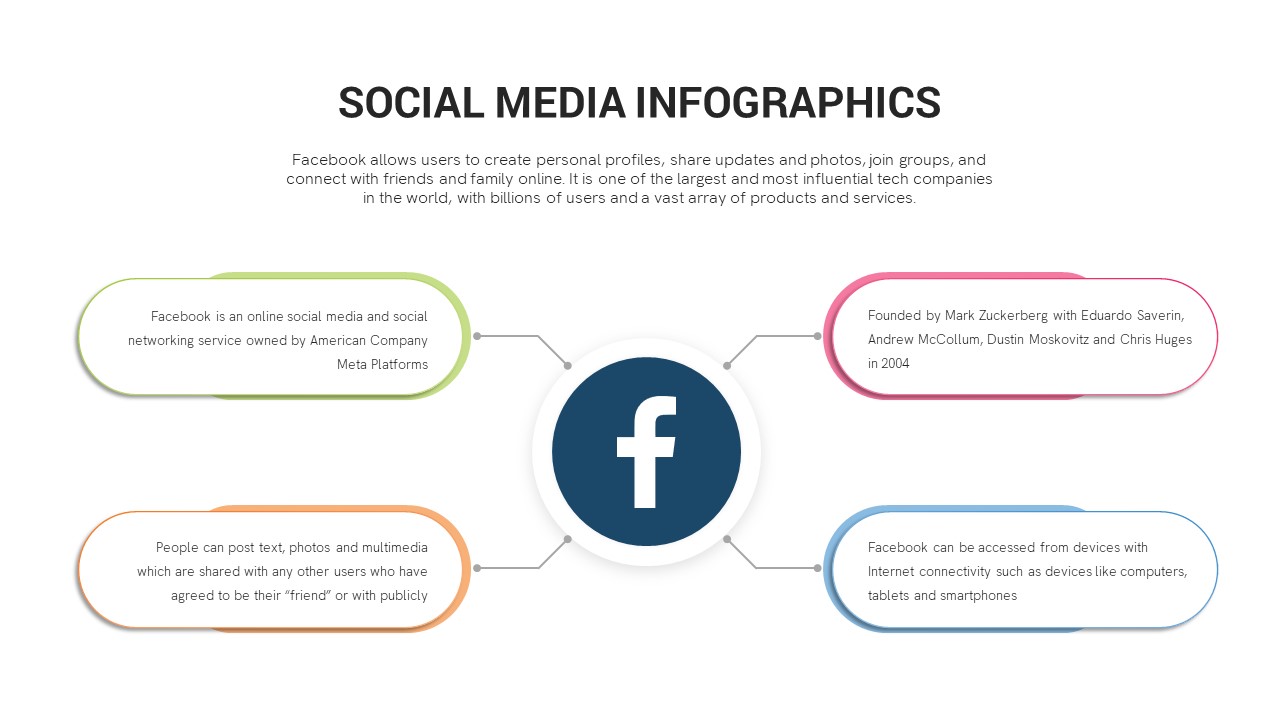
Social Media Hub-and-Spoke Infographics Template for PowerPoint & Google Slides
Circular
Omnichannel Sales Circular Hub & Spoke Template for PowerPoint & Google Slides
Digital Marketing
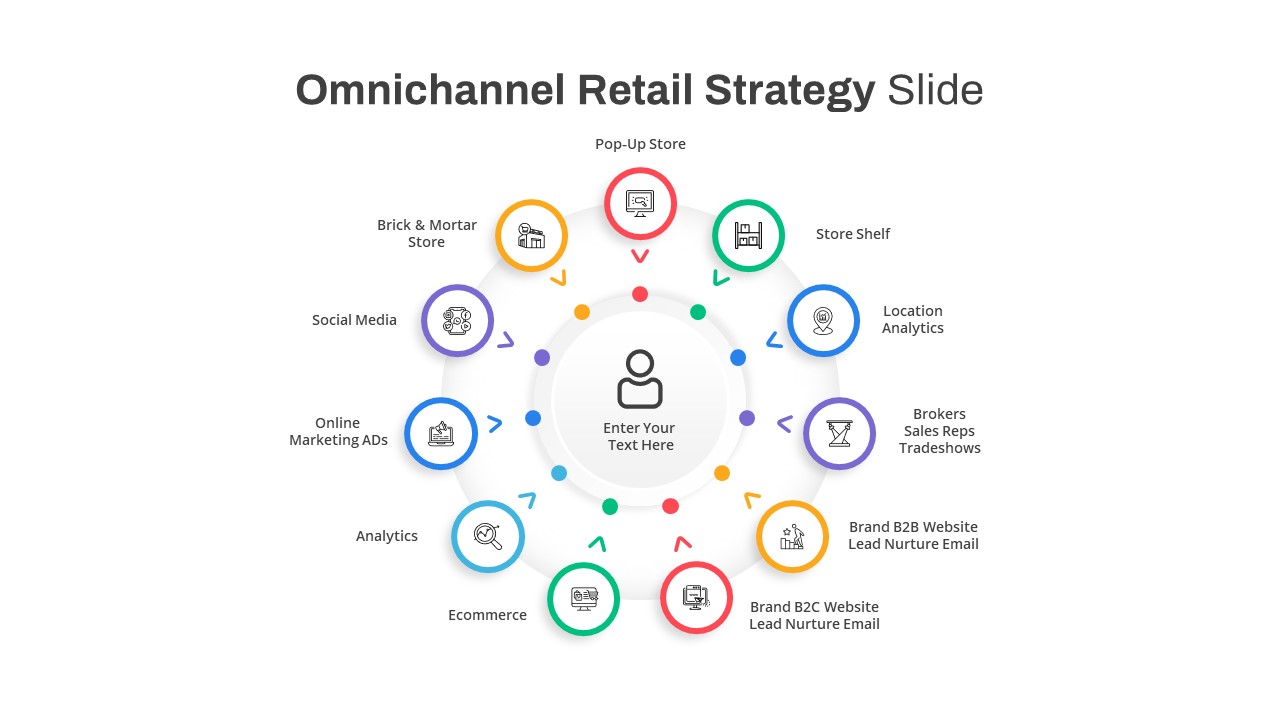
Omnichannel Retail Strategy Hub & Spoke Template for PowerPoint & Google Slides
Business Strategy
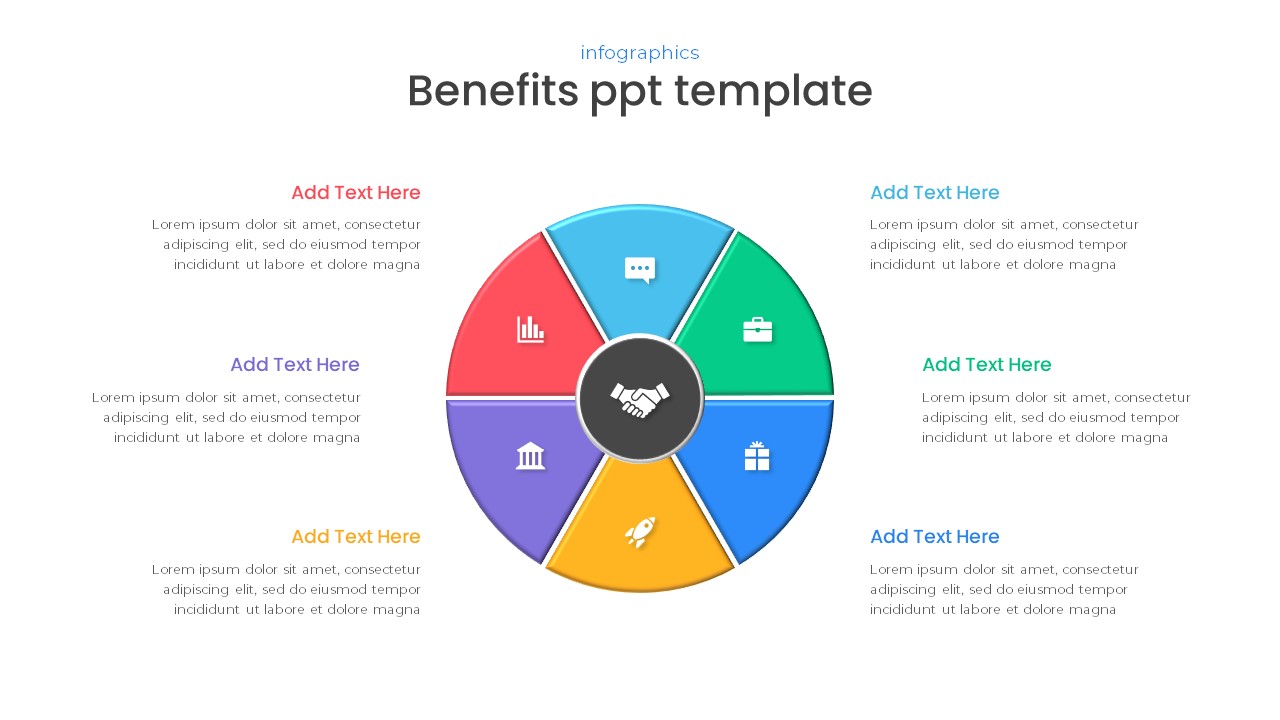
Free Six-Part Hub-and-Spoke Benefits Template for PowerPoint & Google Slides
Circular
Free
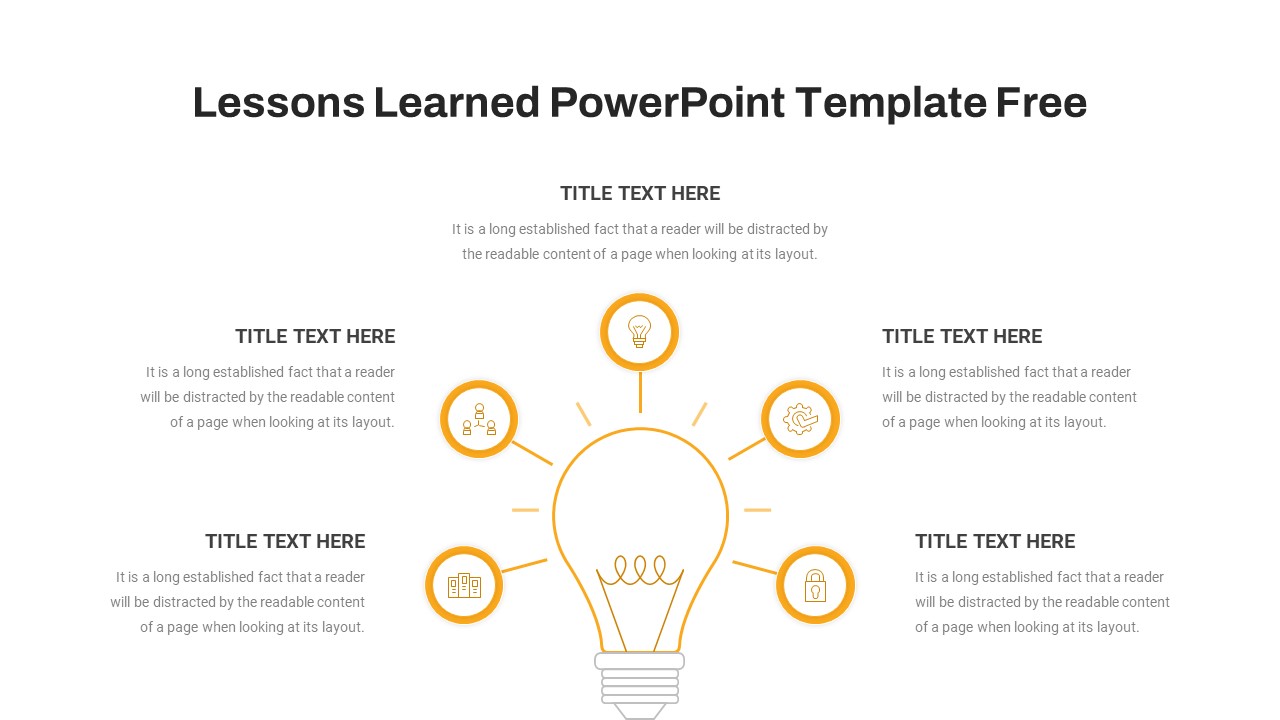
Lessons Learned Hub and Spoke Diagram Template for PowerPoint & Google Slides
Leadership
Free
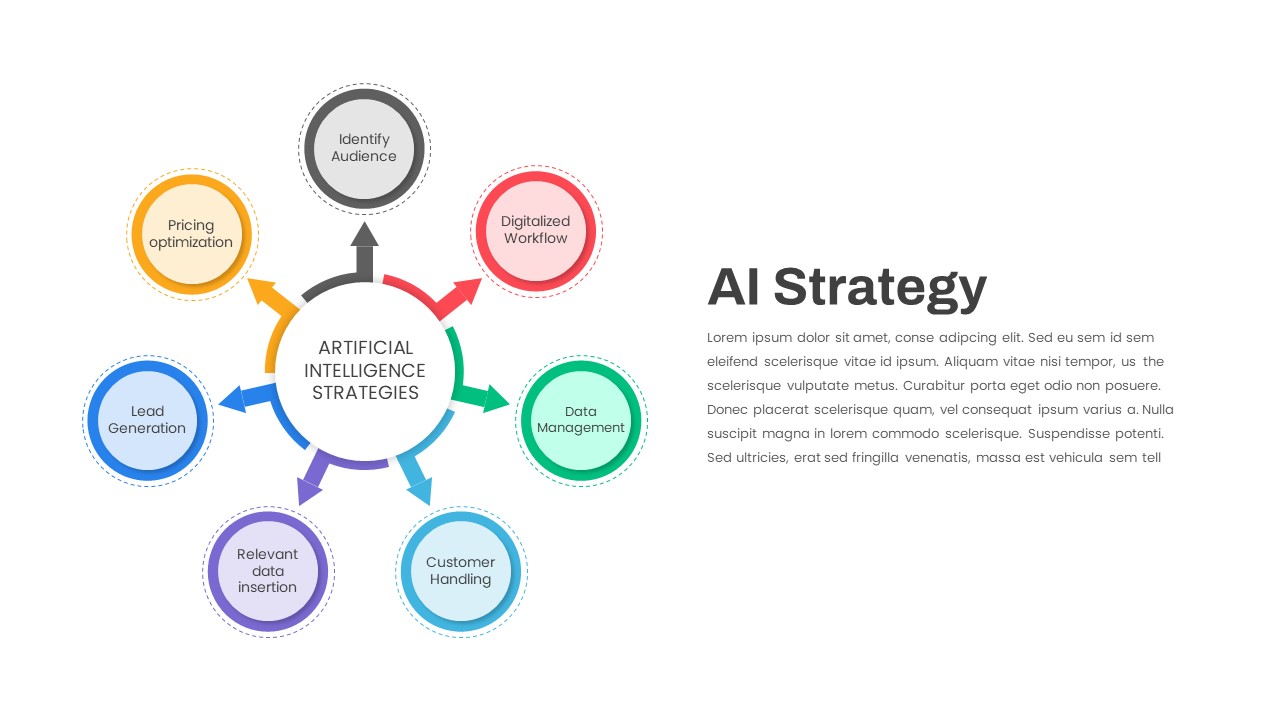
AI Strategy Hub-and-Spoke Diagram Template for PowerPoint & Google Slides
Circular
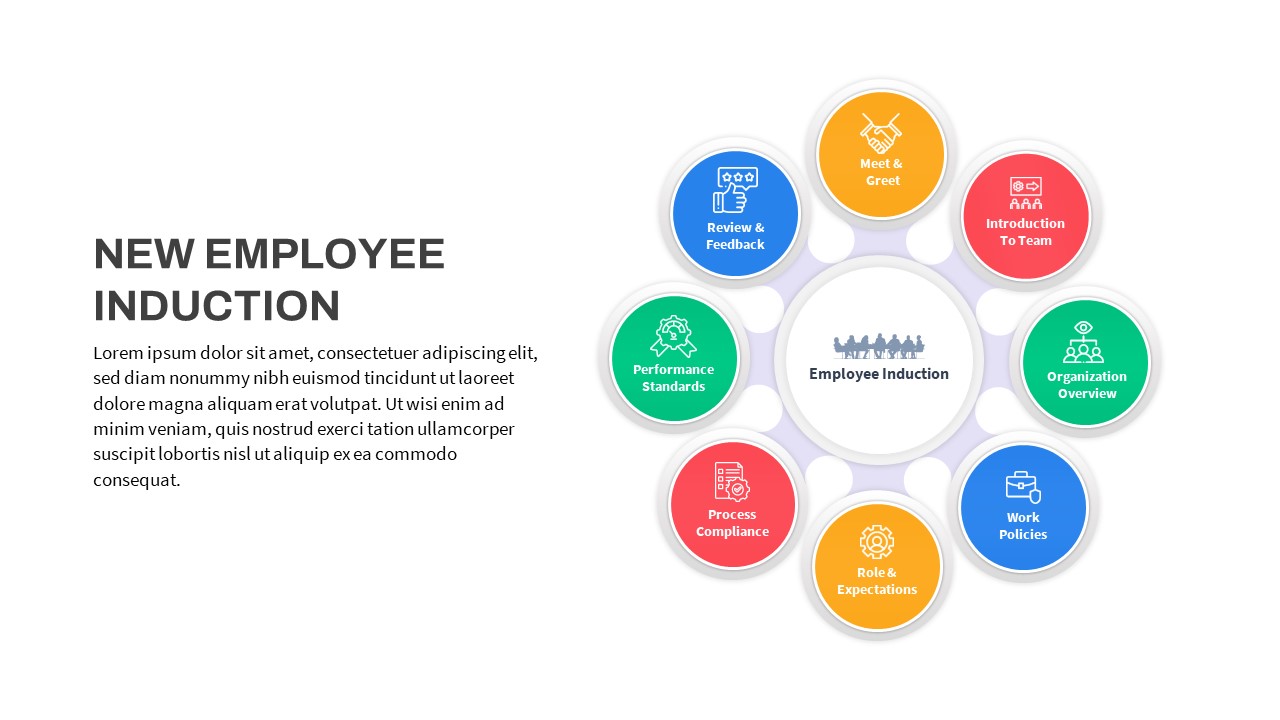
Free New Employee Induction Hub-and-Spoke Template for PowerPoint & Google Slides
Recruitment
Free
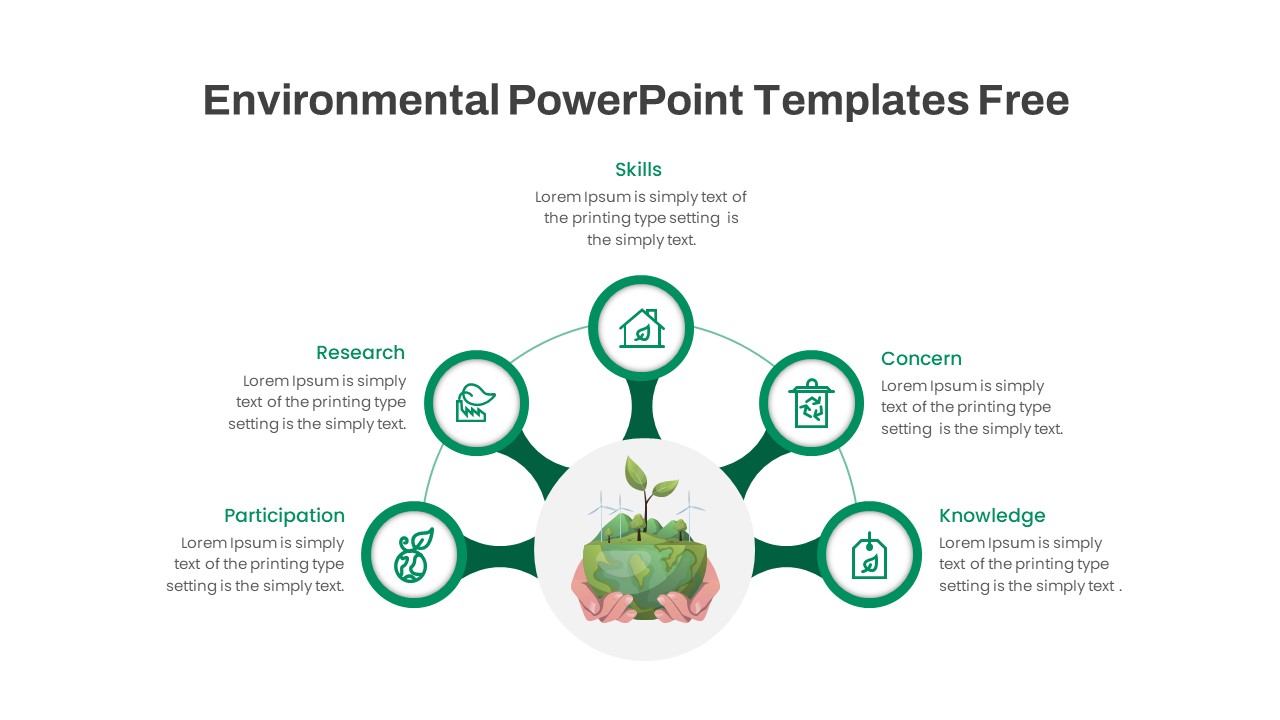
Free Environmental Hub-and-Spoke Diagram Template for PowerPoint & Google Slides
Circular
Free
AI Rules Hub and Spoke Diagram Template for PowerPoint & Google Slides
AI
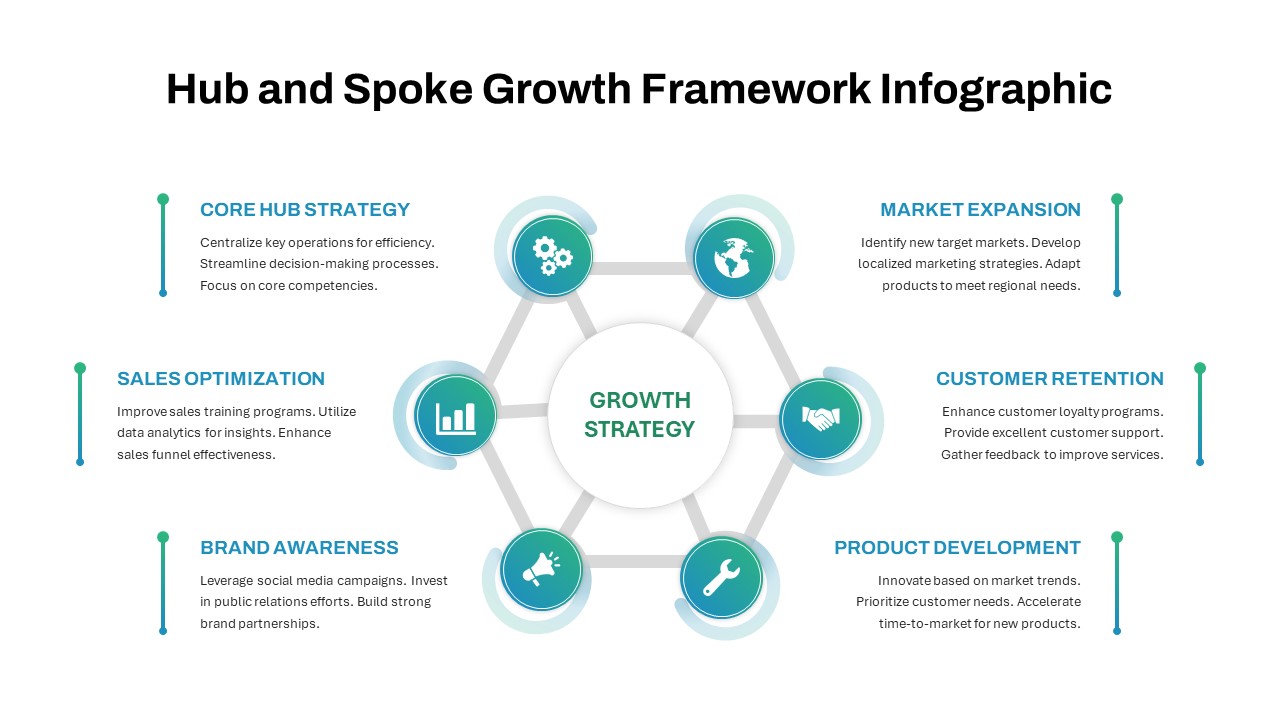
Hub and Spoke Growth Framework Template for PowerPoint & Google Slides
Circular
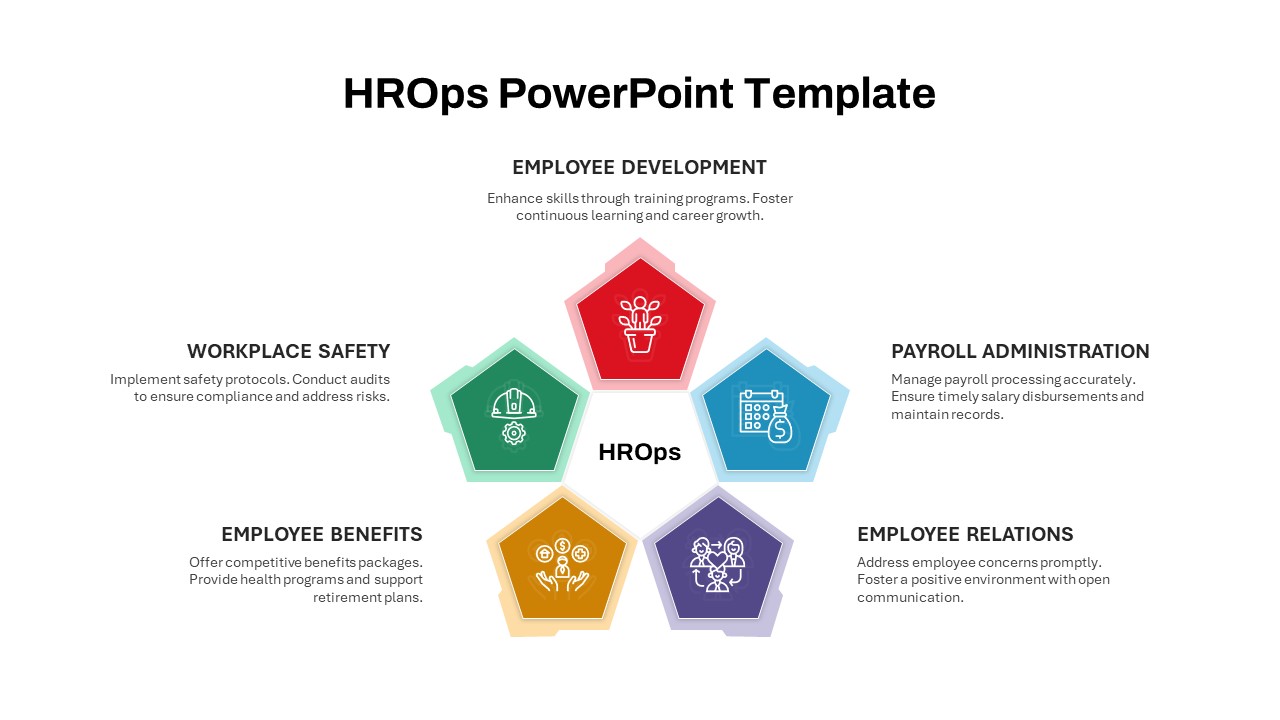
HROps Hub and Spoke Circular Diagram Template for PowerPoint & Google Slides
Circular
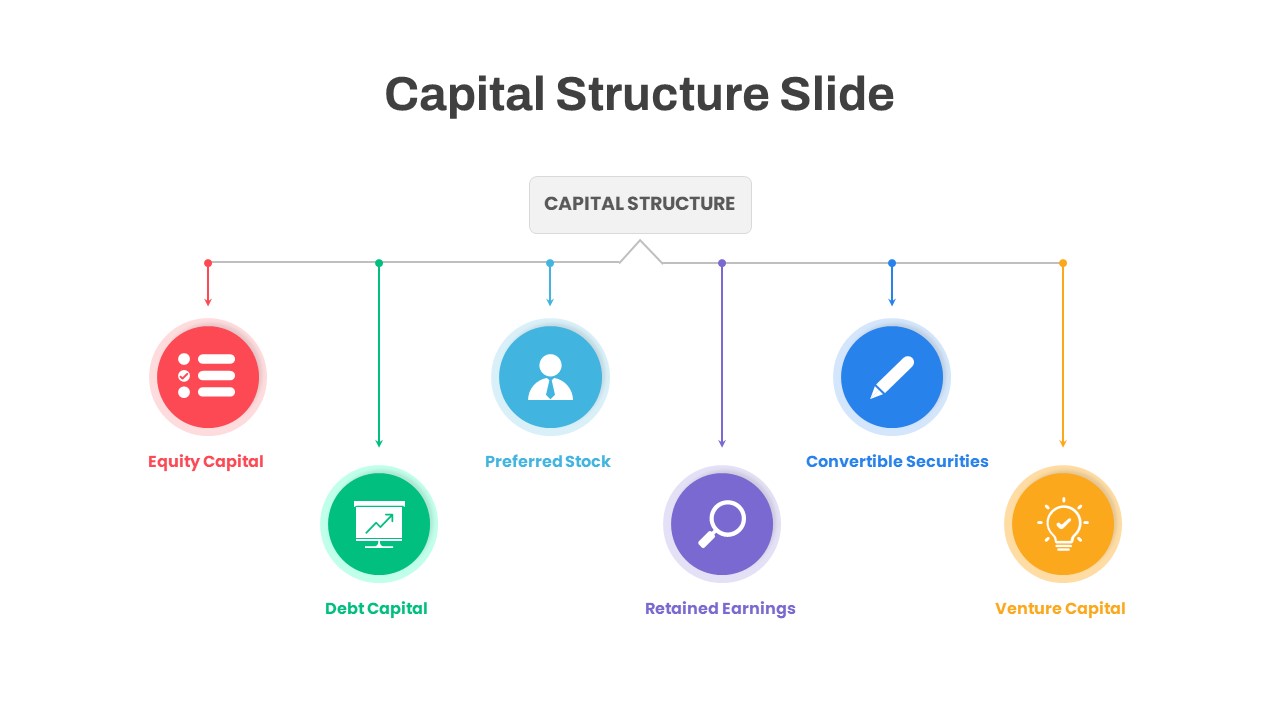
Capital Structure Hub & Spoke Diagram Template for PowerPoint & Google Slides
Process
Career Portfolio Hub-and-Spoke Diagram Template for PowerPoint & Google Slides
Circular
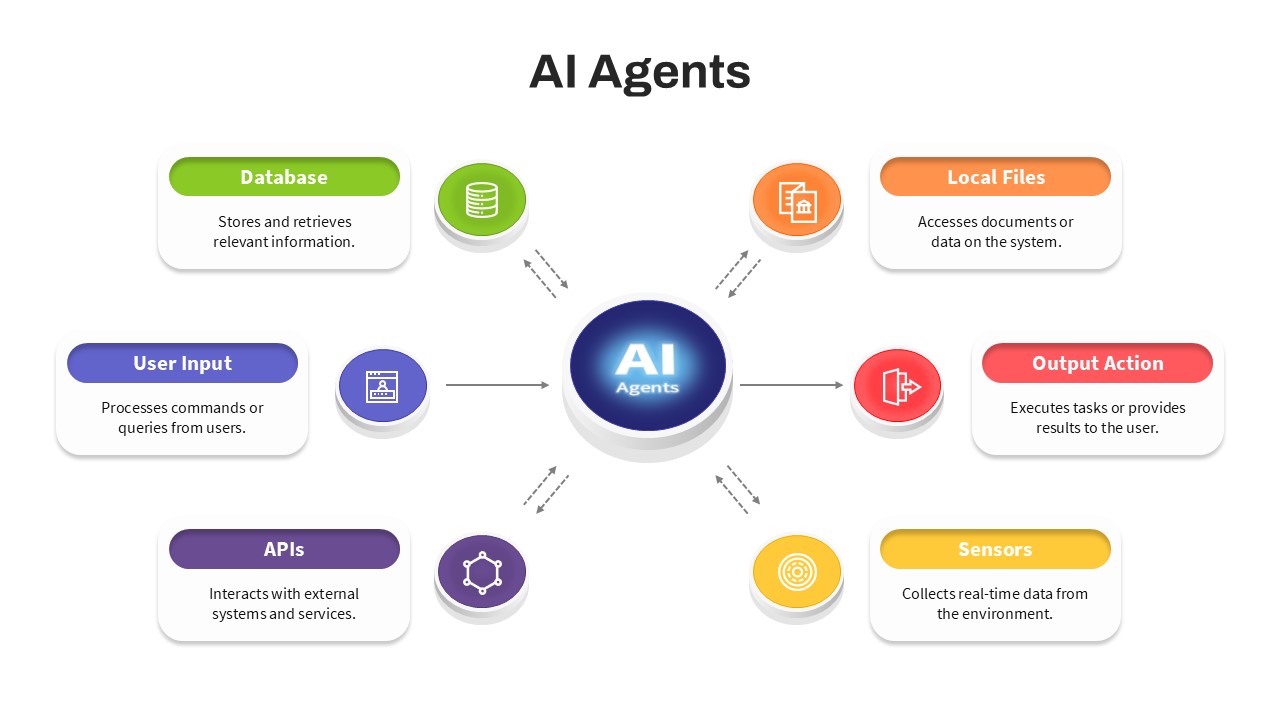
AI Agents Hub and Spoke Diagram Template for PowerPoint & Google Slides
AI
Data Lake Hub-and-Spoke Diagram Template for PowerPoint & Google Slides
Cloud Computing
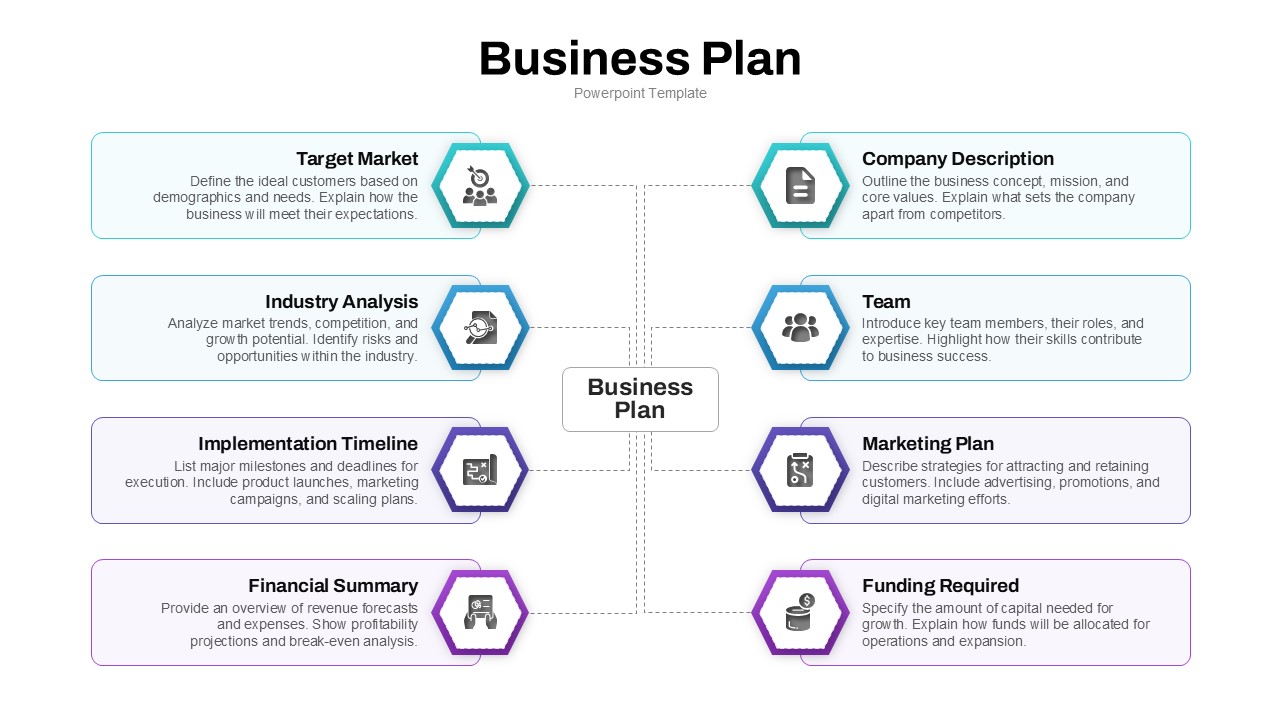
Business Plan Hub-and-Spoke Slide Template for PowerPoint & Google Slides
Business Plan
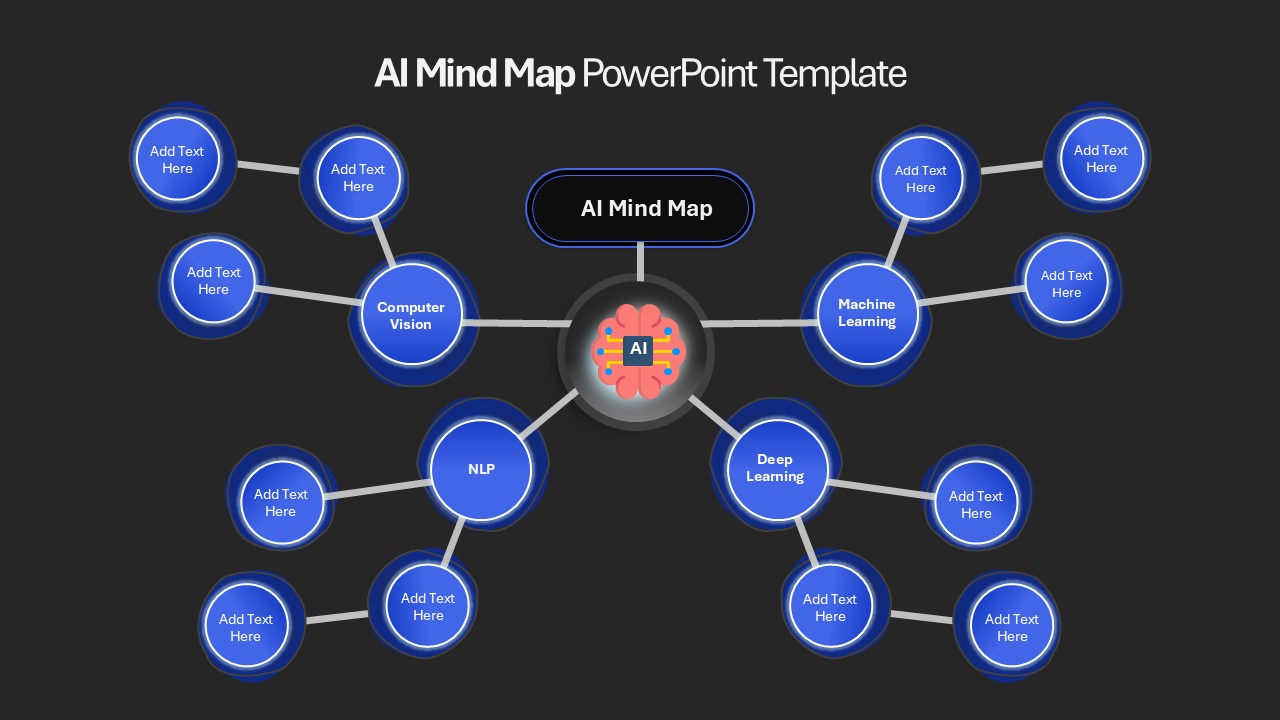
AI Mind Map & Hub-and-Spoke Diagram Template for PowerPoint & Google Slides
Mind Maps
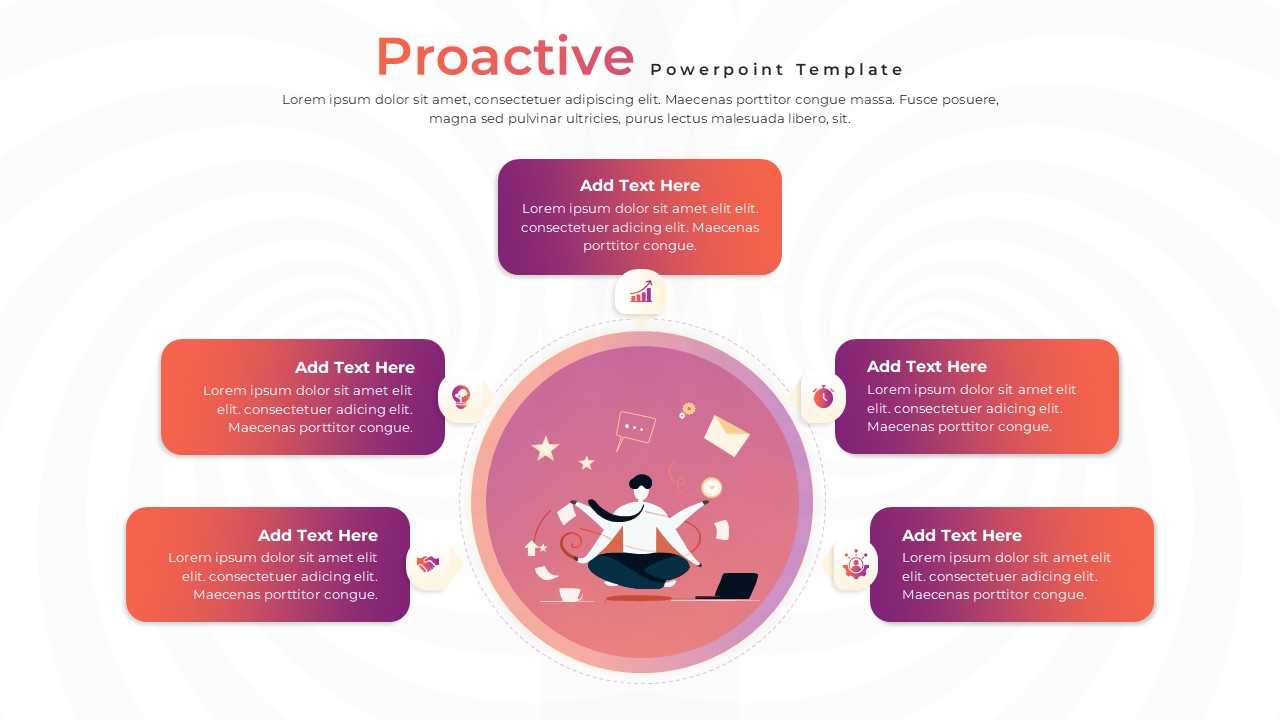
Proactive Hub-and-Spoke Diagram Template for PowerPoint & Google Slides
Process
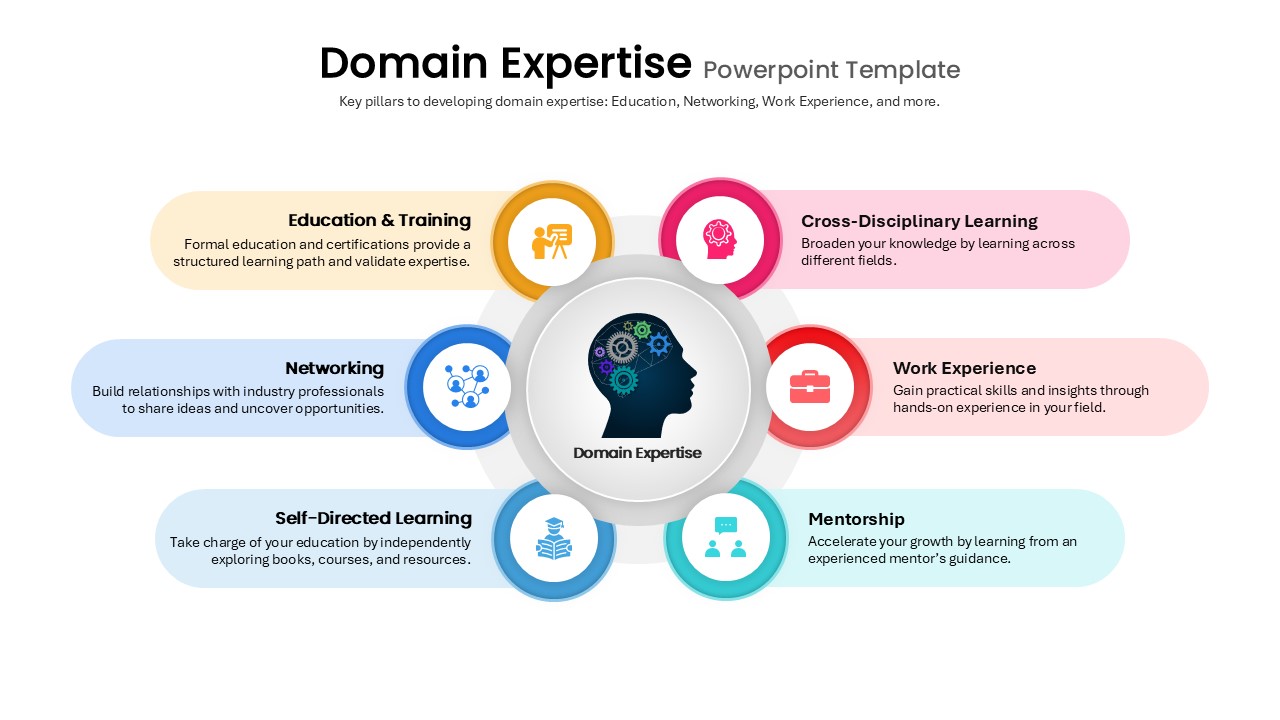
Domain Expertise Pillars Hub-and-Spoke Template for PowerPoint & Google Slides
Circular
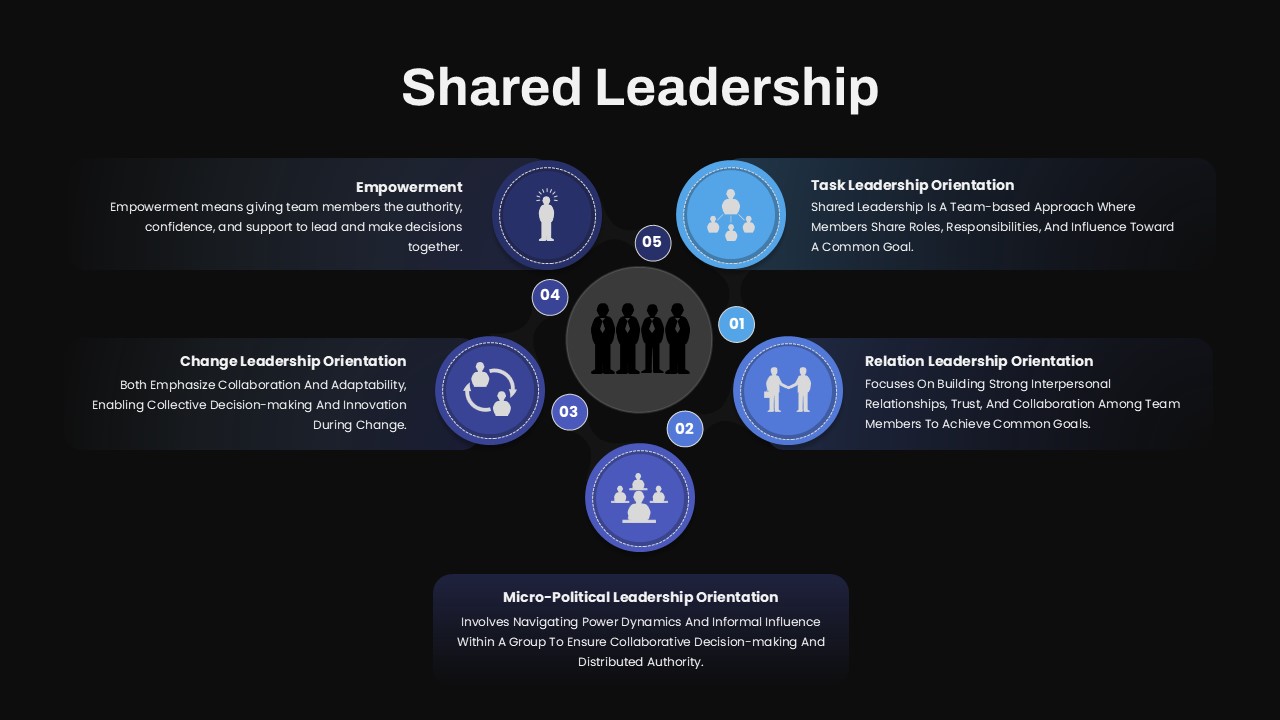
Shared Leadership Hub-and-Spoke Template for PowerPoint & Google Slides
Circular
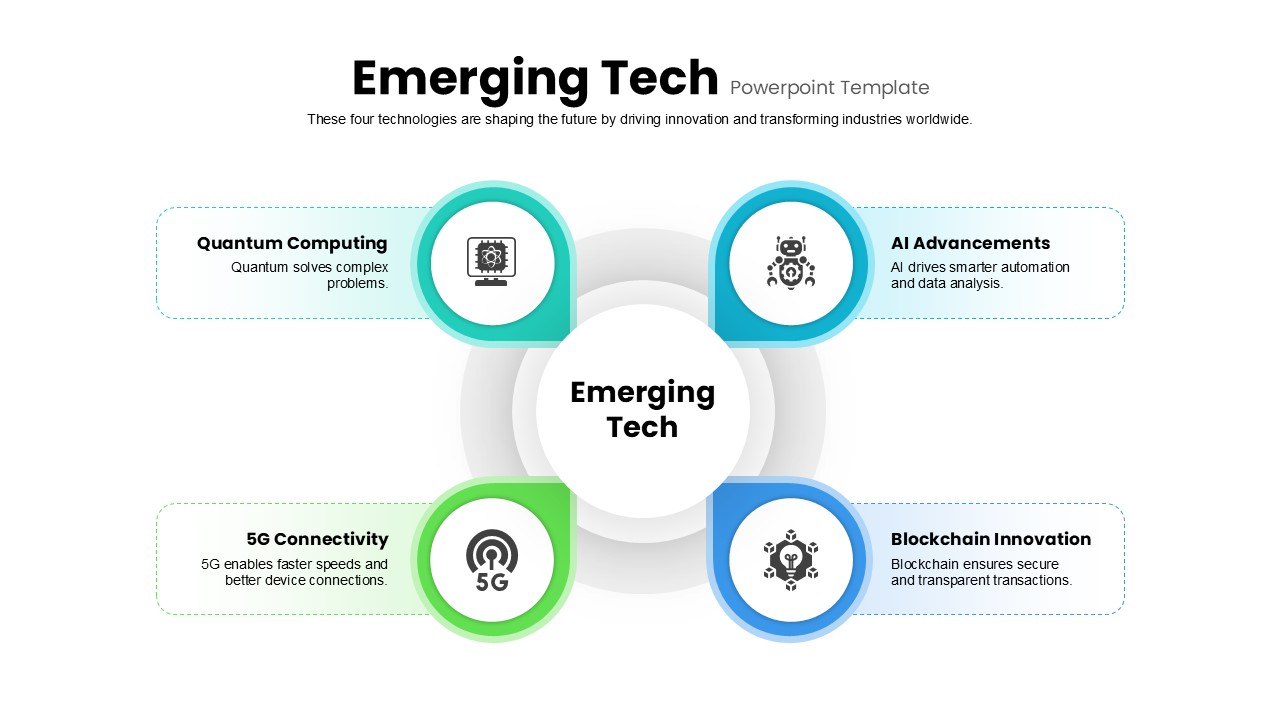
Emerging Tech Hub-and-Spoke Diagram Template for PowerPoint & Google Slides
Technology
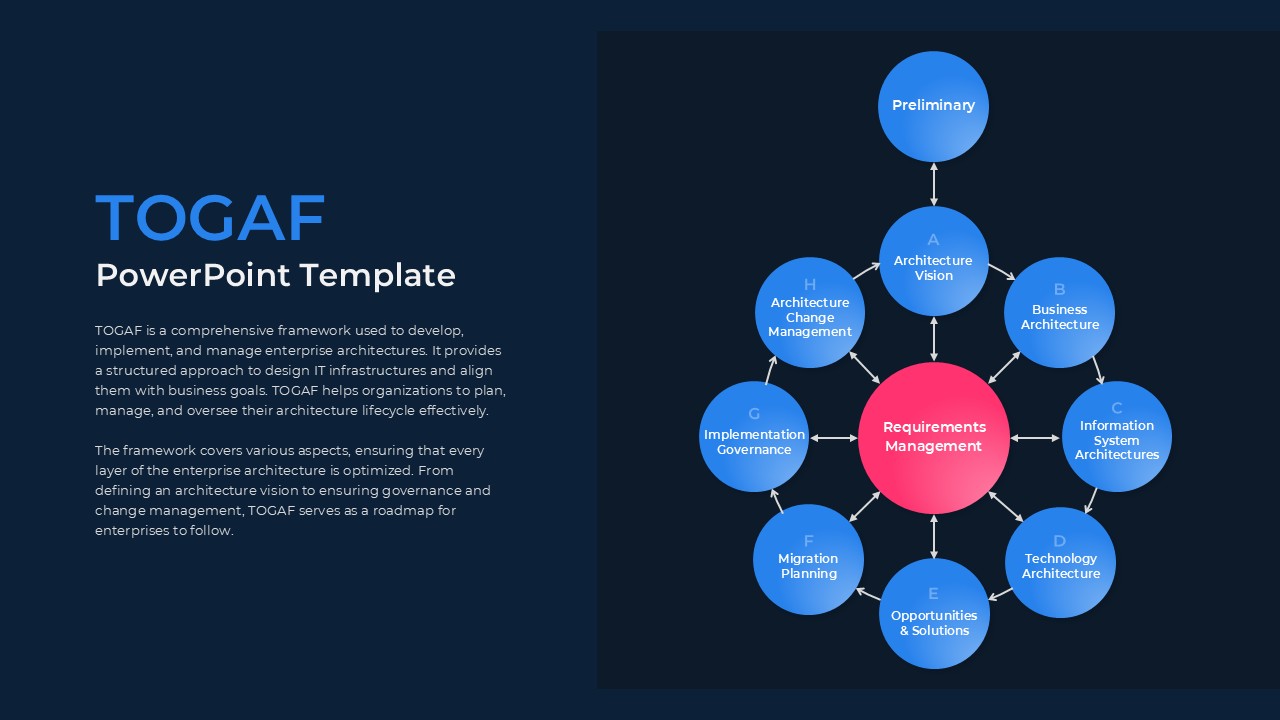
TOGAF Architecture Hub-and-Spoke Template for PowerPoint & Google Slides
Circular
Cloud Cost Optimization Hub-and-Spoke Template for PowerPoint & Google Slides
Cloud Computing
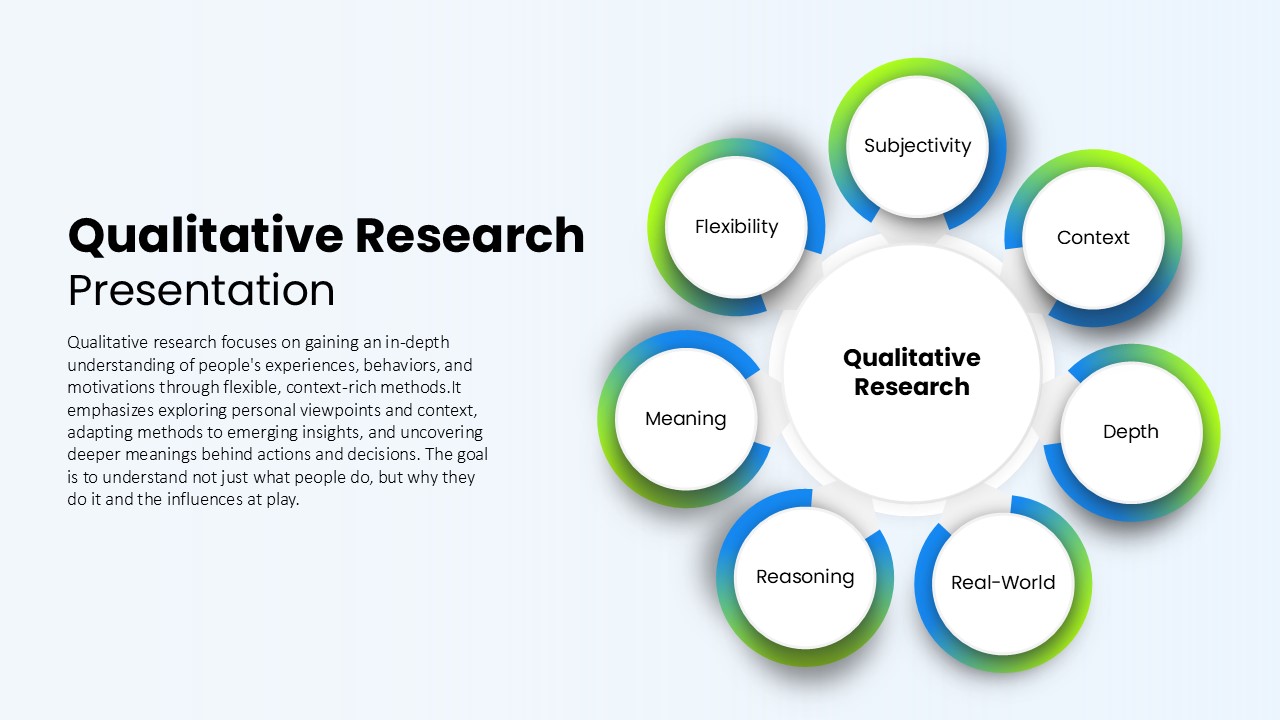
Qualitative Research Hub and Spoke Template for PowerPoint & Google Slides
Circular
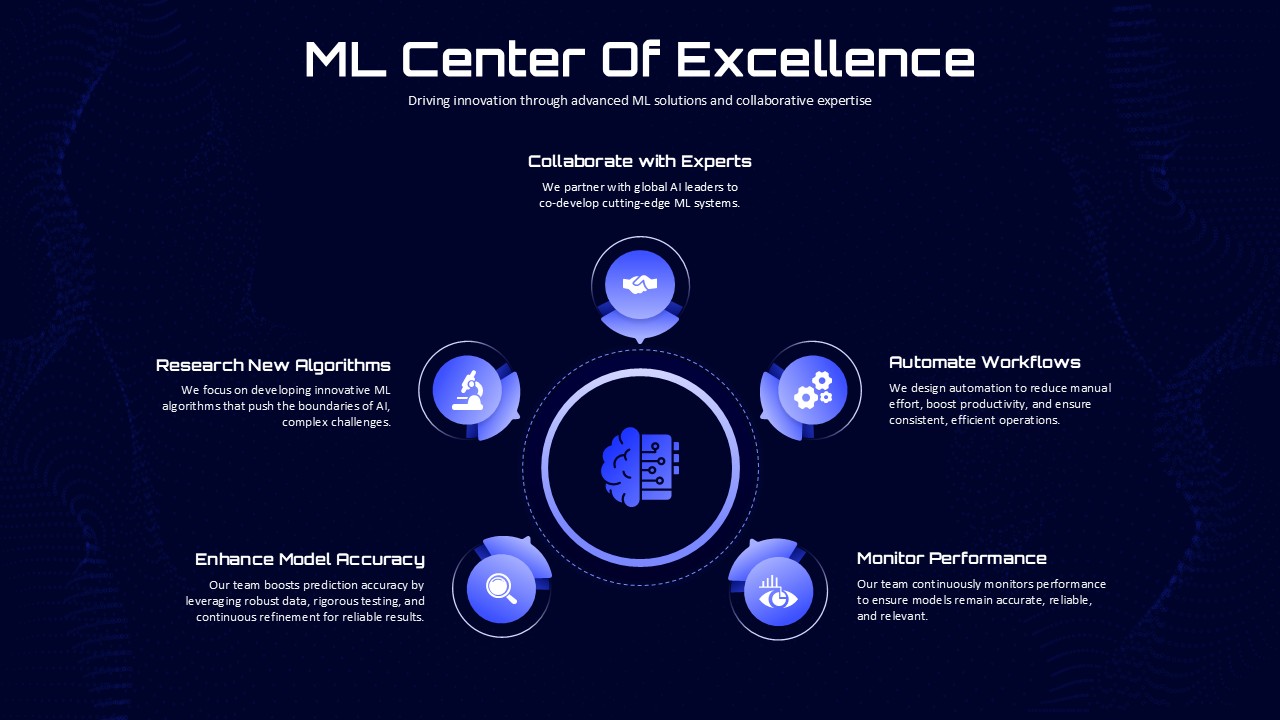
ML Center of Excellence Hub & Spoke Template for PowerPoint & Google Slides
Machine Learning
7 Hub and Spoke Diagram Slide for PowerPoint & Google Slides
Process
Hub and Spoke Diagram Slide for PowerPoint & Google Slides
Circular
Hub and Spoke Diagram for PowerPoint & Google Slides
Business Models
Idea Brain Concept Infographic Template for PowerPoint & Google Slides
Business Proposal
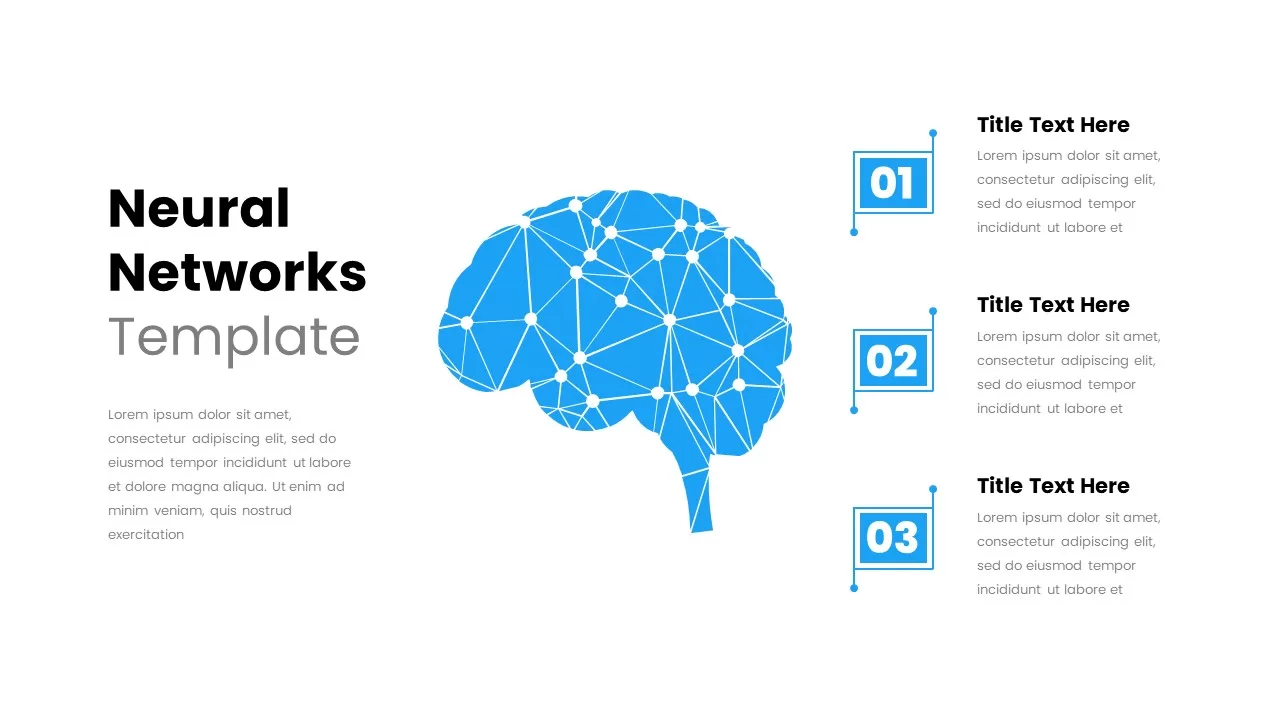
Neural Network Brain Infographic Template for PowerPoint & Google Slides
Process
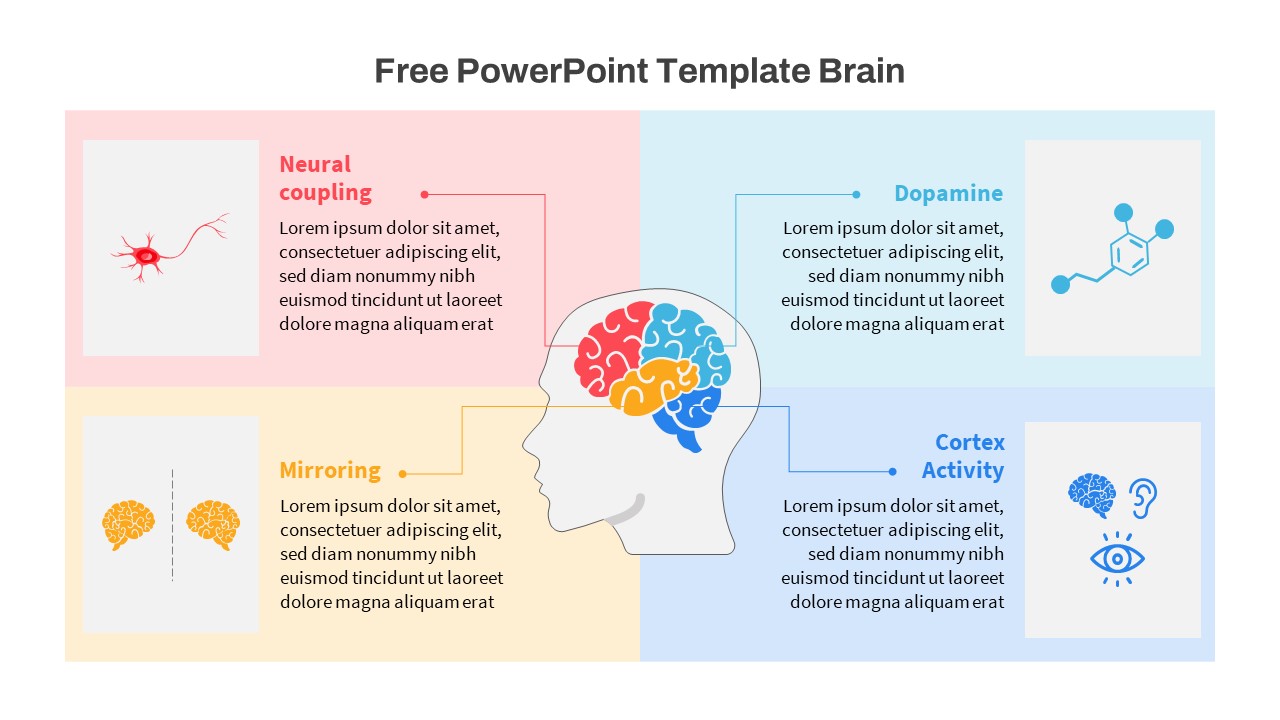
Free Brain Function Diagram Infographic Template for PowerPoint & Google Slides
Process
Free
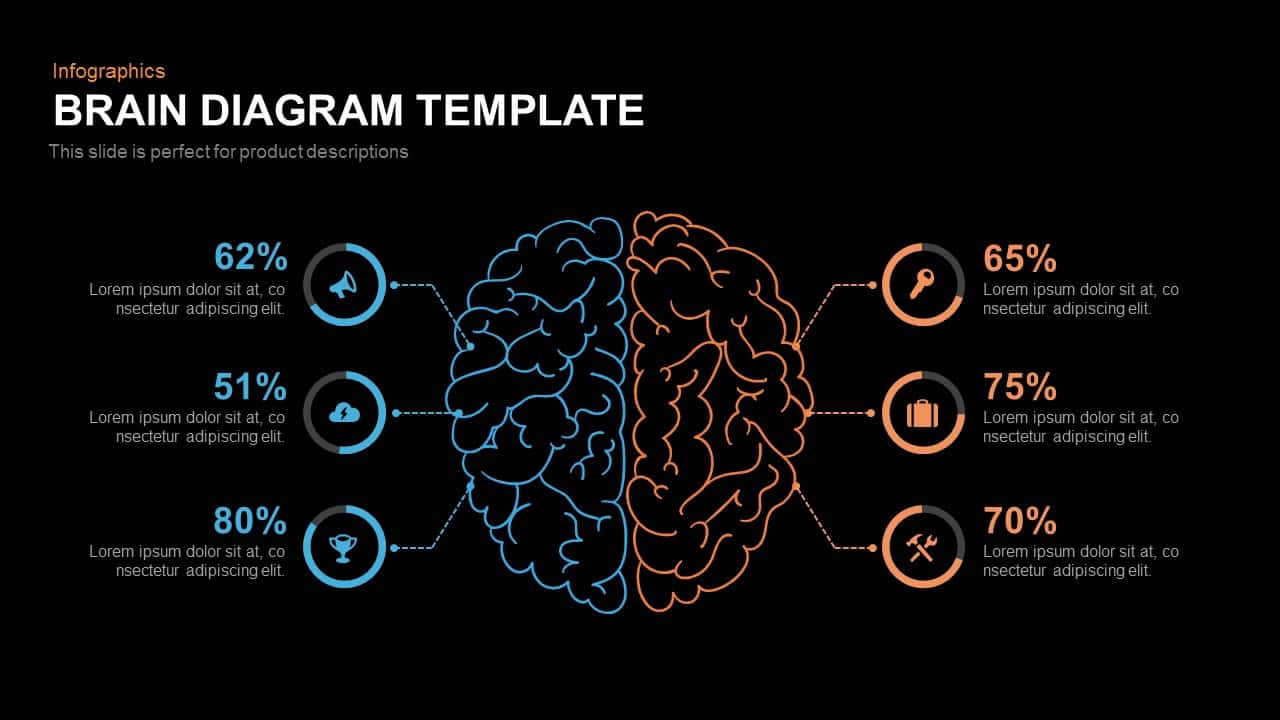
Brain Diagram template for PowerPoint & Google Slides
Mind Maps
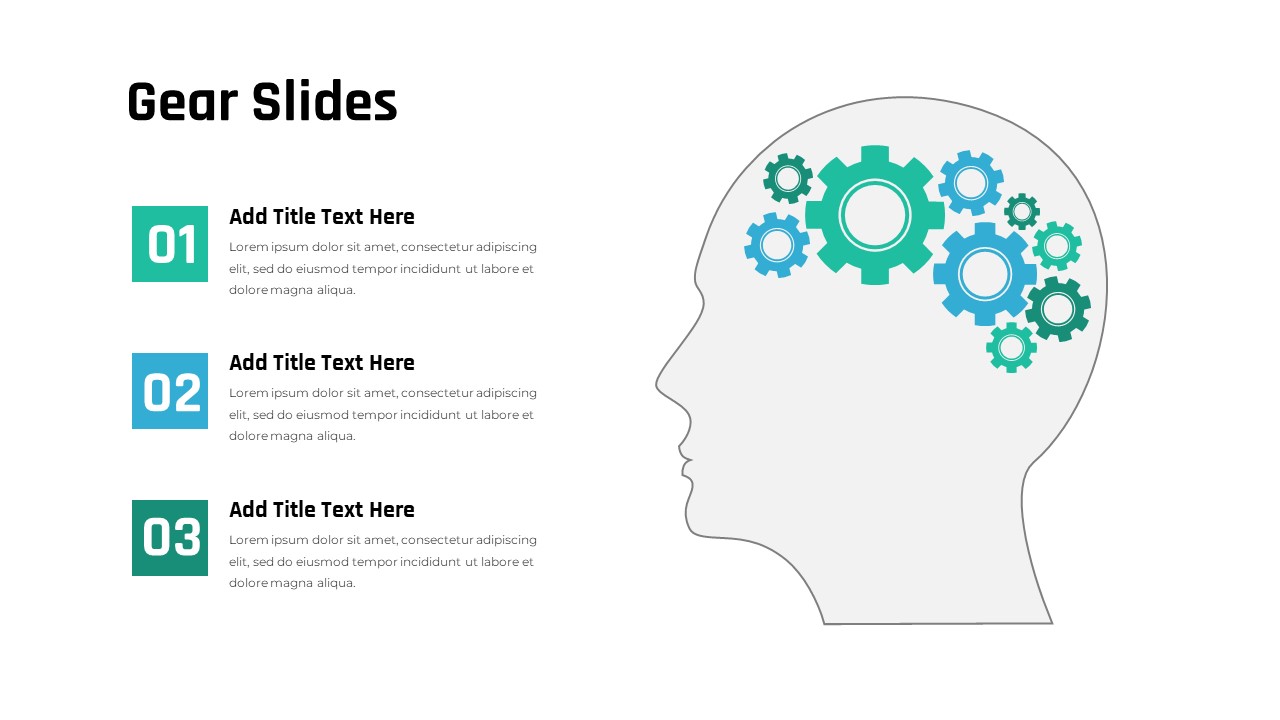
Three-Step Gears Brain Diagram Template for PowerPoint & Google Slides
Process
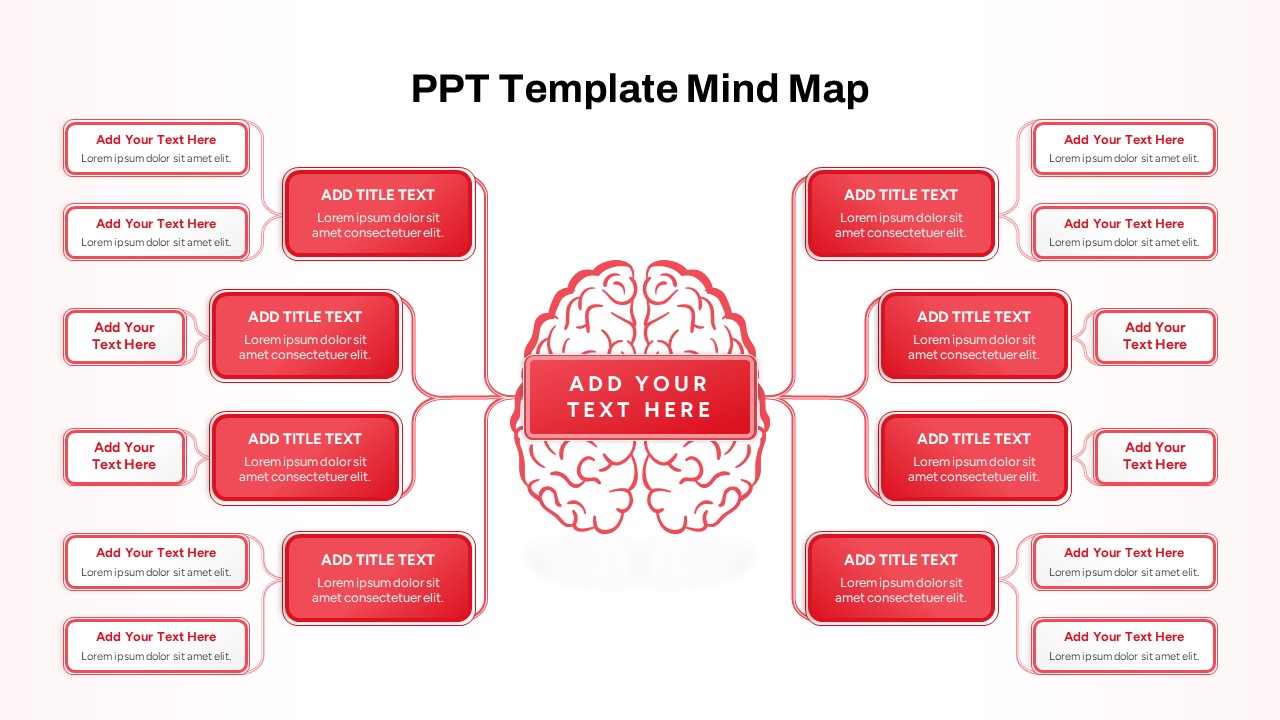
Red Brain Mind Map Diagram Template for PowerPoint & Google Slides
Mind Maps
Six-Segment Circular Hub Infographic Template for PowerPoint & Google Slides
Circular
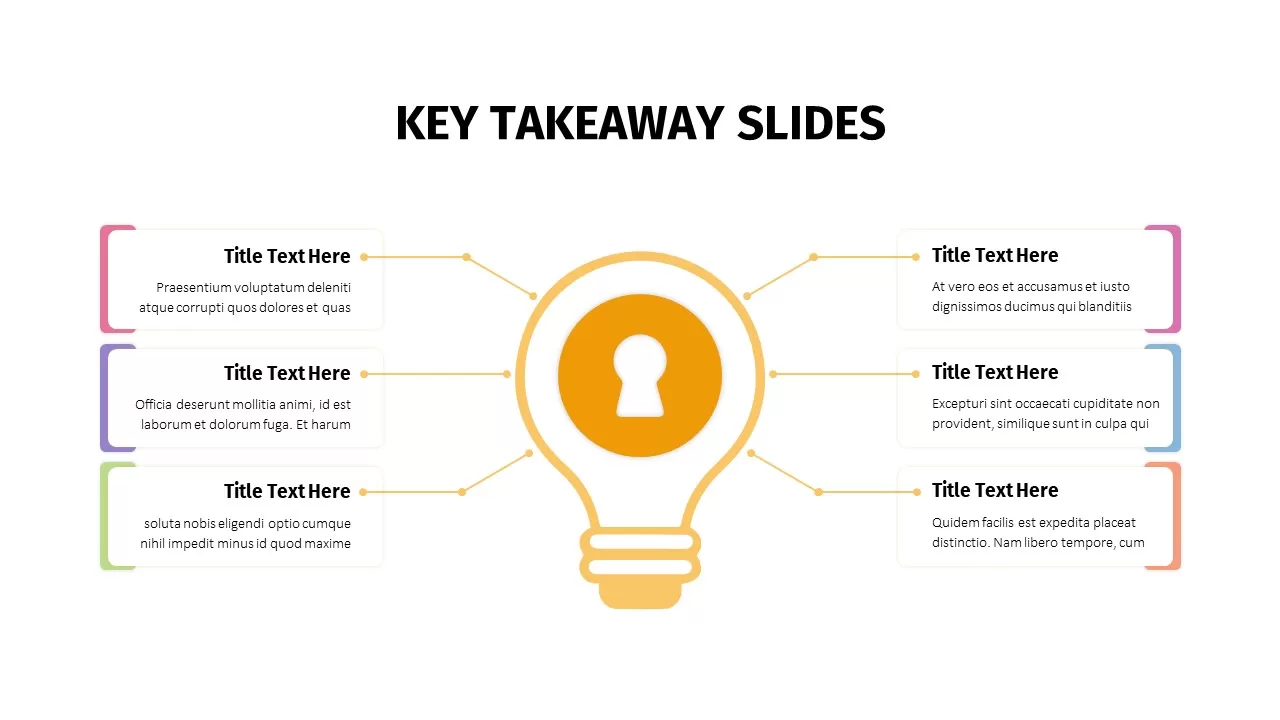
Animated Key Takeaway Spoke Infographic Template for PowerPoint & Google Slides
Infographics

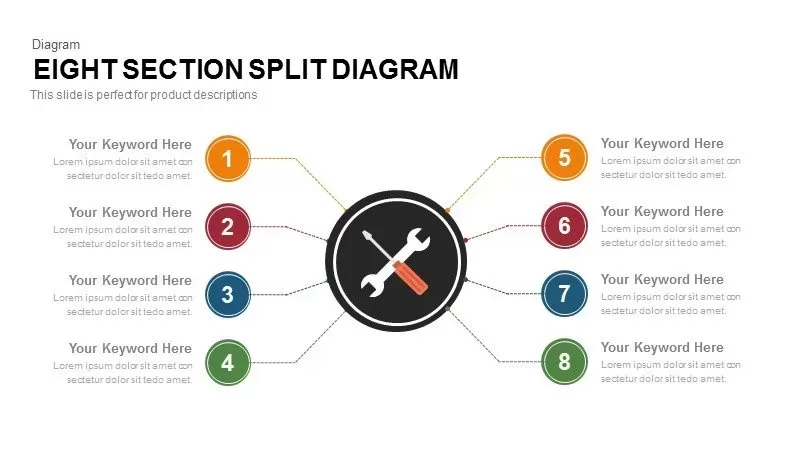
8-Section Split Diagram with Hub Icon template for PowerPoint & Google Slides
Circular
Multi-layout Circle Spoke Diagram Template for PowerPoint & Google Slides
Circular
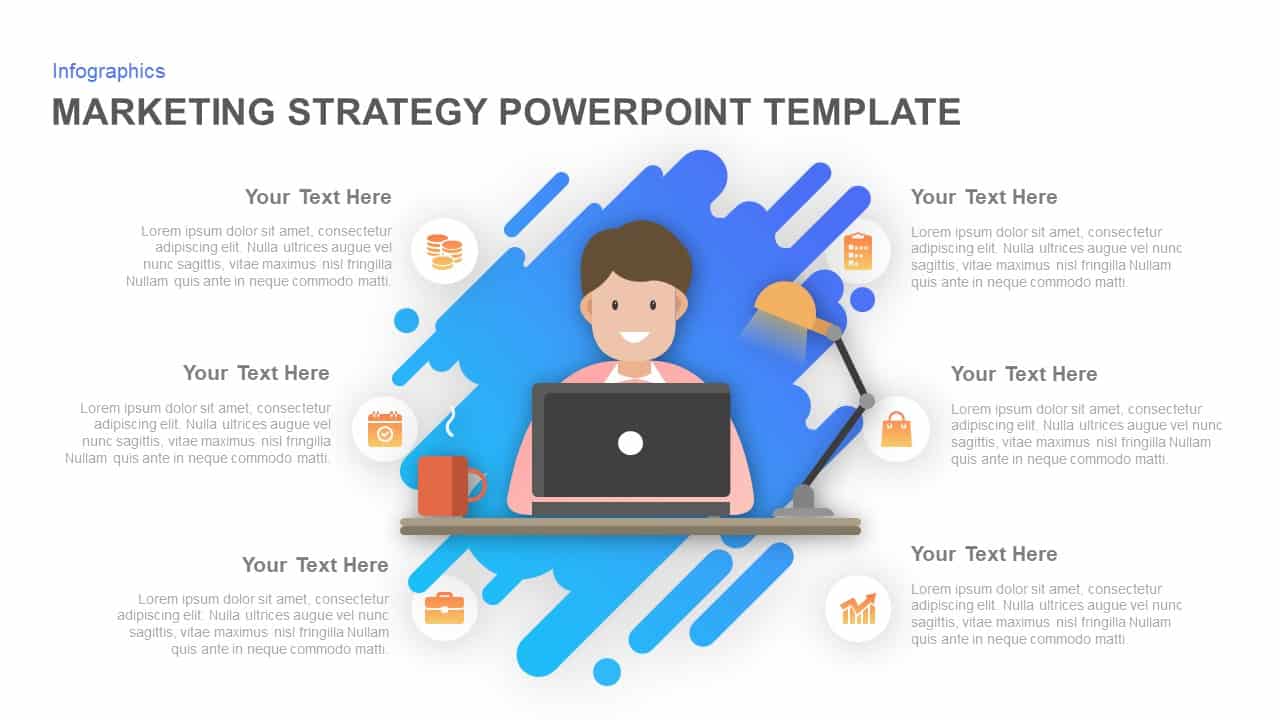
Marketing Strategy Hub Template for PowerPoint & Google Slides
Digital Marketing
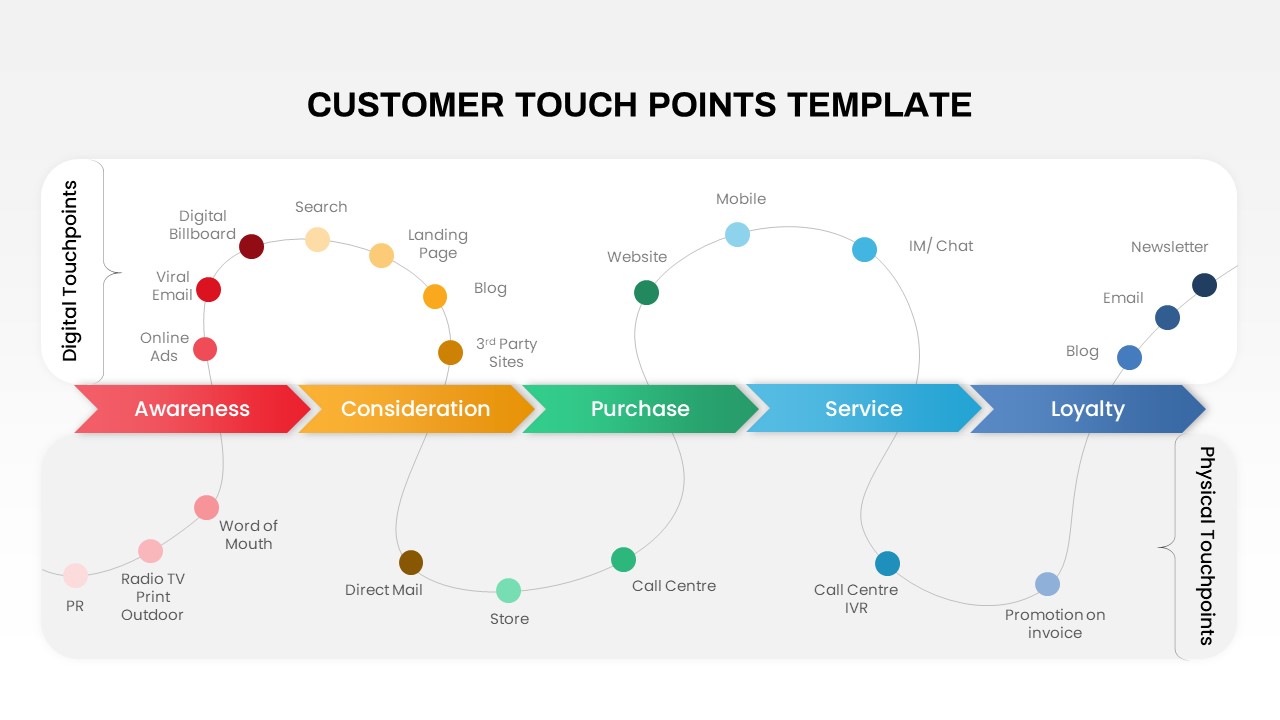
Customer Touchpoints Journey & Hub Template for PowerPoint & Google Slides
Customer Journey
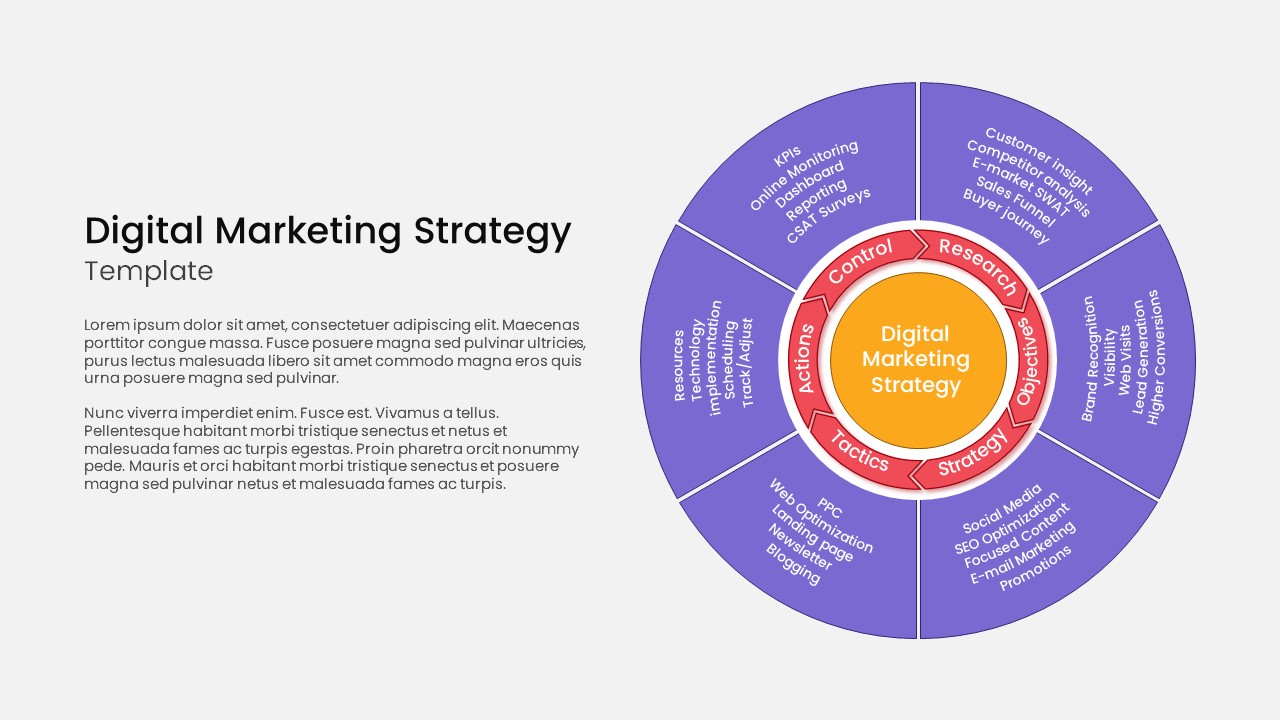
Circular Hub Digital Marketing Strategy Template for PowerPoint & Google Slides
Digital Marketing
Dynamic Carousel Icon Hub Diagram Template for PowerPoint & Google Slides
Circular
AI Applications Radial Hub Diagram Template for PowerPoint & Google Slides
Circular
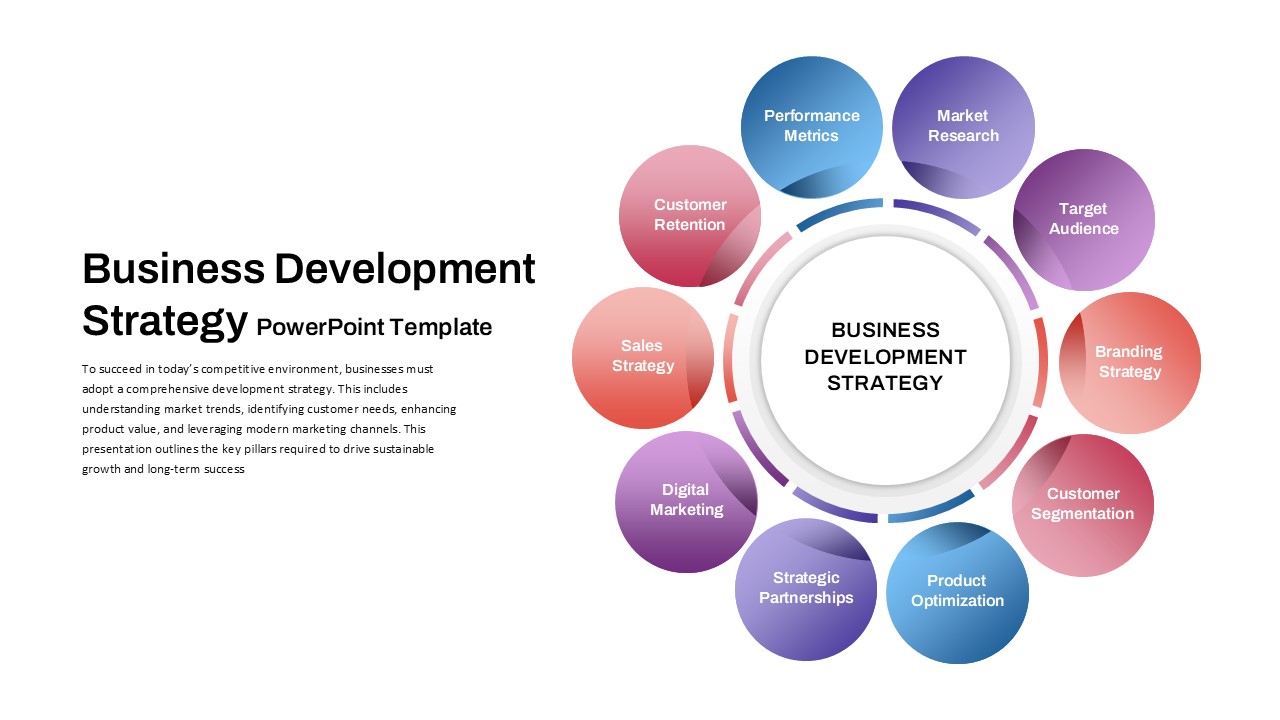
Business Development Strategy Radial Hub Template for PowerPoint & Google Slides
Circular
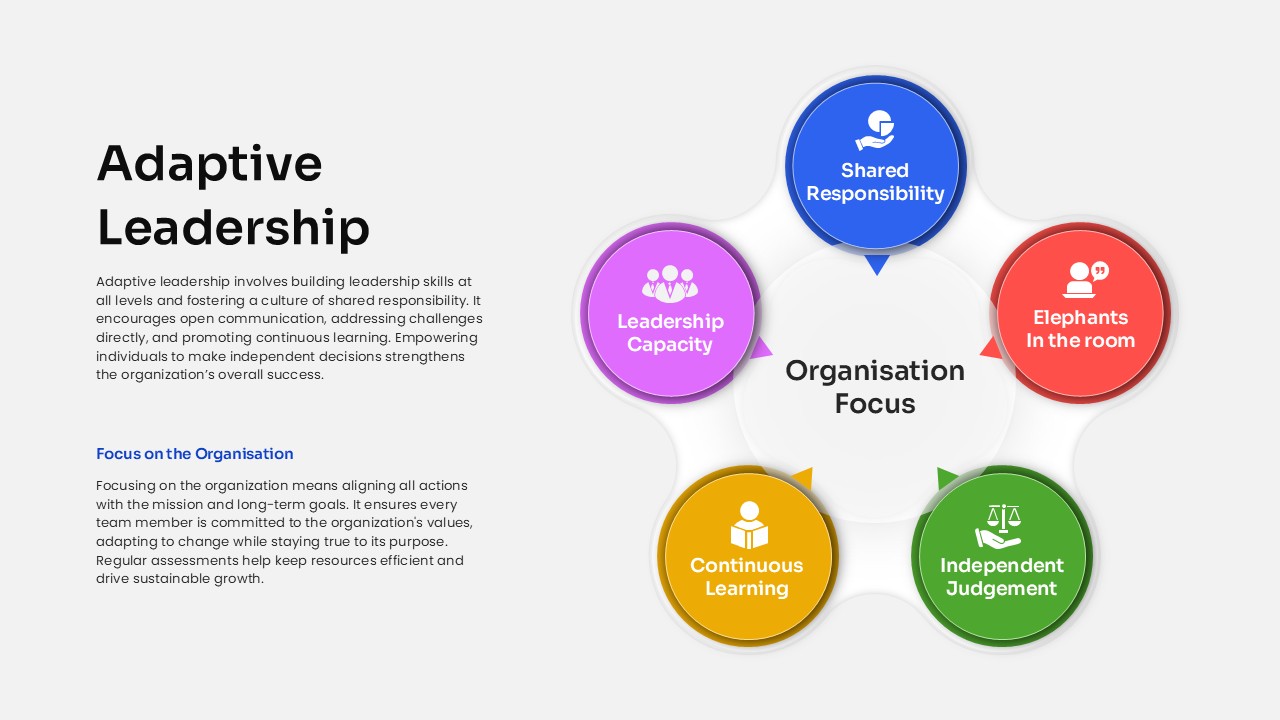
Adaptive Leadership Hub Diagram Template for PowerPoint & Google Slides
Leadership
Social Media Network Hub Diagram Slide for PowerPoint & Google Slides
Process
Google Ads Optimization & Performance Infographic Template for PowerPoint & Google Slides
Digital Marketing
SQ3R Study Strategy Infographic Slides Template for PowerPoint & Google Slides
Business Strategy
Six Double Diamond Infographic Slides Template for PowerPoint & Google Slides
Process
Casino/Poker Chips Infographic Slides template for PowerPoint & Google Slides
Business Strategy
Agenda Infographic Pack of 2 Slides Template for PowerPoint & Google Slides
Agenda
Quad Chart Infographic Pack of 8 Slides Template for PowerPoint & Google Slides
Comparison Chart
Four Options Infographic Slides Template for PowerPoint & Google Slides
Comparison
Game Plan Infographic Slides Pack Template for PowerPoint & Google Slides
Infographics