Types of AI Comparison Infographic Template for PowerPoint & Google Slides


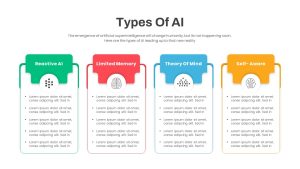
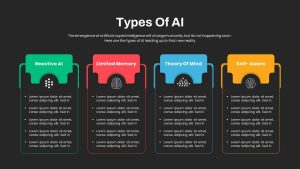
This slide presents the four core AI archetypes—Reactive AI, Limited Memory, Theory of Mind, and Self-Aware—in a clean, columnar infographic layout. Each card features a bold colored header (green, red, blue, yellow) with the principle name and icon, leading into a white-background body ideal for bullet-point details. Subtle drop shadows and thin outline borders create depth and maintain visual separation, while the horizontal alignment ensures easy side-by-side comparison of capabilities and use cases.
Built for fast edits, this template uses fully editable vector shapes, placeholder icons, and text blocks. Swap header hues to match your brand palette, replace any icon via drag-and-drop, or adjust border weights in seconds. Master-slide integration locks in consistent typography, spacing, and color styles across your deck. Whether in PowerPoint or Google Slides, the infographic maintains sharp clarity at any resolution and supports collaborative theme overrides for enterprise or academic environments.
Leverage this comparison layout to break down technical concepts, maturity models, or product feature sets. Its modular design lets you duplicate or remove cards to fit three, five, or six categories, while alignment guides keep your content pixel-perfect. With clear visual hierarchy and color-coded differentiation, your audience can instantly grasp distinctions between AI types and their implications.
Who is it for
Technology strategists, AI researchers, product managers, and educators will benefit from this slide when comparing AI architectures, designing roadmaps, or teaching core concepts. Marketing teams and consultants can also use it to present competitive analyses or feature audits.
Other Uses
Beyond AI, repurpose this layout for maturity-level comparisons, departmental overviews, vendor evaluations, or any scenario requiring a clear four-part breakdown. Hide or add cards, swap icons for KPIs, or convert it into a step-by-step process diagram to suit your narrative.
Login to download this file

Item ID
SB04251
Related Templates

Pricing Model Types Comparison Infographic Template for PowerPoint & Google Slides
Pitch Deck
Four Business Structure Types Comparison Diagram Template for PowerPoint & Google Slides
Business Strategy
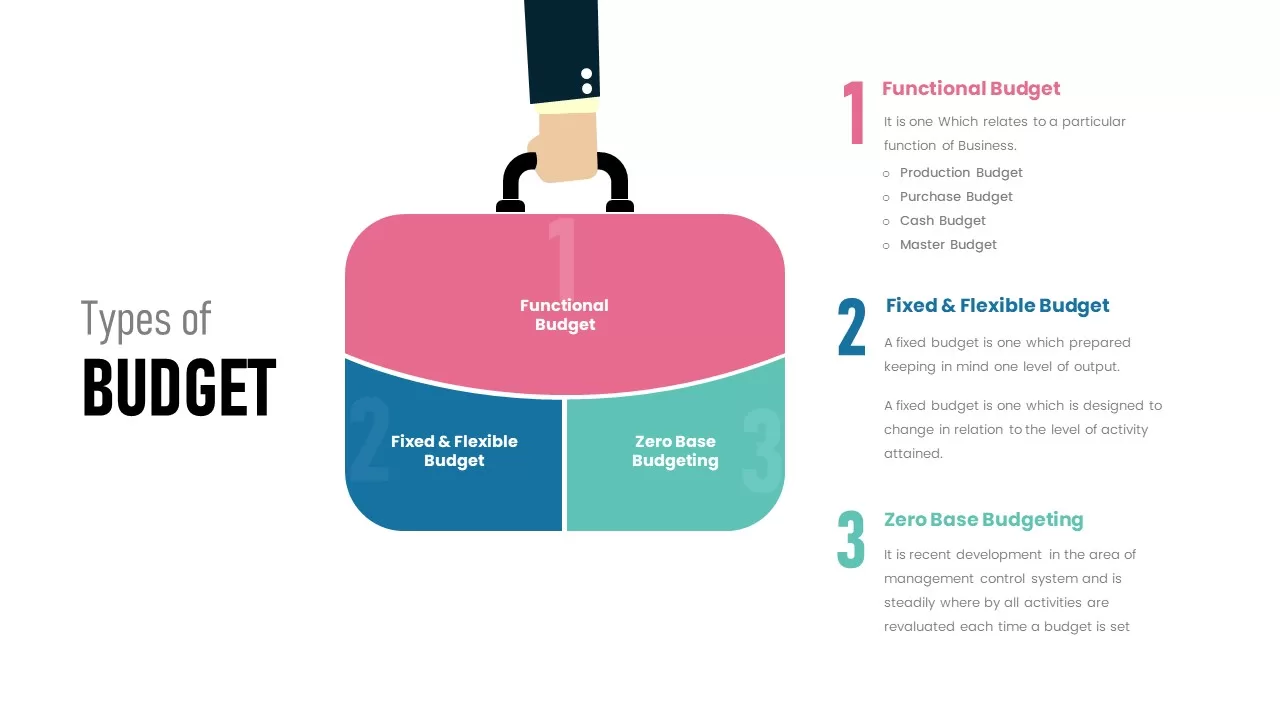
Types of Budget Infographic Pack Template for PowerPoint & Google Slides
Comparison
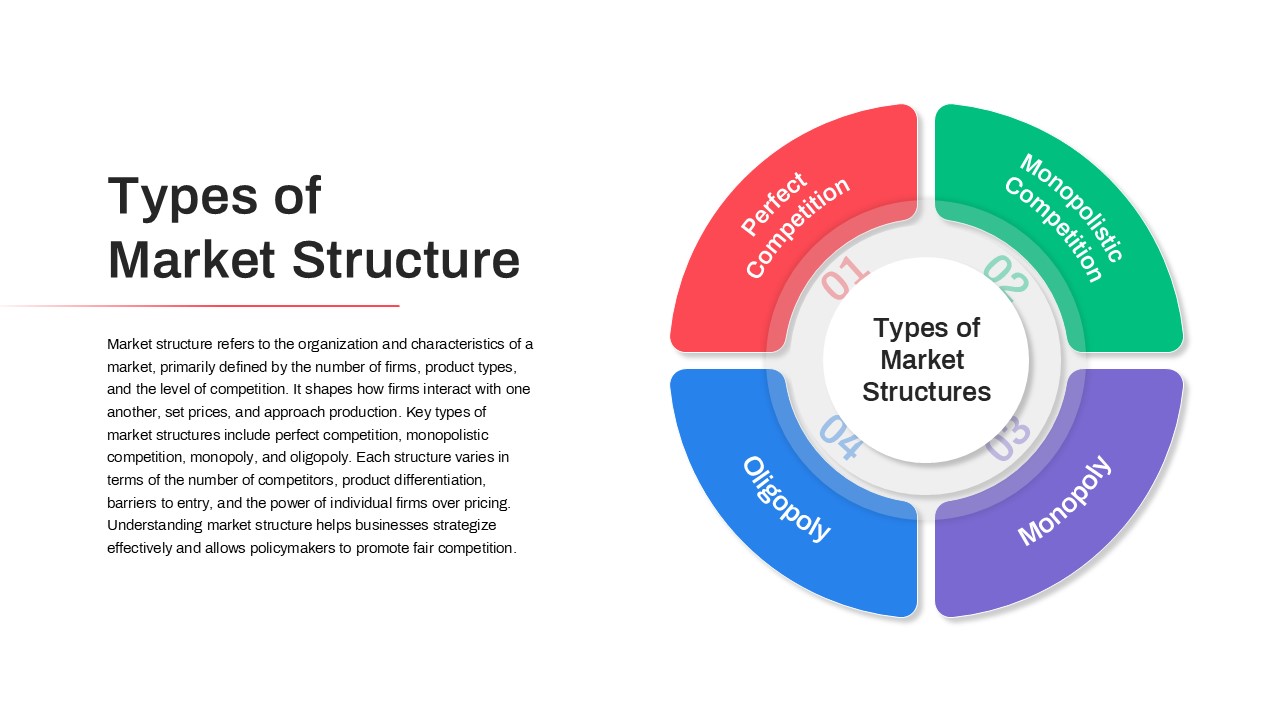
Types of Market Structure Infographic Template for PowerPoint & Google Slides
Comparison
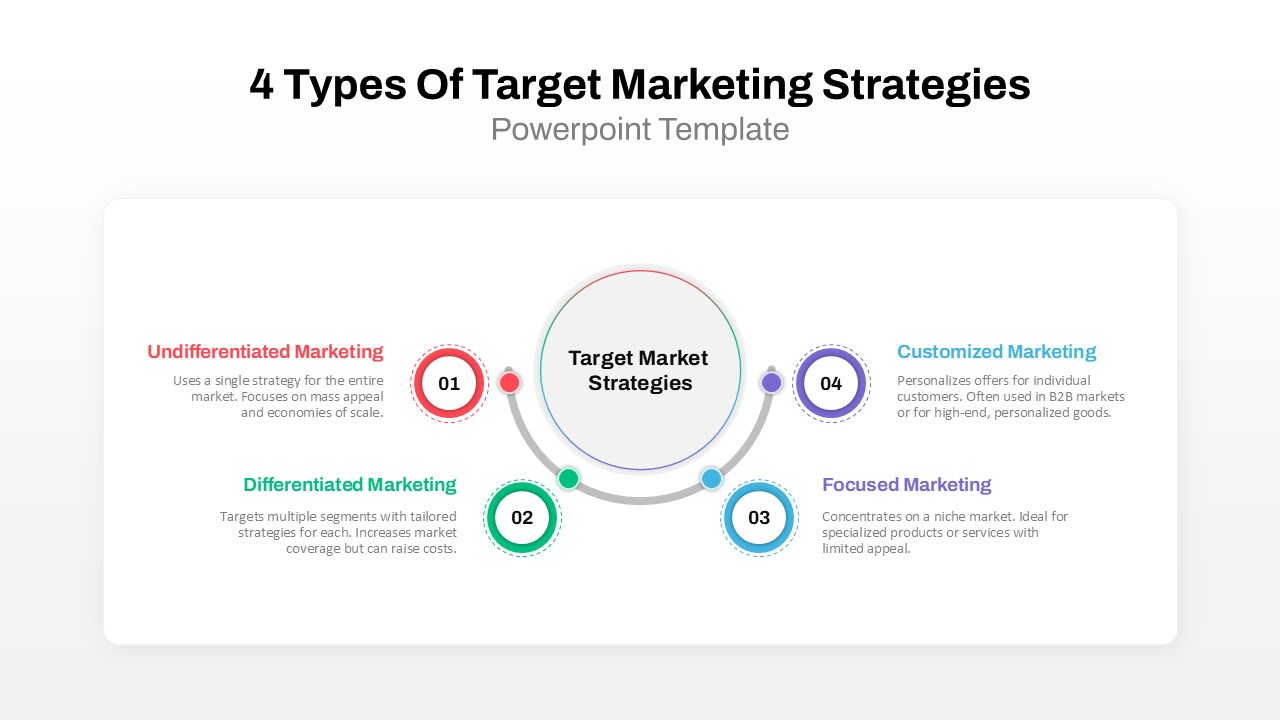
4 Types of Target Marketing Strategies PowerPoint Template for PowerPoint & Google Slides
Comparison
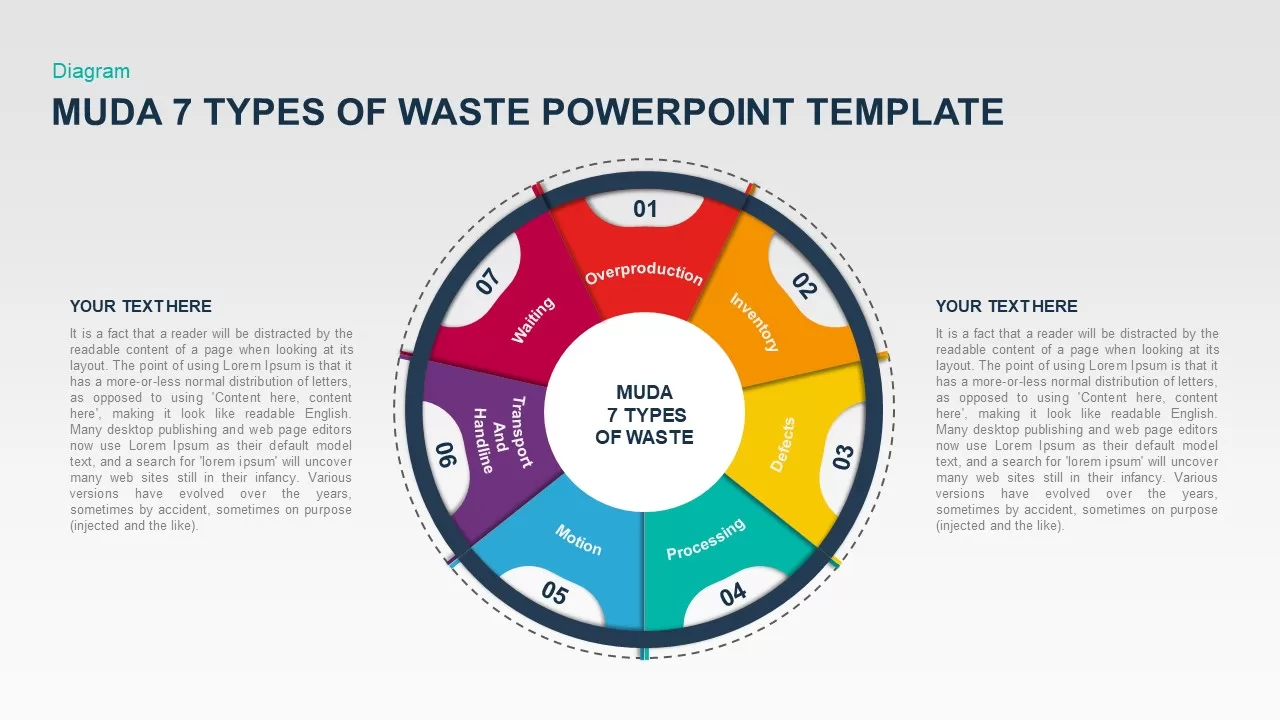
MUDA Seven Types of Waste Diagram Template for PowerPoint & Google Slides
Circular
Arrow Types Shape Library Editable Template for PowerPoint & Google Slides
Arrow
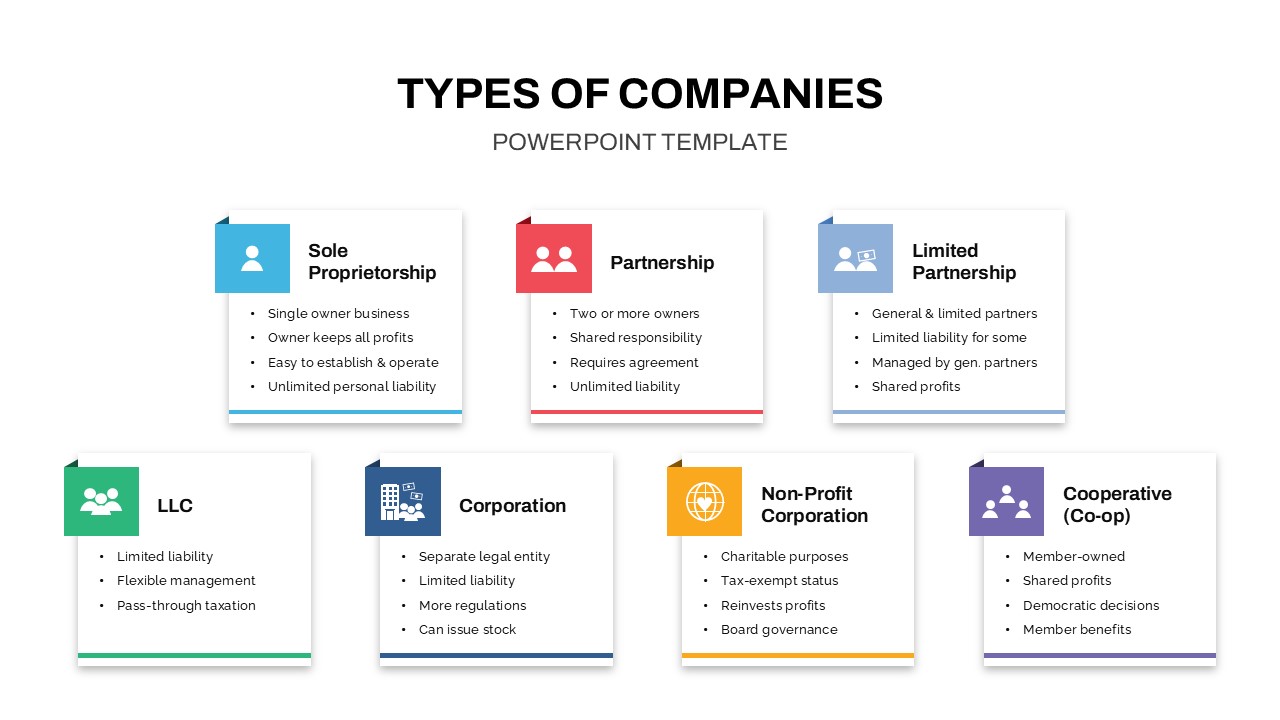
Types of Companies Presentation Template for PowerPoint & Google Slides
Business Models
Marketing Advertising Types Overview Template for PowerPoint & Google Slides
Advertising
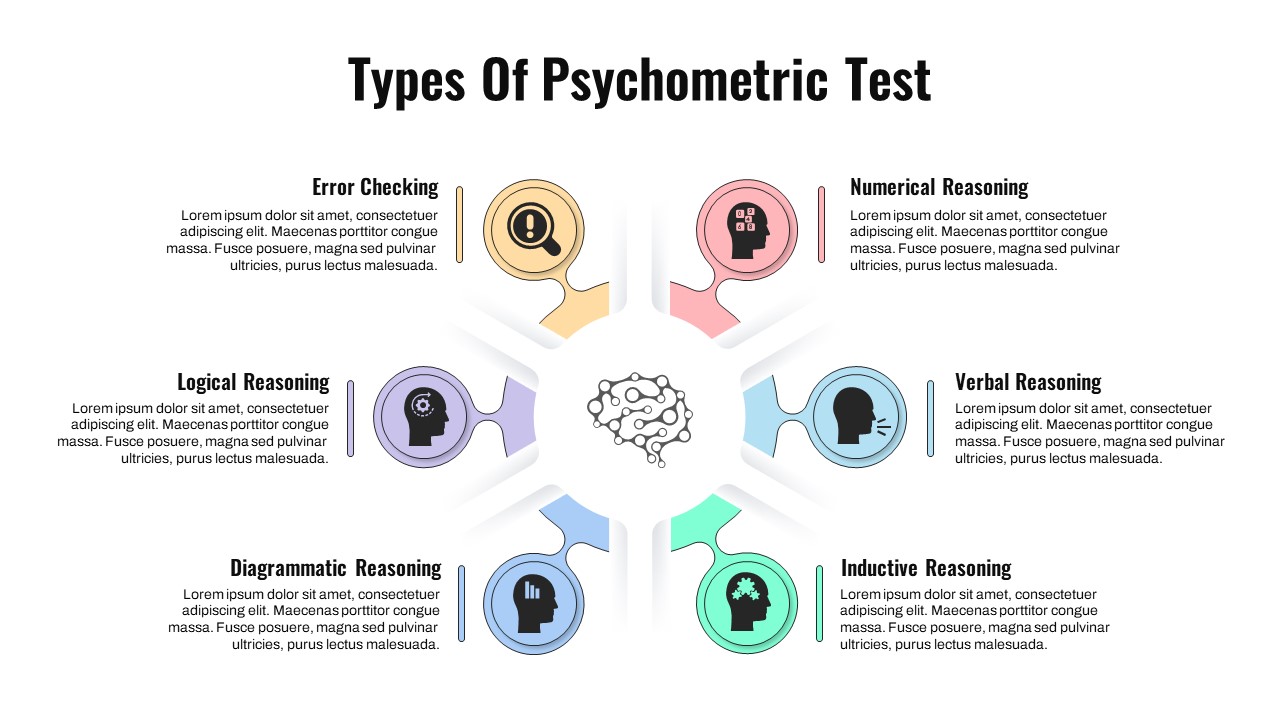
Psychometric Test Types Circular Diagram Template for PowerPoint & Google Slides
Circular
Podcast Marketing Strategy and Key Types Template for PowerPoint & Google Slides
Digital Marketing
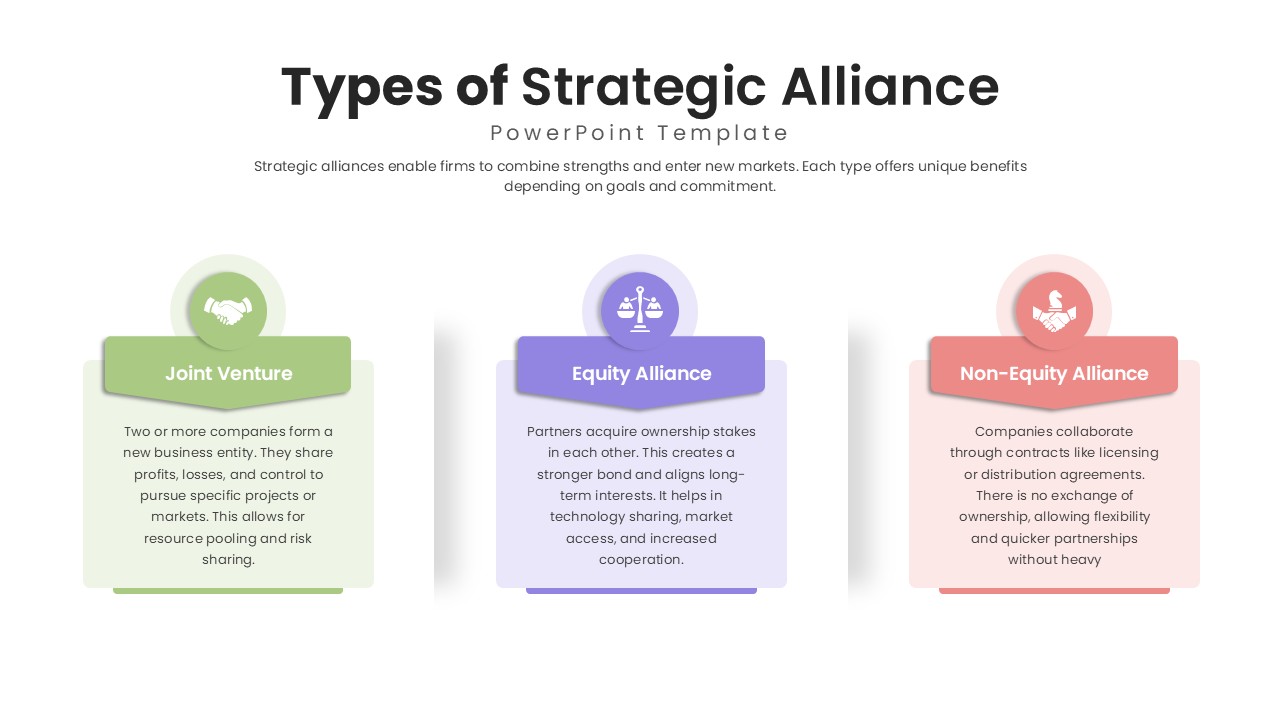
Strategic Alliance Types and Benefits template for PowerPoint & Google Slides
Business Strategy
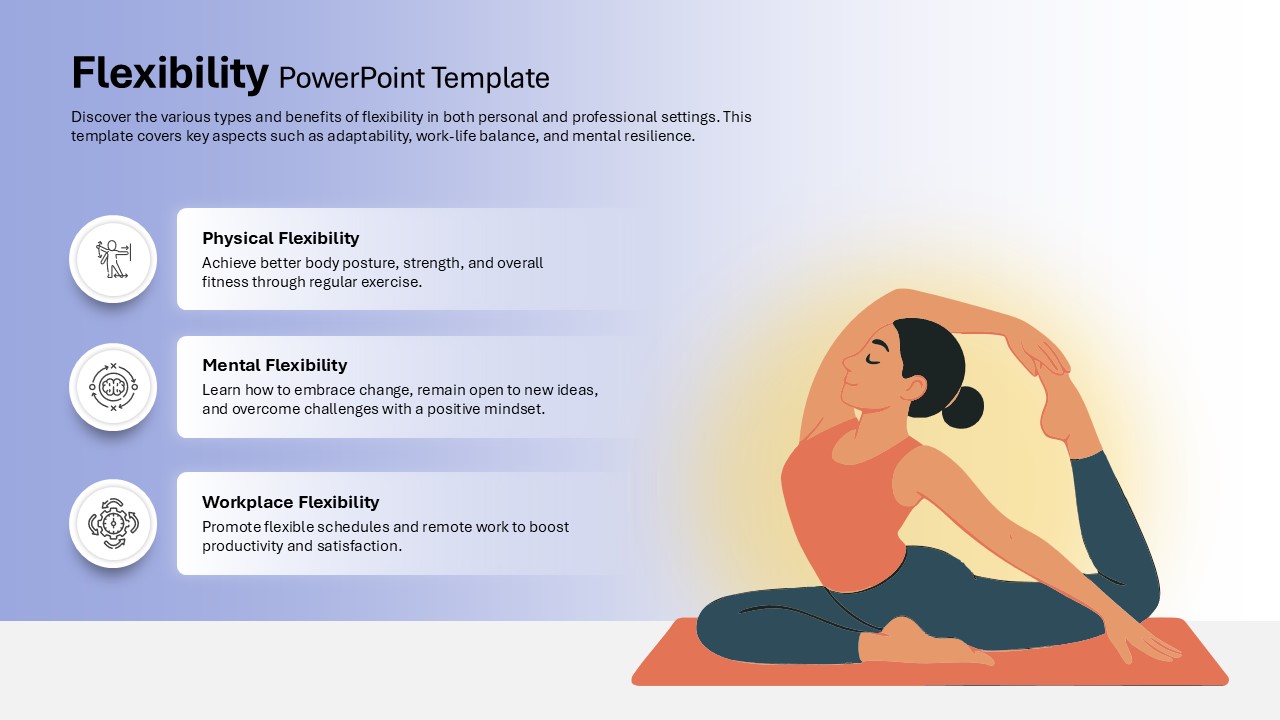
Flexibility Benefits and Types Template for PowerPoint & Google Slides
Comparison
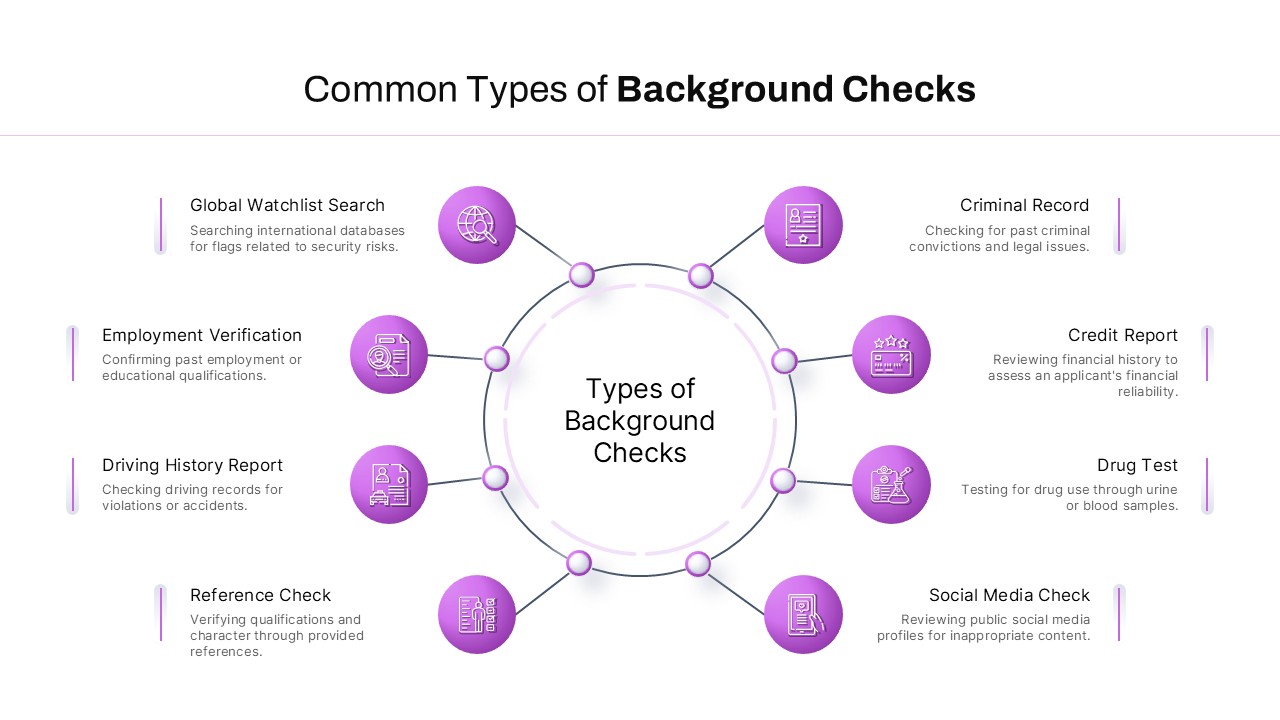
Background Check Types Diagram Template for PowerPoint & Google Slides
Circular
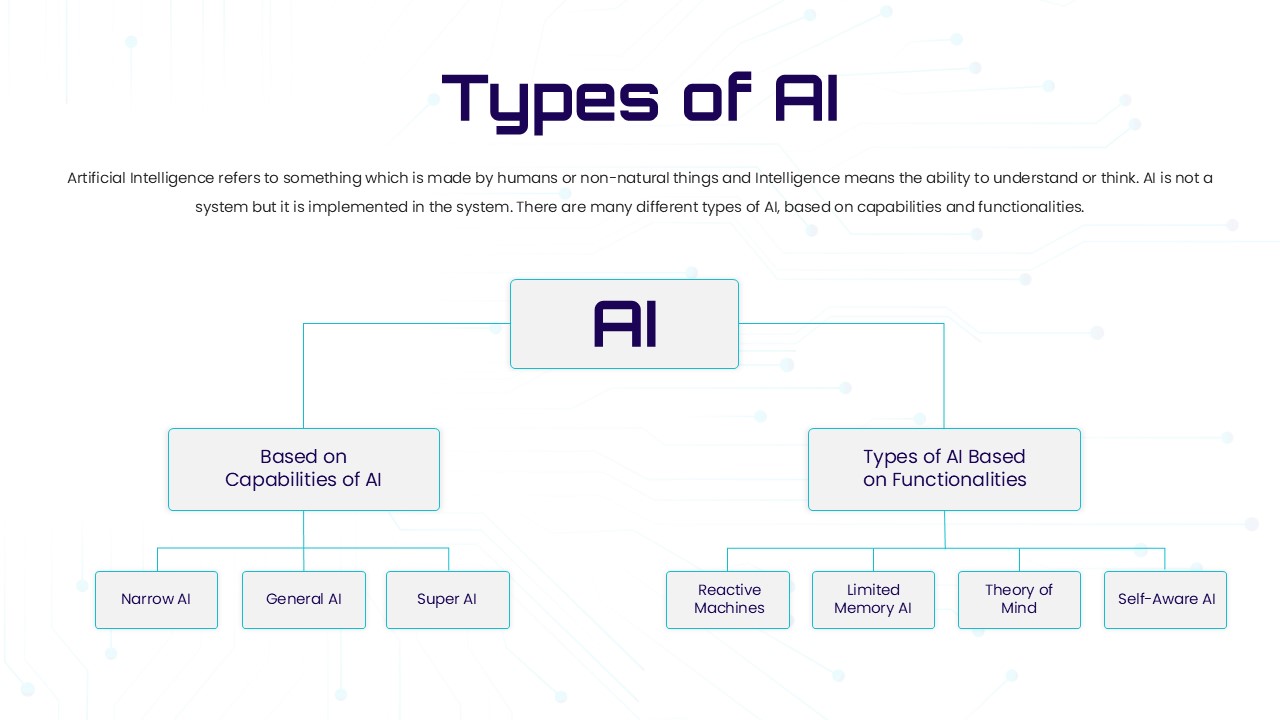
Types of AI Classification Hierarchy Template for PowerPoint & Google Slides
AI
Machine Learning Types template for PowerPoint & Google Slides
Technology
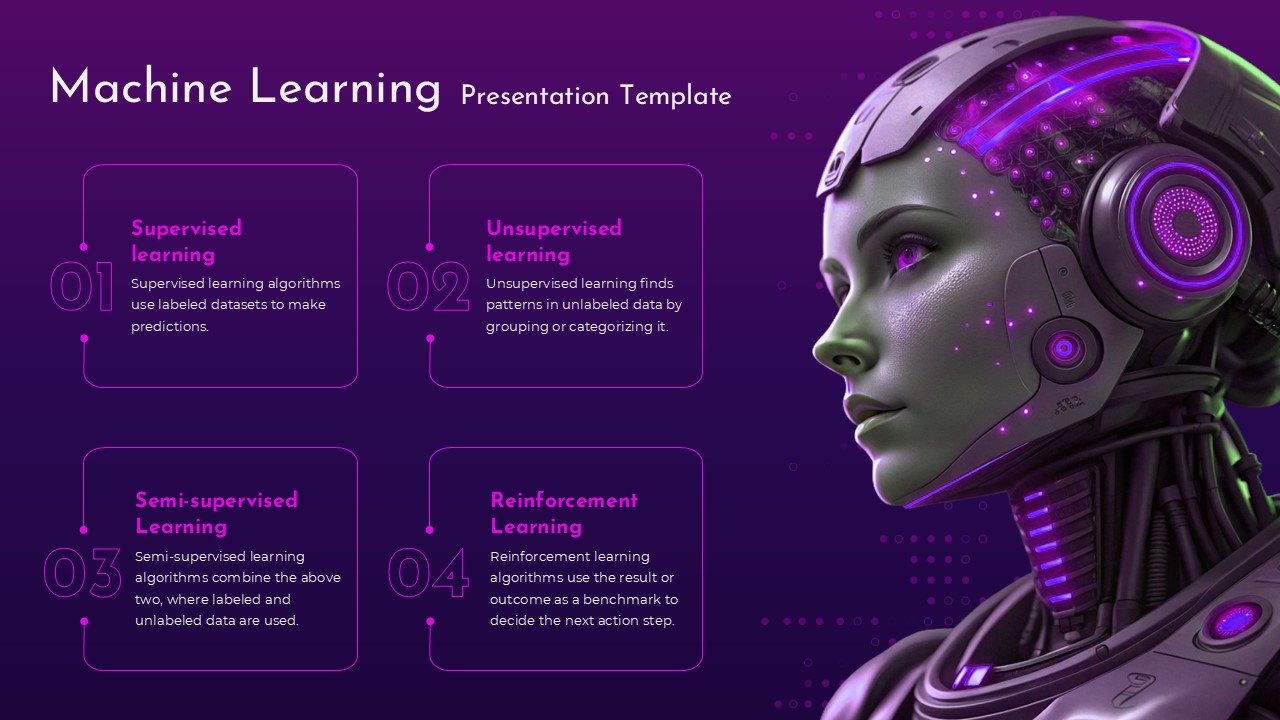
Futuristic Machine Learning Types Overview Template for PowerPoint & Google Slides
AI
Types of Cancer Awareness Deck for PowerPoint & Google Slides
Health
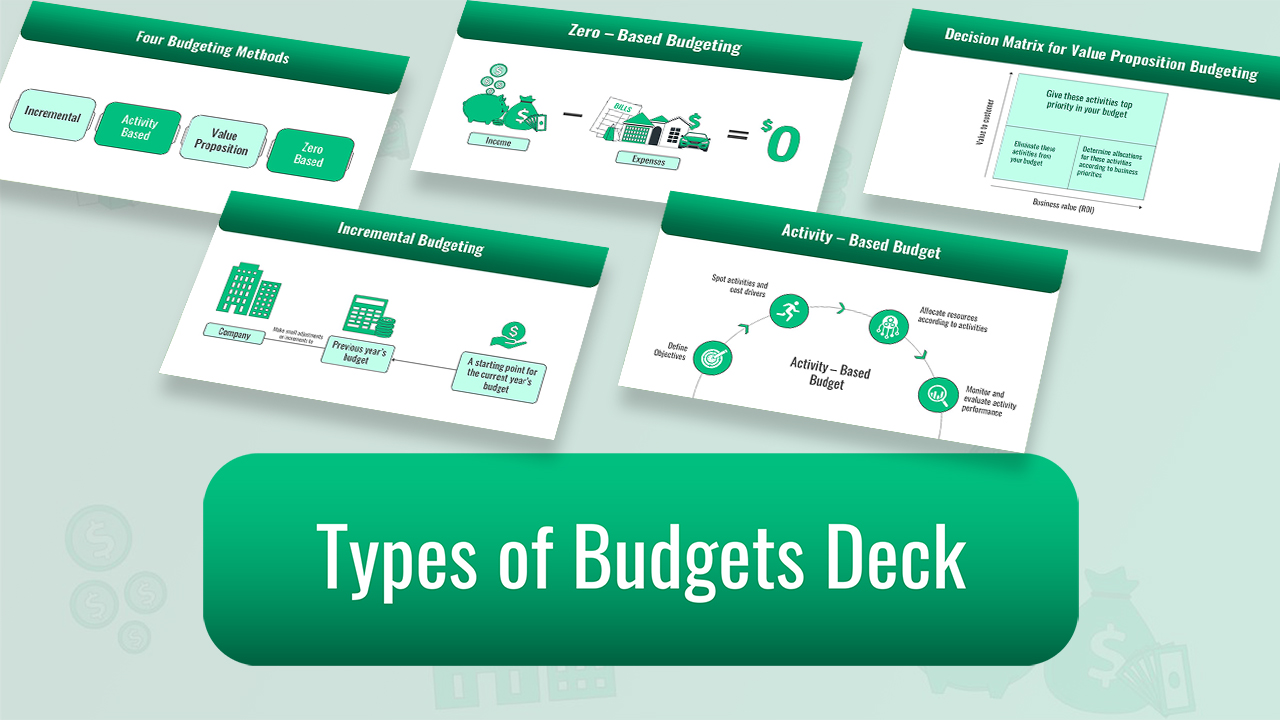
Types of Budgets Deck for PowerPoint & Google Slides
Pitch Deck
Speedometer Infographic Gauge Comparison Template for PowerPoint & Google Slides
Comparison

A/B Testing Comparison Infographic template for PowerPoint & Google Slides
Comparison
Gender Comparison People Infographic Template for PowerPoint & Google Slides
Comparison

Comparison Pricing Table Infographic Template for PowerPoint & Google Slides
Comparison Chart
Two-Column Comparison Infographic Slide Template for PowerPoint & Google Slides
Comparison
Seller Portals Comparison Infographic Template for PowerPoint & Google Slides
Process
Generations Comparison Infographic Template for PowerPoint & Google Slides
Timeline
RAG Status Infographic Comparison Template for PowerPoint & Google Slides
Project
Comparison Infographic Overview template for PowerPoint & Google Slides
Business
Before and After Comparison Infographic Template for PowerPoint & Google Slides
Comparison
Free
Free Global Warming Infographic Comparison Template for PowerPoint & Google Slides
Comparison Chart
Free
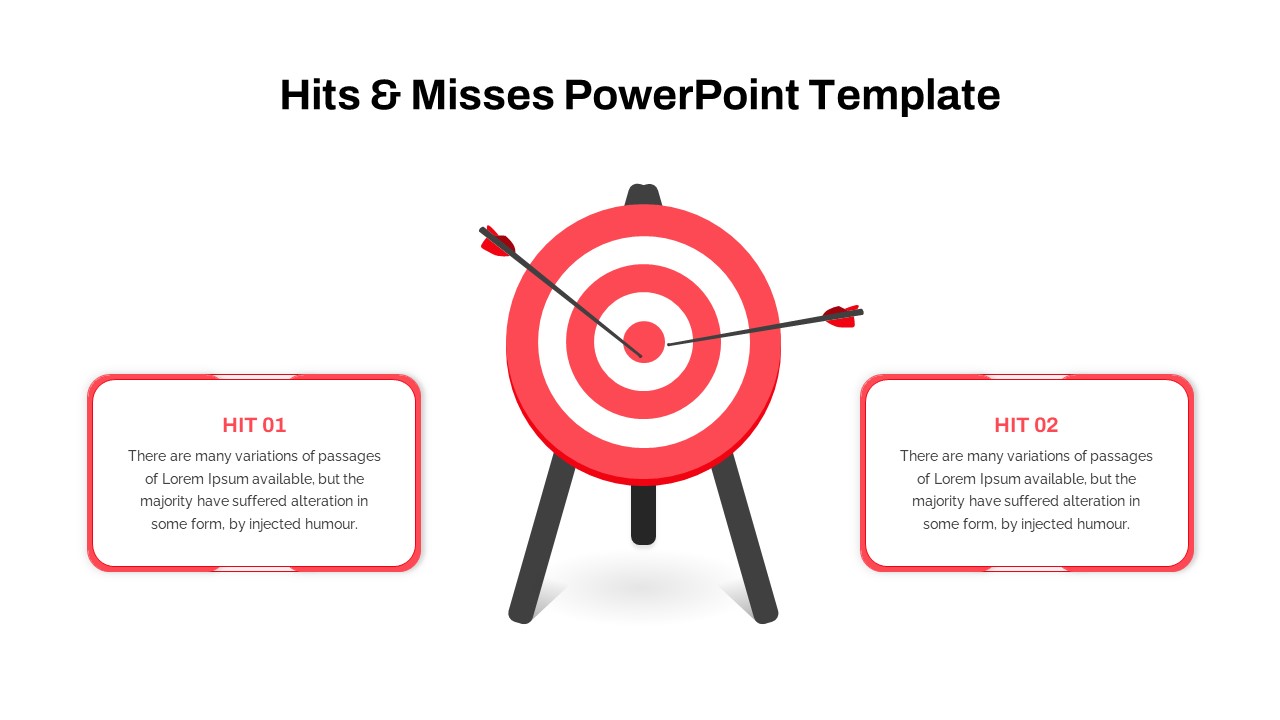
Hits & Misses Comparison Infographic Template for PowerPoint & Google Slides
Pitch Deck
VUCA vs BANI Comparison Infographic Template for PowerPoint & Google Slides
Comparison
Category Analysis Comparison Infographic Template for PowerPoint & Google Slides
Comparison

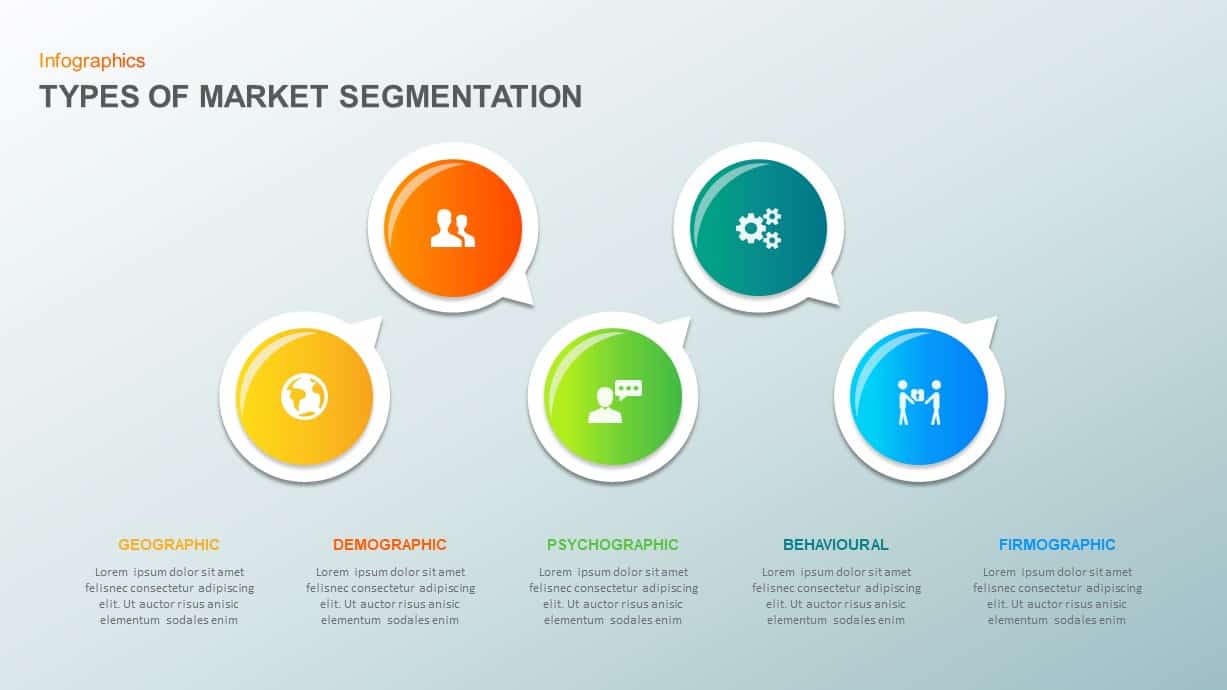
5 Types of Market Segmentation PowerPoint Template
Marketing
Service Zoom Feature Slides Comparison template for PowerPoint & Google Slides
Process
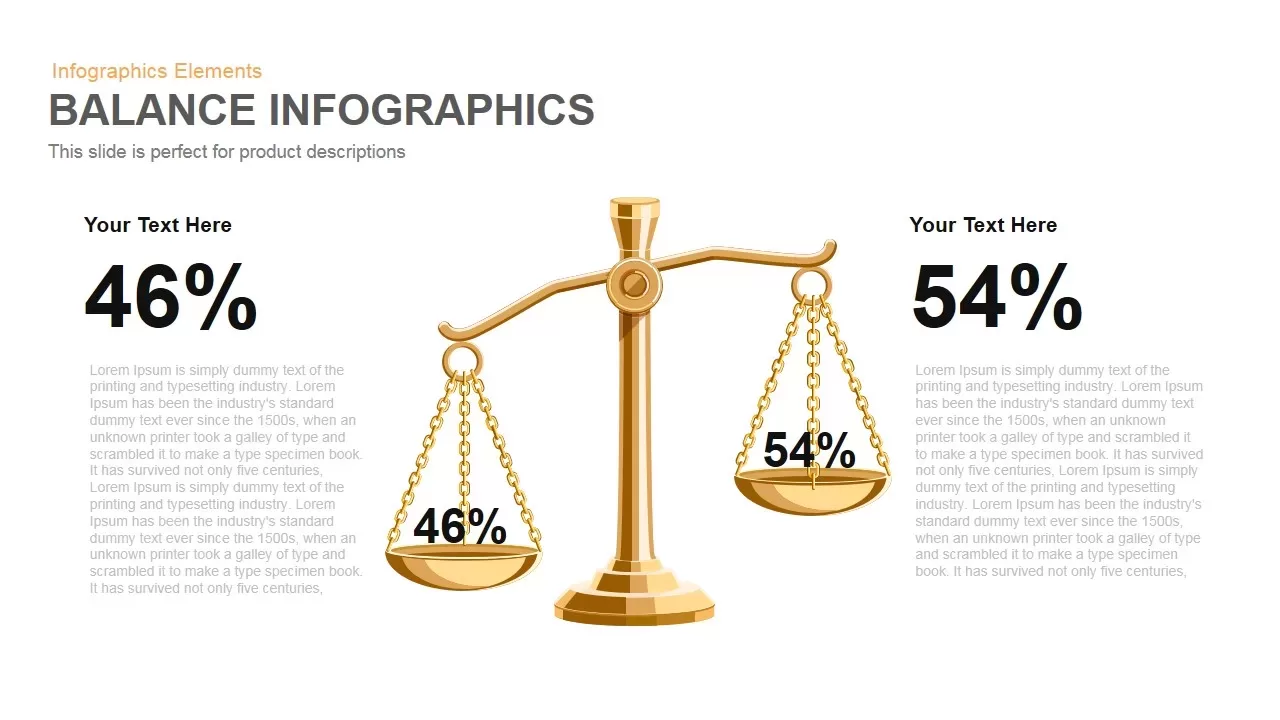
Gold Scales Balance Comparison Template for PowerPoint & Google Slides
Comparison
Comparison Bar Chart template for PowerPoint & Google Slides
Comparison Chart
Four Section Comparison Chart Diagram Template for PowerPoint & Google Slides
Infographics
Clean Mobile Service Comparison Slide Template for PowerPoint & Google Slides
Comparison

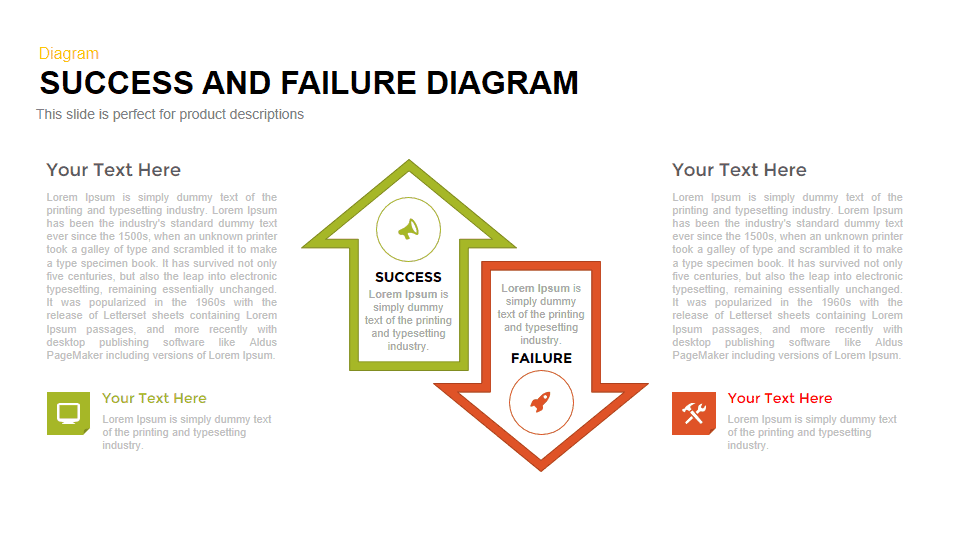
Success vs Failure Comparison Diagram Template for PowerPoint & Google Slides
Comparison
Scale Metaphor Metrics Comparison Template for PowerPoint & Google Slides
Charts
Dual Percentage Comparison Metaphor Template for PowerPoint & Google Slides
Comparison
Comparison Chart Overview template for PowerPoint & Google Slides
Comparison Chart
Dynamic Multicolor Comparison Table Template for PowerPoint & Google Slides
Comparison
Interactive Pricing Plan Comparison Template for PowerPoint & Google Slides
Comparison
Five-Option Text Boxes Table Comparison Template for PowerPoint & Google Slides
Business Report
Six-Metric Green Product Comparison Template for PowerPoint & Google Slides
Comparison
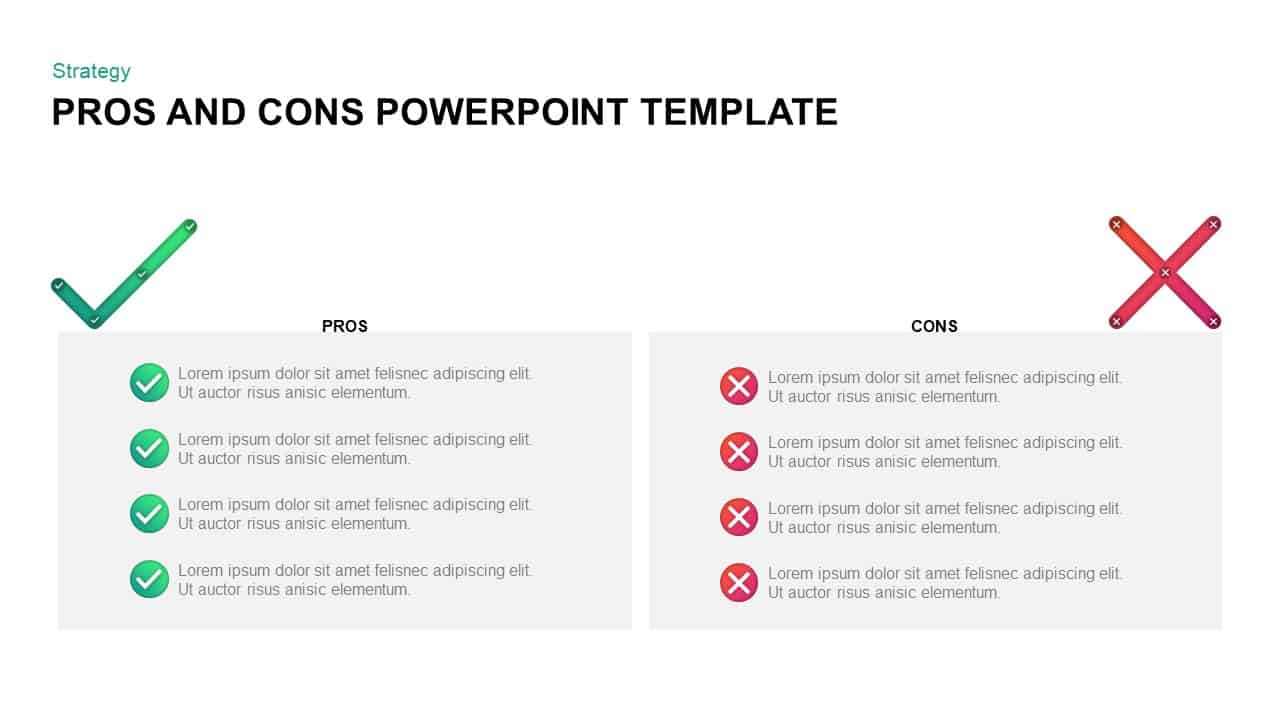
Pros and Cons Comparison Slide Template for PowerPoint & Google Slides
Comparison
BMI Category Comparison Chart Template for PowerPoint & Google Slides
Comparison
Isometric 3D Block Comparison Diagram Template for PowerPoint & Google Slides
Comparison
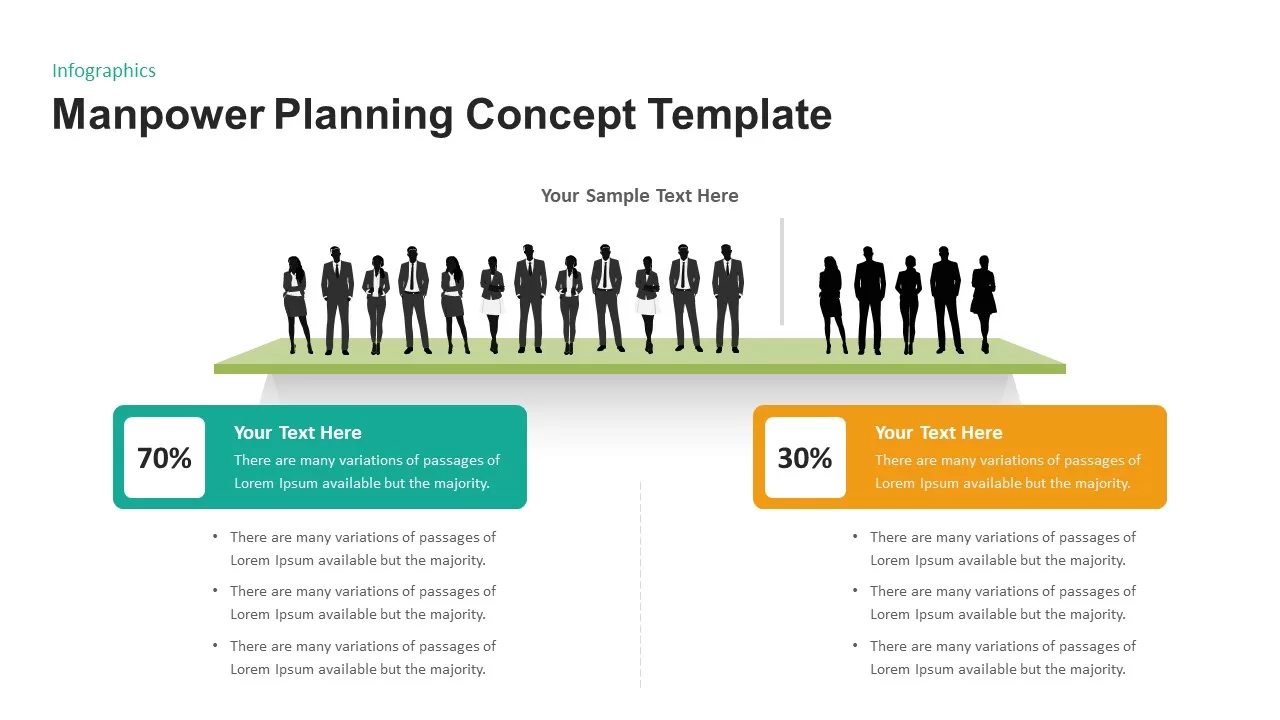
Manpower Planning Concept Comparison Template for PowerPoint & Google Slides
Comparison Chart
Circular Product Comparison Chart Template for PowerPoint & Google Slides
Comparison Chart
Internal vs External Factors Comparison Template for PowerPoint & Google Slides
Comparison
Yin Yang Comparison template for PowerPoint & Google Slides
Business
Pugh Matrix Decision Comparison Chart Template for PowerPoint & Google Slides
Comparison Chart
Competitive Landscape Comparison Template Pack for PowerPoint & Google Slides
Comparison
Before and After Comparison Infographics Template for PowerPoint & Google Slides
Comparison
Business Silhouettes Comparison Slide Template for PowerPoint & Google Slides
HR
Current vs Future State Comparison Slide Template for PowerPoint & Google Slides
Comparison Chart
Before and After Comparison Slide Template for PowerPoint & Google Slides
Comparison
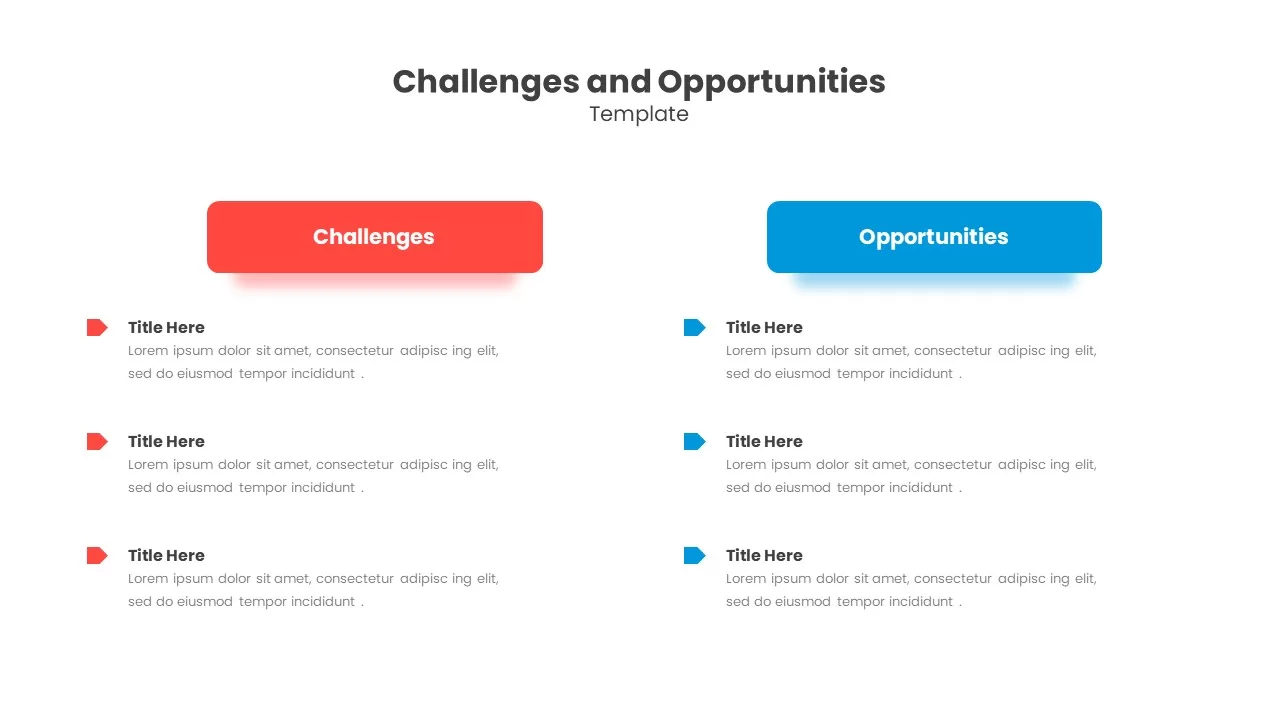
Challenges & Opportunities Comparison Template for PowerPoint & Google Slides
Opportunities Challenges
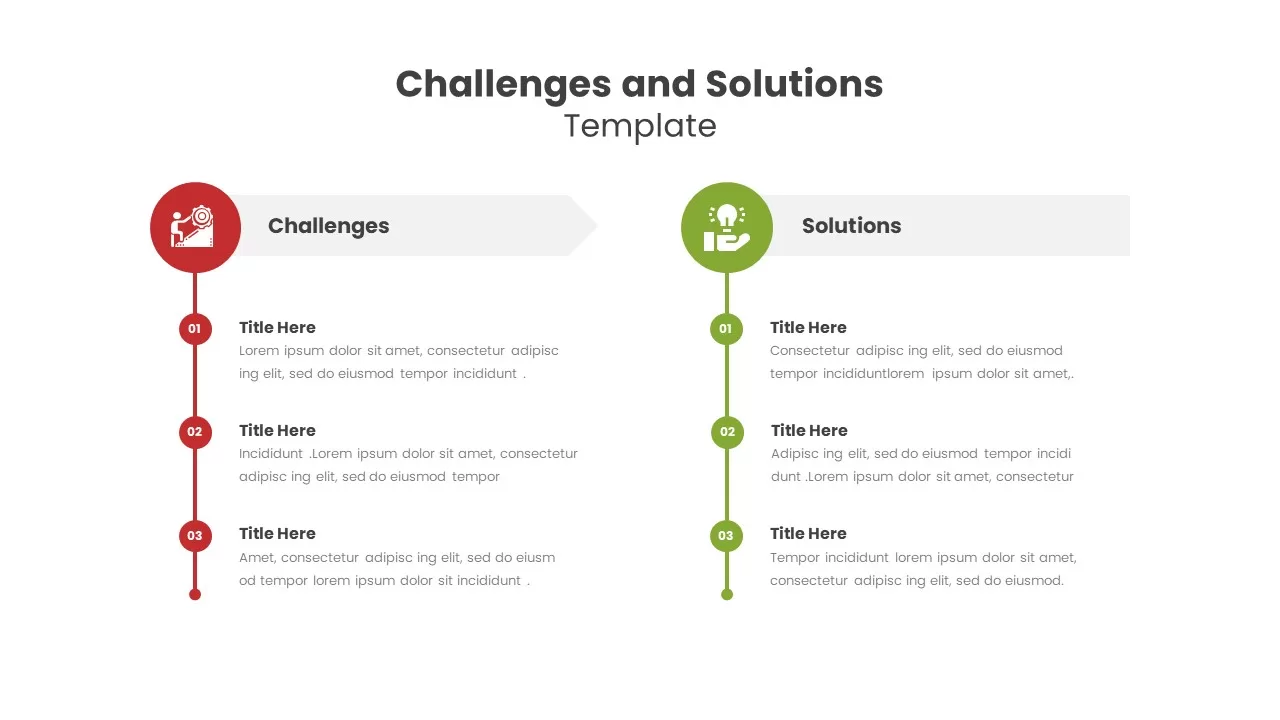
Challenges and Solutions Comparison Template for PowerPoint & Google Slides
Opportunities Challenges
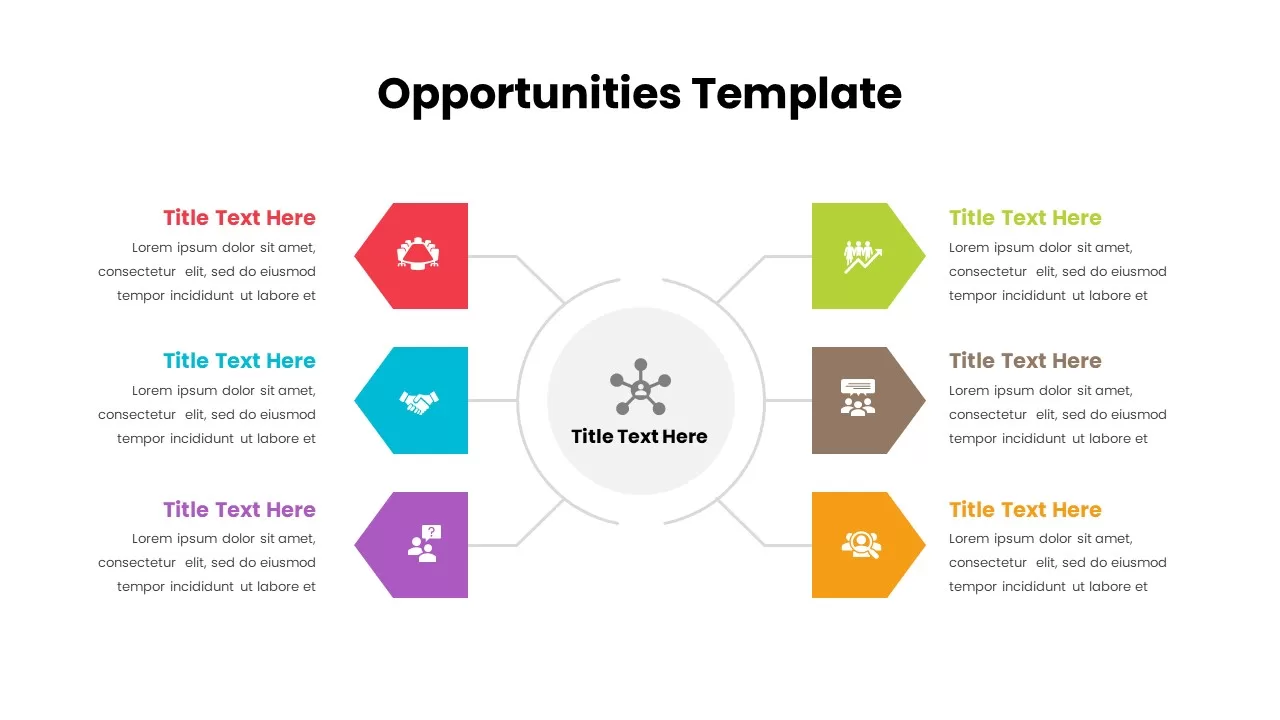
Opportunities Hub-and-Spoke Comparison Diagram Template for PowerPoint & Google Slides
Opportunities Challenges
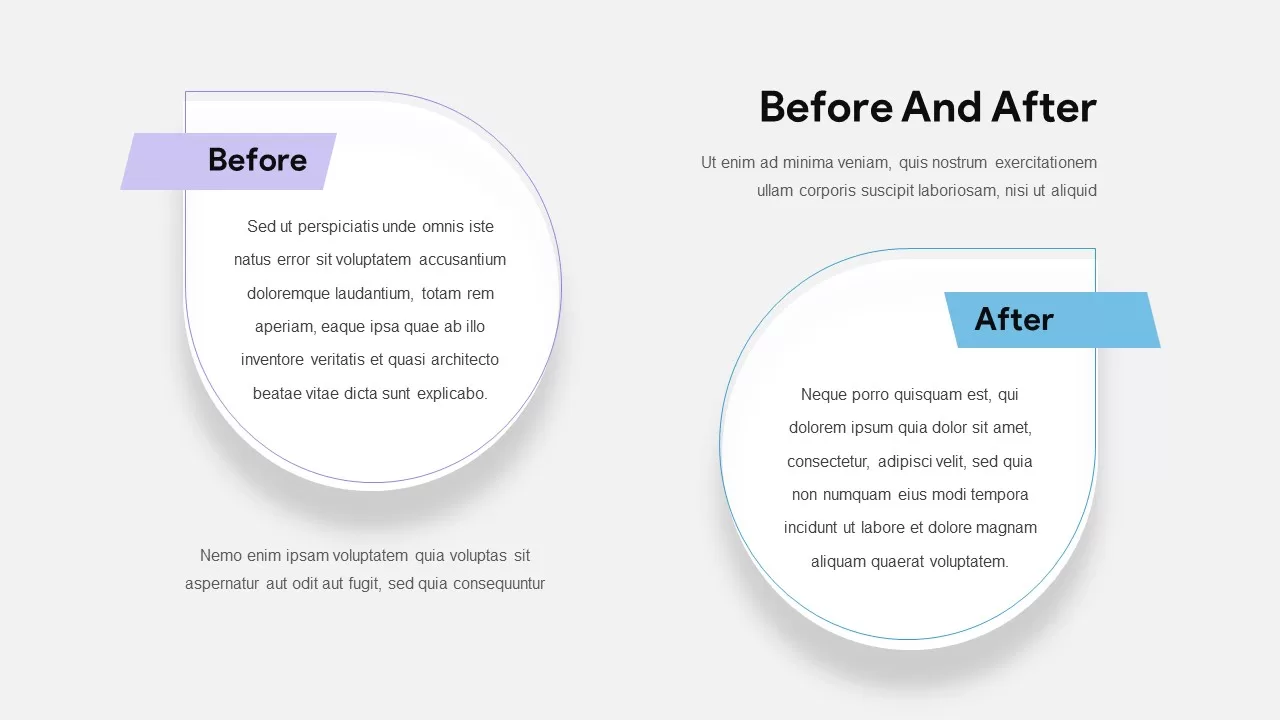
Modern Before and After Comparison Template for PowerPoint & Google Slides
Infographics
Benchmarking Metrics Comparison Slide Template for PowerPoint & Google Slides
Pie/Donut
Cost Benefit Analysis Comparison Template for PowerPoint & Google Slides
Comparison
Risk Heatmap Comparison Template for PowerPoint & Google Slides
Maps
Heatmap Comparison Template for PowerPoint & Google Slides
Maps
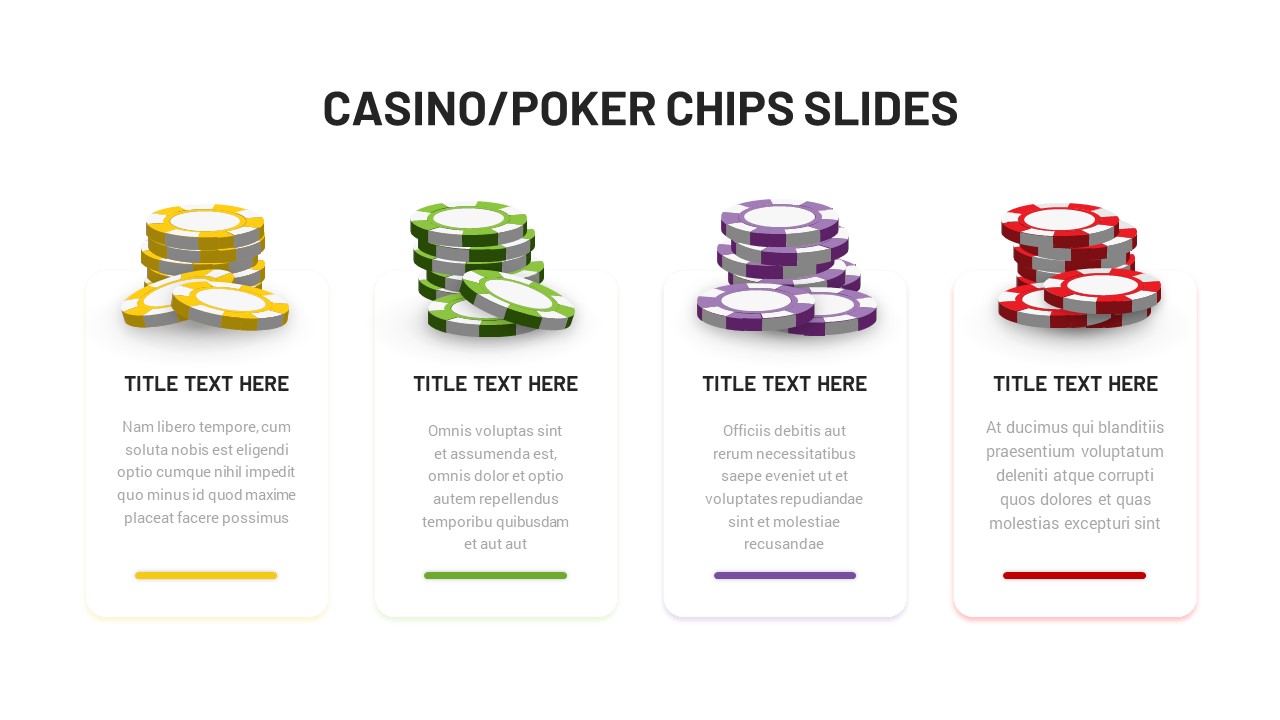
Casino Poker Chips Comparison Slide Template for PowerPoint & Google Slides
Comparison
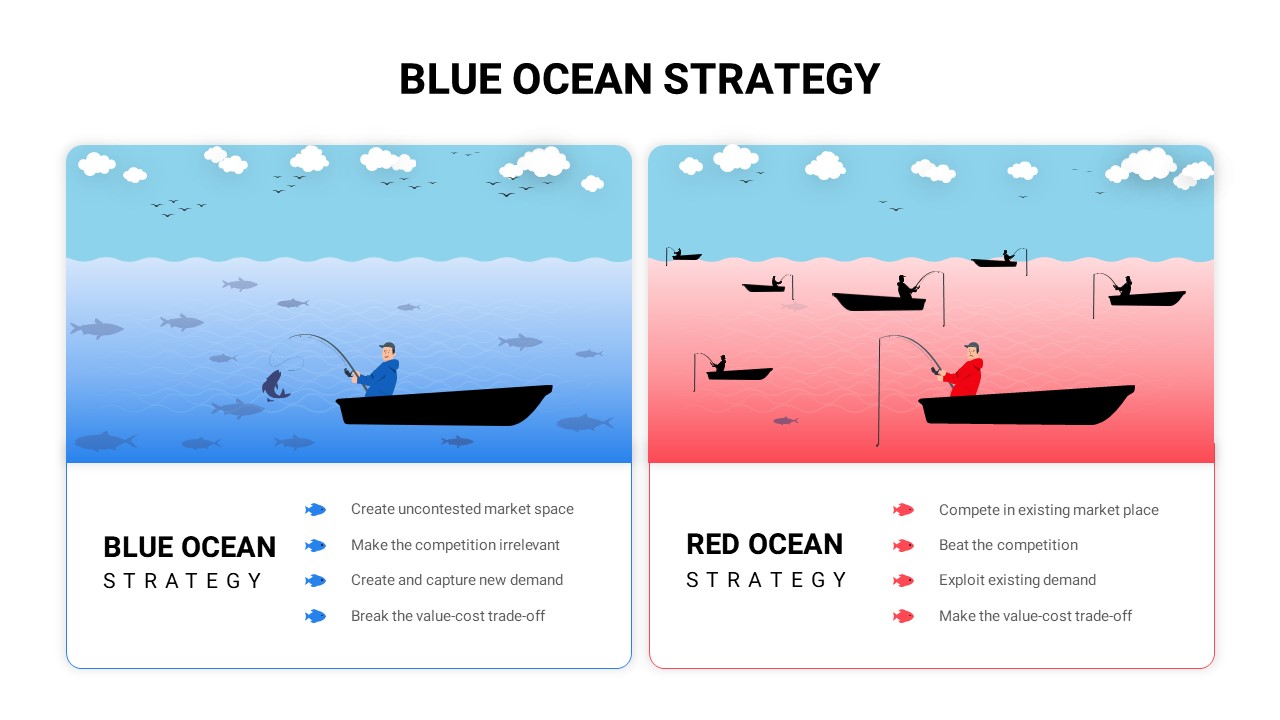
Blue vs Red Ocean Strategy Comparison Template for PowerPoint & Google Slides
Business Strategy
People Demographic Comparison Chart Template for PowerPoint & Google Slides
Comparison
Surgery Infographics Comparison Template for PowerPoint & Google Slides
Health
Mirror Bar Chart Comparison Template for PowerPoint & Google Slides
Bar/Column
Dynamic Bar-of-Pie Chart Comparison Template for PowerPoint & Google Slides
Pie/Donut
ESG Initiatives Comparison Chart Template for PowerPoint & Google Slides
Business
Economies of Scale Cost Curve Comparison Template for PowerPoint & Google Slides
Comparison Chart
Regional Revenue Comparison Overview Template for PowerPoint & Google Slides
Comparison
Risk Level Gauge Comparison Dashboard Template for PowerPoint & Google Slides
Comparison
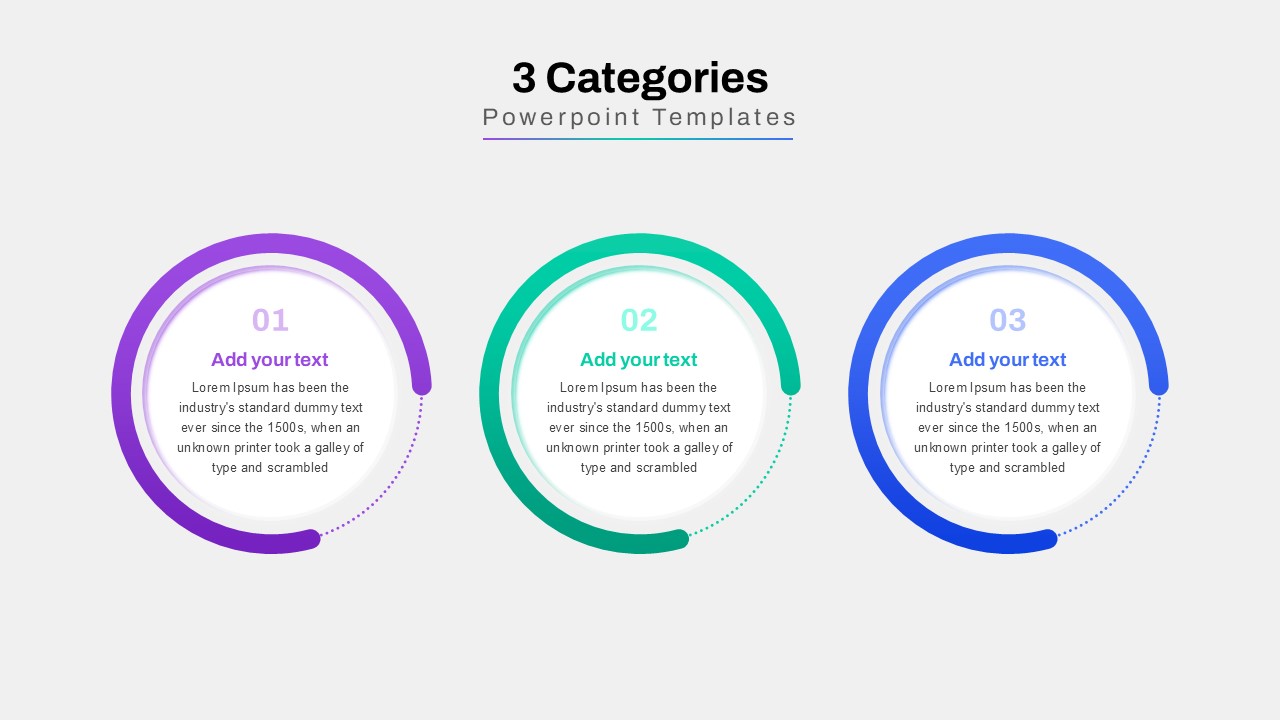
Three-Category Comparison Template for PowerPoint & Google Slides
Comparison
Profile Comparison Chart template for PowerPoint & Google Slides
Comparison Chart
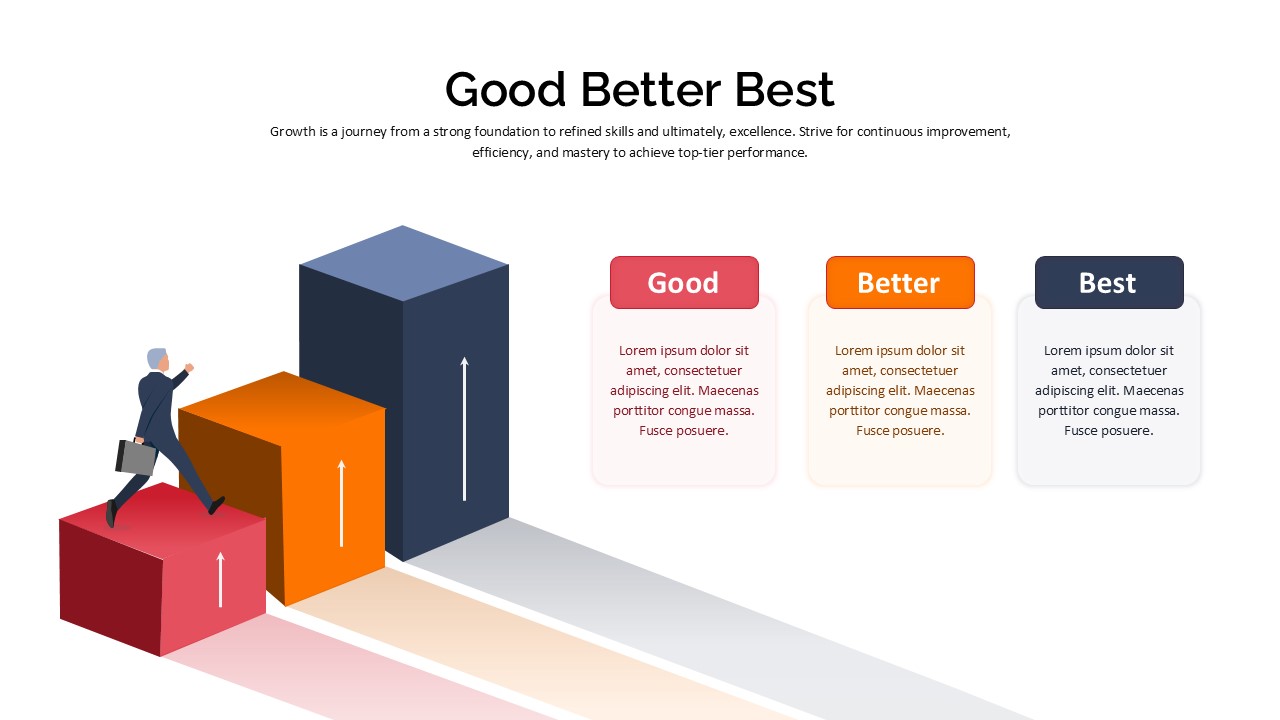
Good Better Best Comparison template for PowerPoint & Google Slides
Comparison
Integrative Thinking Comparison Diagram Template for PowerPoint & Google Slides
Comparison
Market Share Comparison Diagram Template for PowerPoint & Google Slides
Comparison Chart
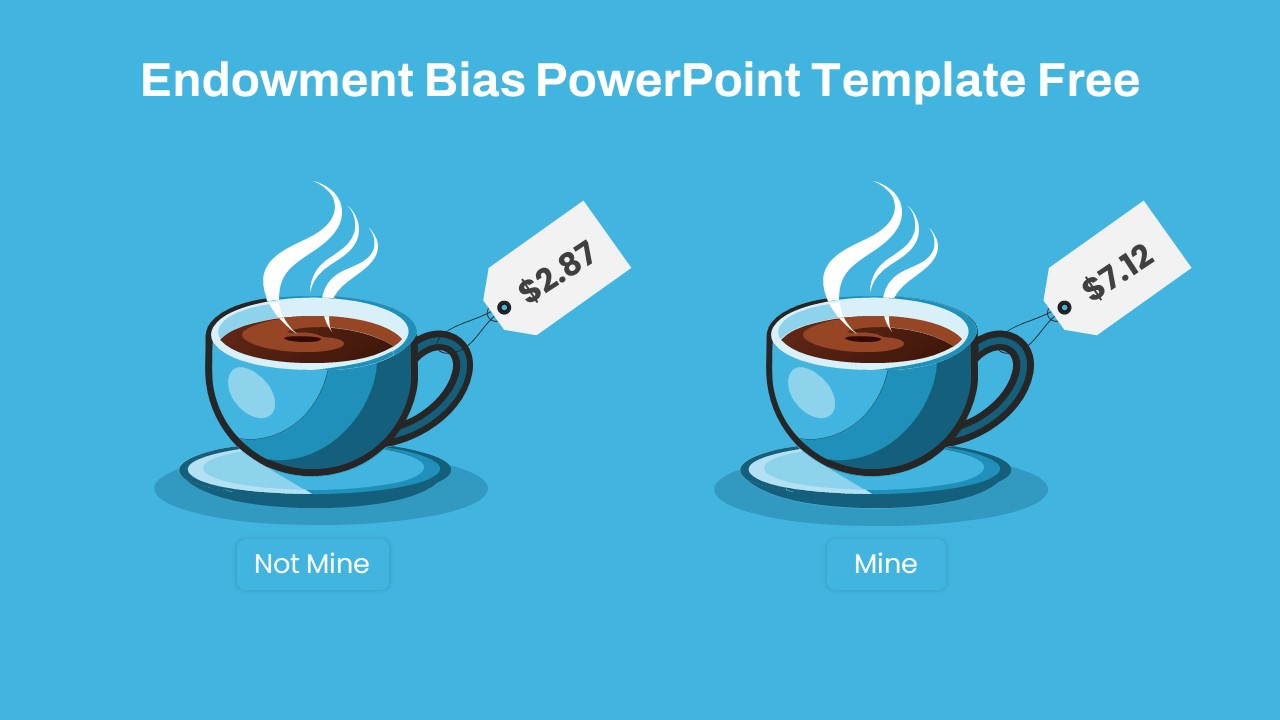
Endowment Bias Coffee Price Comparison Template for PowerPoint & Google Slides
Comparison
Free
Sales Growth Comparison Chart & Table Template for PowerPoint & Google Slides
Bar/Column
Two Section Comparison template for PowerPoint & Google Slides
Business Proposal
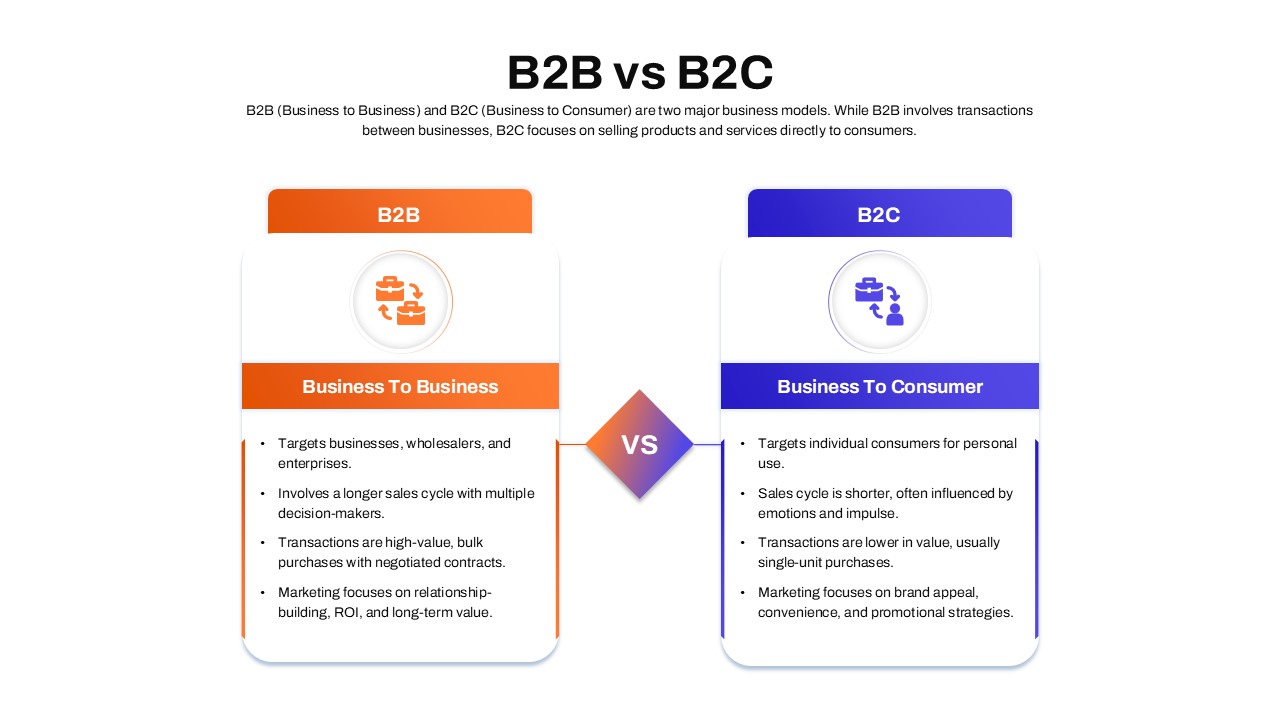
B2B vs B2C Comparison template for PowerPoint & Google Slides
Business Models
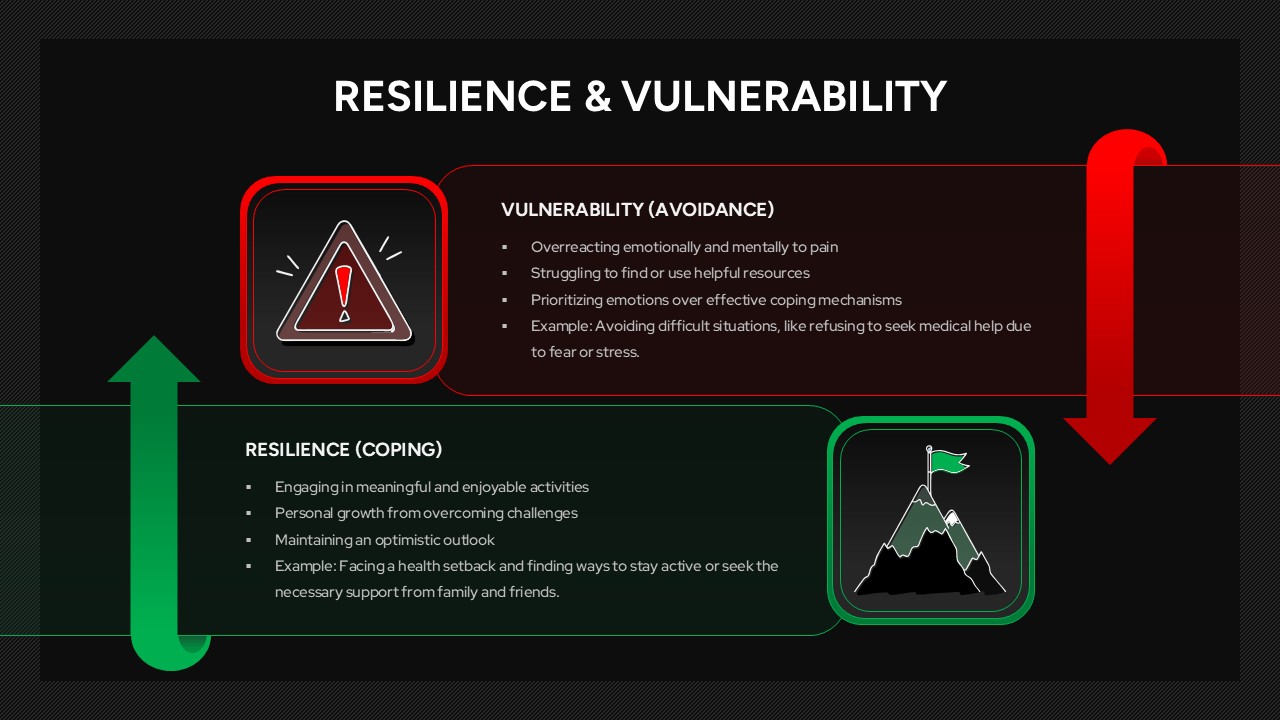
Resilience & Vulnerability Comparison Template for PowerPoint & Google Slides
Comparison
Skills Gap Analysis Comparison Chart Template for PowerPoint & Google Slides
Gap
Feasibility Matrix Comparison Chart Template for PowerPoint & Google Slides
Comparison Chart
Attribution Models Comparison Diagram Template for PowerPoint & Google Slides
Comparison
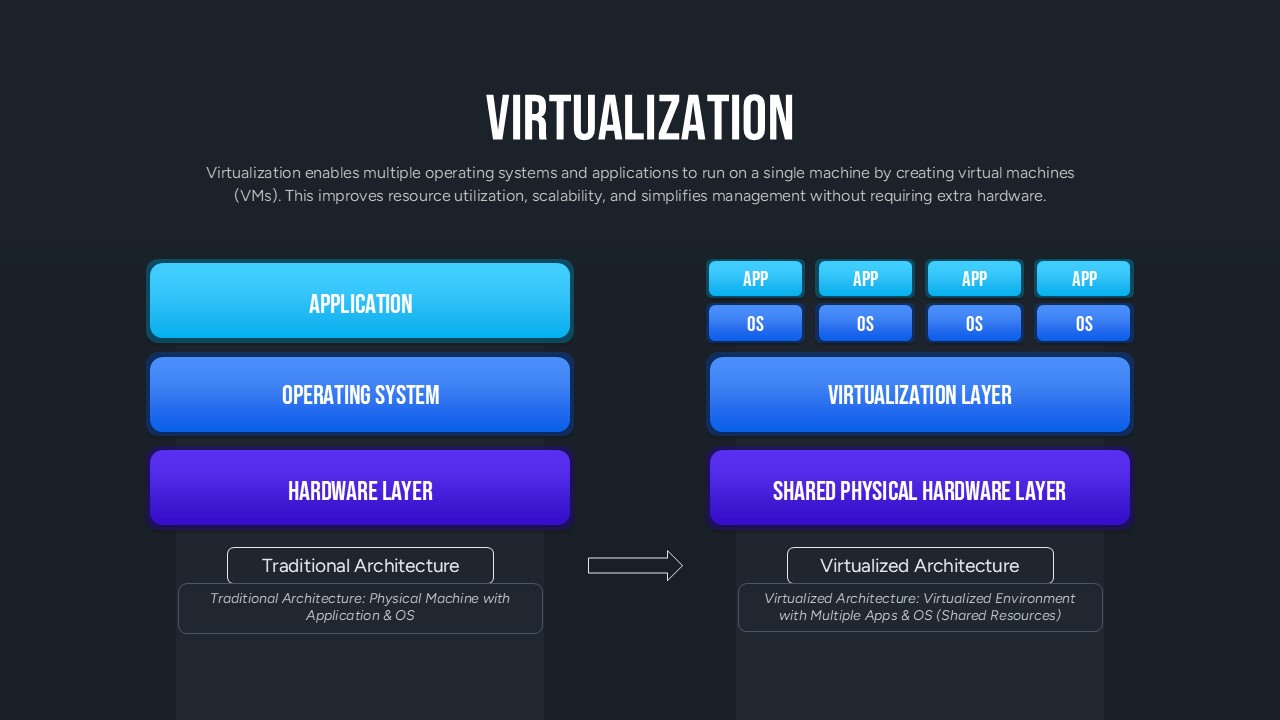
Virtualization Architecture Comparison Template for PowerPoint & Google Slides
Comparison Chart
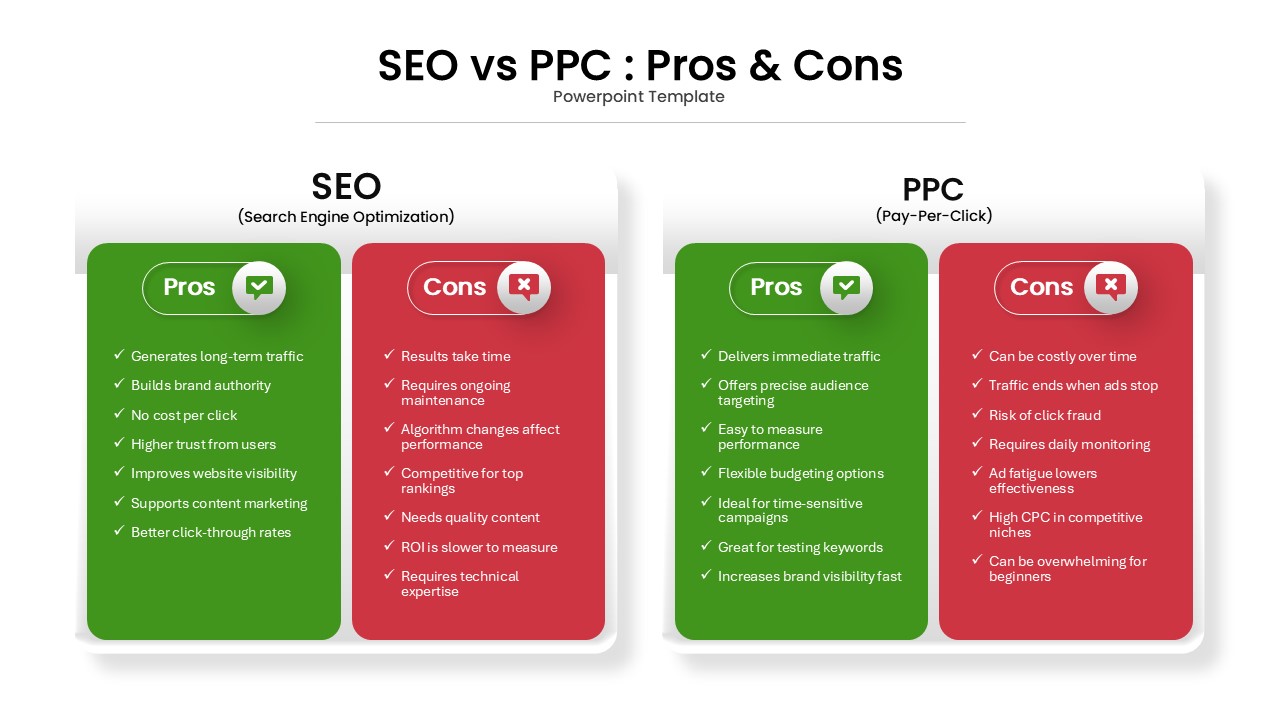
SEO vs PPC: Pros & Cons Comparison Template for PowerPoint & Google Slides
Comparison
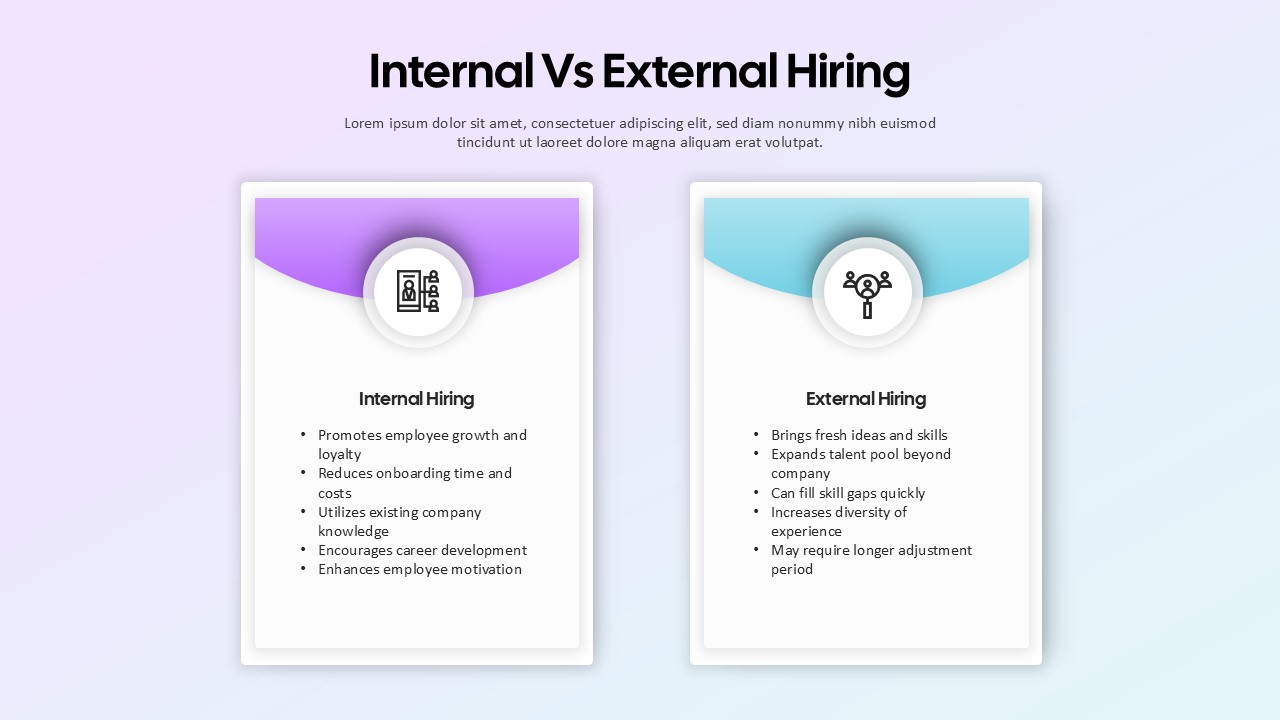
Internal vs External Hiring Comparison Template for PowerPoint & Google Slides
Comparison
Five Column Comparison Table Layout Template for PowerPoint & Google Slides
Comparison
Quarterly Comparison Pie Chart Template for PowerPoint & Google Slides
Pie/Donut
Pros and Cons Comparison Table Template for PowerPoint & Google Slides
Comparison Chart
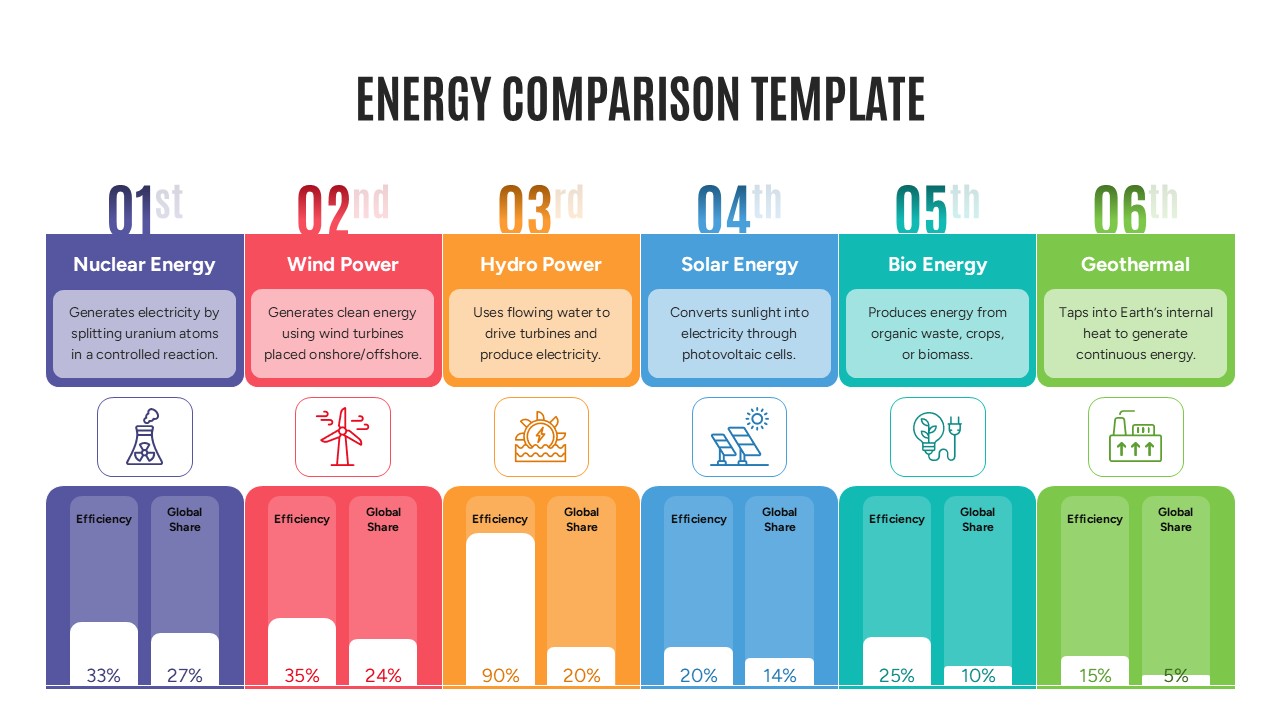
Energy Comparison Template for PowerPoint & Google Slides
Comparison
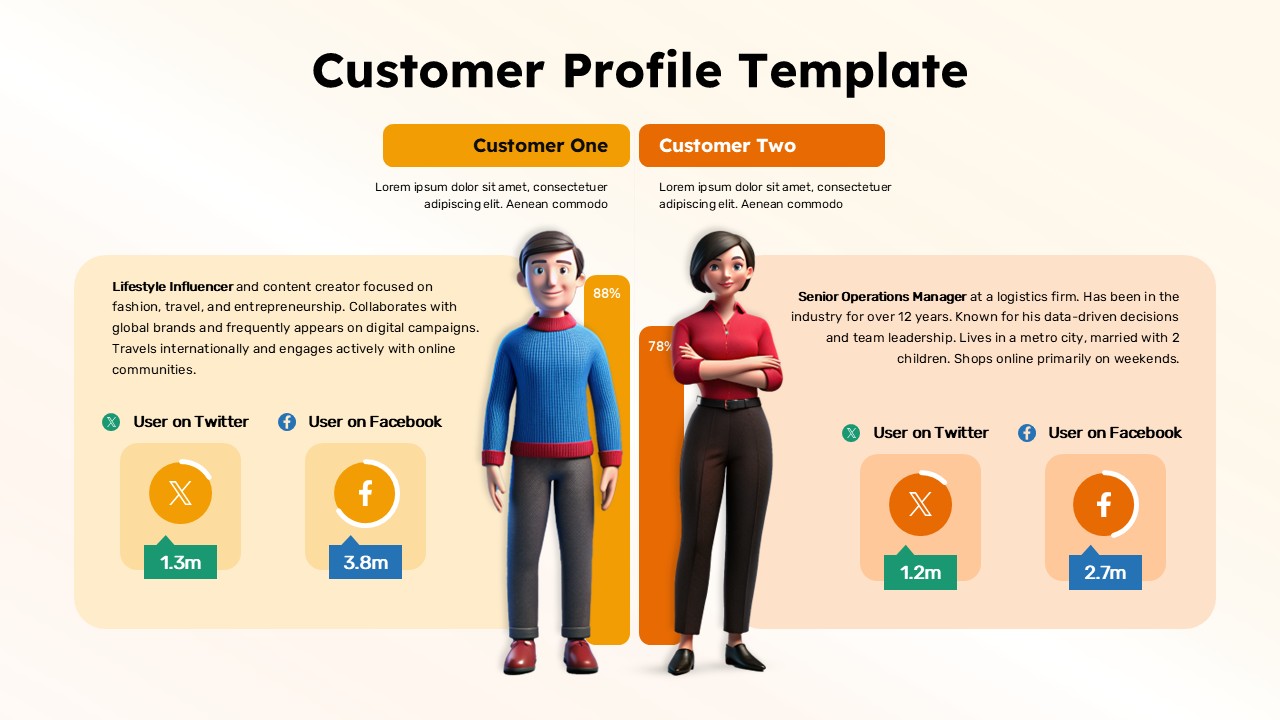
Customer Persona Comparison Profile Template for PowerPoint & Google Slides
Business
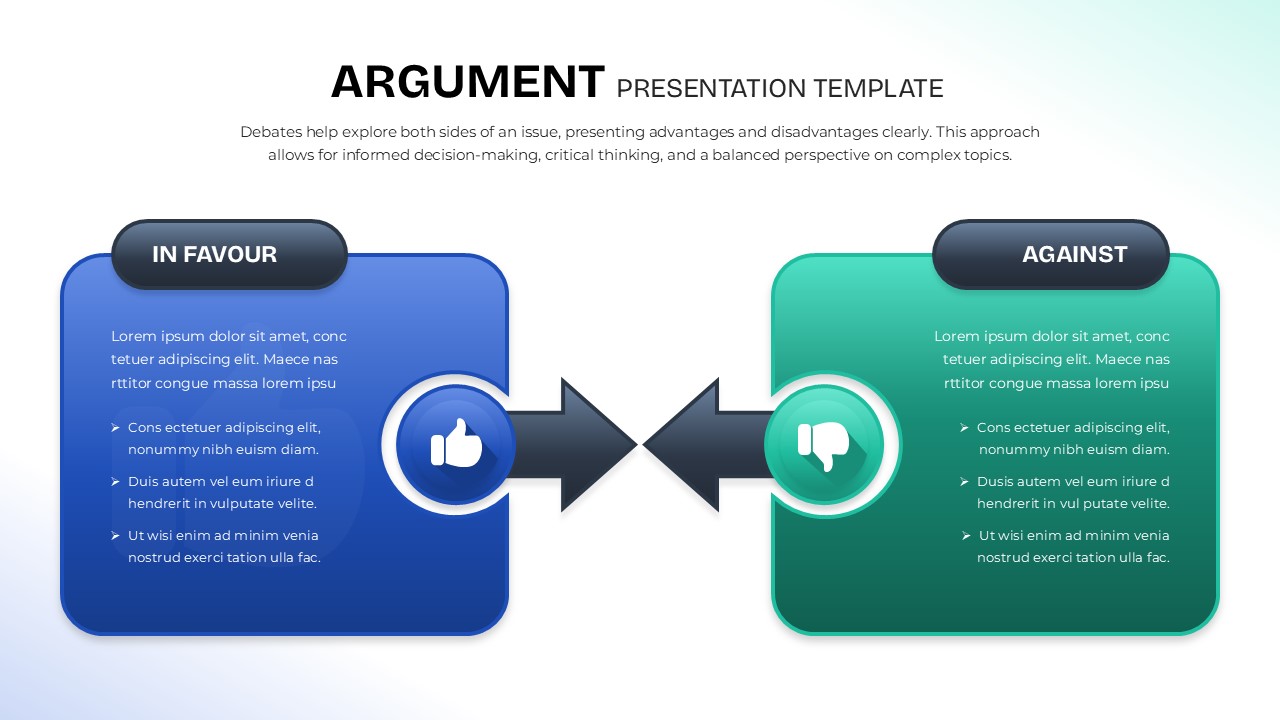
Argument Comparison Template for PowerPoint & Google Slides
Comparison