AI Agents Hub and Spoke Diagram Template for PowerPoint & Google Slides


Description
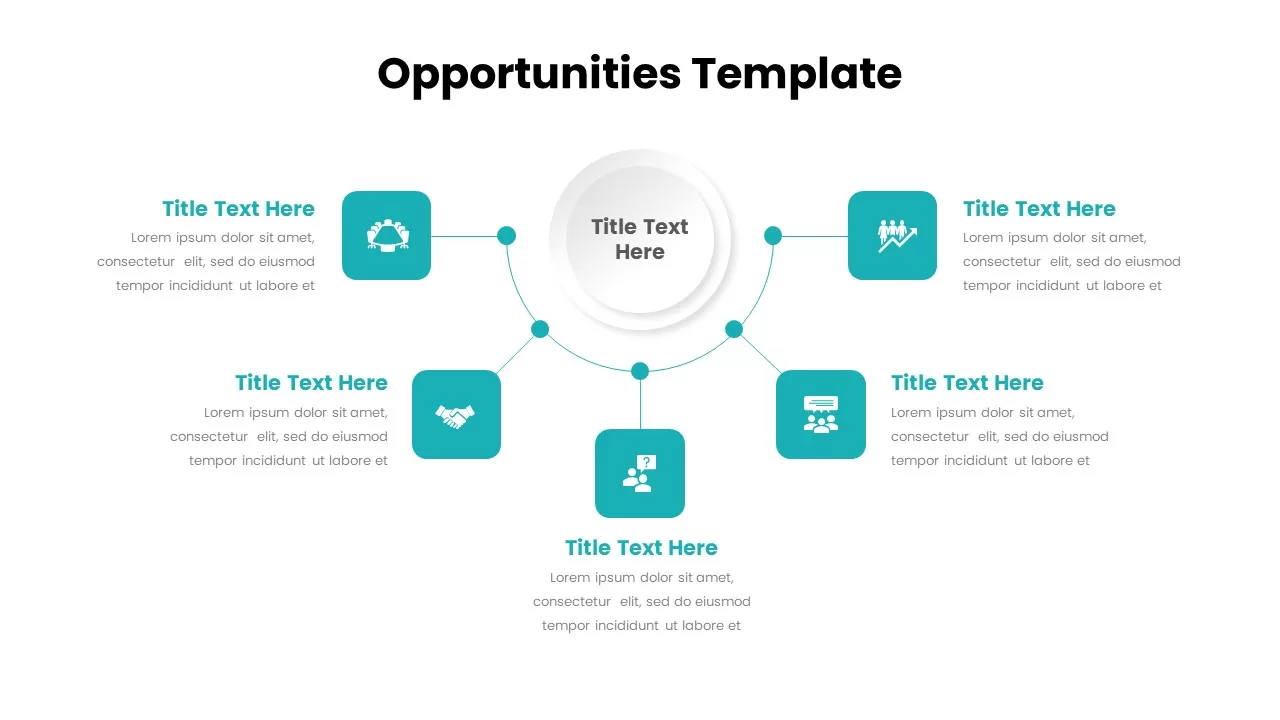
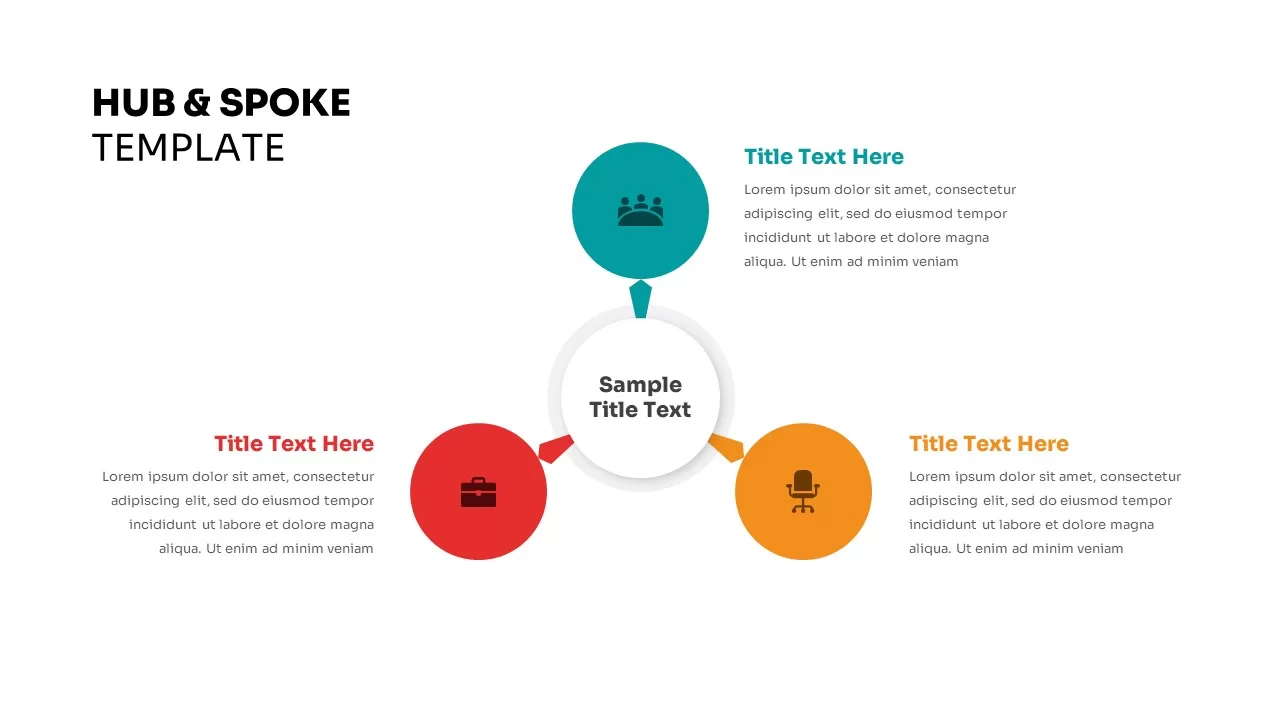
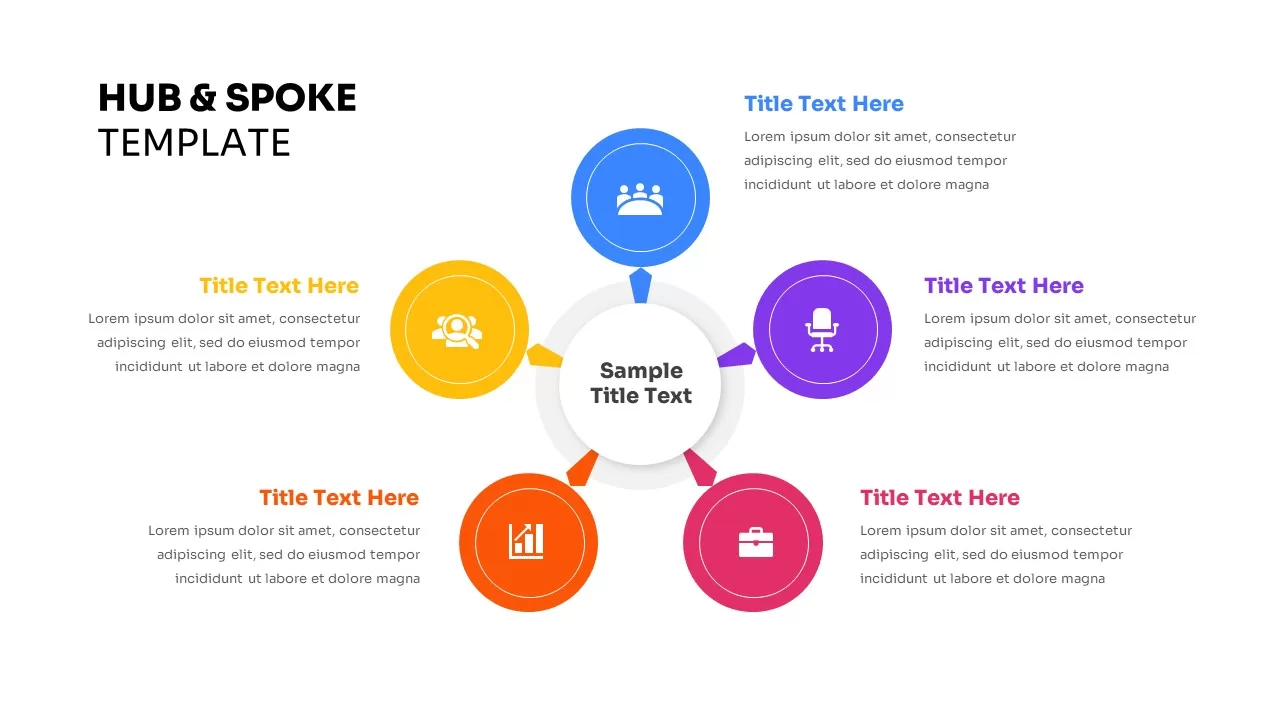
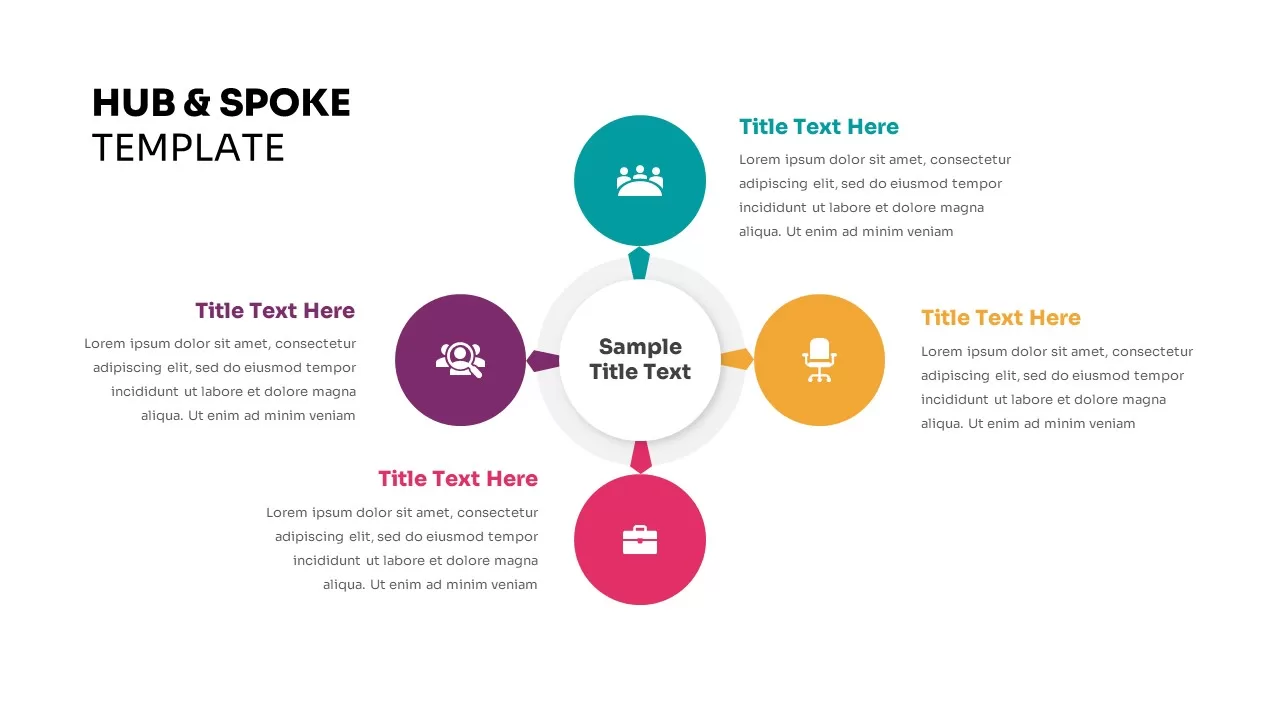
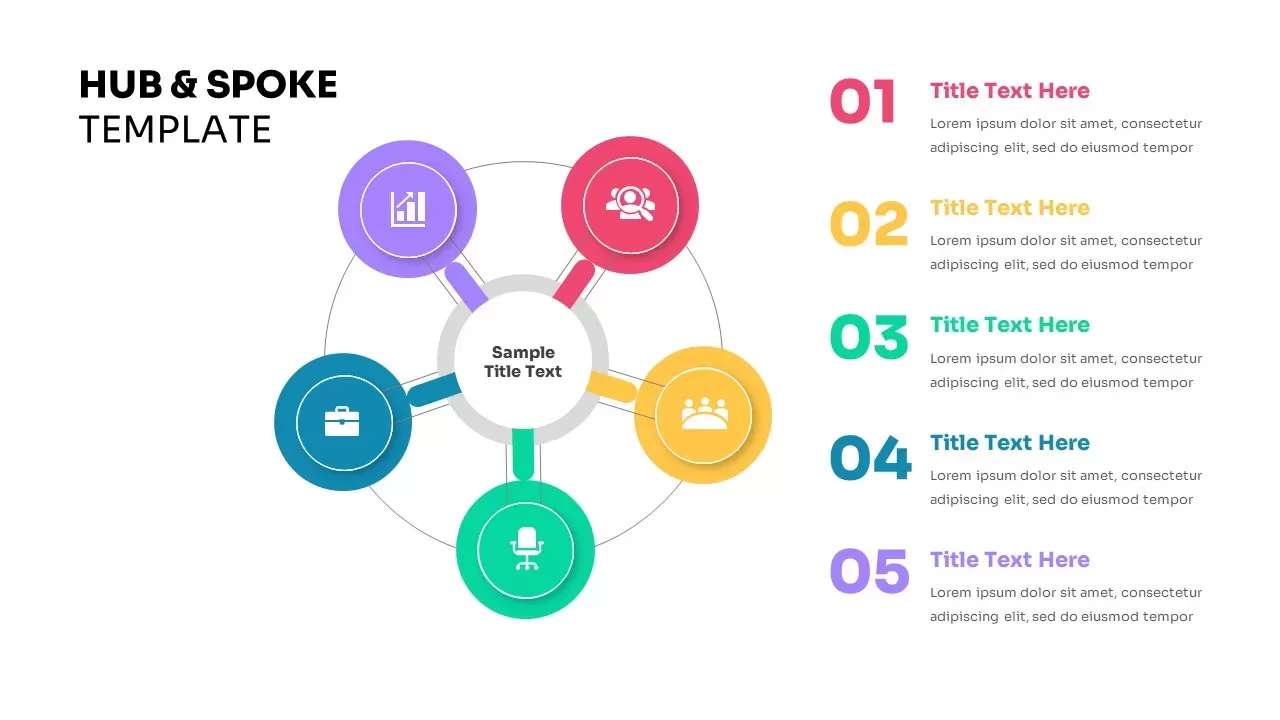
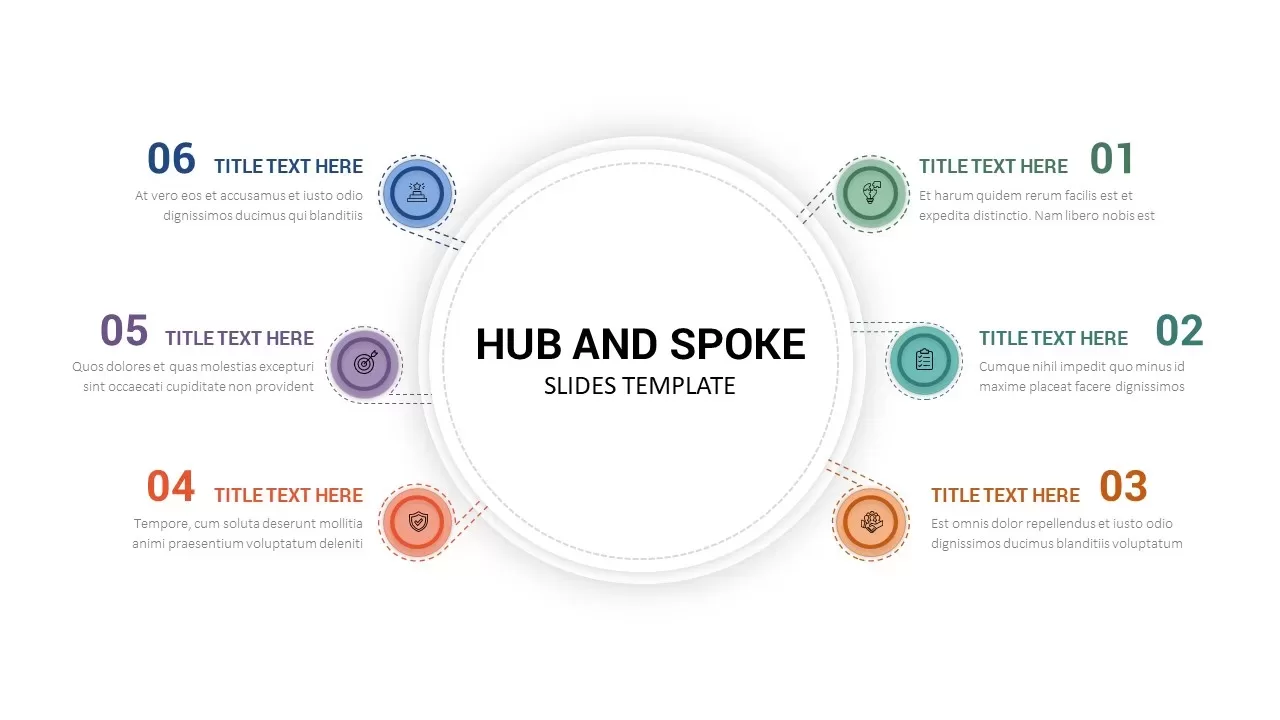
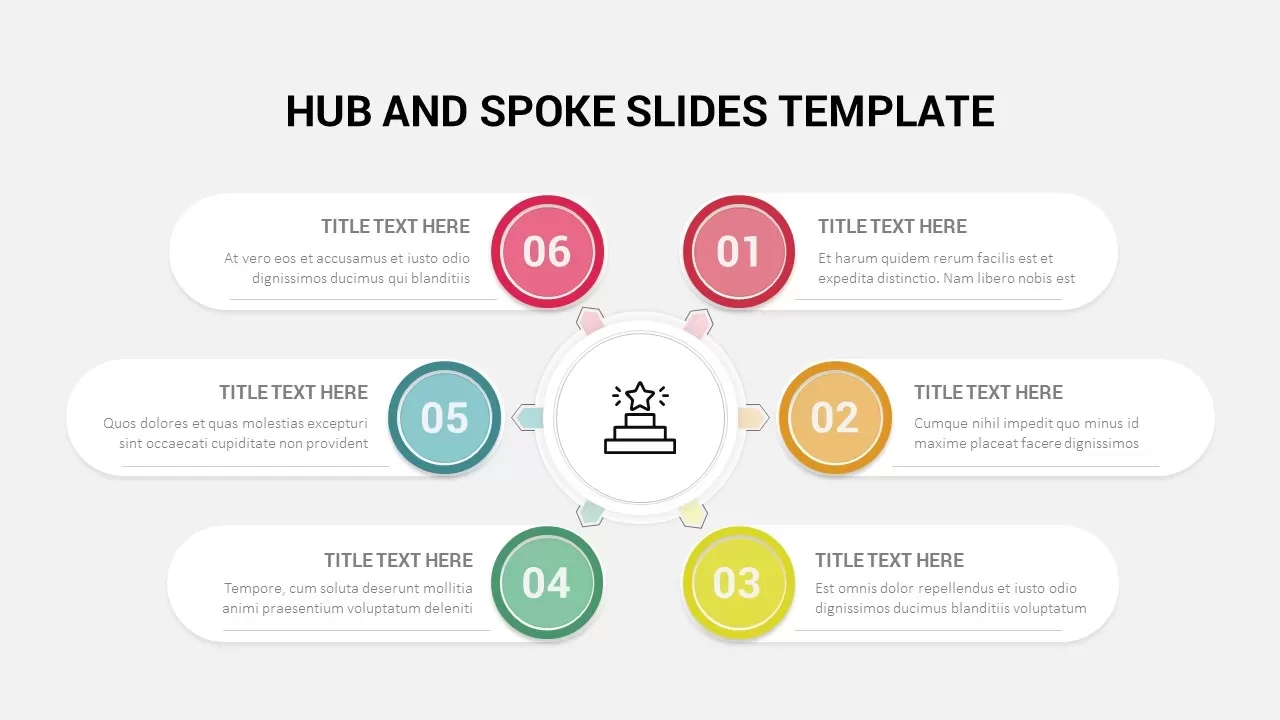
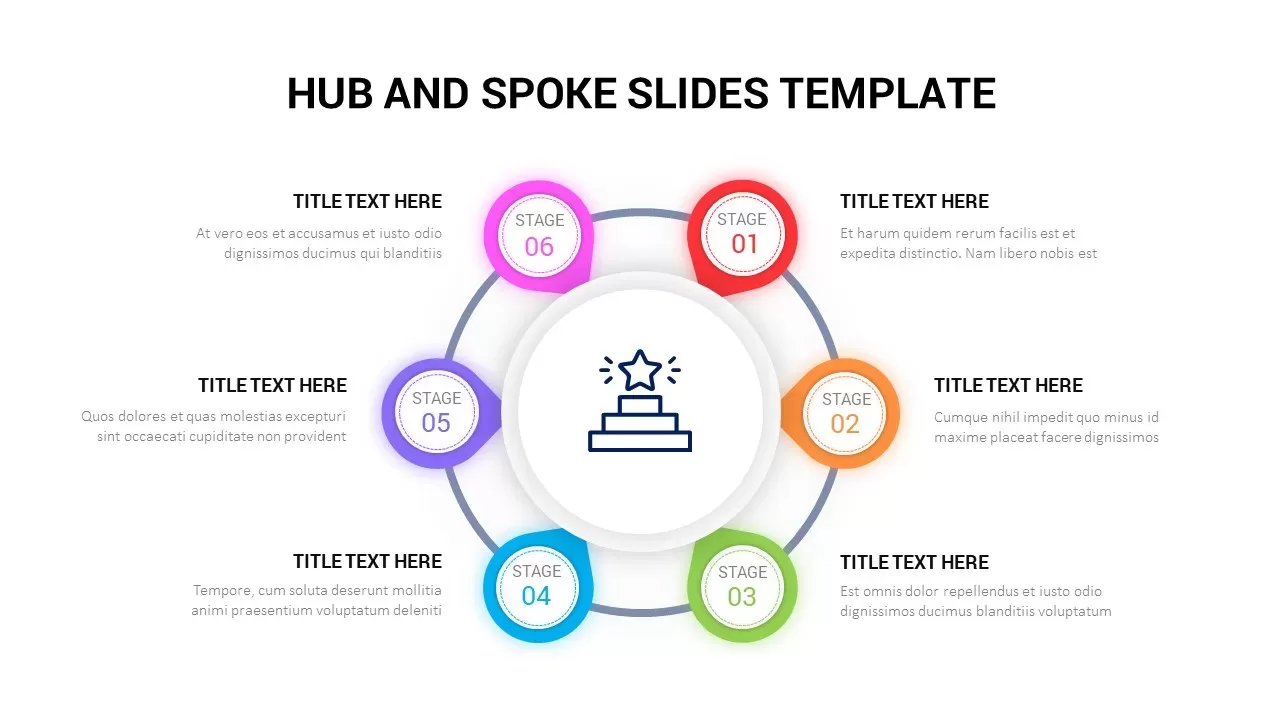
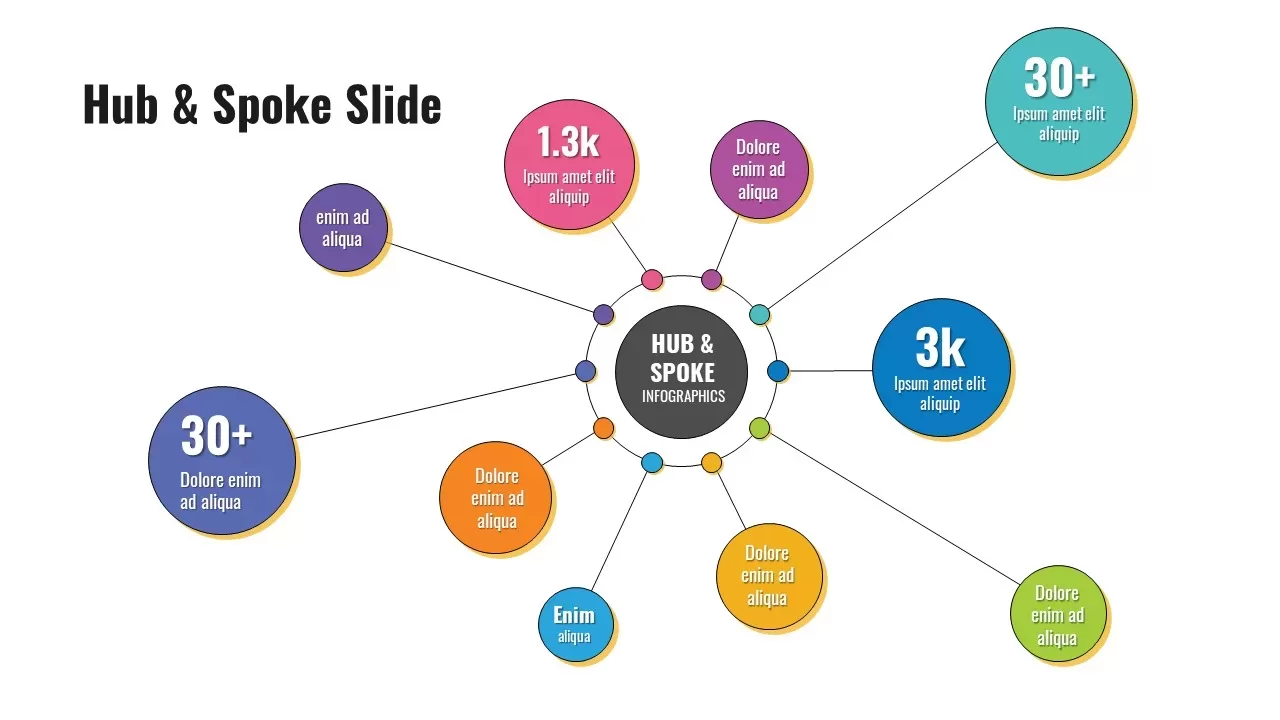
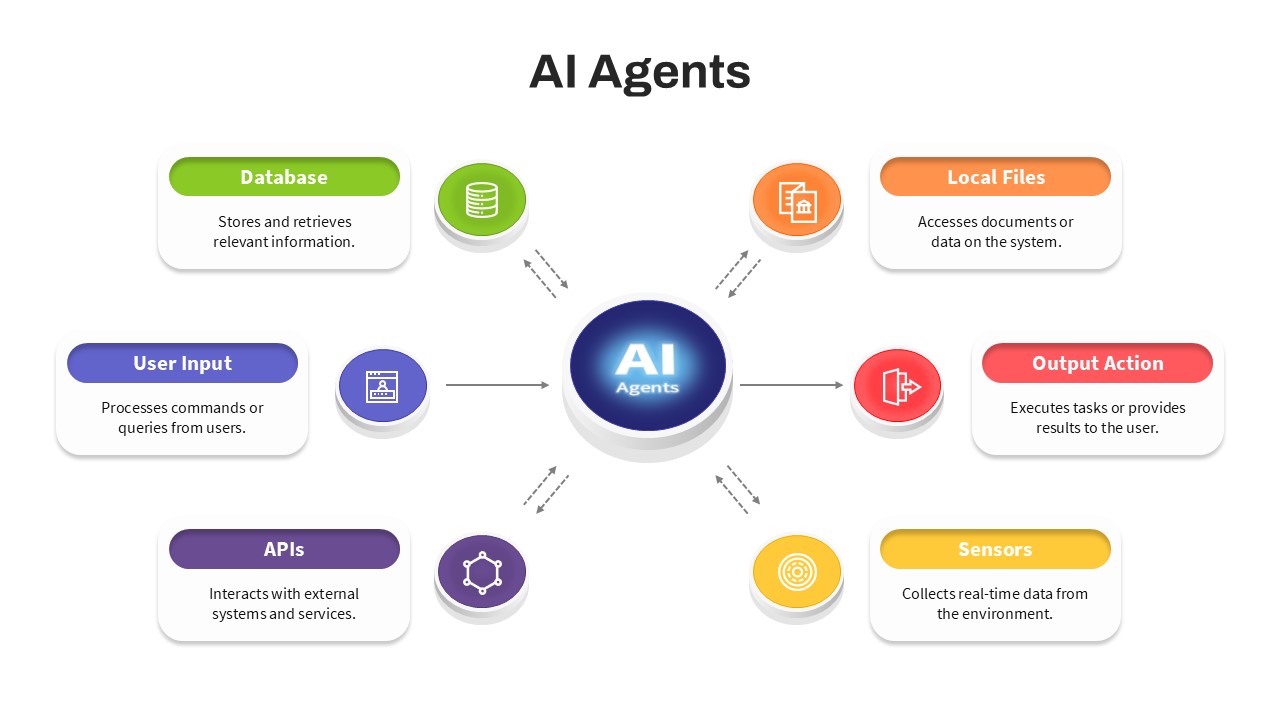
Leverage this radial hub-and-spoke diagram to present an AI Agents architecture, depicting six core modules and their data flows around a central agent core. The slide features a prominent “AI Agents” circle in glowing white text on a deep blue gradient background, surrounded by six colored circular icons—User Input (blue), Database (green), Local Files (orange), Output Action (red), Sensors (yellow), and APIs (purple). Directional arrows illustrate bidirectional or unidirectional data exchange, while adjacent rounded-rectangle panels in matching accent colors hold concise descriptions of each component’s role.
Built on master slide layouts for both PowerPoint and Google Slides, this fully editable diagram enables effortless customization: swap vector icons, adjust color hues, and modify text placeholders without disrupting alignment. High-resolution shapes ensure crisp rendering on any device or projector, and consistent typography with ample white space enhances readability. The structured radial layout underscores system interconnectivity, guiding audiences through input processing, data retrieval, environmental sensing, task execution, and service integration in a logical sequence.
Optimized for technical briefings, training workshops, and investor pitches on AI solutions, this slide simplifies complex concepts into a clear, professional visual narrative. Its modular design supports rapid updates, making it easy to tailor the diagram for evolving architectures, new data sources, or alternative integration patterns.
Who is it for
Data scientists, AI engineers, and IT architects will benefit from this slide when mapping agent-based systems, documenting component workflows, or communicating integration strategies to stakeholders. Technical leads, solution architects, and product managers can leverage the clean design to drive alignment in cross-functional teams and executive reviews.
Other Uses
Beyond AI architectures, repurpose this hub-and-spoke layout to illustrate microservices ecosystems, customer touchpoint frameworks, or centralized dashboard integrations. Use it for network topologies, service orchestration diagrams, or ecosystem mappings in strategic planning and educational settings.
Login to download this file

Item ID
SB04716
Related Templates

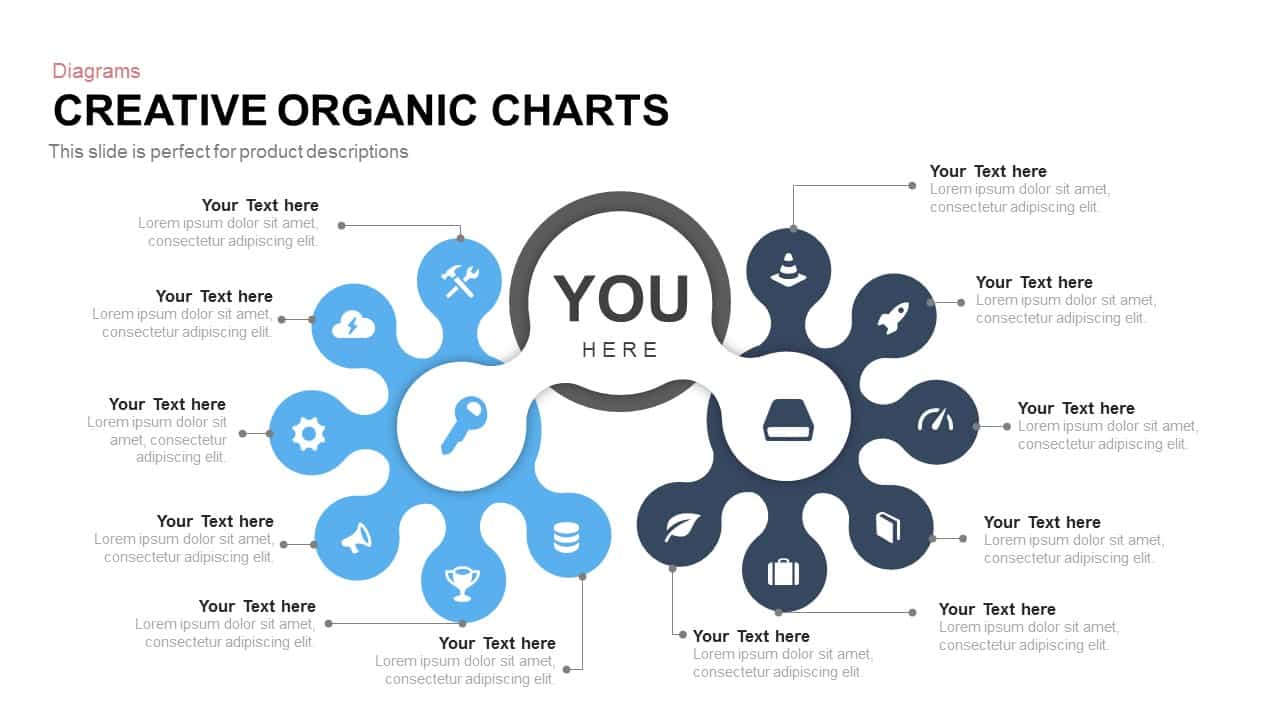
Creative Organic Hub-and-Spoke Diagram template for PowerPoint & Google Slides
Circular
Email Marketing Hub and Spoke Diagram template for PowerPoint & Google Slides
Circular
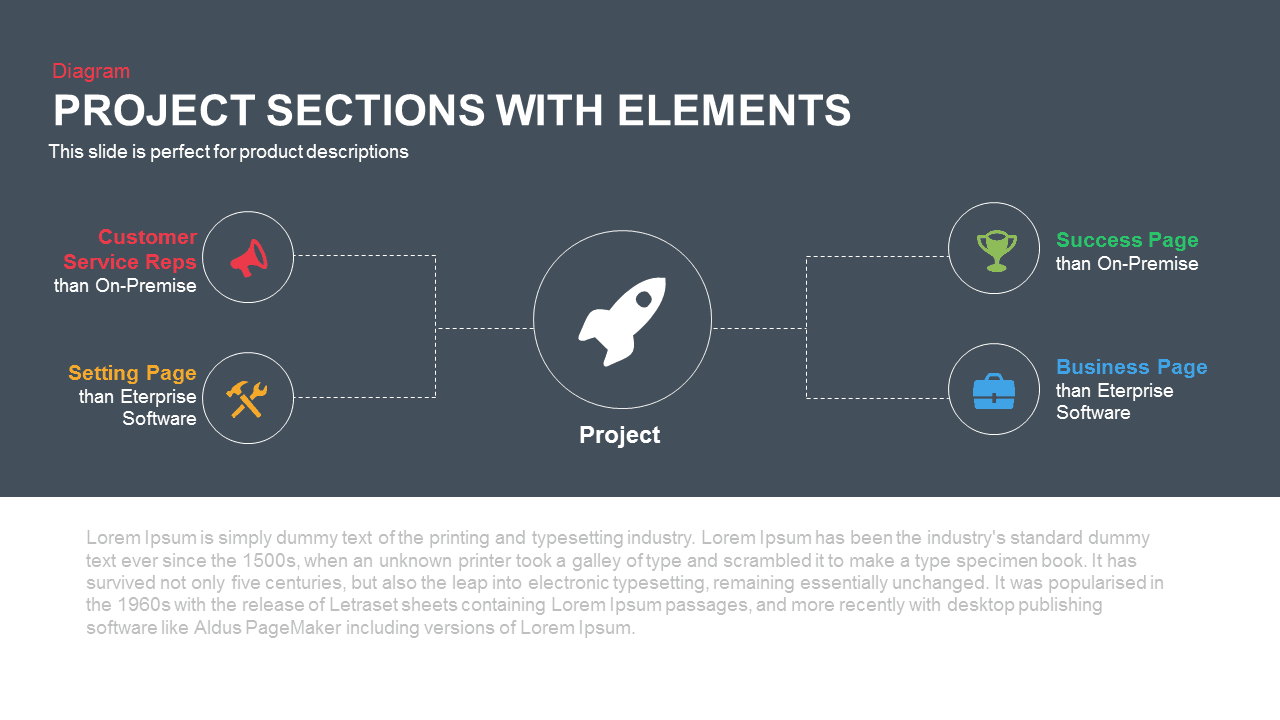
Project Sections Hub-and-Spoke Diagram template for PowerPoint & Google Slides
Flow Charts

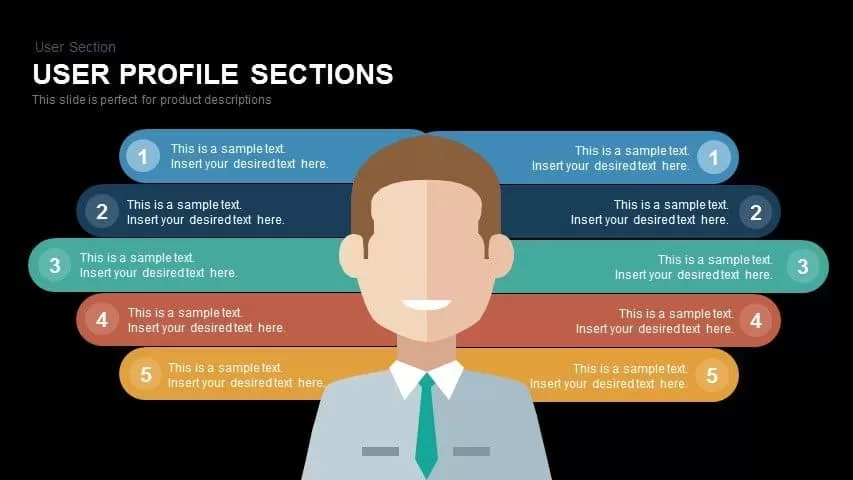
User Profile Hub-and-Spoke Diagram Template for PowerPoint & Google Slides
Our Team

Cloud Computing Hub and Spoke Diagram Template for PowerPoint & Google Slides
Cloud Computing
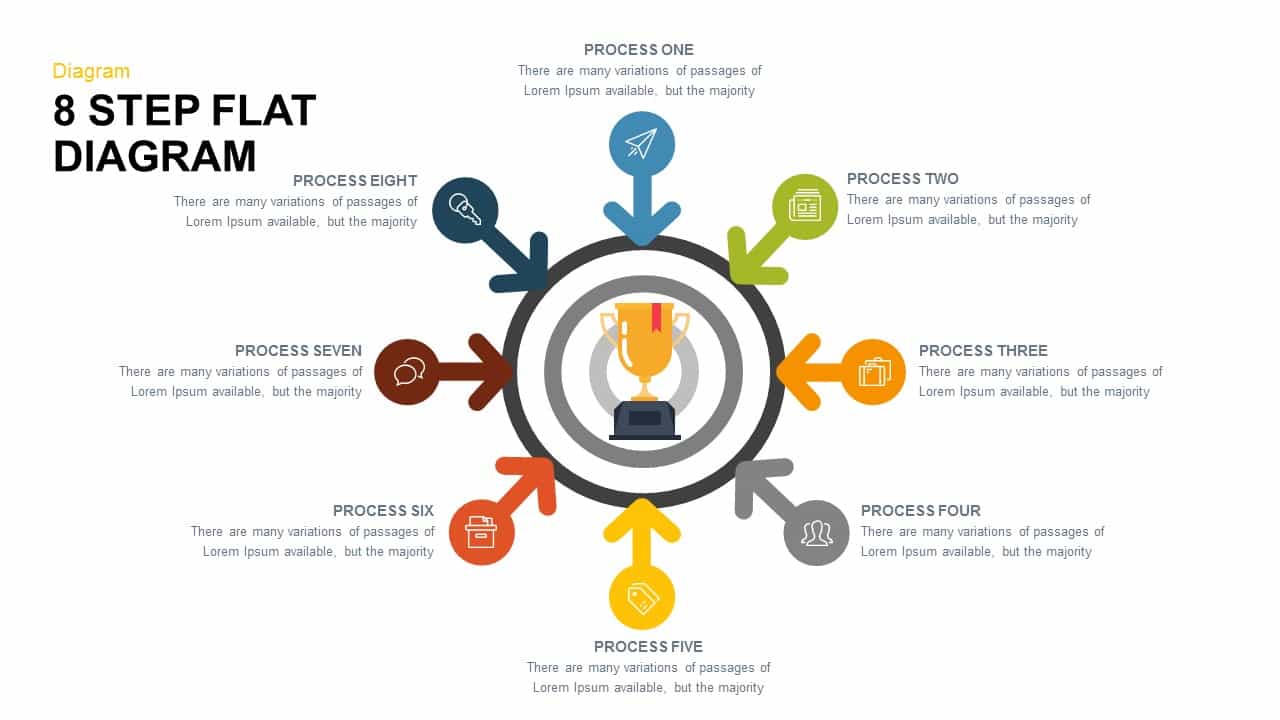
Eight-Step Hub and Spoke Diagram Template for PowerPoint & Google Slides
Process
Four-Circle Hub and Spoke Diagram Template for PowerPoint & Google Slides
Process
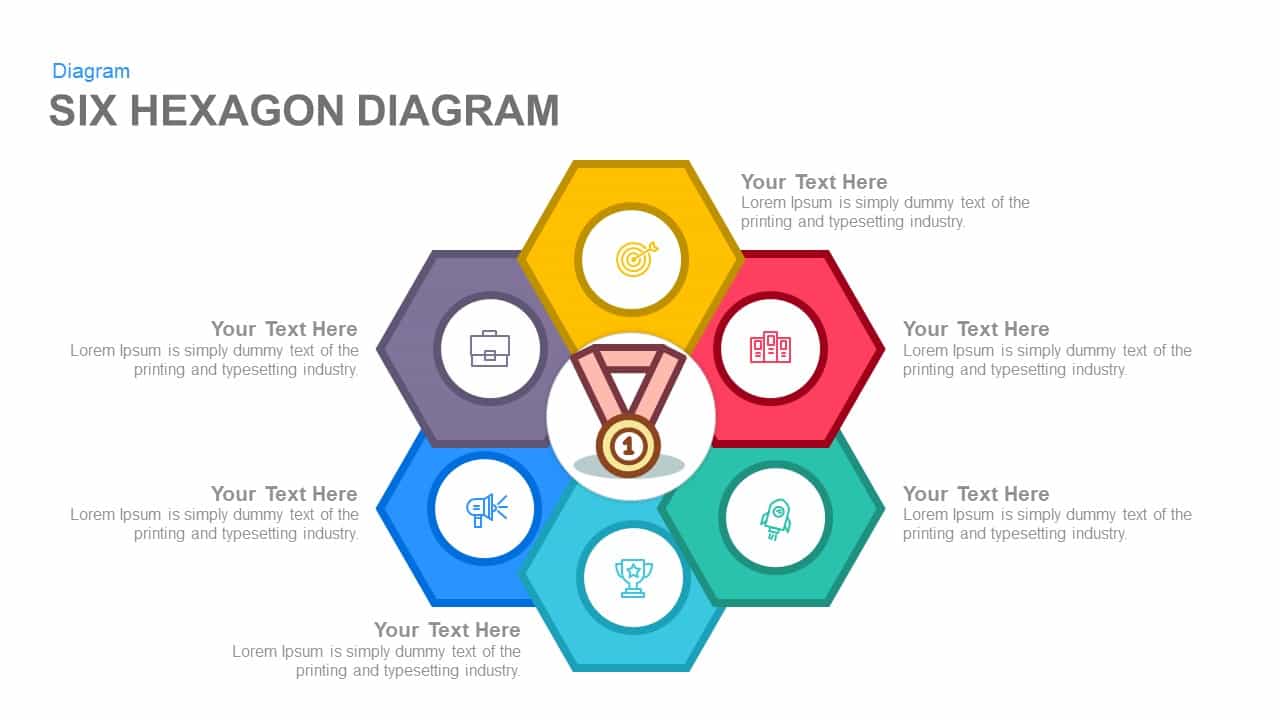
Six Hexagon Hub-and-Spoke Diagram Template for PowerPoint & Google Slides
Process

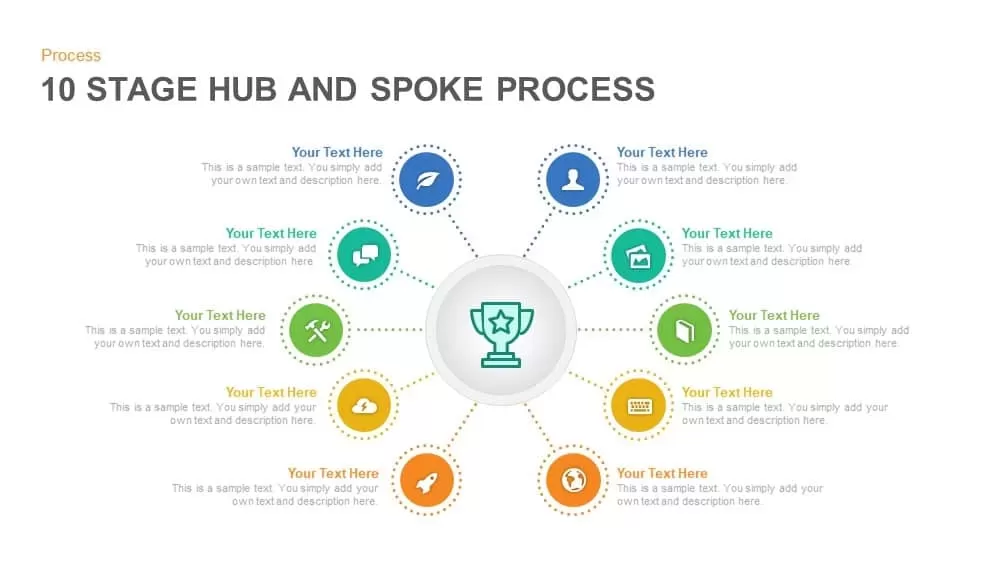
Ten-Stage Hub and Spoke Process Diagram Template for PowerPoint & Google Slides
Process
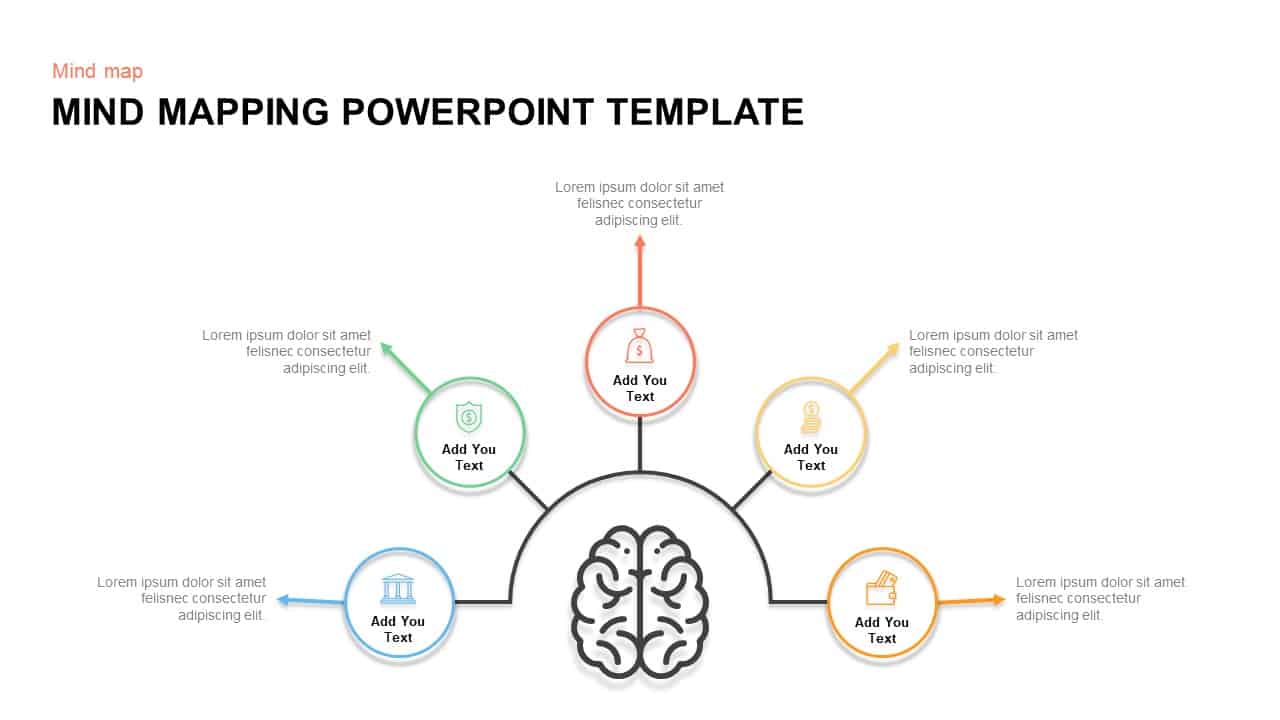
Mind Mapping Hub and Spoke Diagram Template for PowerPoint & Google Slides
Mind Maps
Mind Mapping Hub and Spoke Diagram Template for PowerPoint & Google Slides
Mind Maps
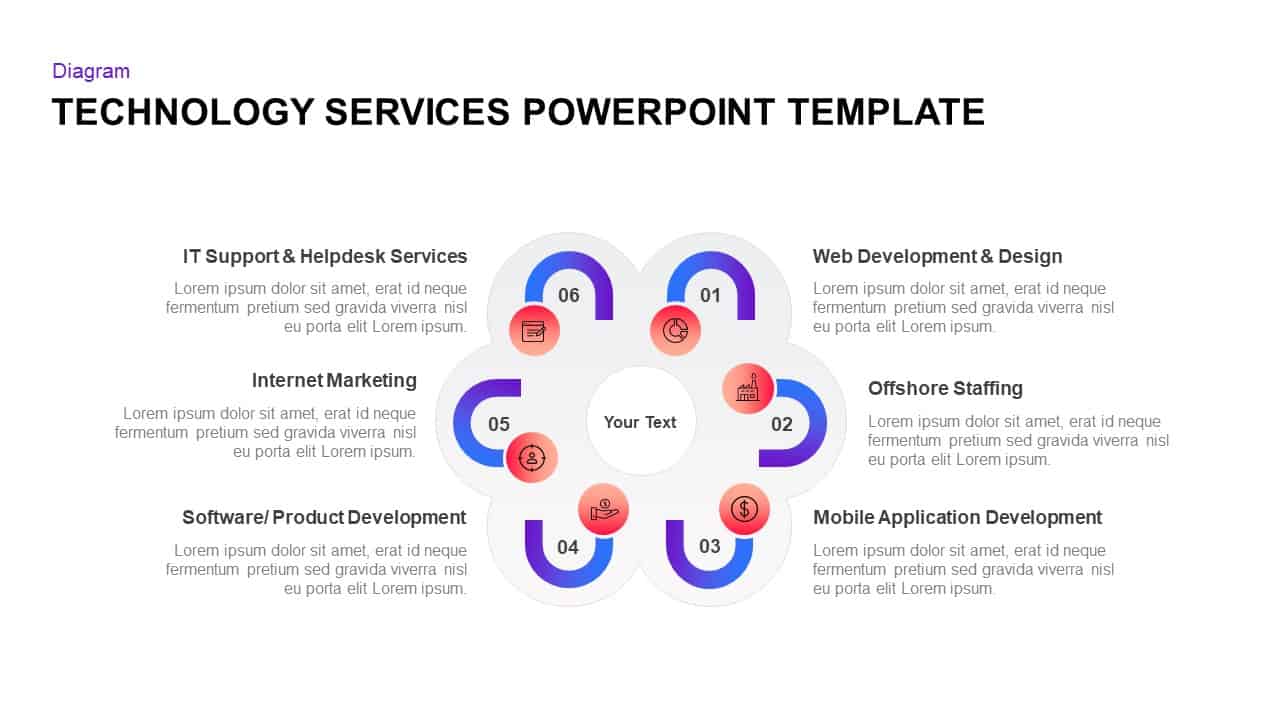
Technology Services Hub-Spoke Diagram Template for PowerPoint & Google Slides
Information Technology
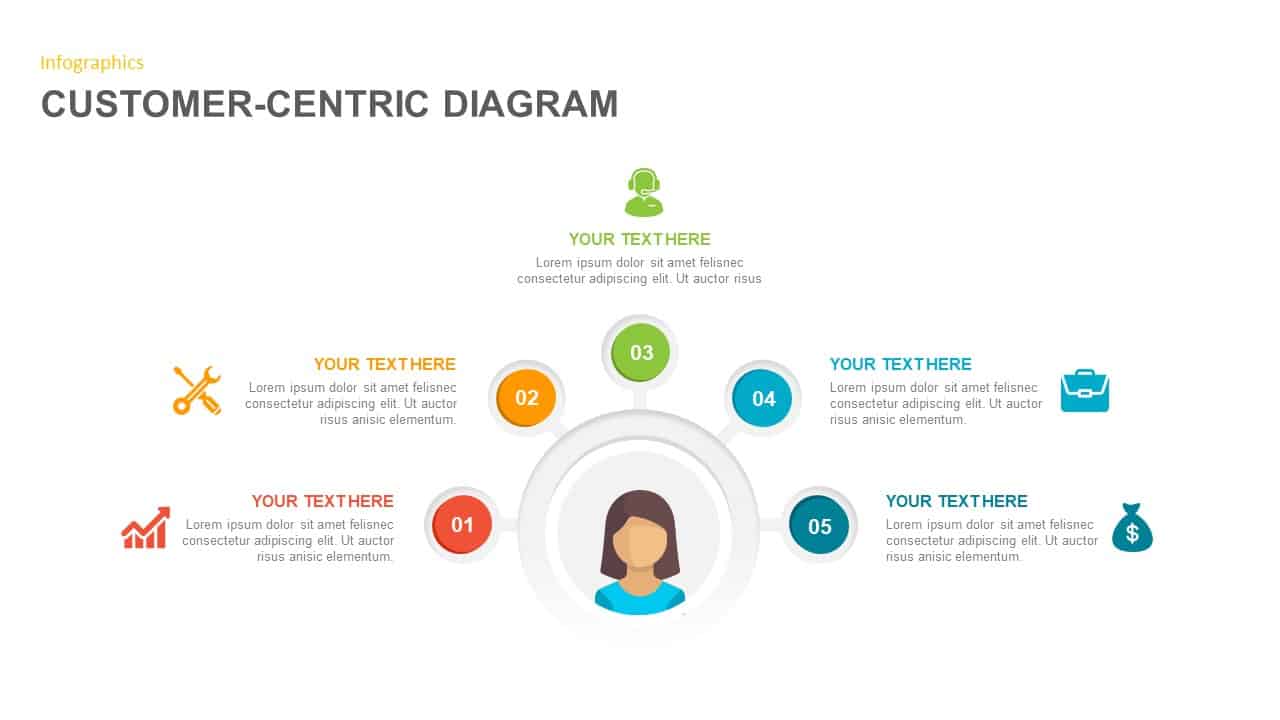
Customer-Centric Hub and Spoke Diagram Template for PowerPoint & Google Slides
Customer Experience
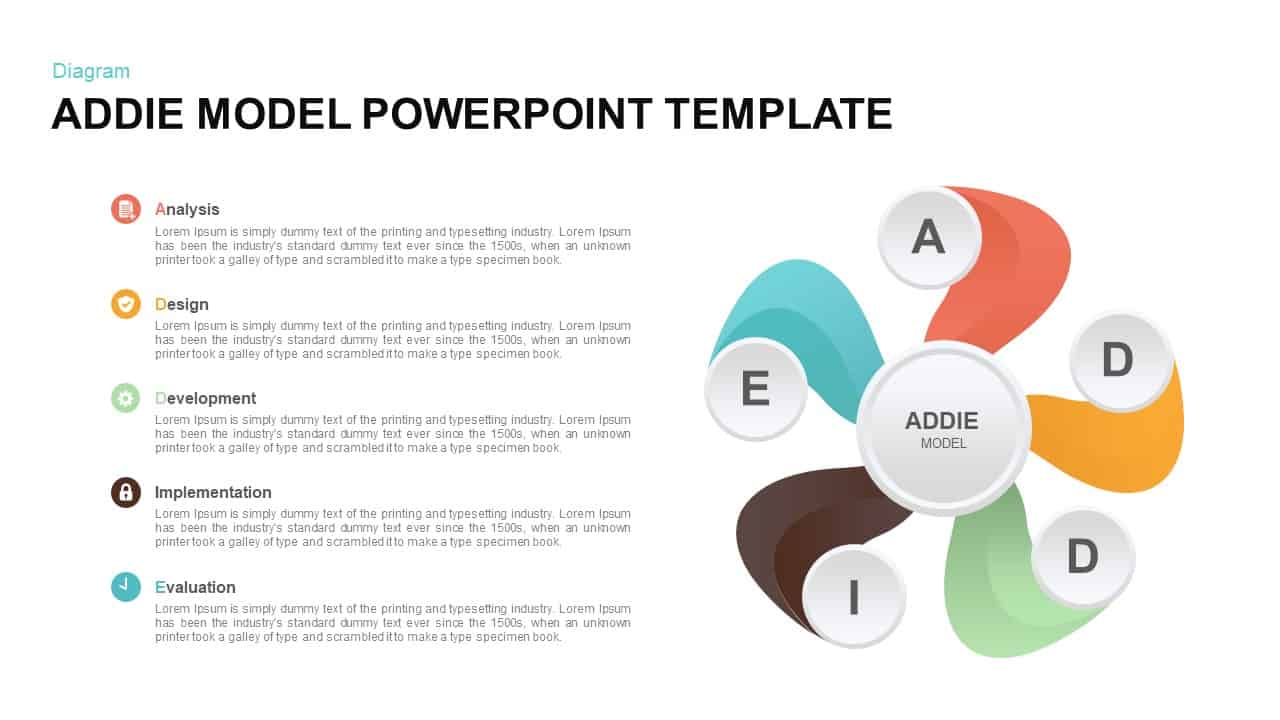
ADDIE Model Hub and Spoke Diagram Template for PowerPoint & Google Slides
Process

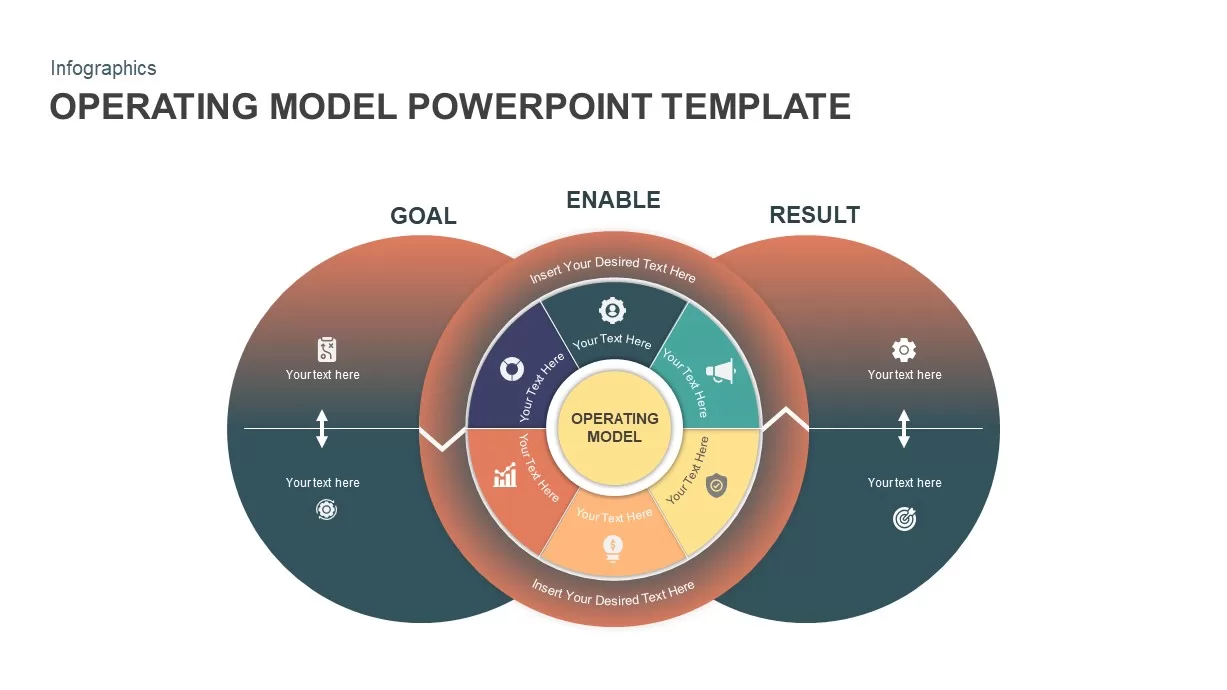
Operating Model Hub-and-Spoke Diagram Template for PowerPoint & Google Slides
Business Models
Multi-Item Agenda Hub-and-Spoke Diagram Template for PowerPoint & Google Slides
Agenda
Market Landscape Hub and Spoke Diagram Template for PowerPoint & Google Slides
Infographics
Four-Arrow Curved Hub-and-Spoke Diagram Template for PowerPoint & Google Slides
Arrow
Opportunities Hub-and-Spoke Comparison Diagram Template for PowerPoint & Google Slides
Opportunities Challenges
Opportunities Hub-and-Spoke Diagram Template for PowerPoint & Google Slides
Circular
Three-Step Hub and Spoke Diagram Template for PowerPoint & Google Slides
Circular
Five-Node Hub and Spoke Diagram Template for PowerPoint & Google Slides
Business Strategy
Four-Point Hub and Spoke Diagram Template for PowerPoint & Google Slides
Business Strategy
Five-Node Hub & Spoke Diagram Process Template for PowerPoint & Google Slides
Business Models
Hub & Spoke Infographic Diagram Template for PowerPoint & Google Slides
Process
Dynamic Hub-and-Spoke Infographic Diagram Template for PowerPoint & Google Slides
Circular
Lessons Learned Hub and Spoke Diagram Template for PowerPoint & Google Slides
Leadership
Free
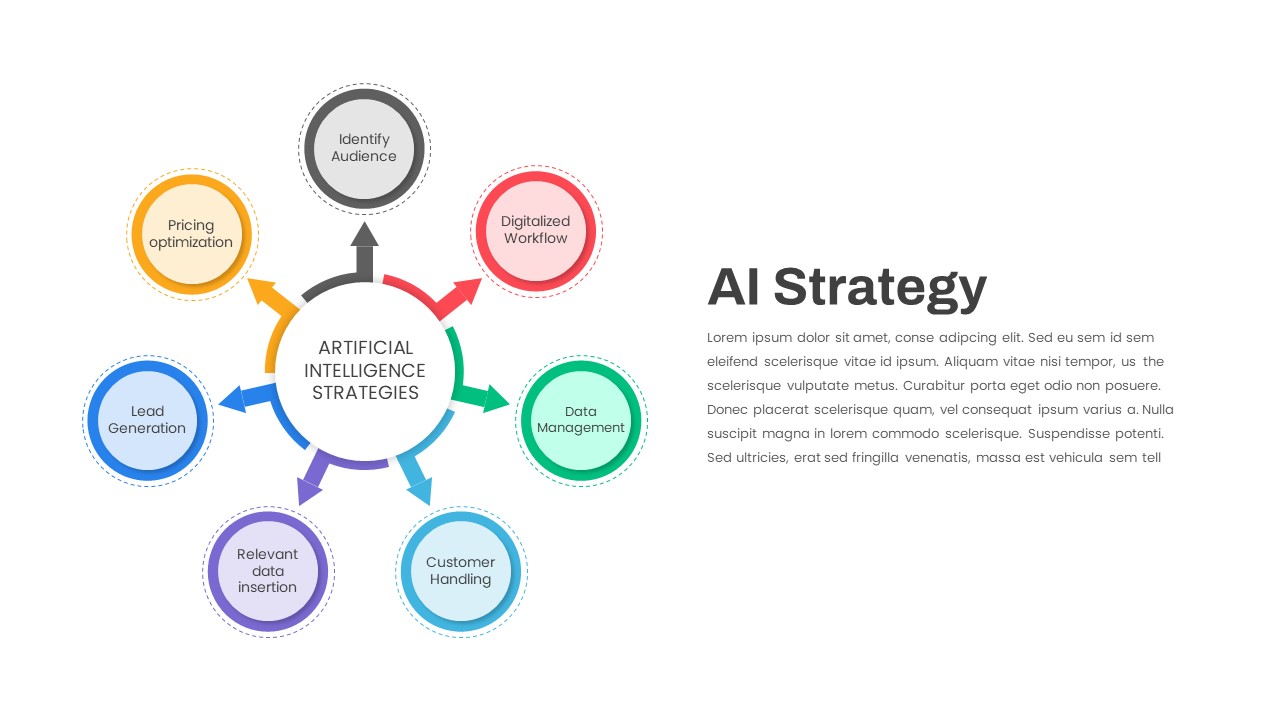
AI Strategy Hub-and-Spoke Diagram Template for PowerPoint & Google Slides
Circular
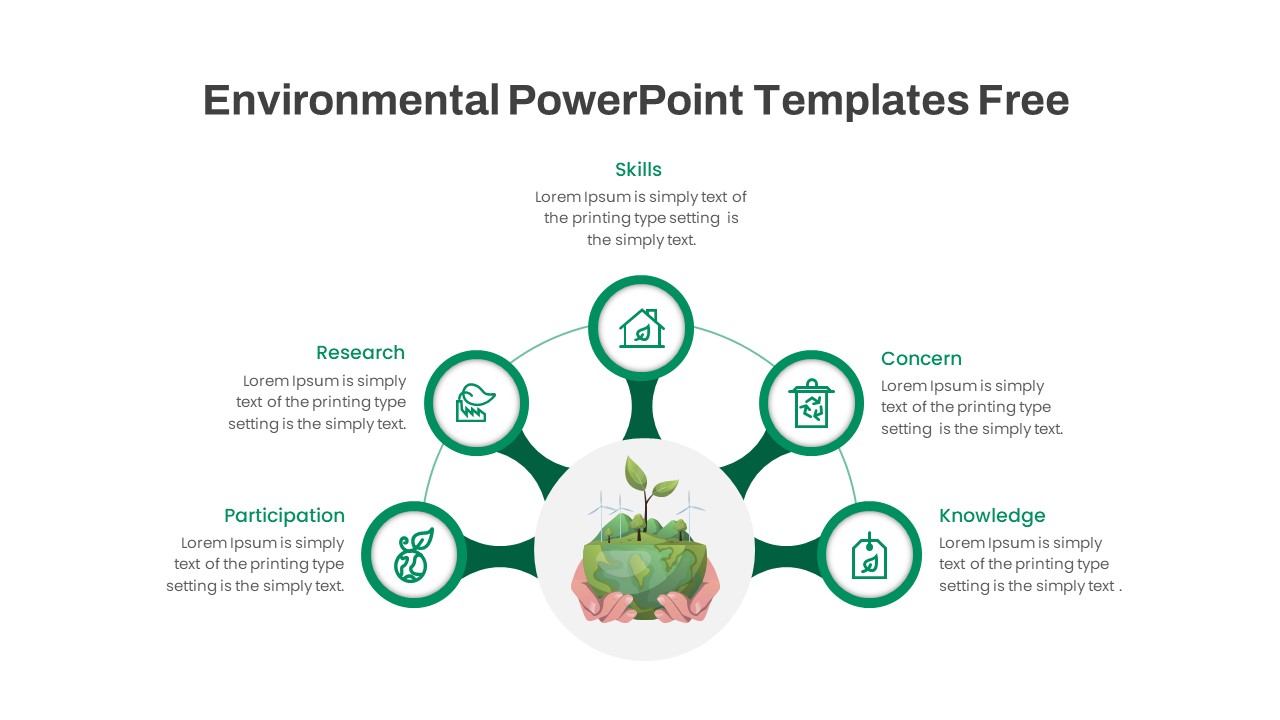
Free Environmental Hub-and-Spoke Diagram Template for PowerPoint & Google Slides
Circular
Free
AI Rules Hub and Spoke Diagram Template for PowerPoint & Google Slides
AI
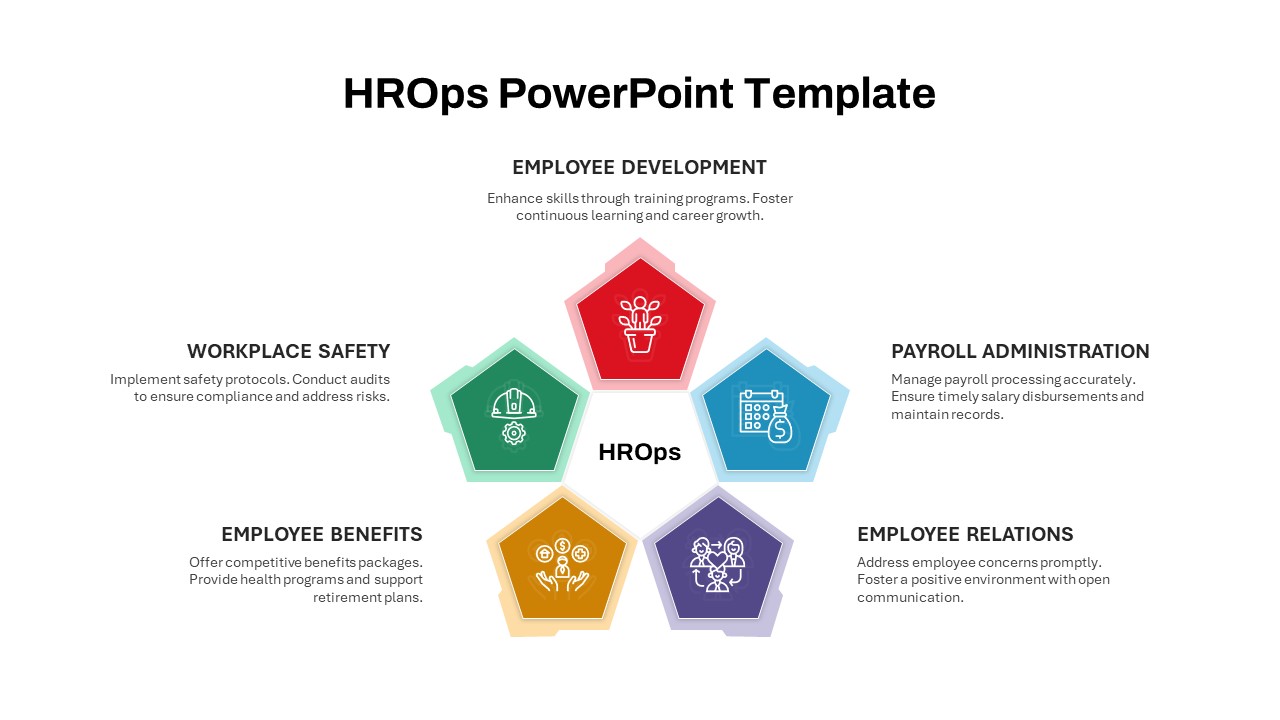
HROps Hub and Spoke Circular Diagram Template for PowerPoint & Google Slides
Circular
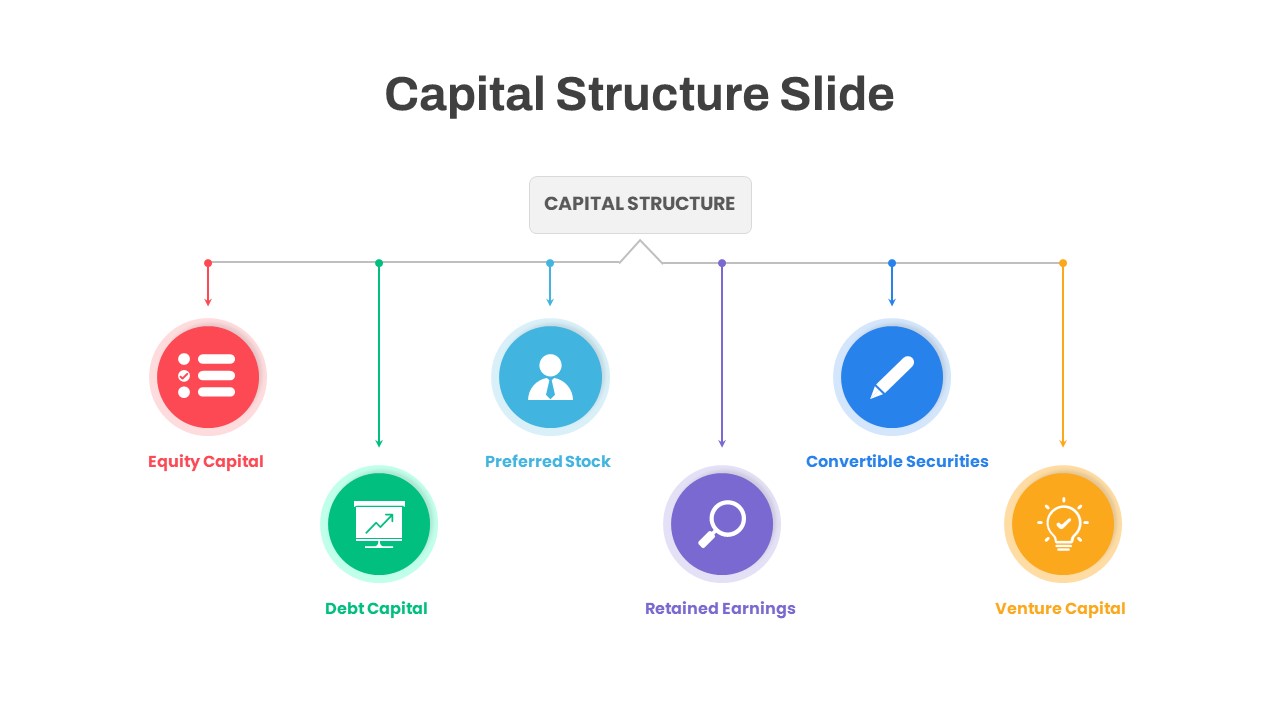
Capital Structure Hub & Spoke Diagram Template for PowerPoint & Google Slides
Process
Career Portfolio Hub-and-Spoke Diagram Template for PowerPoint & Google Slides
Circular
Data Lake Hub-and-Spoke Diagram Template for PowerPoint & Google Slides
Cloud Computing
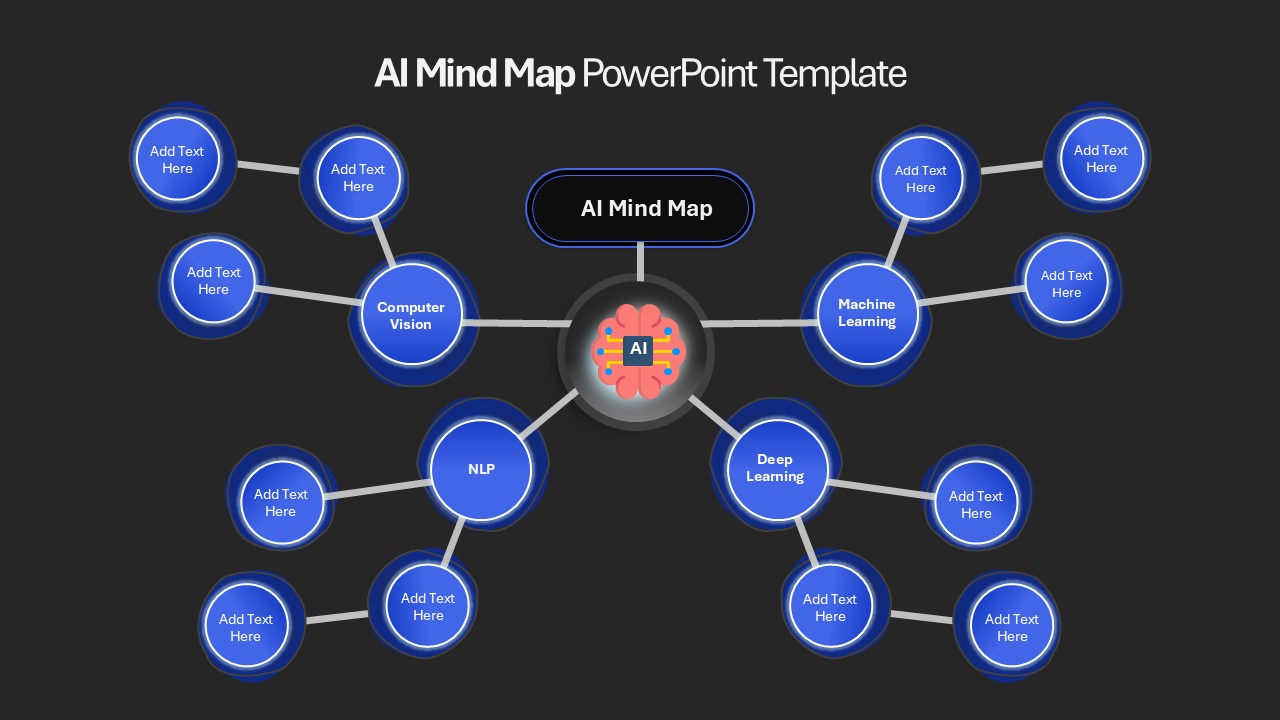
AI Mind Map & Hub-and-Spoke Diagram Template for PowerPoint & Google Slides
Mind Maps
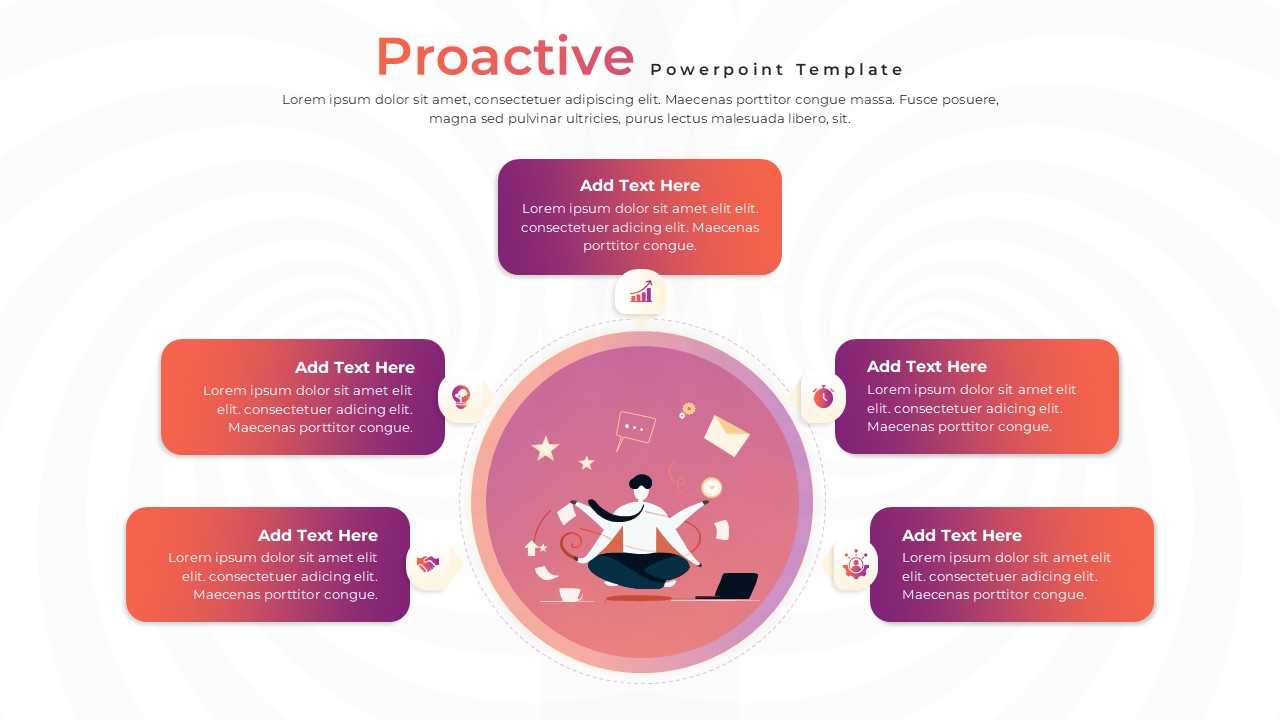
Proactive Hub-and-Spoke Diagram Template for PowerPoint & Google Slides
Process
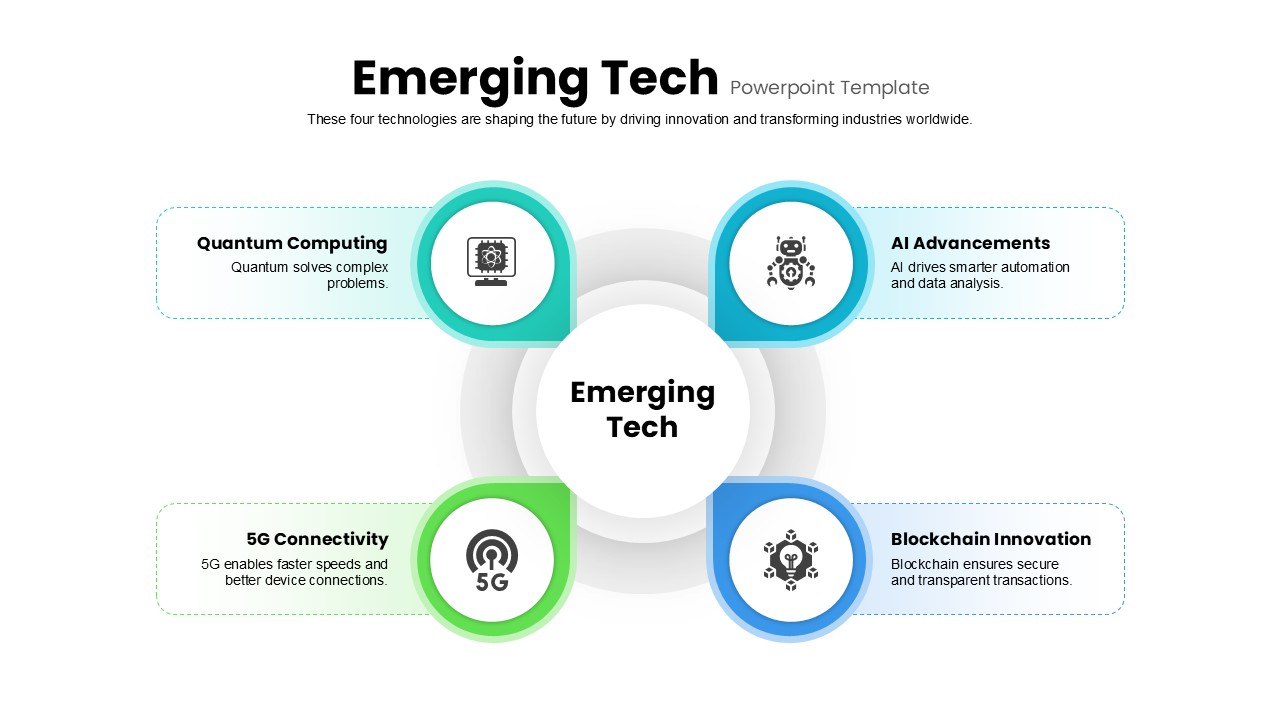
Emerging Tech Hub-and-Spoke Diagram Template for PowerPoint & Google Slides
Technology
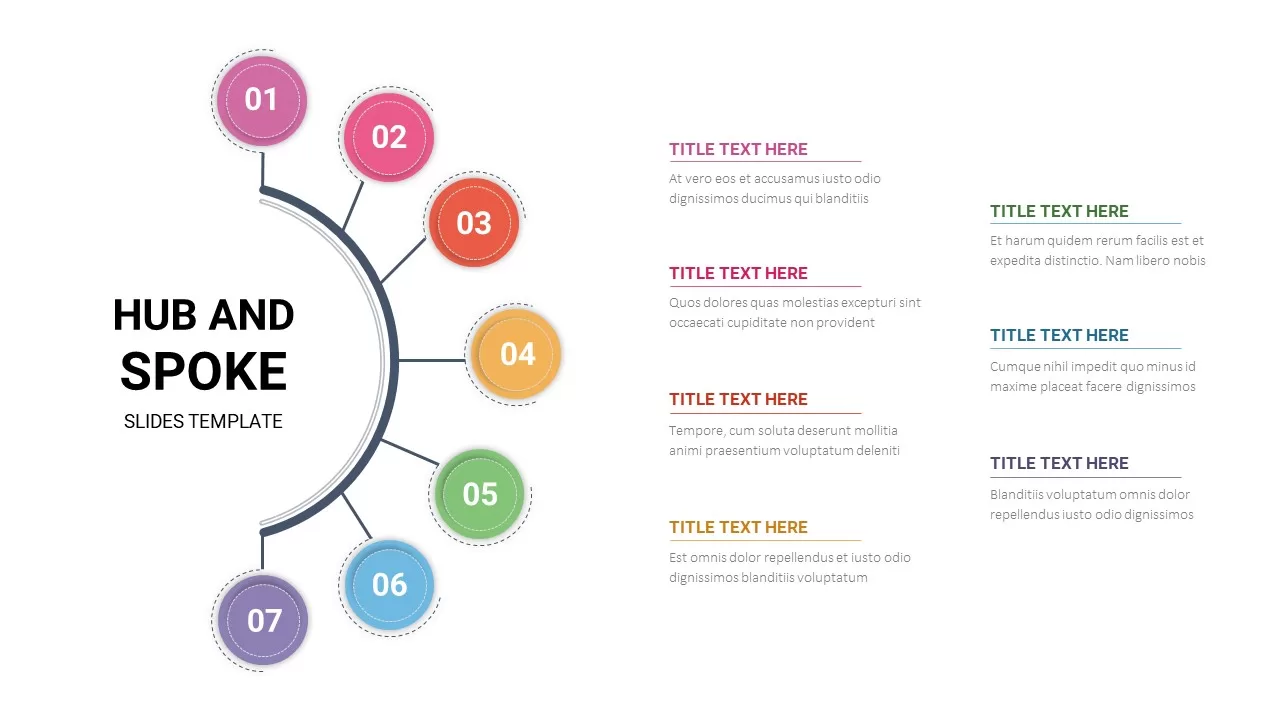
7 Hub and Spoke Diagram Slide for PowerPoint & Google Slides
Process
Hub and Spoke Diagram Slide for PowerPoint & Google Slides
Circular
Hub and Spoke Diagram for PowerPoint & Google Slides
Business Models
Cloud Upload Hub-and-Spoke Infographic Template for PowerPoint & Google Slides
Circular
Brain Gear Hub-and-Spoke Infographics template for PowerPoint & Google Slides
Org Chart

Brain Hub-and-Spoke Infographic template for PowerPoint & Google Slides
Org Chart
Company Vision Hub and Spoke Infographic Template for PowerPoint & Google Slides
Vision and Mission
Eight-Stage Hub & Spoke Process Template for PowerPoint & Google Slides
Process
Social Media Hub & Spoke Model Template for PowerPoint & Google Slides
Process
Employee Benefits Hub and Spoke Infographic Template for PowerPoint & Google Slides
HR
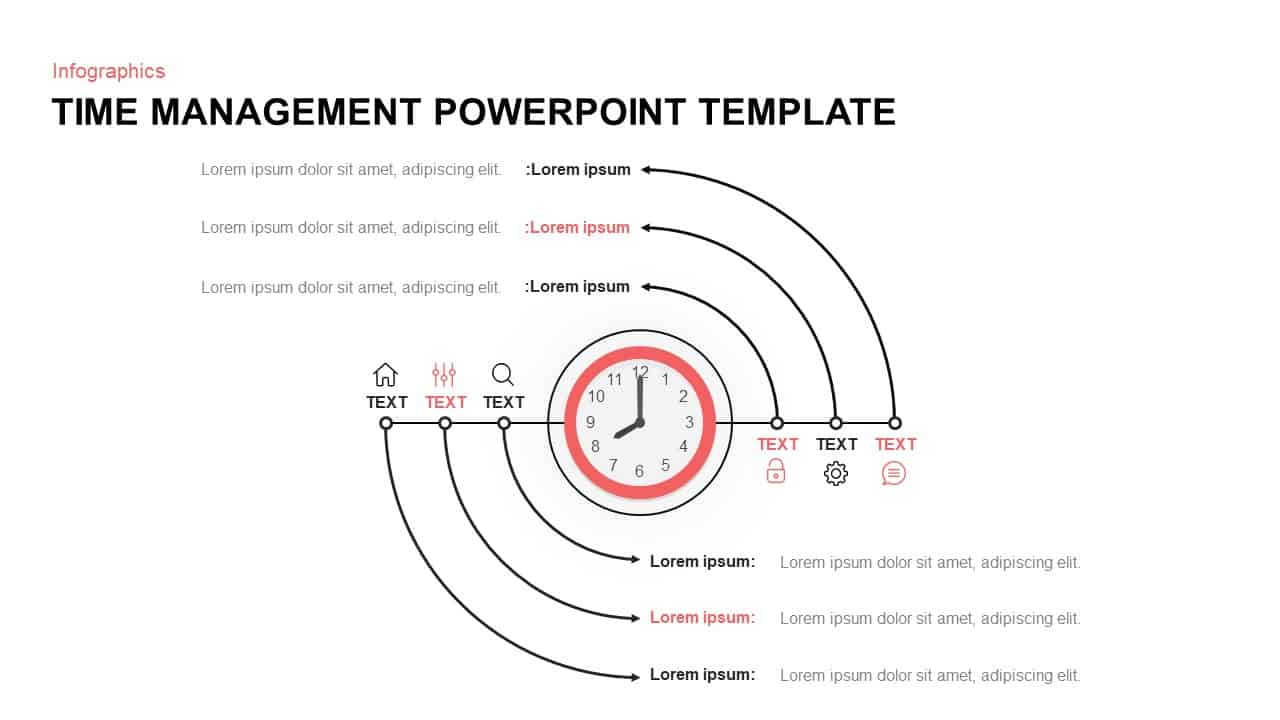
Hub and Spoke Time Management Process Template for PowerPoint & Google Slides
Process
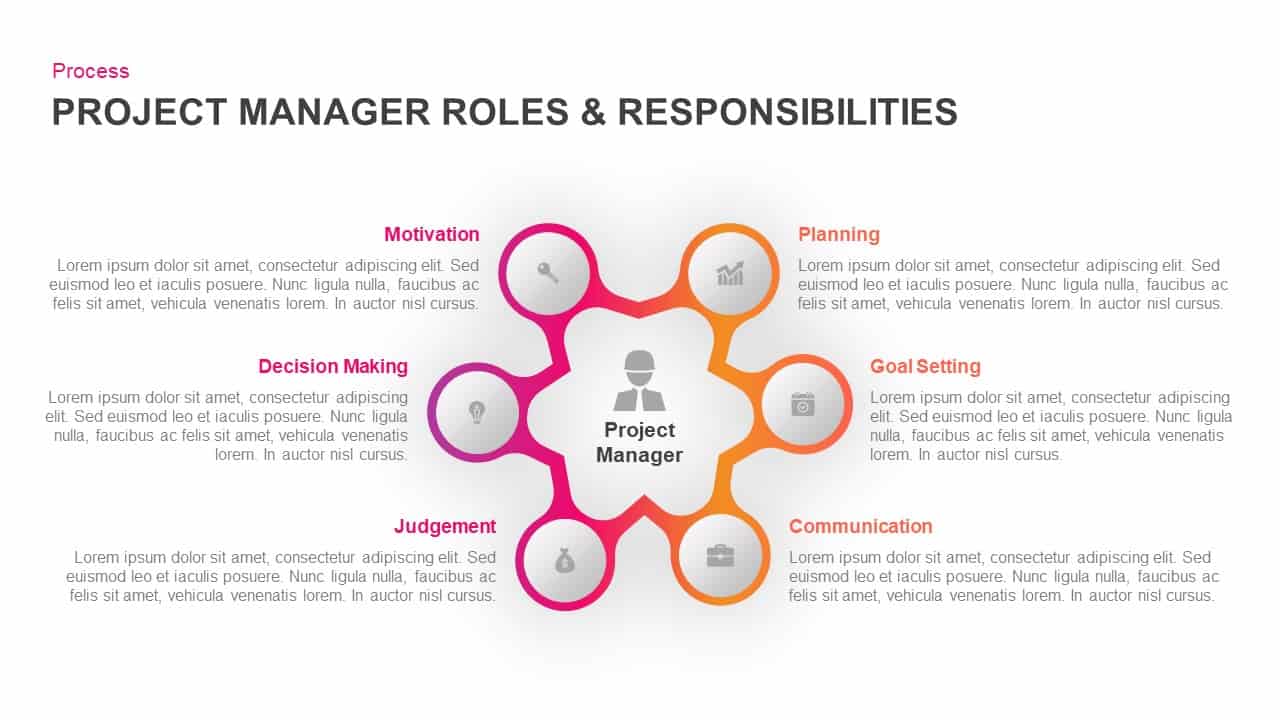
Project Manager Roles Hub-Spoke Process Template for PowerPoint & Google Slides
Process
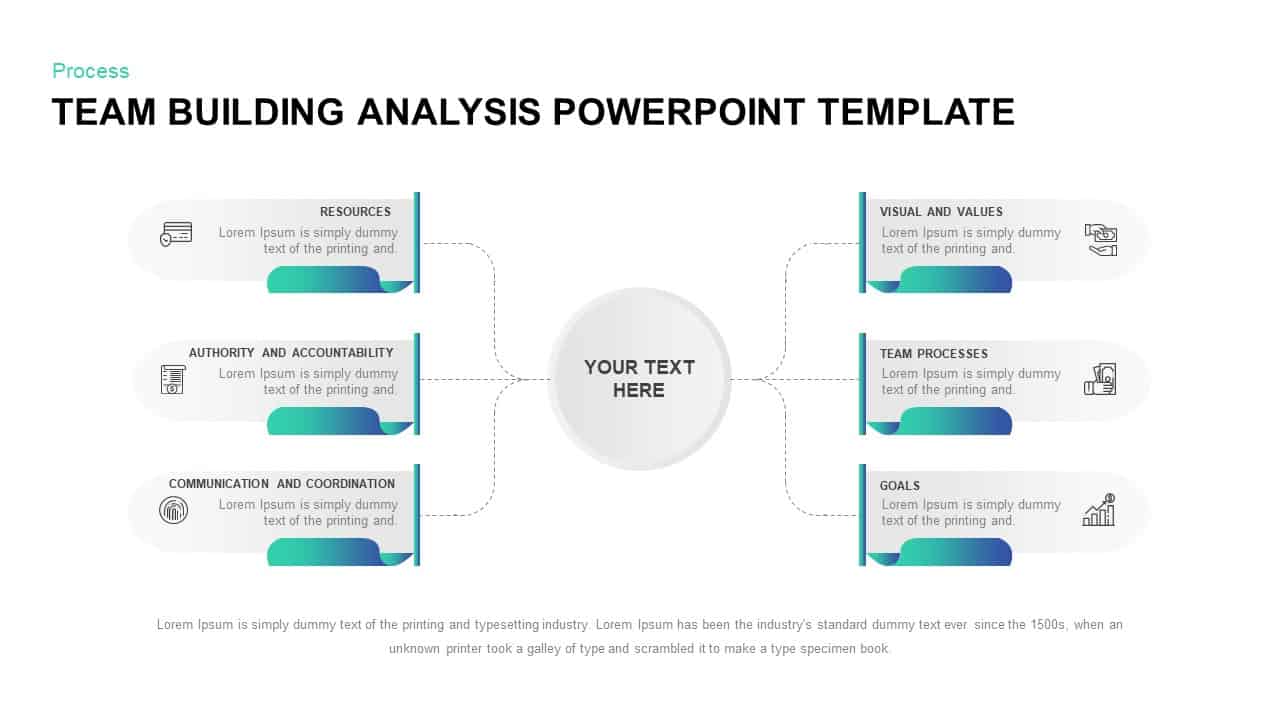
Team Building Hub-and-Spoke Analysis Template for PowerPoint & Google Slides
Process
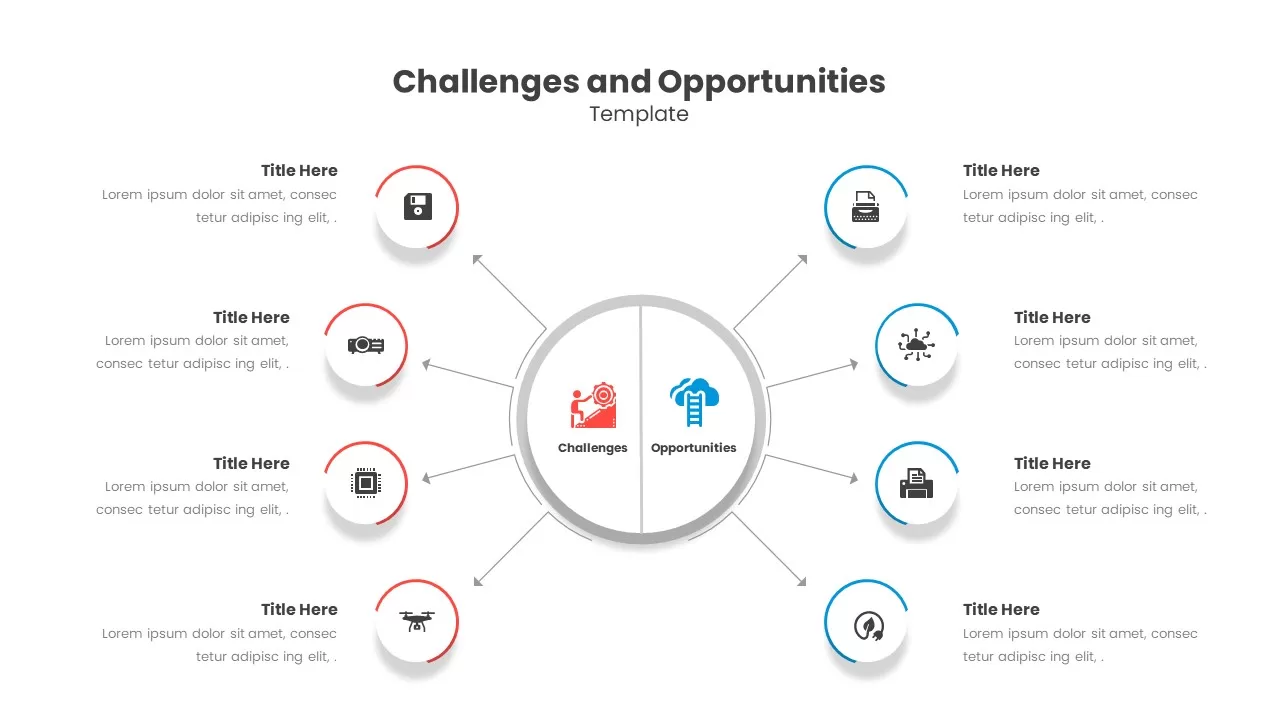
Challenges & Opportunities Hub-Spoke Template for PowerPoint & Google Slides
Circular
6 Stage Hub and Spoke Stages template for PowerPoint & Google Slides
Business Models
Project Scope Hub & Spoke Layout Template for PowerPoint & Google Slides
Process
Colorful Hub-and-Spoke Infographic Template for PowerPoint & Google Slides
Circular
Colorful Hub-and-Spoke Infographic Template for PowerPoint & Google Slides
Circular
Hub-and-Spoke Infographic Layout Template for PowerPoint & Google Slides
Circular
Dynamic Circular Hub-and-Spoke Infographic Template for PowerPoint & Google Slides
Circular
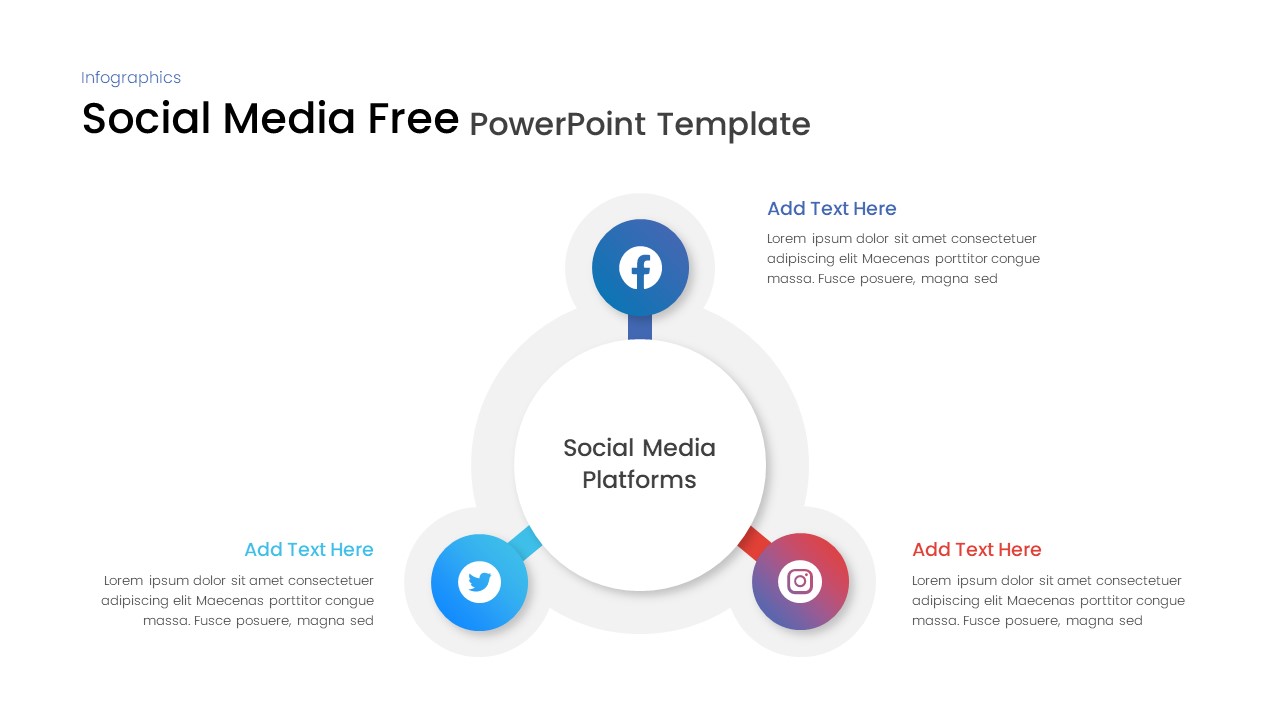
Social Media Hub-and-Spoke Infographics Template for PowerPoint & Google Slides
Circular
Lungs Hub-and-Spoke Infographic Template for PowerPoint & Google Slides
Health
Omnichannel Sales Circular Hub & Spoke Template for PowerPoint & Google Slides
Digital Marketing
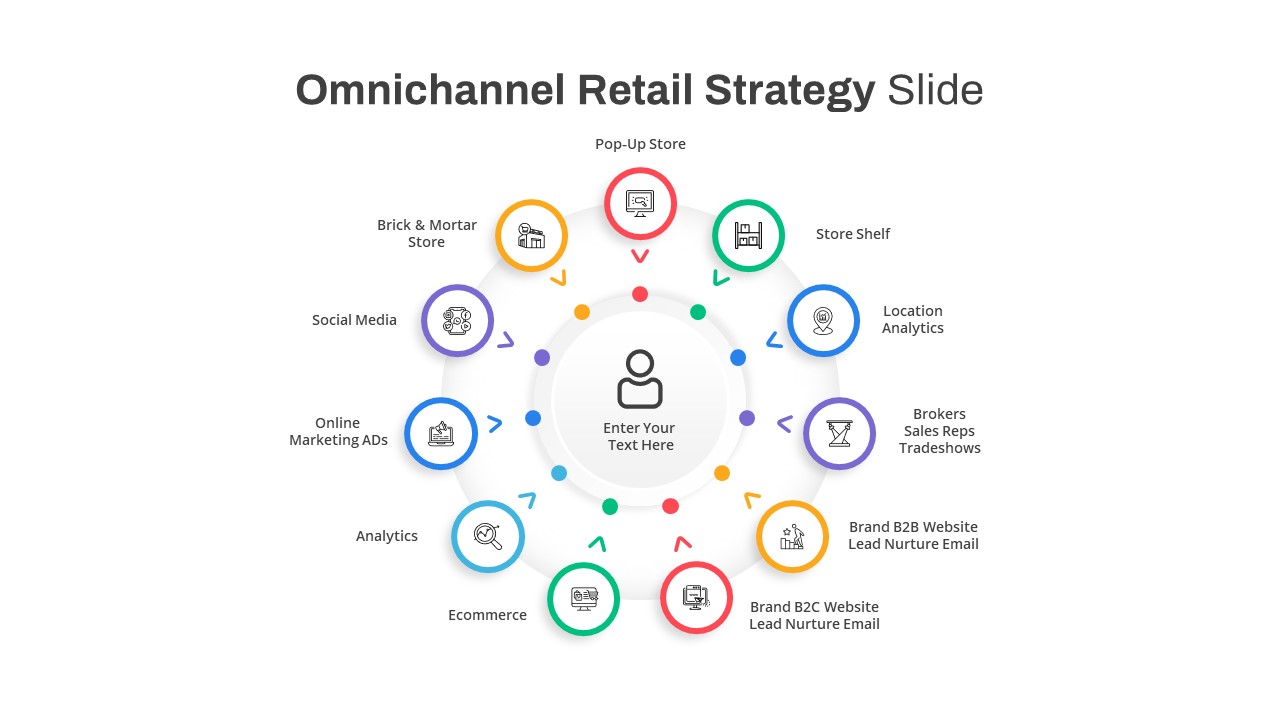
Omnichannel Retail Strategy Hub & Spoke Template for PowerPoint & Google Slides
Business Strategy
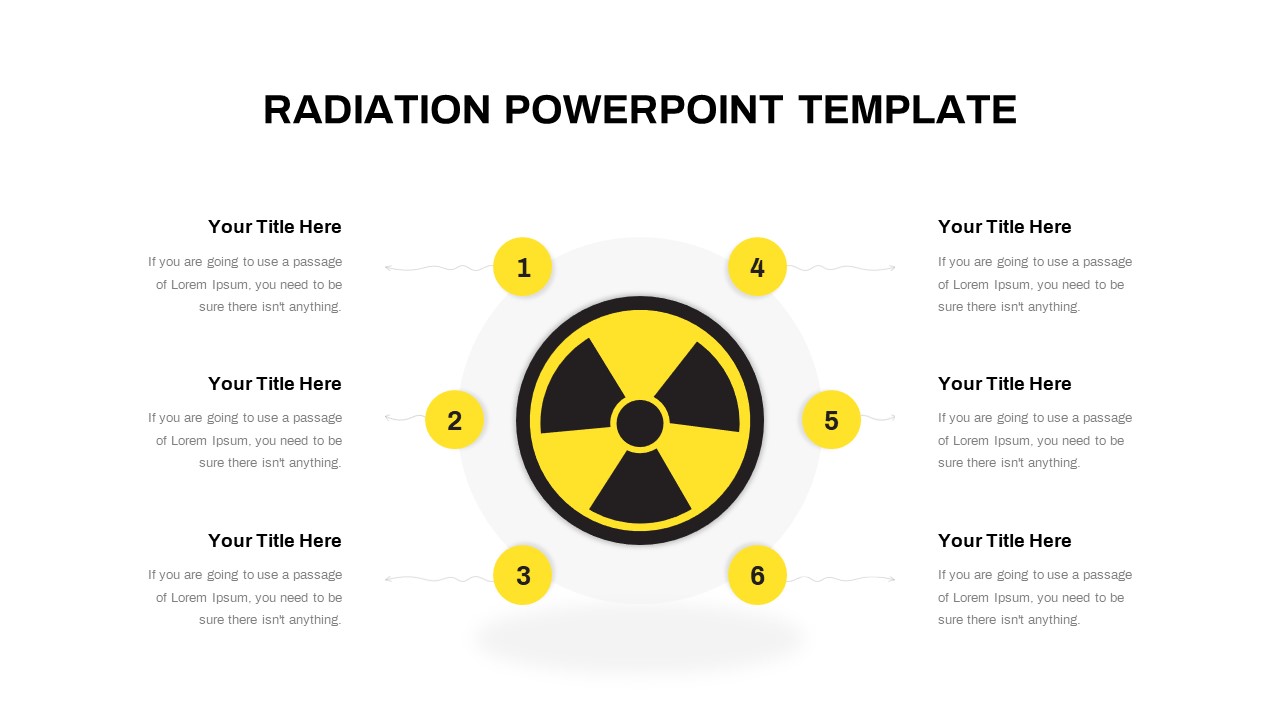
Free Radiation Hub and Spoke Infographic Template for PowerPoint & Google Slides
Circular
Free
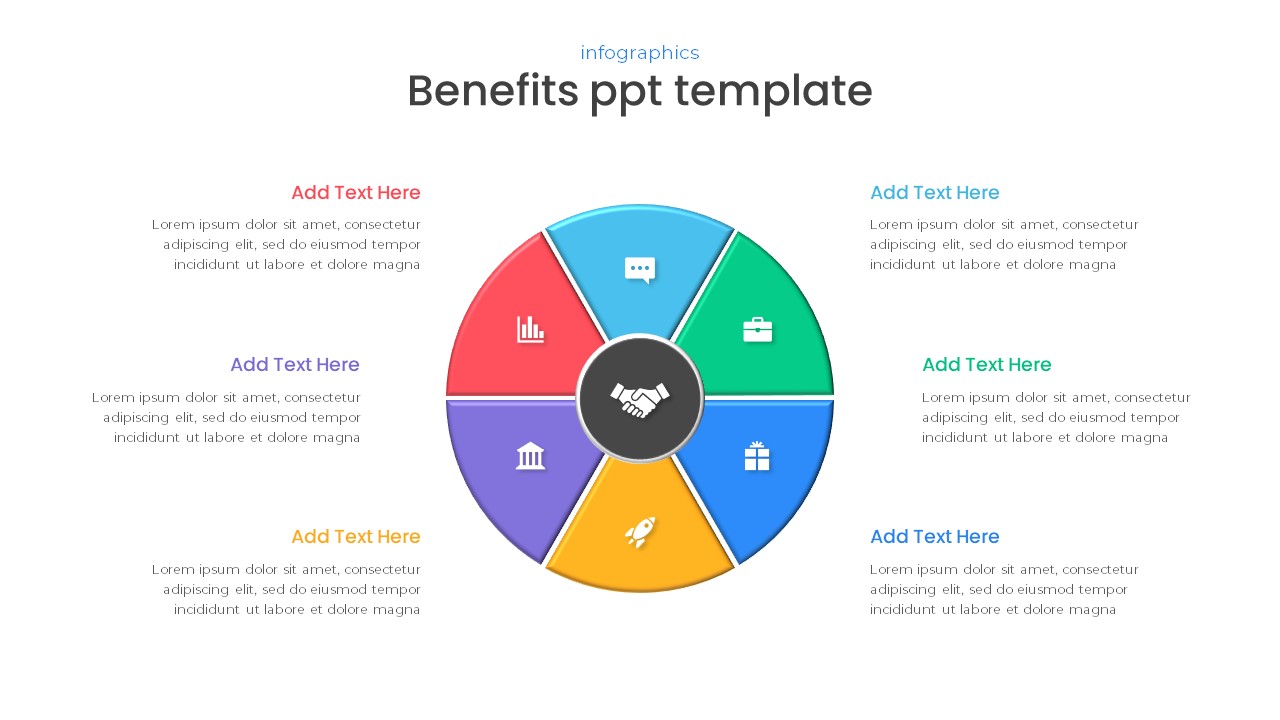
Free Six-Part Hub-and-Spoke Benefits Template for PowerPoint & Google Slides
Circular
Free
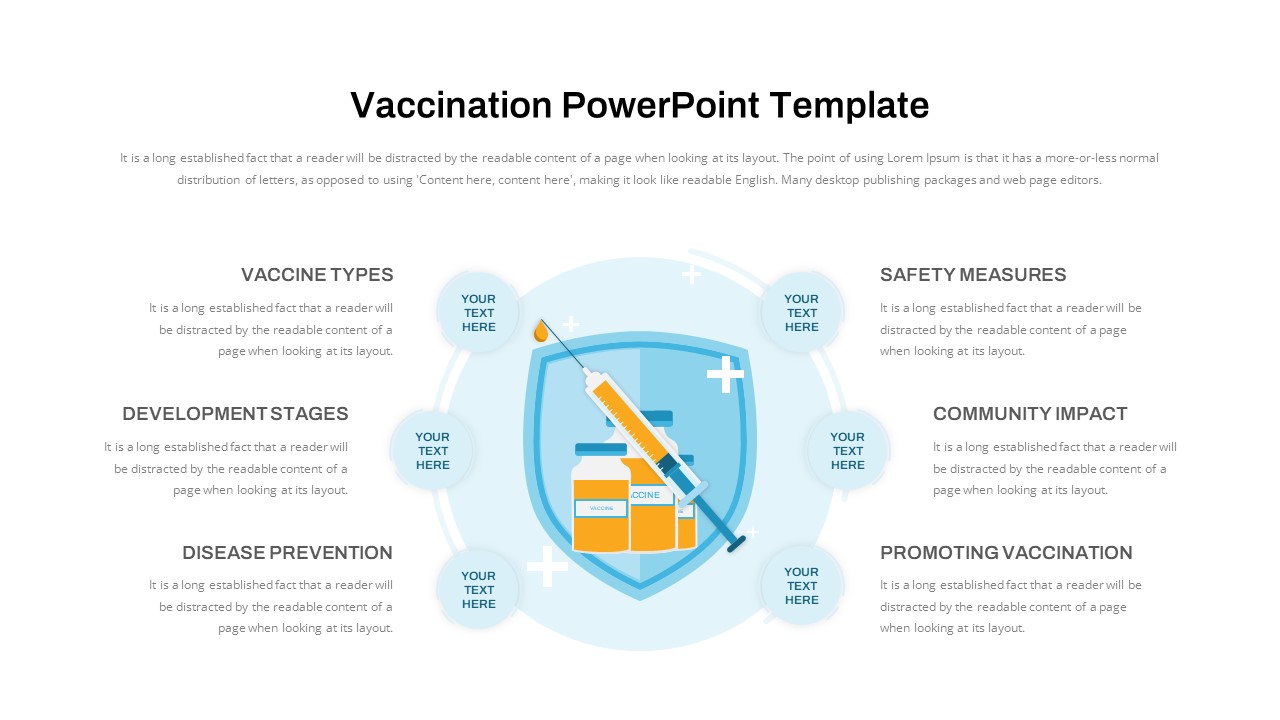
Vaccination Hub-and-Spoke Infographic Template for PowerPoint & Google Slides
Circular
Free Social Media Hub-and-Spoke Infographic Template for PowerPoint & Google Slides
Circular
Free
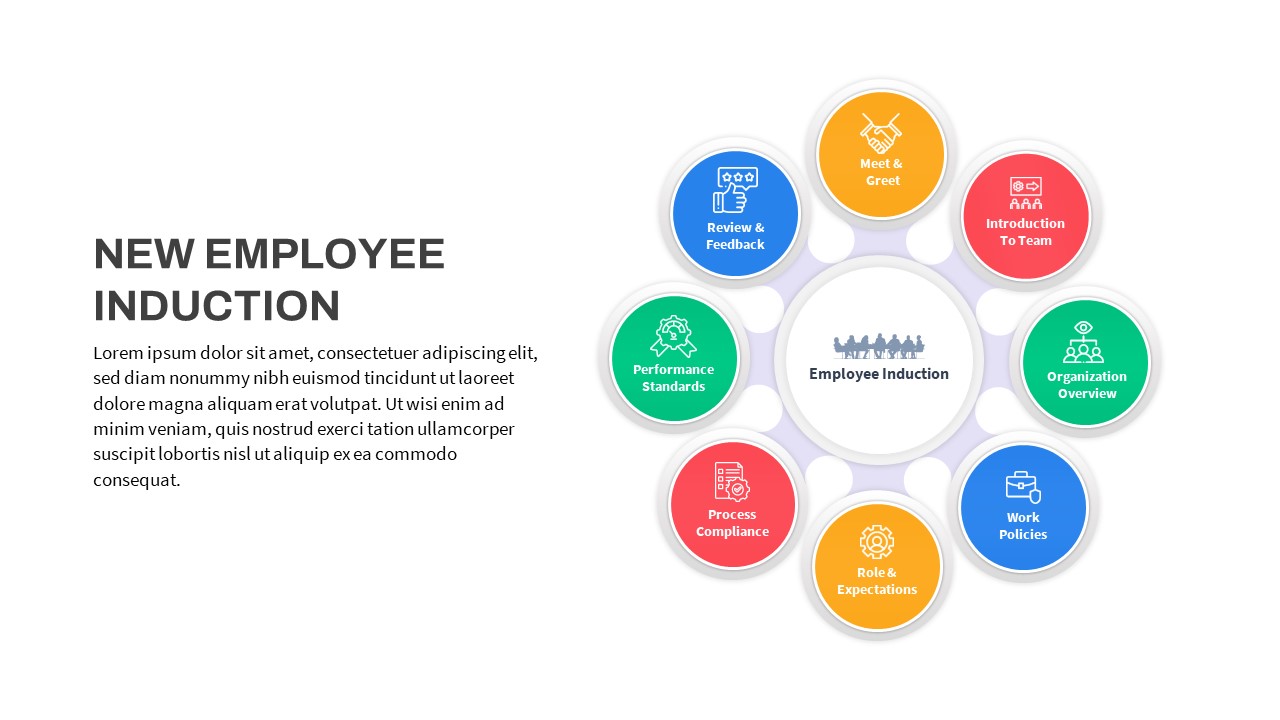
Free New Employee Induction Hub-and-Spoke Template for PowerPoint & Google Slides
Recruitment
Free
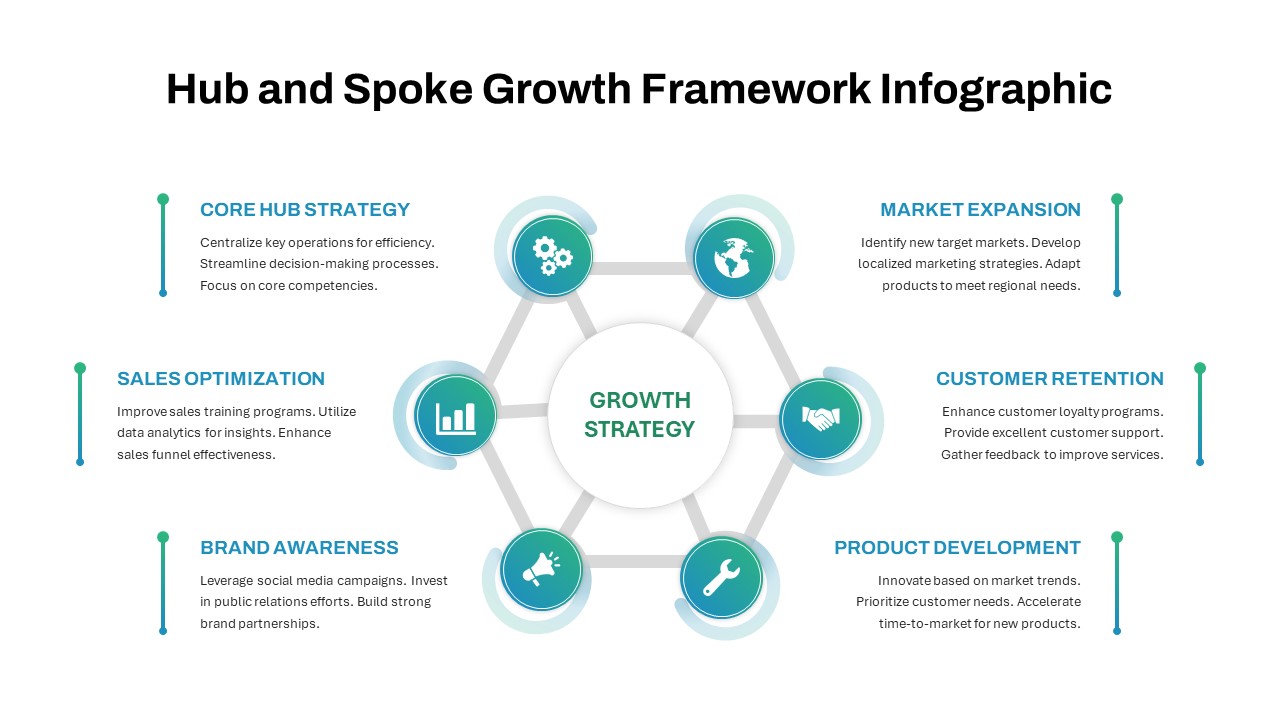
Hub and Spoke Growth Framework Template for PowerPoint & Google Slides
Circular
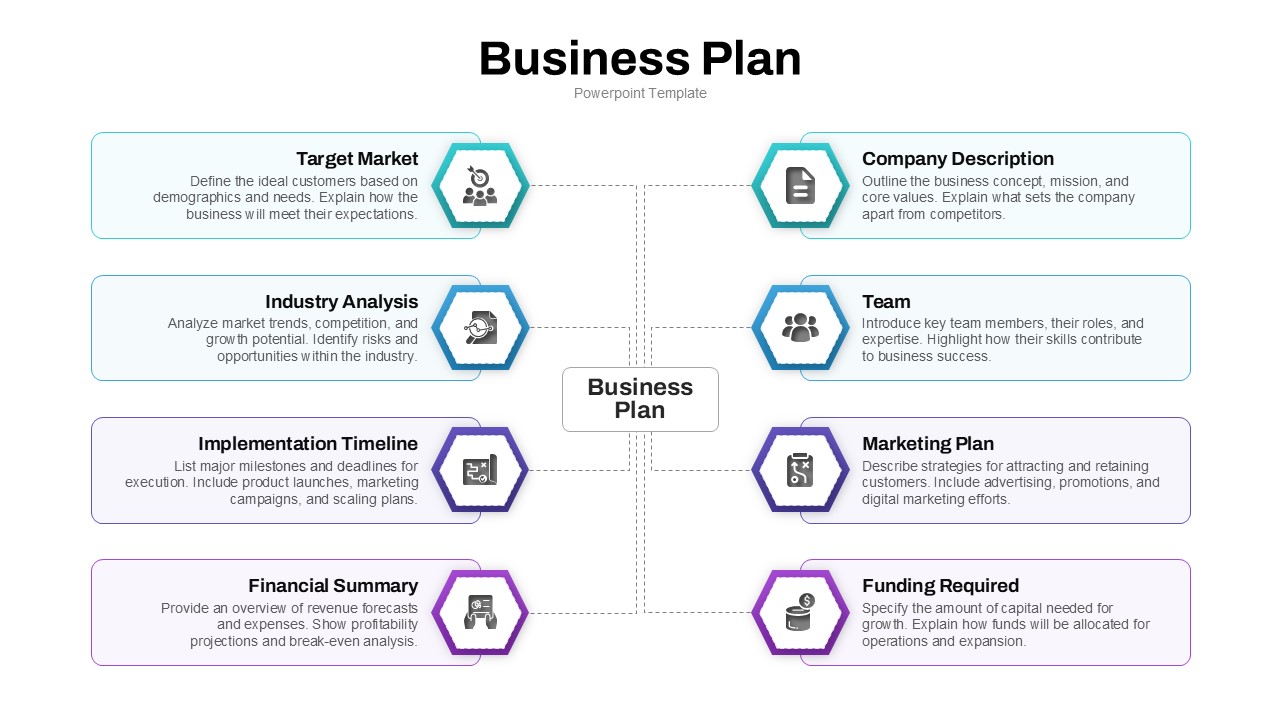
Business Plan Hub-and-Spoke Slide Template for PowerPoint & Google Slides
Business Plan
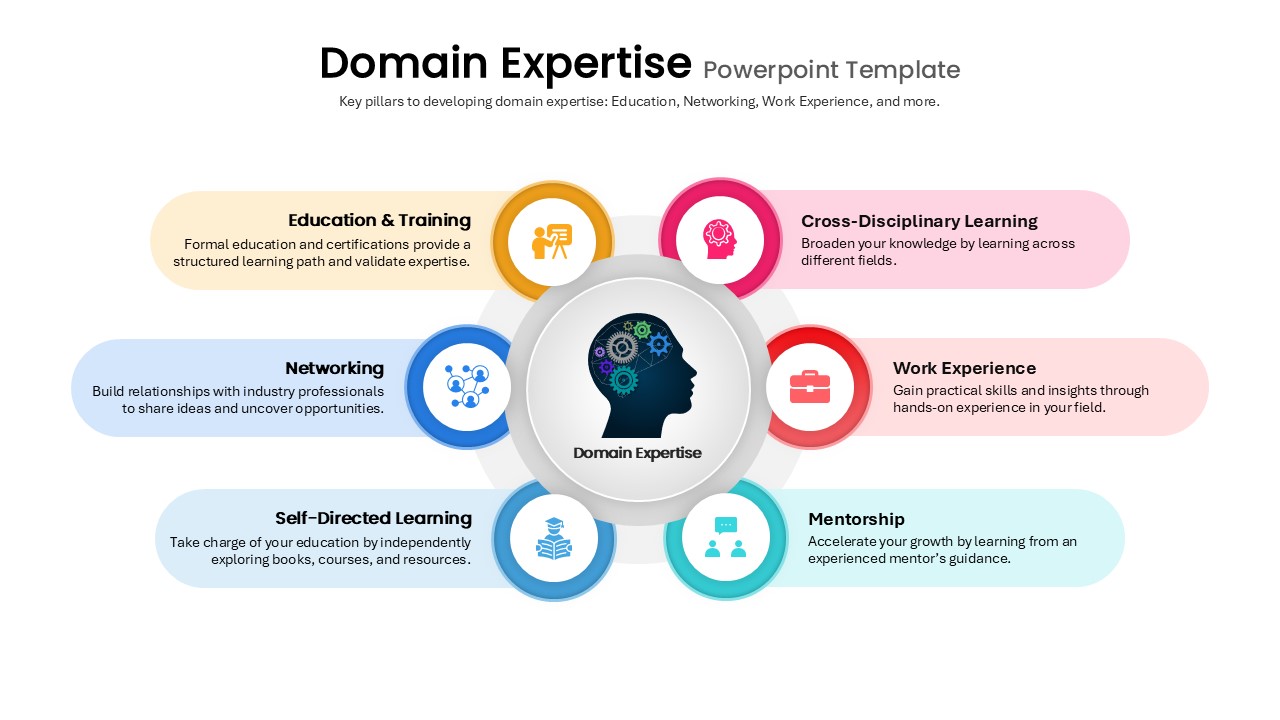
Domain Expertise Pillars Hub-and-Spoke Template for PowerPoint & Google Slides
Circular
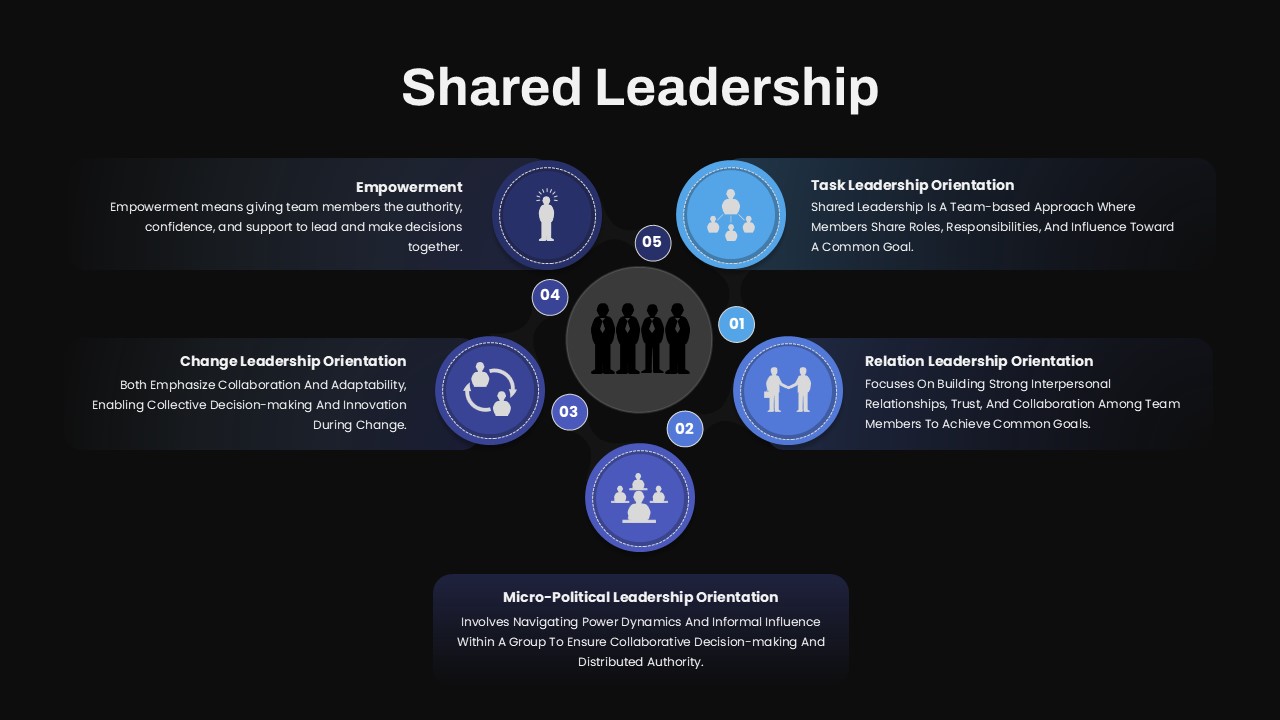
Shared Leadership Hub-and-Spoke Template for PowerPoint & Google Slides
Circular
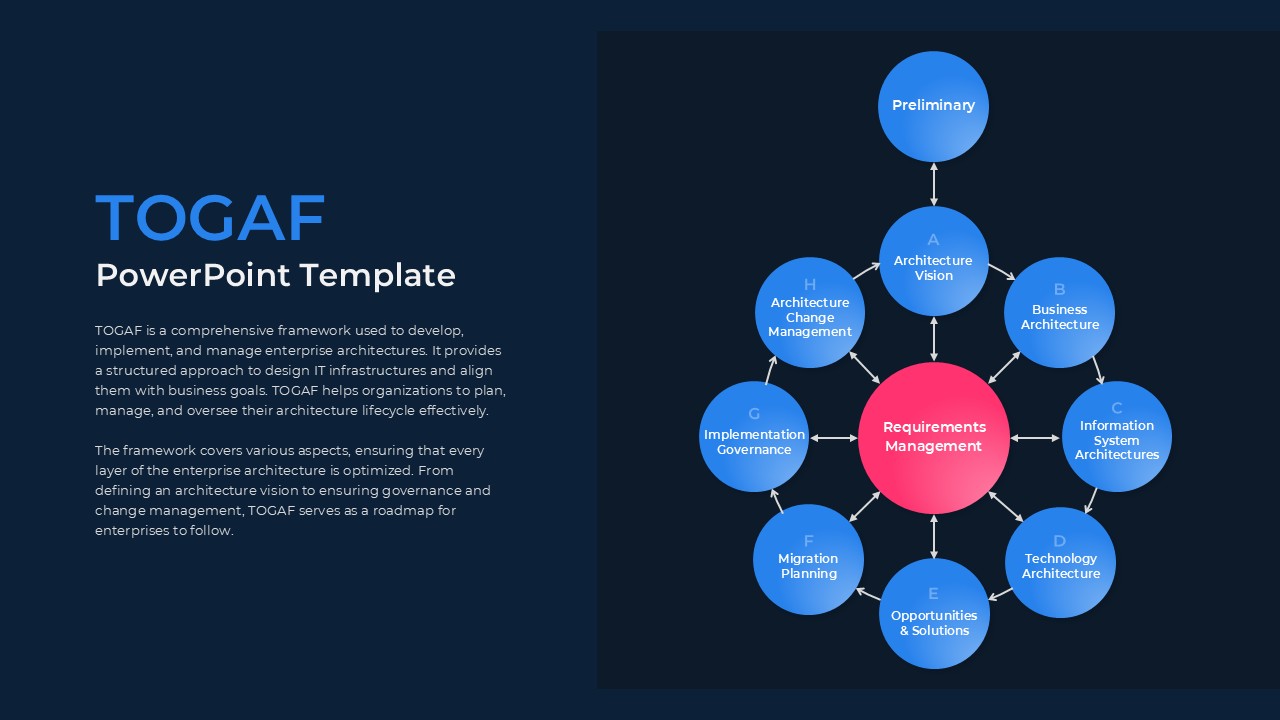
TOGAF Architecture Hub-and-Spoke Template for PowerPoint & Google Slides
Circular
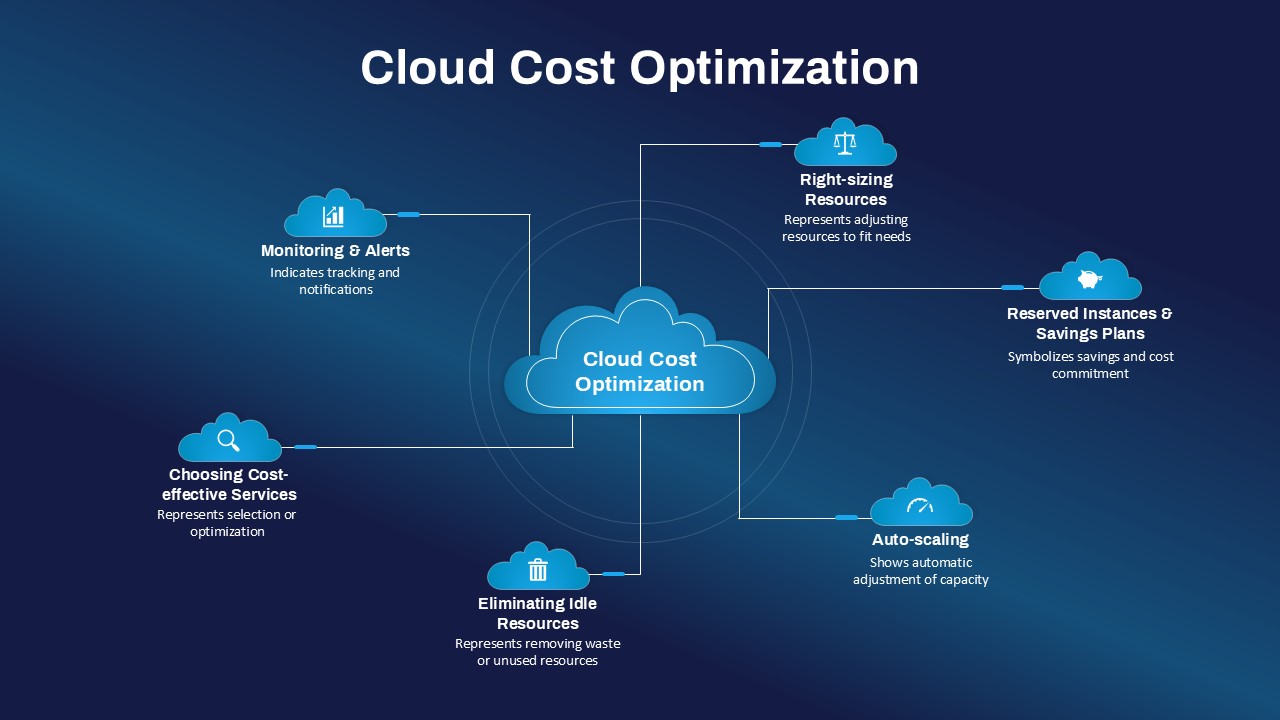
Cloud Cost Optimization Hub-and-Spoke Template for PowerPoint & Google Slides
Cloud Computing
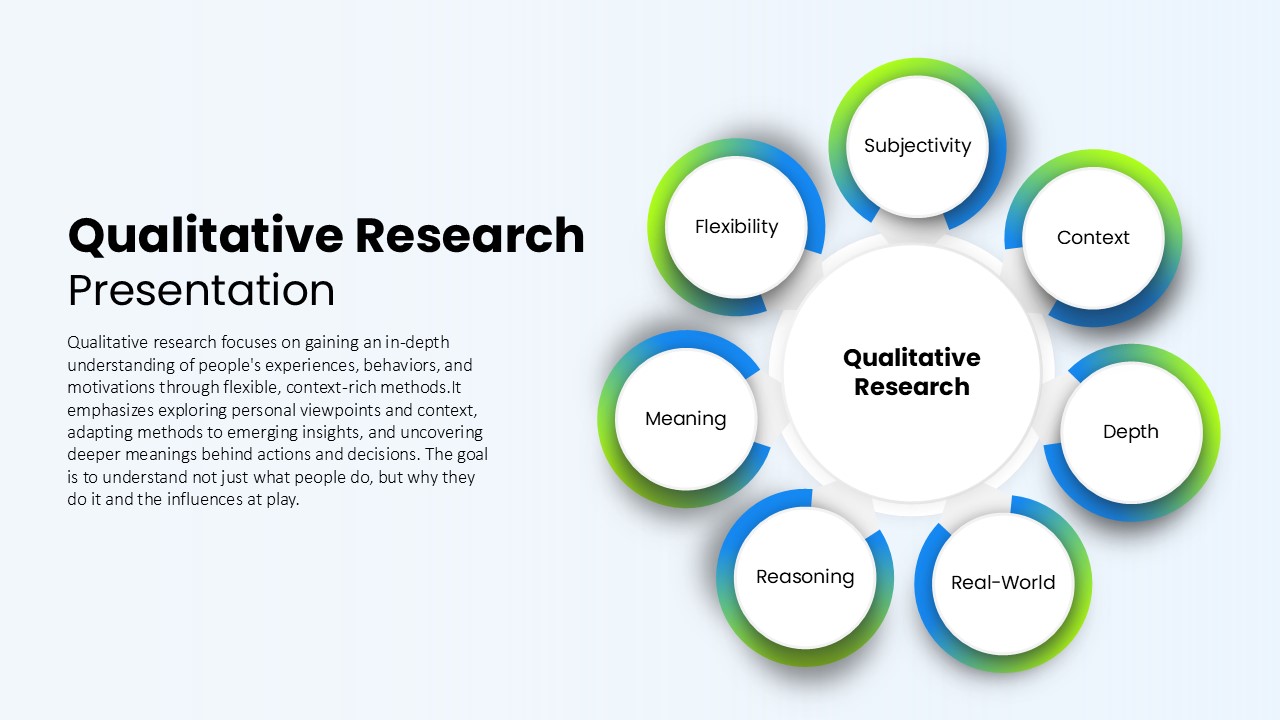
Qualitative Research Hub and Spoke Template for PowerPoint & Google Slides
Circular
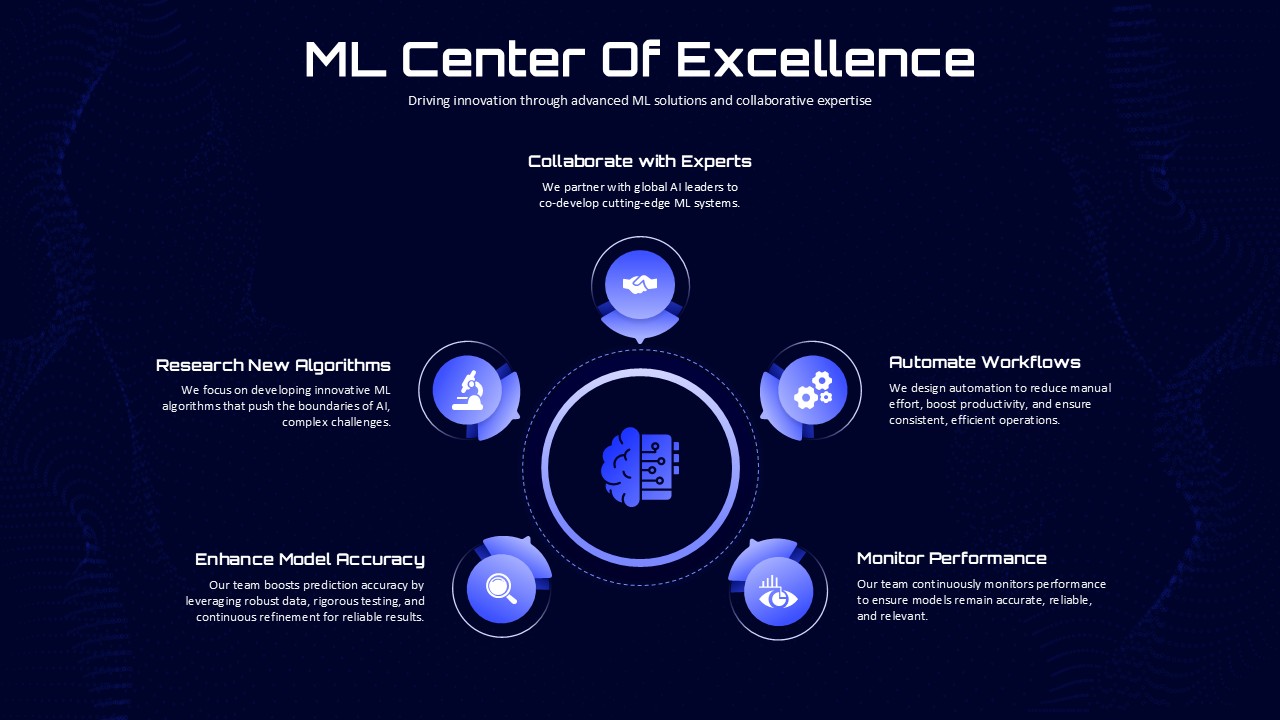
ML Center of Excellence Hub & Spoke Template for PowerPoint & Google Slides
Machine Learning
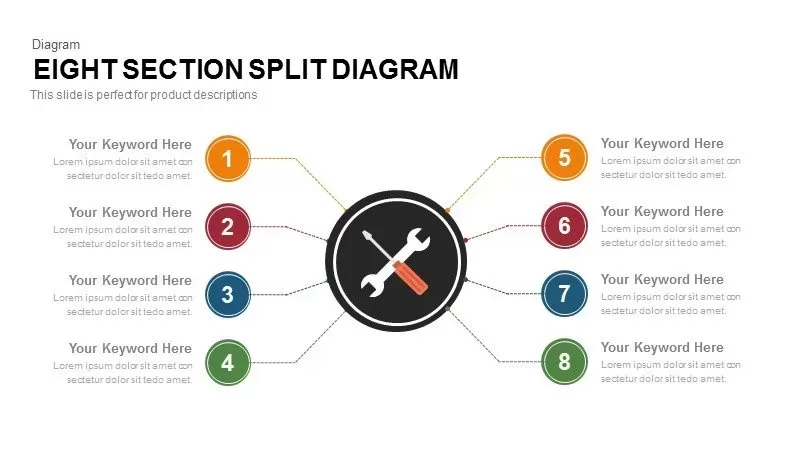
8-Section Split Diagram with Hub Icon template for PowerPoint & Google Slides
Circular
Multi-layout Circle Spoke Diagram Template for PowerPoint & Google Slides
Circular
Dynamic Carousel Icon Hub Diagram Template for PowerPoint & Google Slides
Circular
AI Applications Radial Hub Diagram Template for PowerPoint & Google Slides
Circular
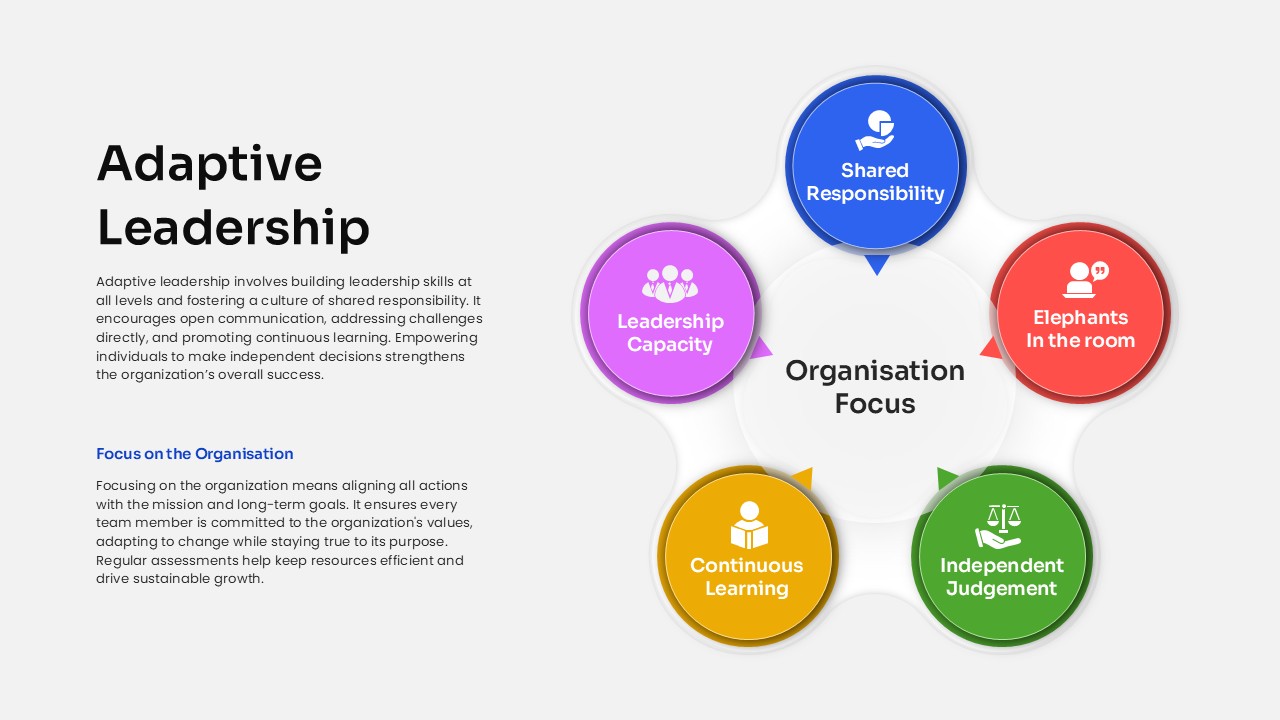
Adaptive Leadership Hub Diagram Template for PowerPoint & Google Slides
Leadership
Social Media Network Hub Diagram Slide for PowerPoint & Google Slides
Process
Six-Segment Circular Hub Infographic Template for PowerPoint & Google Slides
Circular
Marketing Strategy Hub Template for PowerPoint & Google Slides
Digital Marketing
Animated Key Takeaway Spoke Infographic Template for PowerPoint & Google Slides
Infographics
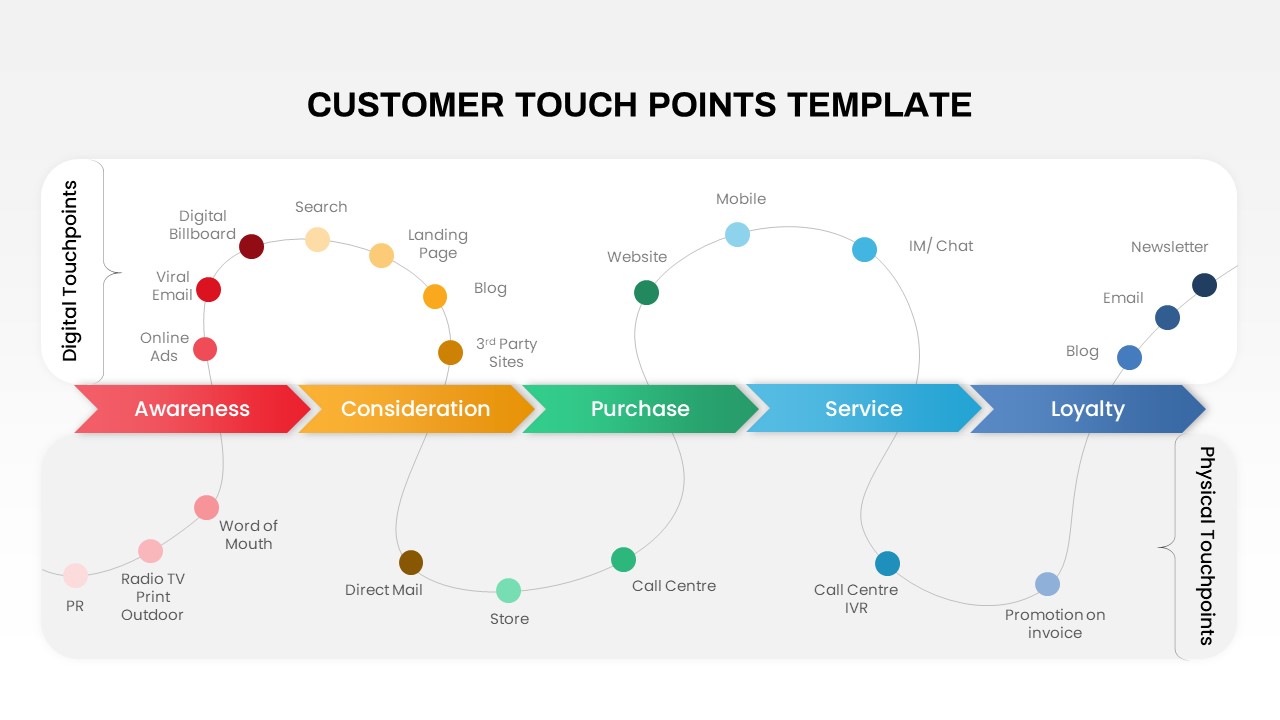
Customer Touchpoints Journey & Hub Template for PowerPoint & Google Slides
Customer Journey
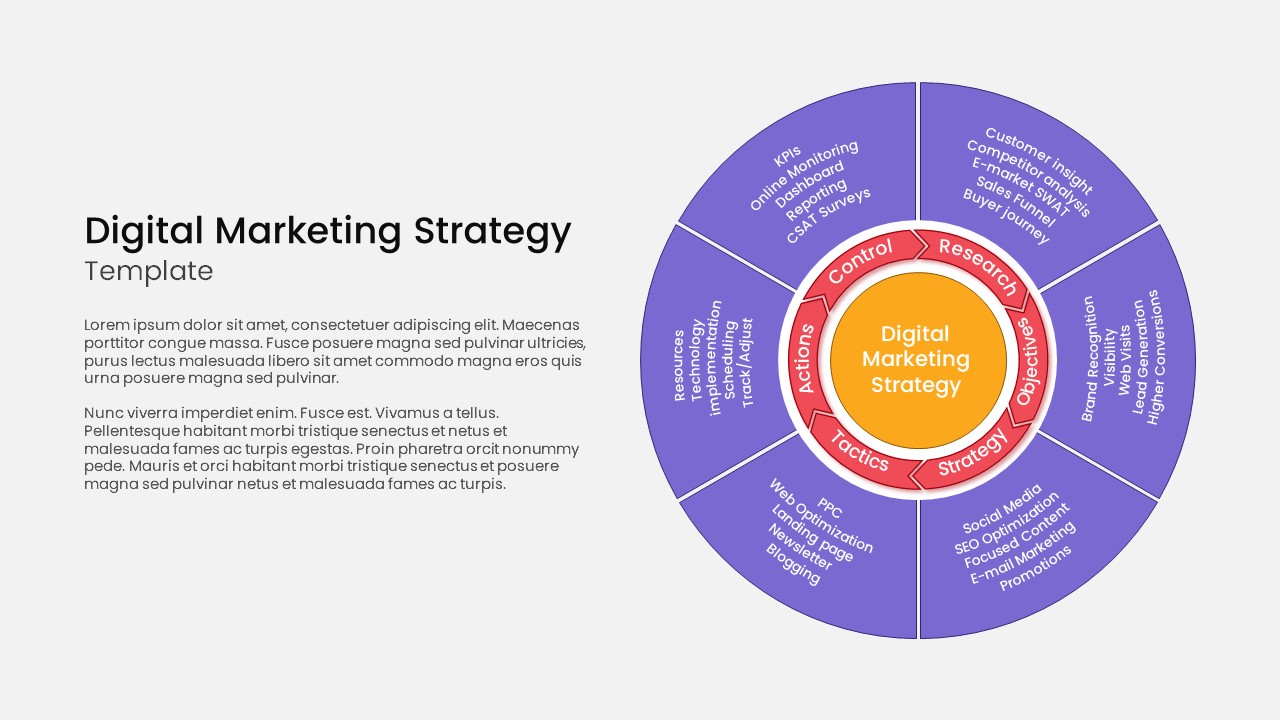
Circular Hub Digital Marketing Strategy Template for PowerPoint & Google Slides
Digital Marketing
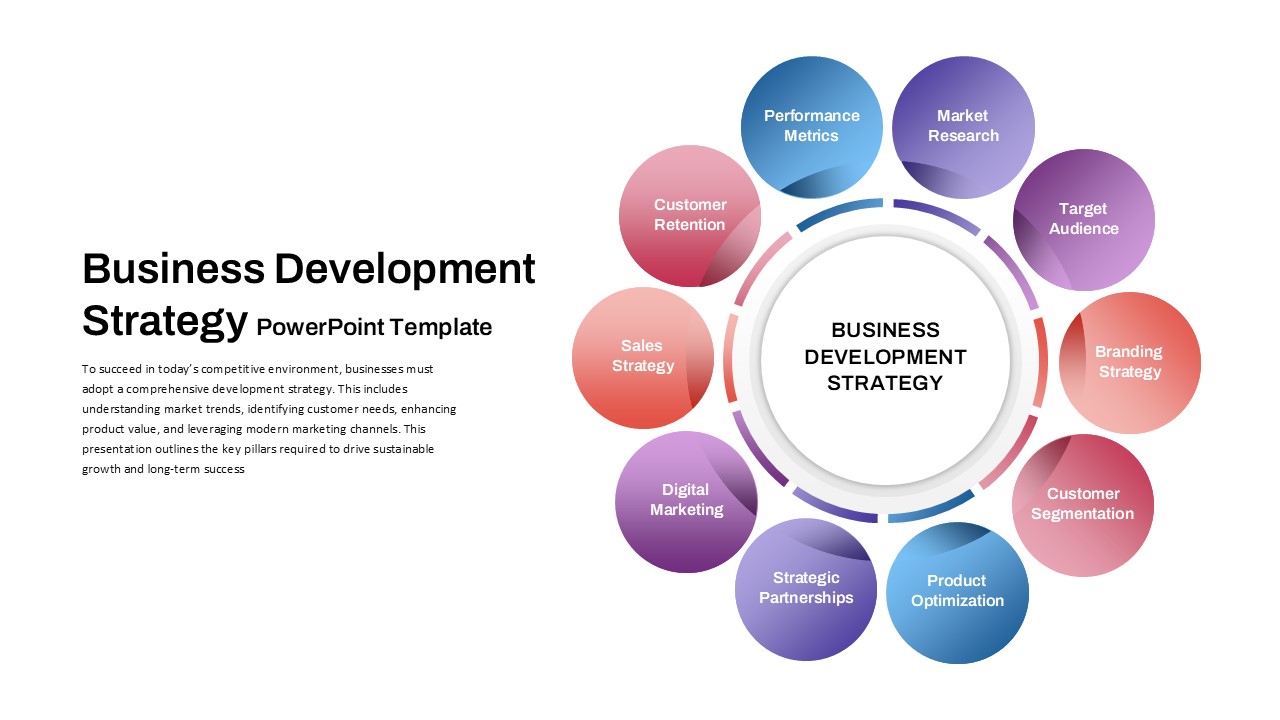
Business Development Strategy Radial Hub Template for PowerPoint & Google Slides
Circular
Snake Diagram Pack of 8 Slides template for PowerPoint & Google Slides
Process
Gear Process Diagram PowerPoint Template for PowerPoint & Google Slides
Process
Sales Process Workflow Funnel Diagram PowerPoint Template for PowerPoint & Google Slides
Funnel
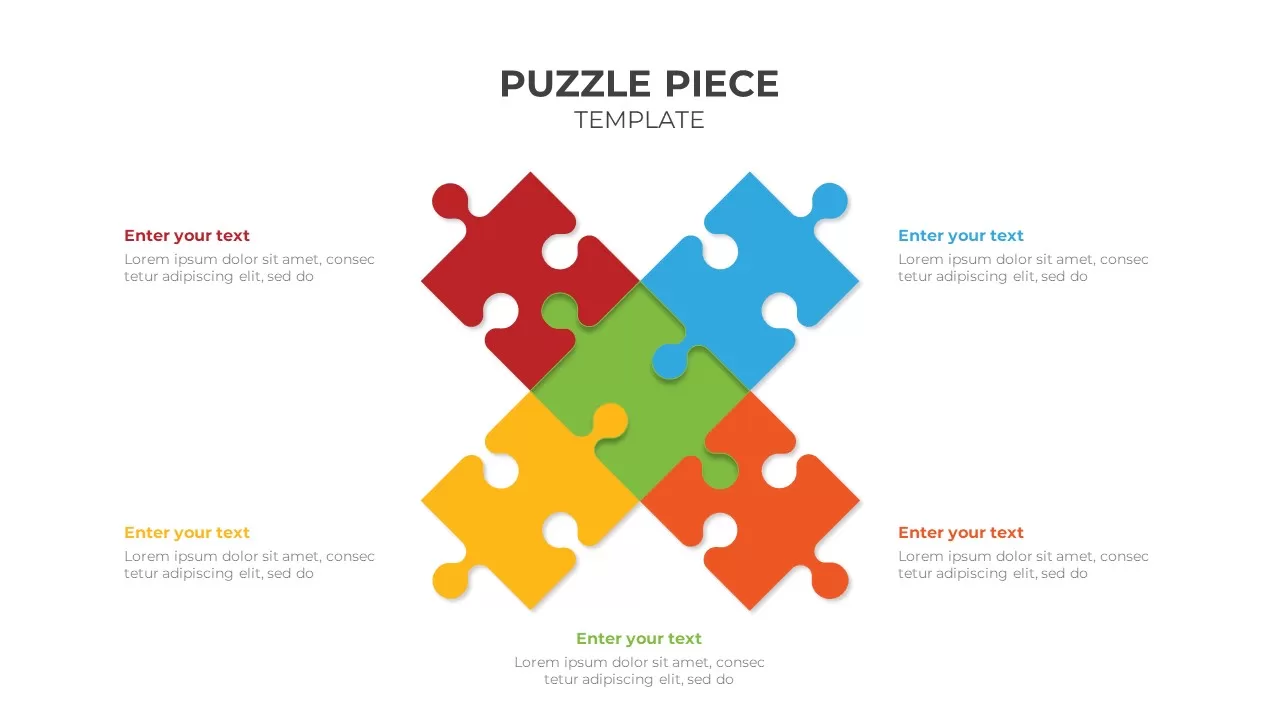
Puzzle Diagram PowerPoint Template for PowerPoint & Google Slides
Process
Transportation Logistics PowerPoint Diagram template for PowerPoint & Google Slides
Process
Emoji Scale PowerPoint Diagram for PowerPoint & Google Slides
Infographics
4 Step Problem Solving PowerPoint Diagram for PowerPoint & Google Slides
Process
3D Four Arrow Infographics Diagram Template for PowerPoint & Google Slides
Arrow
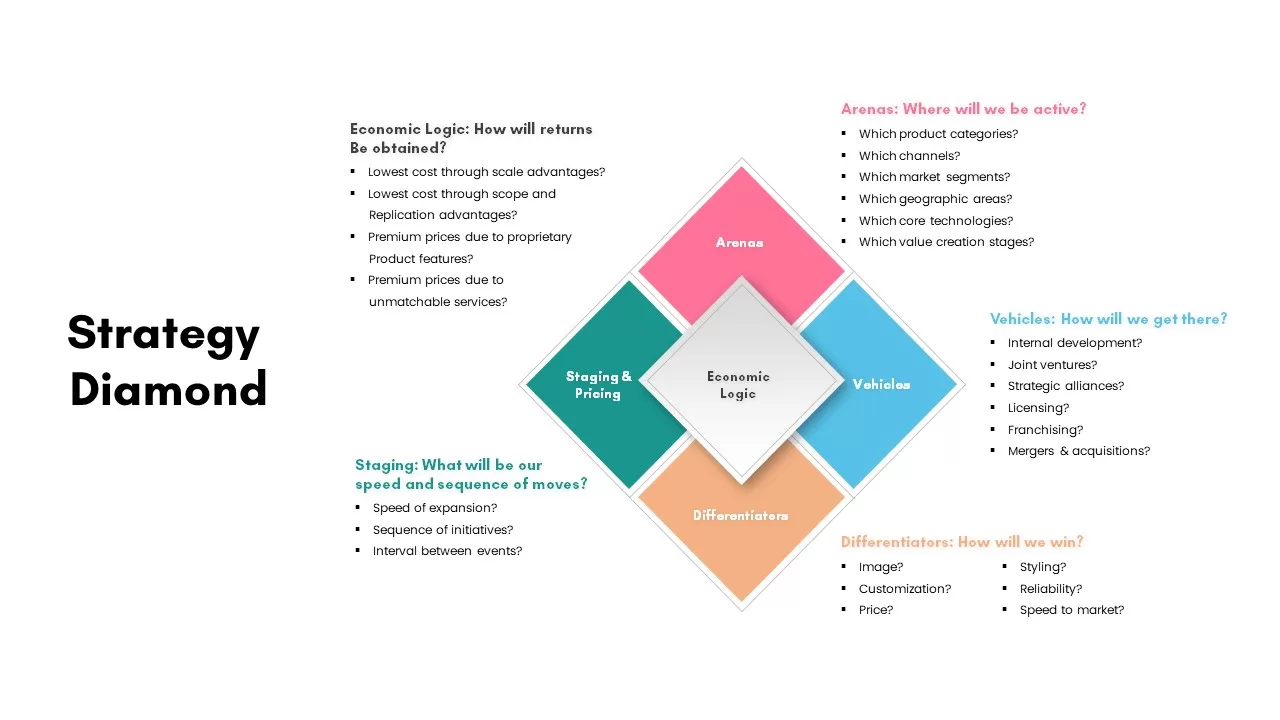
Strategy Diamond Diagram Template for PowerPoint & Google Slides
Competitor Analysis
Six-Piece Puzzle Diagram Template for PowerPoint & Google Slides
Process
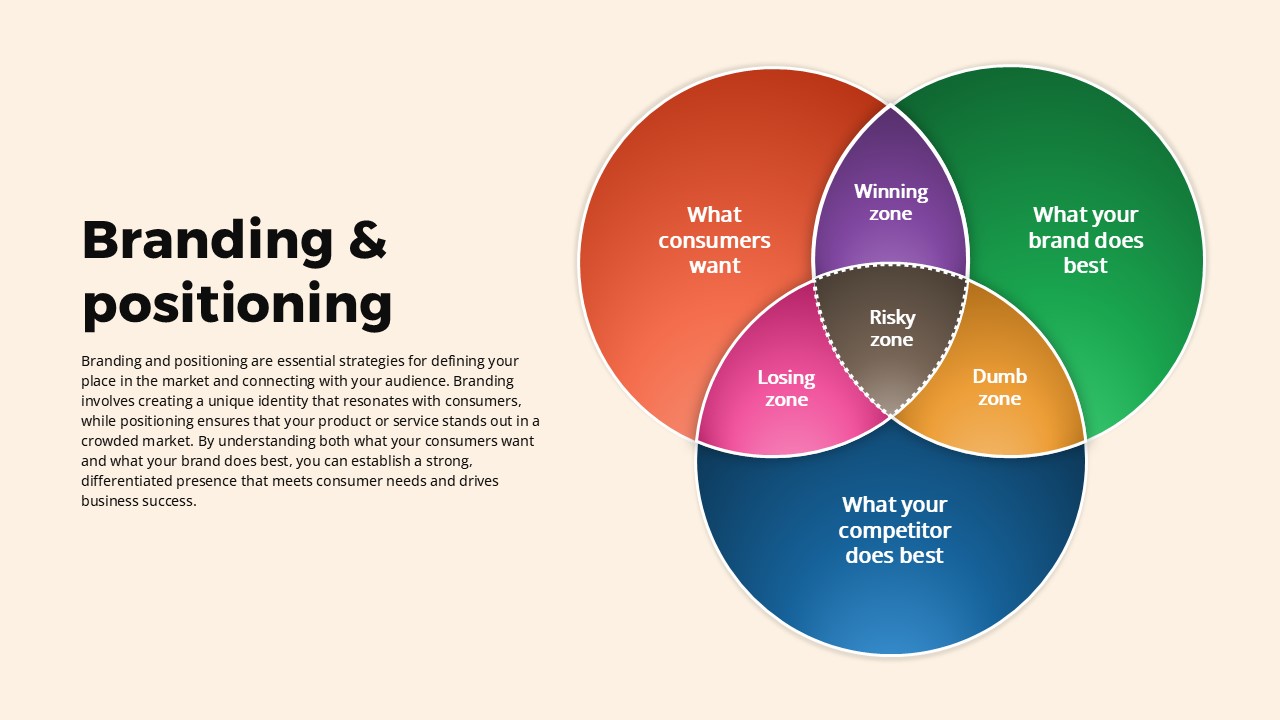
Branding and Positioning Venn Diagram Template for PowerPoint & Google Slides
Comparison
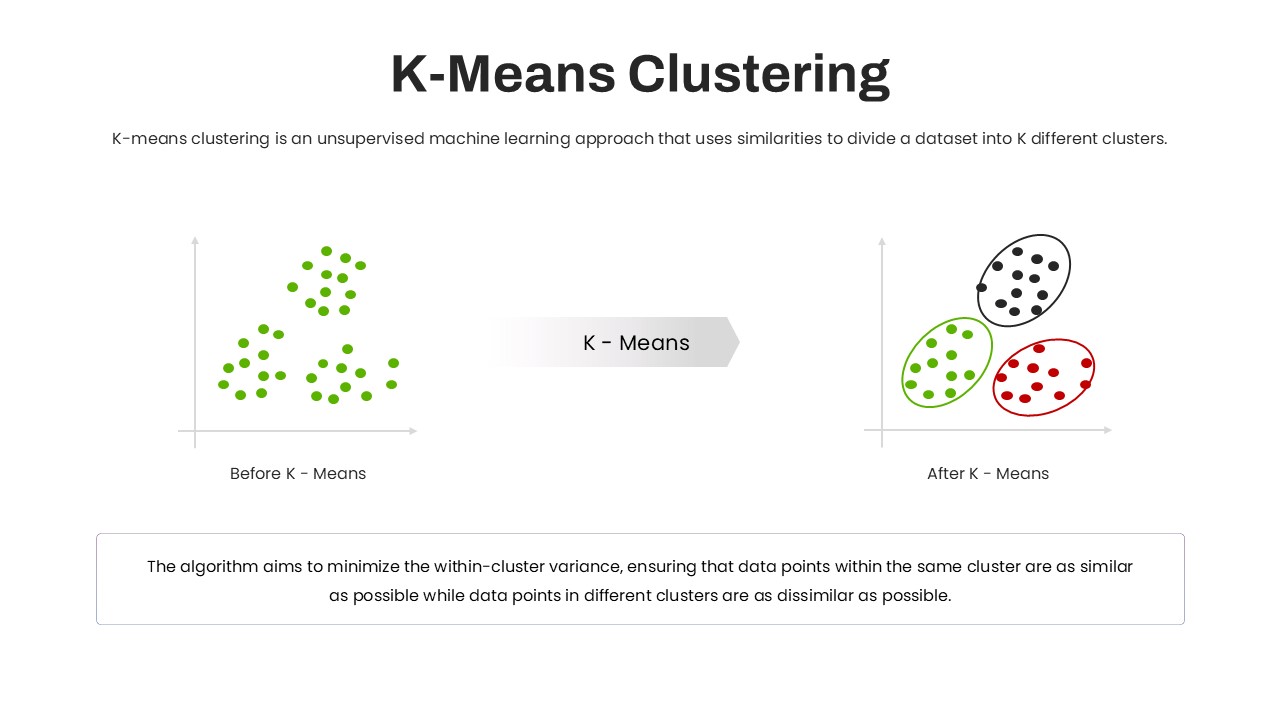
K-Means Clustering Process Diagram Template for PowerPoint & Google Slides
Machine Learning
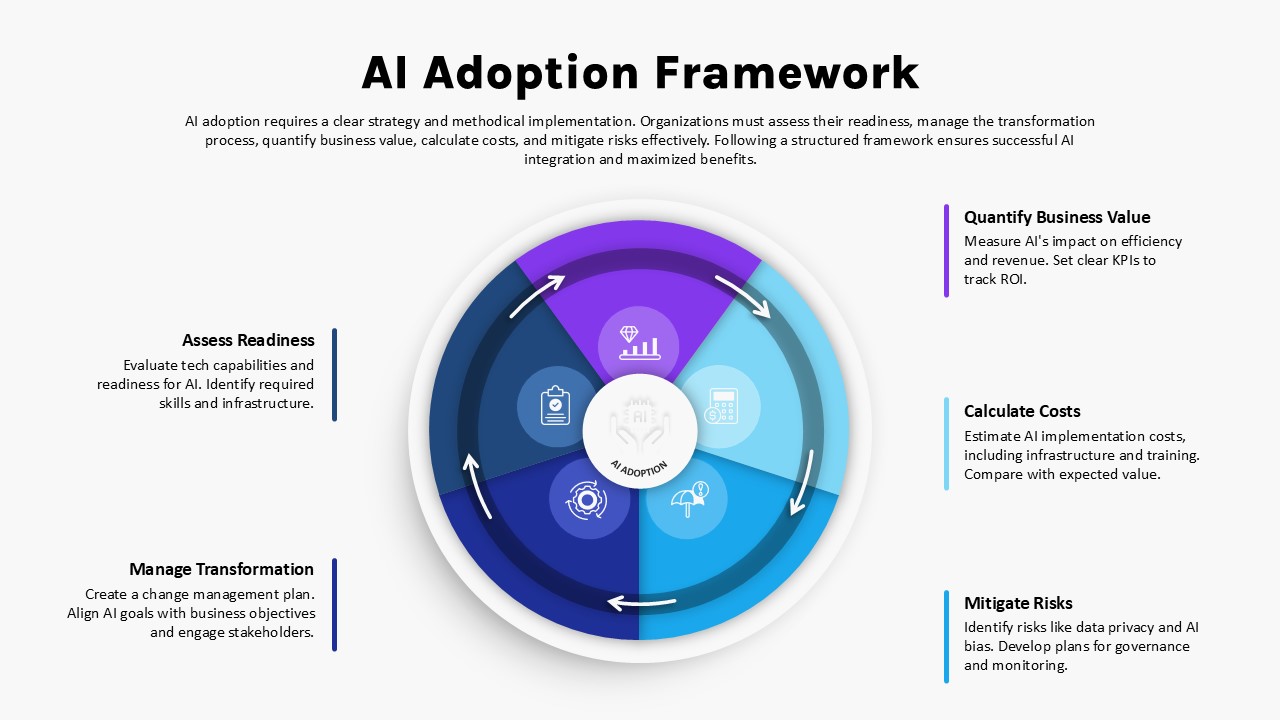
AI Adoption Framework Circular Diagram Template for PowerPoint & Google Slides
AI
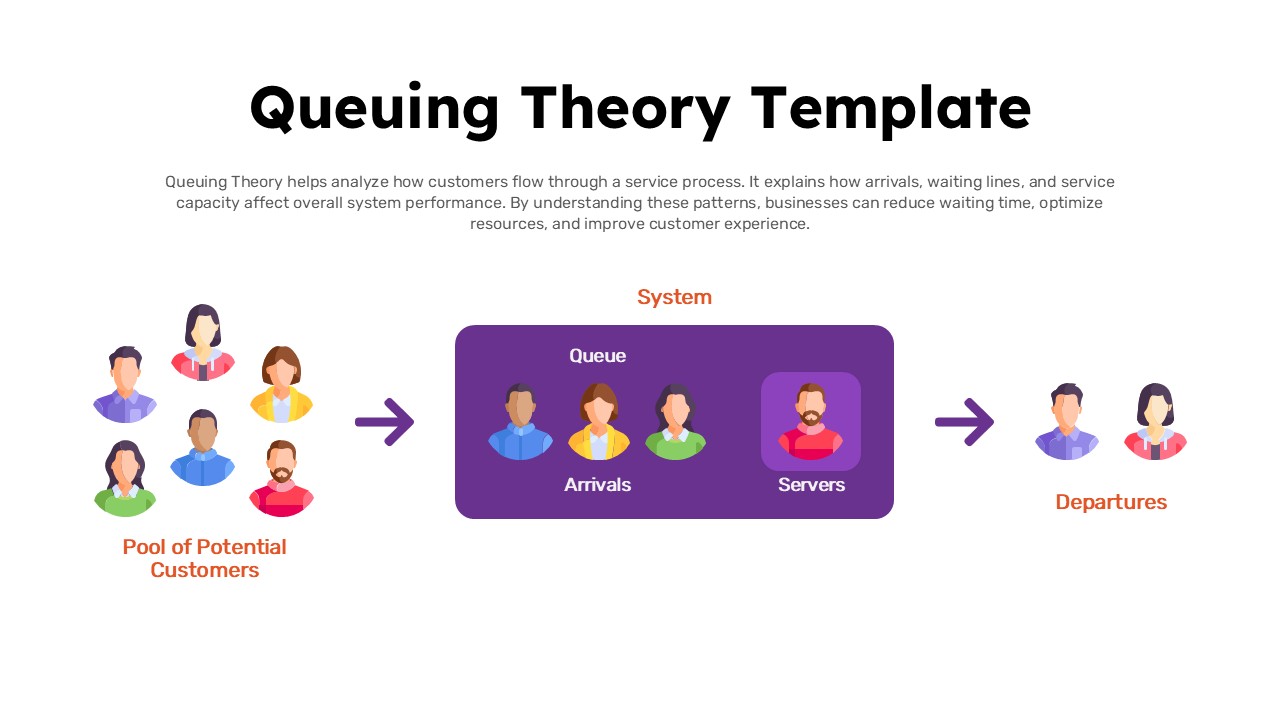
Queuing Theory System Flow Diagram Template for PowerPoint & Google Slides
Process