Editable Six-Level 3D Pyramid Diagram Template for PowerPoint & Google Slides


Description
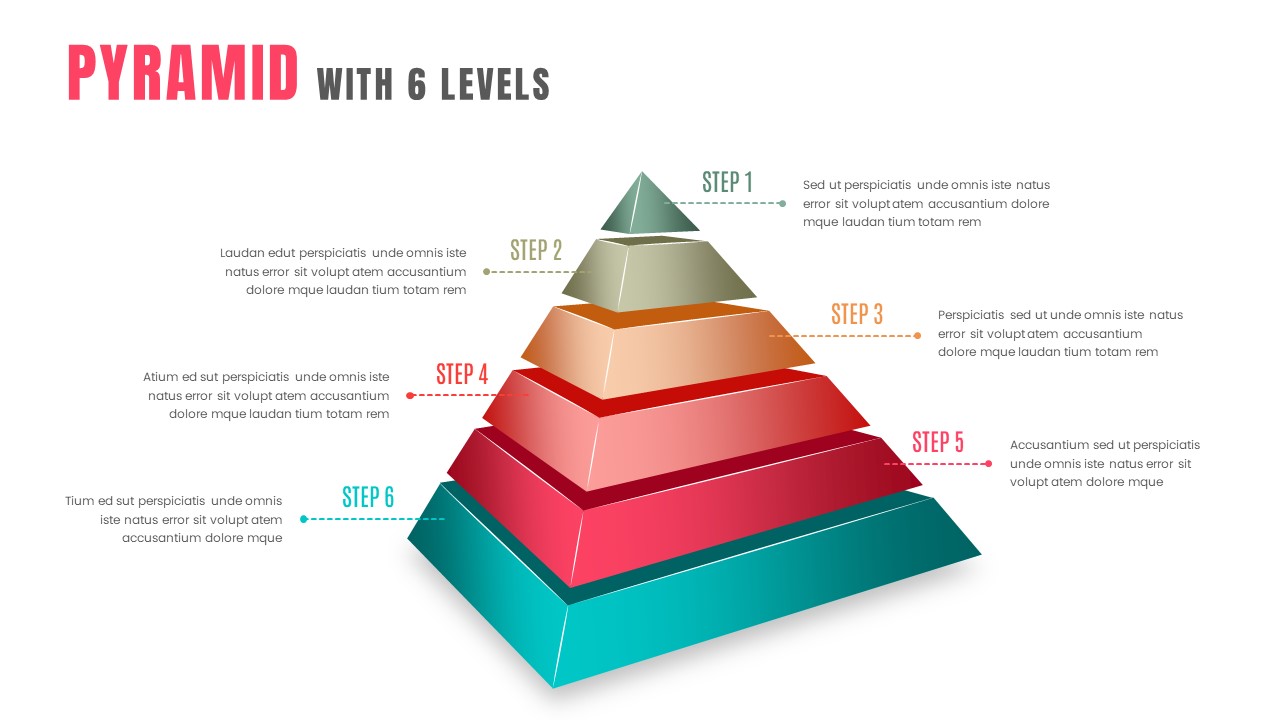
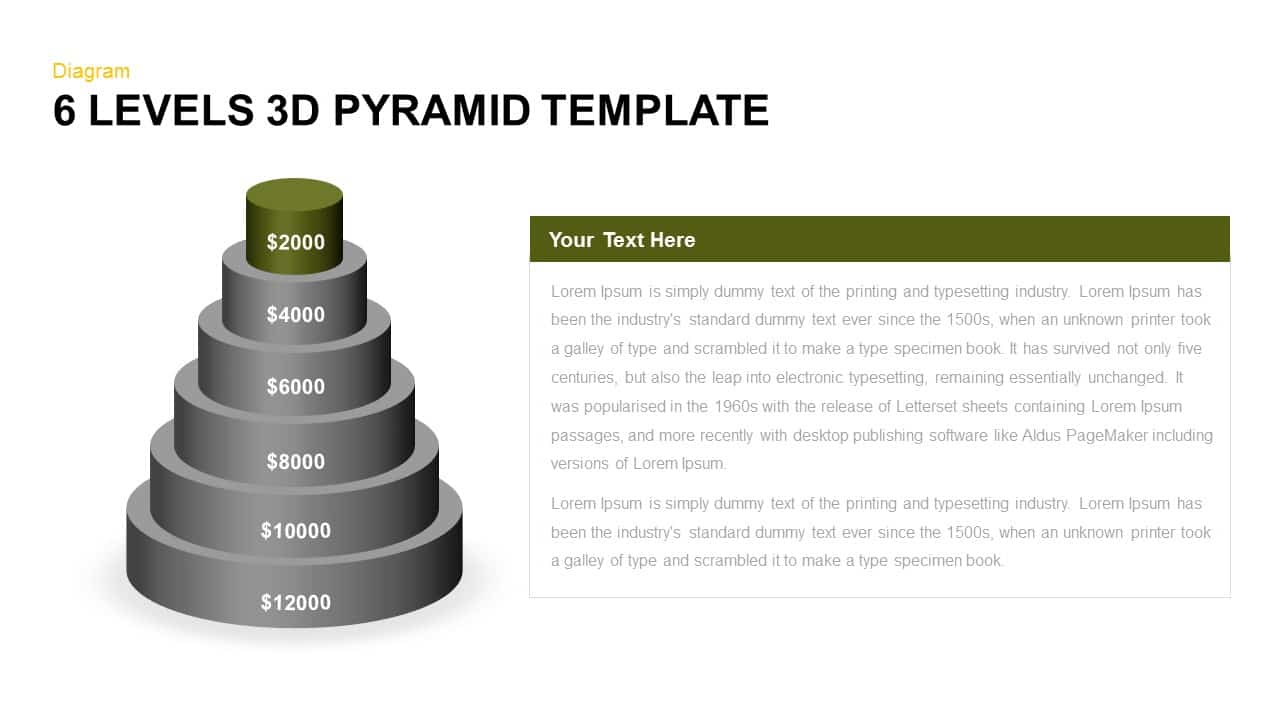
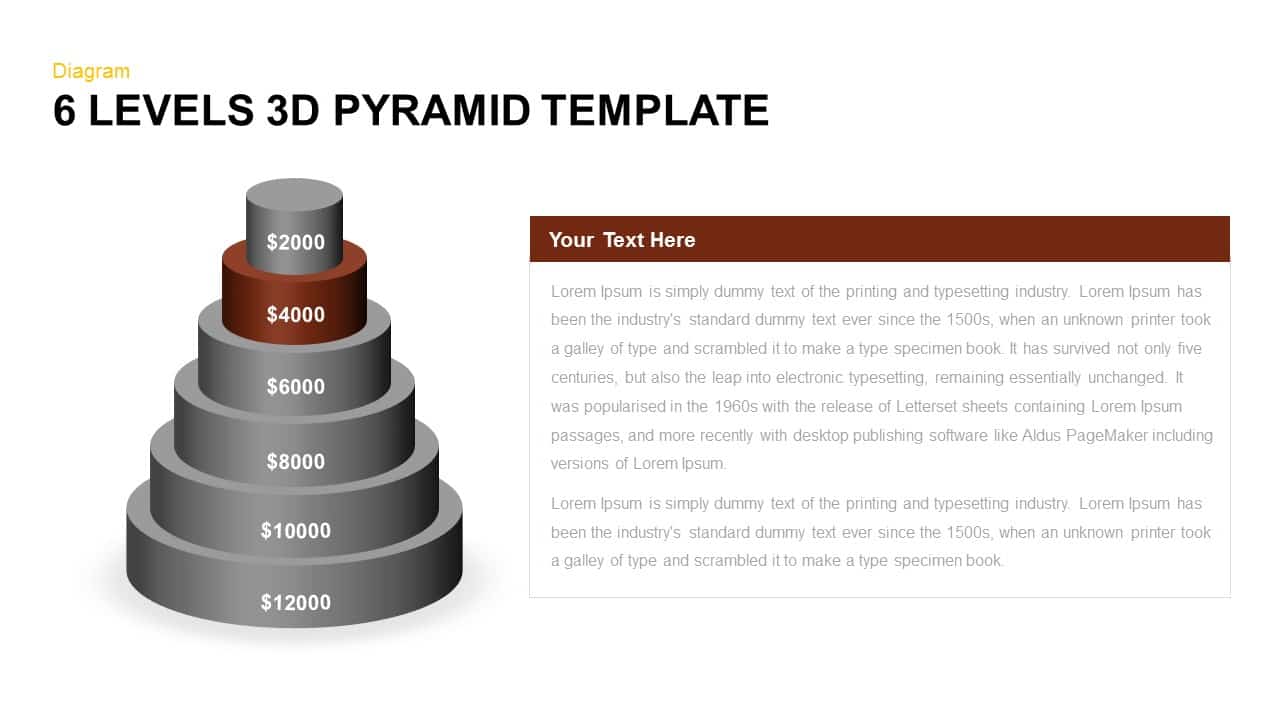
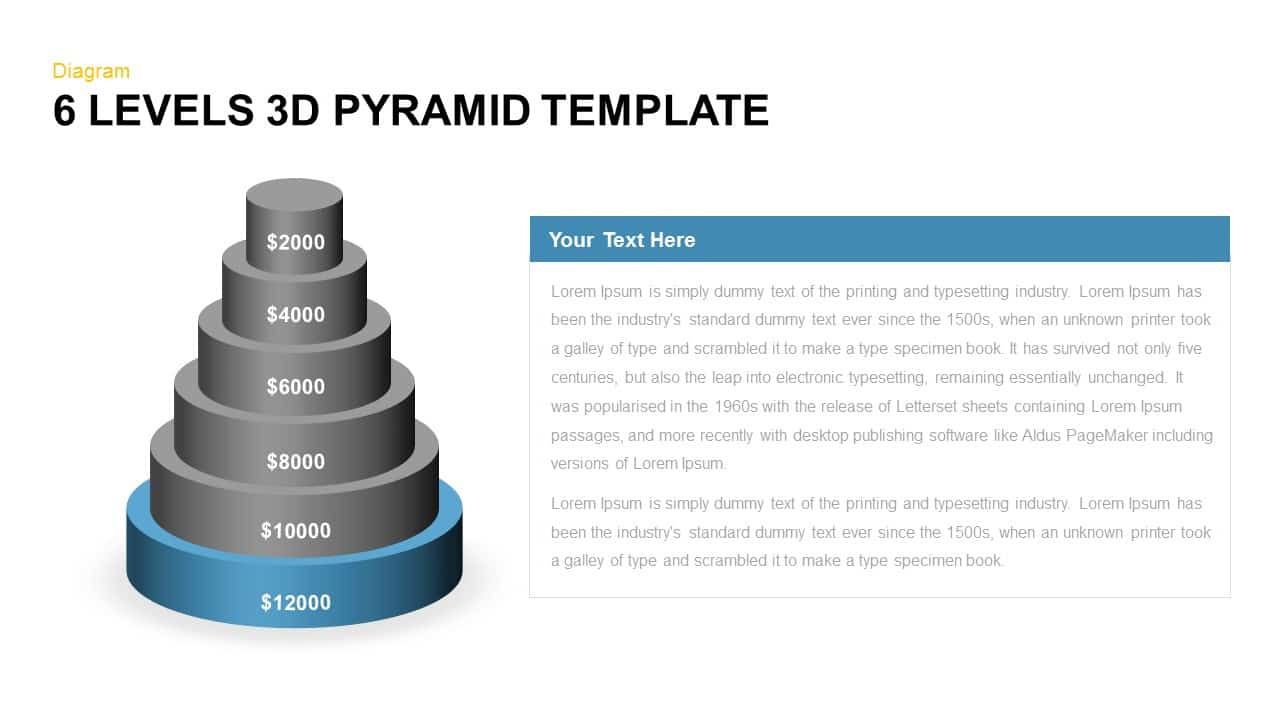
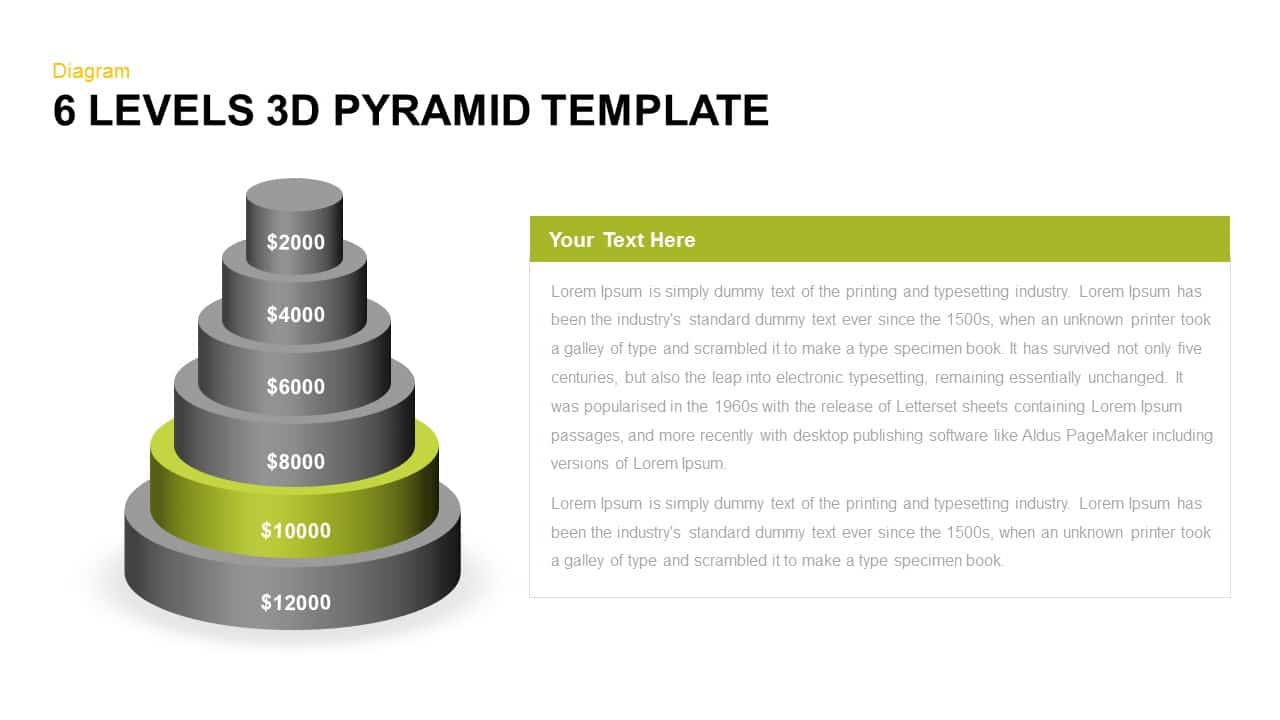
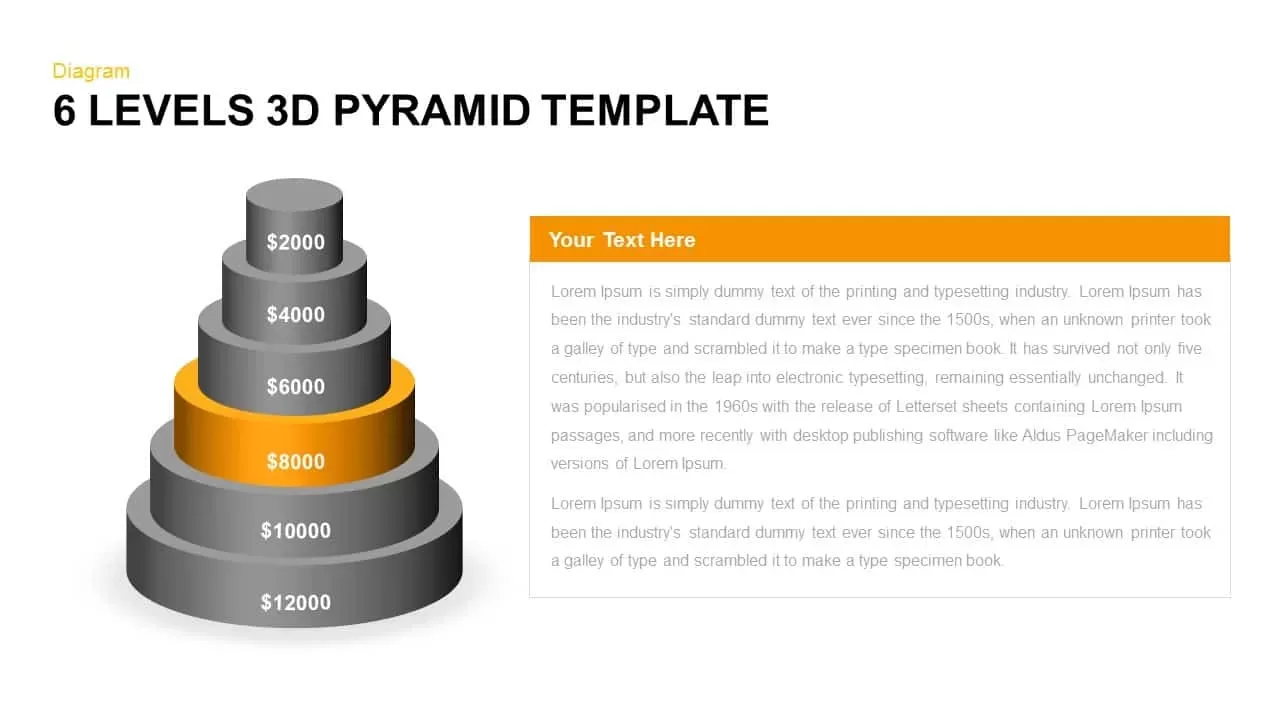
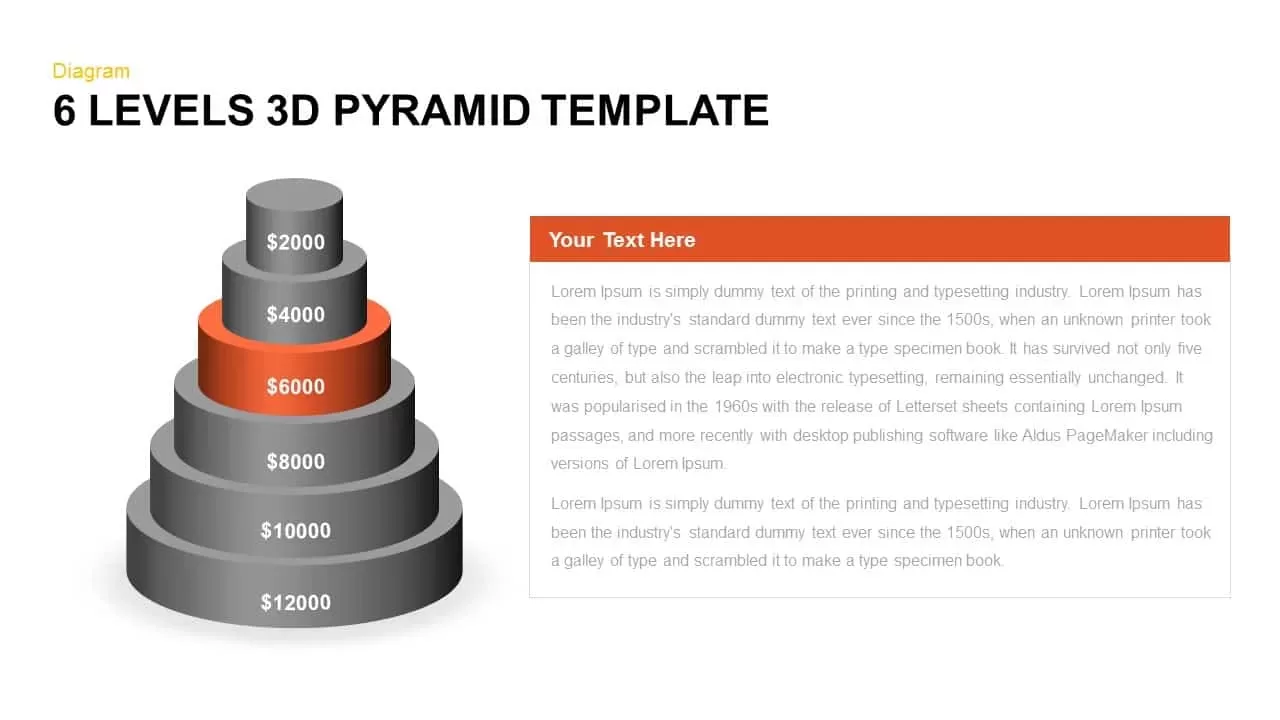
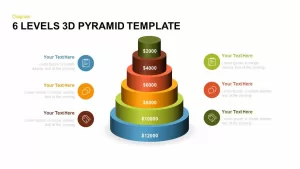
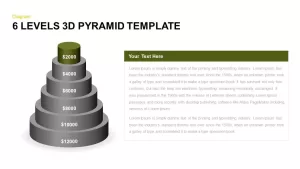
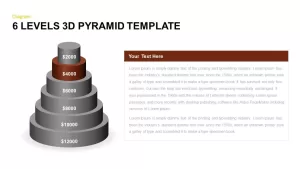
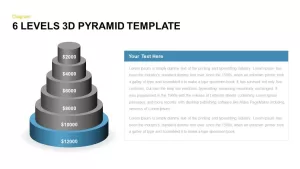
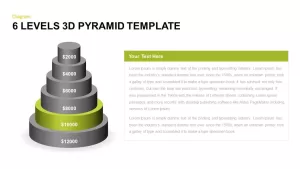
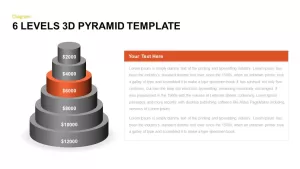
This 6-level 3D pyramid infographic presents a visually engaging hierarchical breakdown of values, metrics, or processes across six concentric tiers. Each ring is rendered as a shaded cylinder in gradient hues—blue, green, yellow, orange, brown, and olive—labeled with numerical values to highlight magnitude or priority. Symmetric icon placeholders flank both sides of the pyramid, pairing each level with a circular icon (note, chat, tag) and text field for concise descriptions. The combination of solid gradient fills and clean outlines creates contrast and depth, guiding the viewer’s eye from the broad base to the focused apex.
Built on fully editable vector shapes and master slides, this template empowers you to swap icons, modify color schemes, adjust values, or resize tiers effortlessly. The neutral white background and simple typography ensure clear readability, while the 3D effect lends a polished professional aesthetic. Compatible with both PowerPoint and Google Slides, the slide retains full resolution across devices and supports rapid theme integration to match corporate or startup branding guidelines.
Beyond standard hierarchies, leverage this asset to illustrate revenue funnels, cost breakdowns, customer segmentation stages, risk levels, or product tier structures. Duplicate pyramid tiers, reorder segments, or repurpose icon placeholders to suit varied contexts—transforming a static diagram into a multipurpose tool for executive reports, marketing reviews, financial analyses, training modules, and more. With this 6-level 3D pyramid slide, you can present complex layered information with clarity and impact, driving strategic insights and stakeholder alignment. Customizable text fields enable you to add titles, descriptions, or key performance indicators directly beside each level, ensuring stakeholders grasp each segment’s purpose at a glance.
Who is it for
Business analysts, financial managers, marketing teams, and project managers will benefit from this slide to visualize tiered data, showcase breakdowns, and align stakeholders. Executives and consultants can harness its depth to simplify complex insights.
Other Uses
Repurpose this diagram for revenue reporting, cost structure overviews, customer journey mapping, product tier comparisons, risk assessment charts, or training outlines. Use the 3D pyramid to highlight priority levels, performance indicators, or milestone progress across diverse contexts.
Login to download this file

Item ID
SB00636
Related Templates

3D Six-Level Pyramid Diagram Infographic Template for PowerPoint & Google Slides
Pyramid
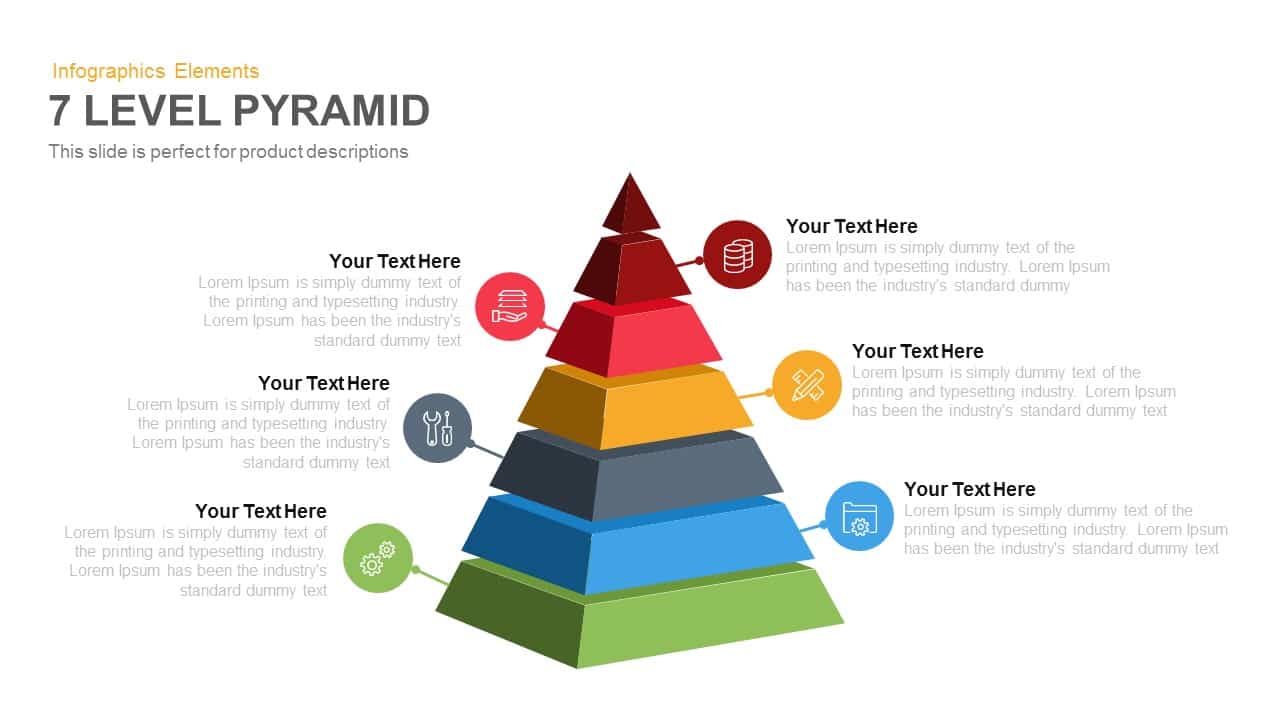
7-Level 3D Pyramid Infographic Diagram Template for PowerPoint & Google Slides
Pyramid

Four-Level Business Pyramid Diagram Template for PowerPoint & Google Slides
Pyramid
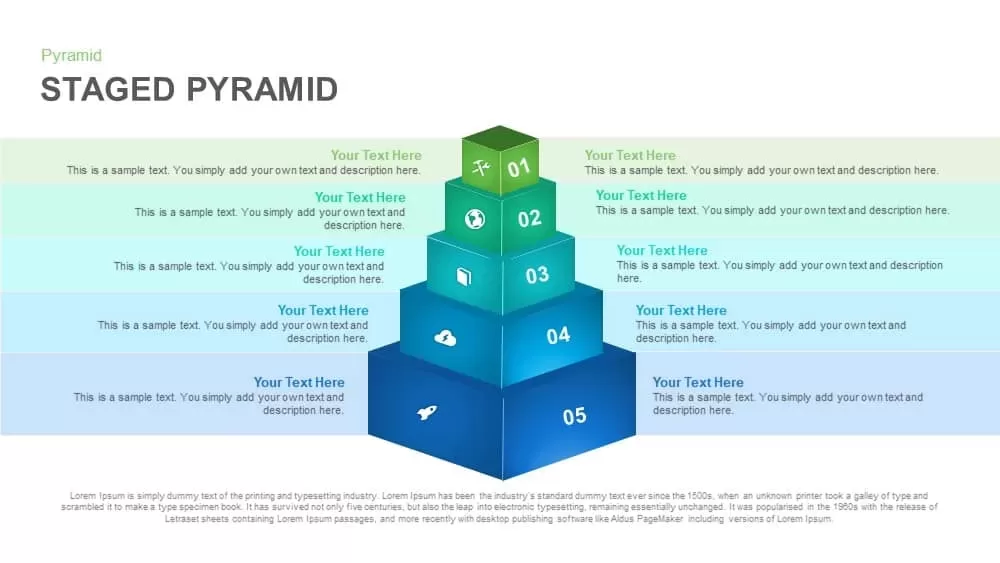
Five-Level Staged Pyramid Diagram Template for PowerPoint & Google Slides
Pyramid
Four-Level Colorful Pyramid Diagram Template for PowerPoint & Google Slides
Pyramid
Modern Four-Level Pyramid Diagram Template for PowerPoint & Google Slides
Pyramid
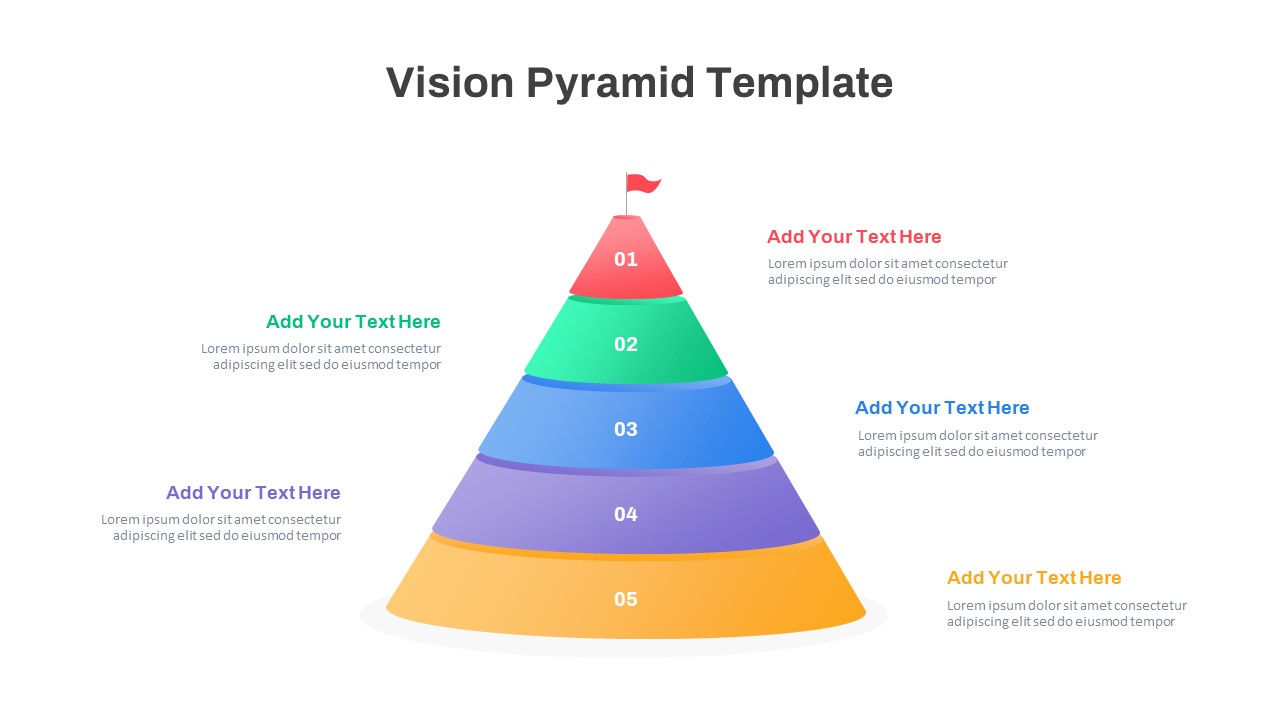
Five-Level Vision Pyramid Diagram Template for PowerPoint & Google Slides
Pyramid
Four-Level Colorful Pyramid Diagram Template for PowerPoint & Google Slides
Pyramid

Editable Six-Step Bubble Process Diagram Template for PowerPoint & Google Slides
Process
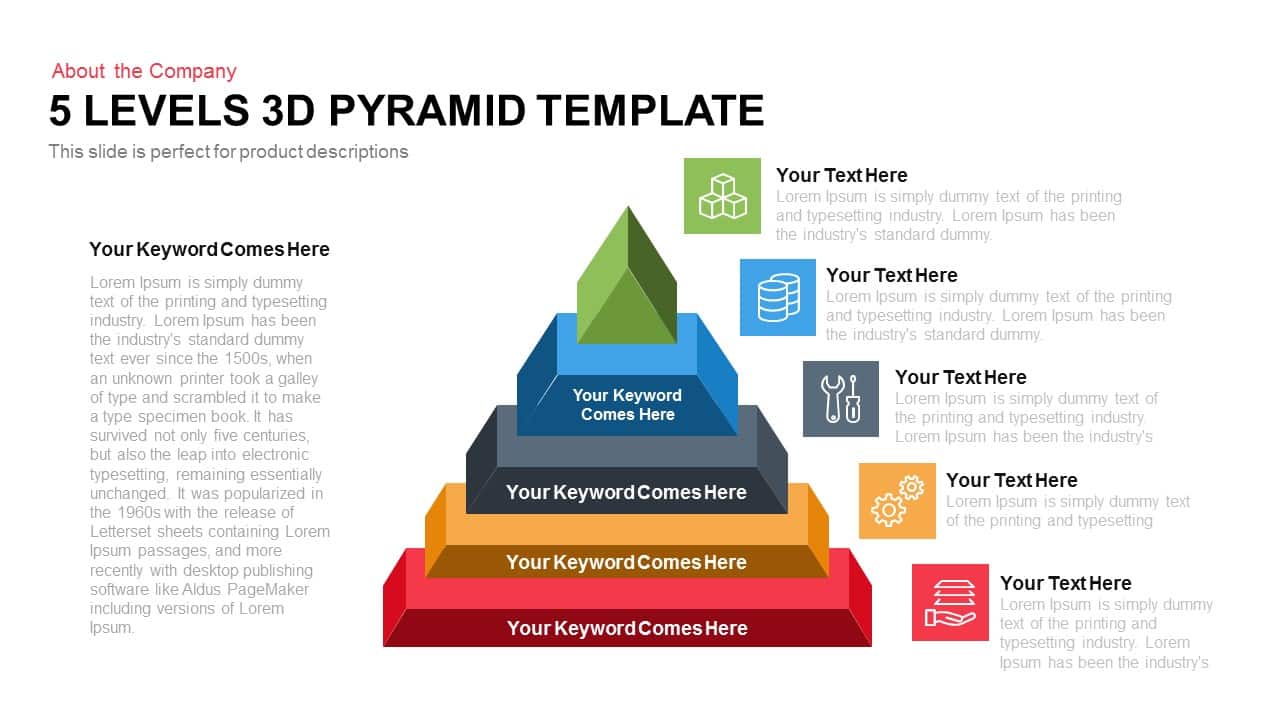
Five-Level 3D Pyramid Hierarchy Template for PowerPoint & Google Slides
Pyramid
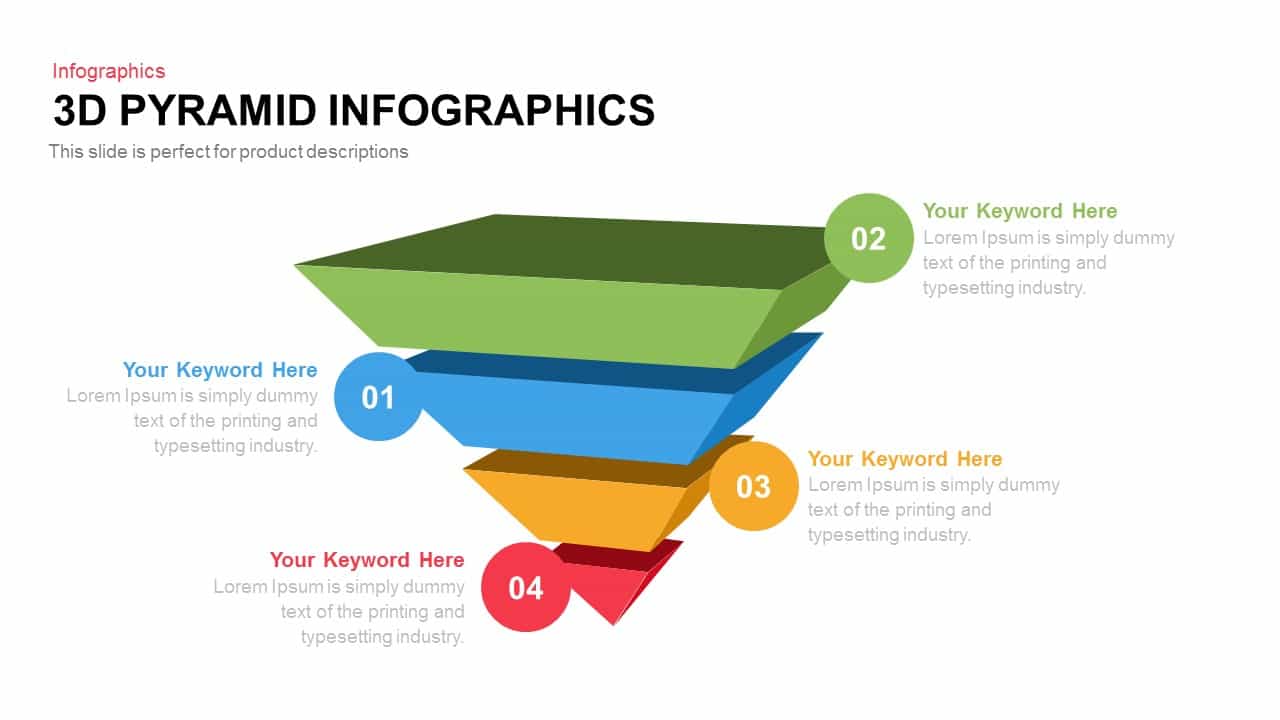
Four-Level 3D Pyramid Infographic Template for PowerPoint & Google Slides
Pyramid
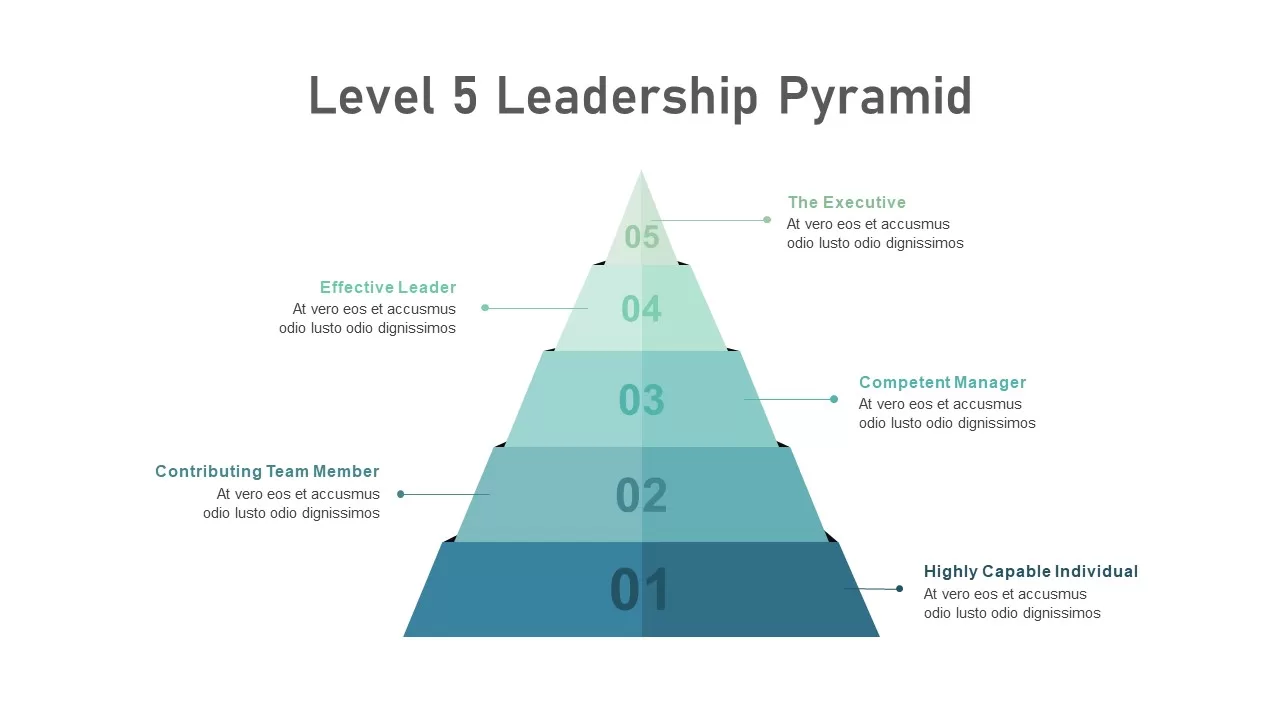
Level 5 Leadership Pyramid Infographic Template for PowerPoint & Google Slides
Pyramid
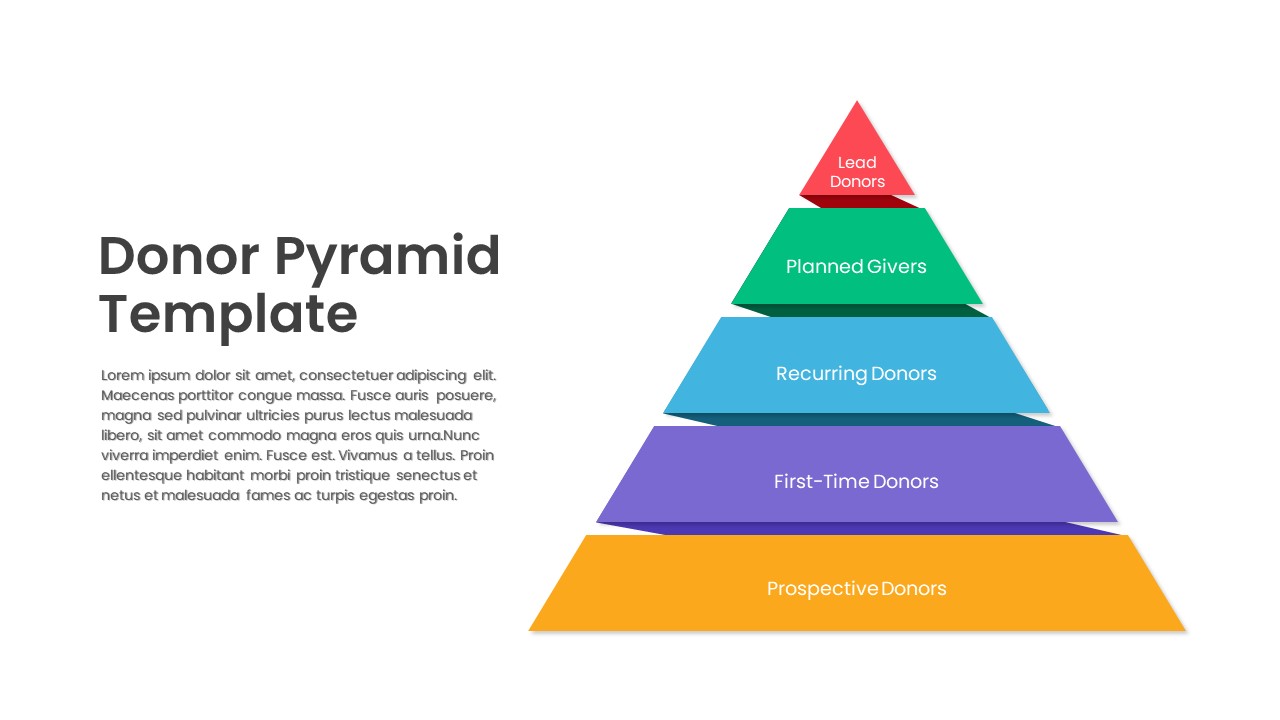
Five-Level Donor Pyramid Philanthropy Template for PowerPoint & Google Slides
Pyramid
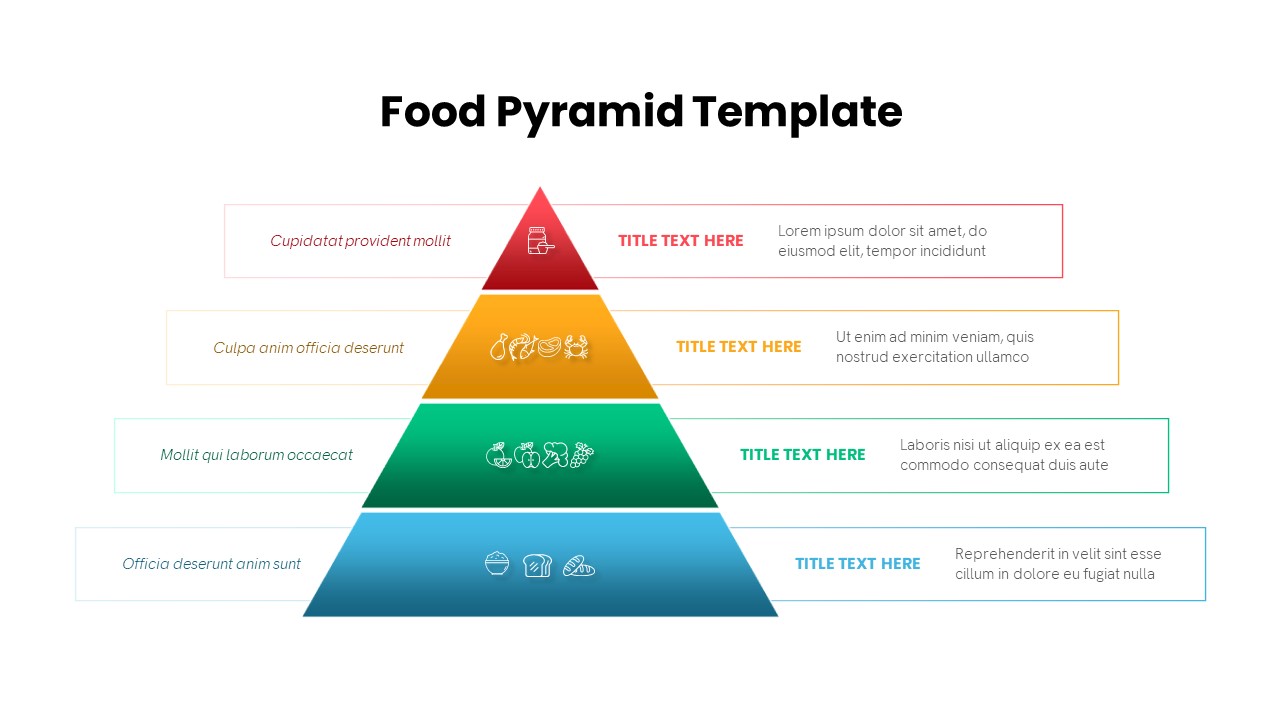
Four-Level Food Pyramid Infographic Template for PowerPoint & Google Slides
Pyramid
Multi-Level Colorful Pyramid Chart Template for PowerPoint & Google Slides
Pyramid
Four Level Pyramid Infographic Template for PowerPoint & Google Slides
Pyramid
5 Level Hierarchy Pyramid Template for PowerPoint & Google Slides
Pyramid
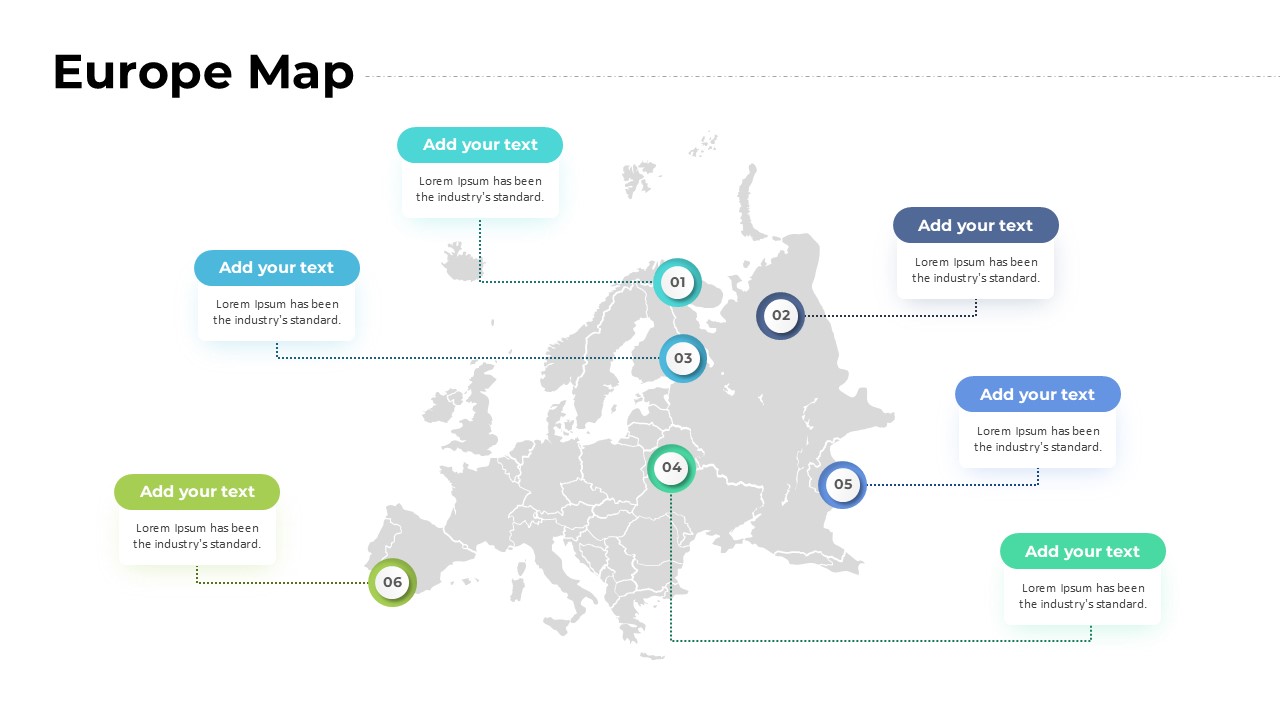
Europe Map with Six Editable Points Template for PowerPoint & Google Slides
World Maps
Stacked Cubes Pyramid Six-Option Diagram Template for PowerPoint & Google Slides
Pyramid
Six-Stage Pyramid Process Slide Template for PowerPoint & Google Slides
Pyramid
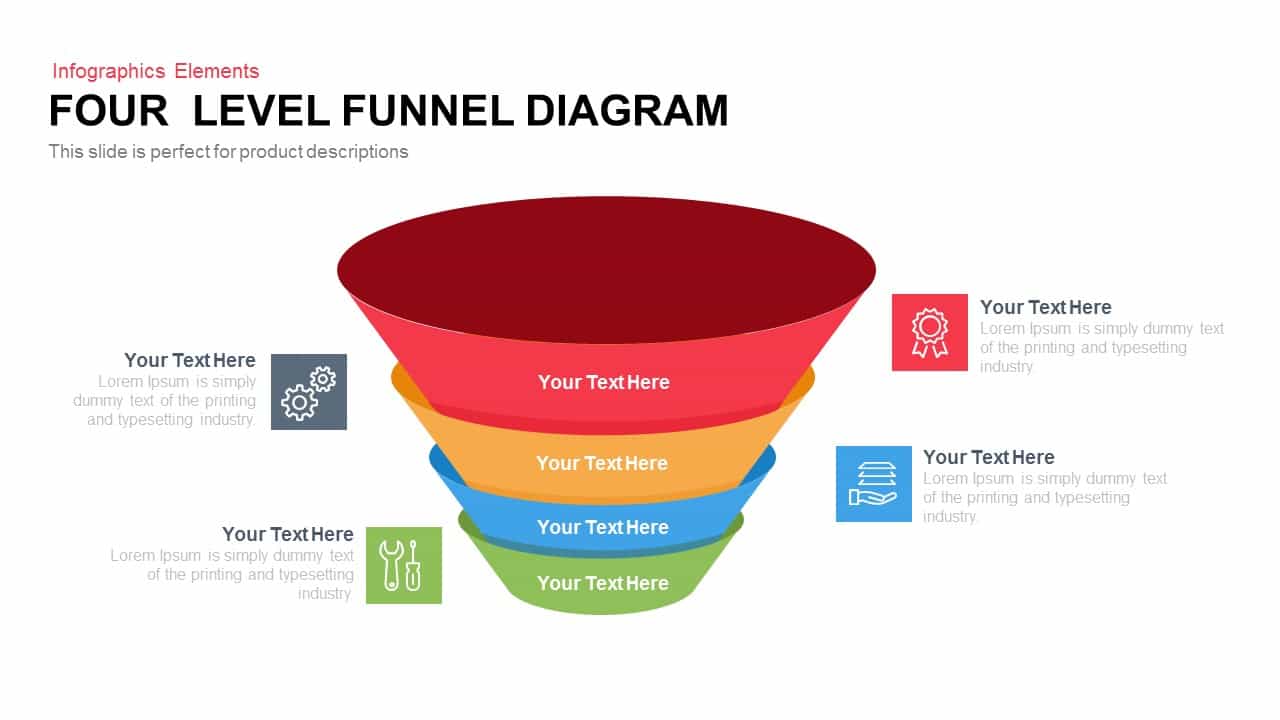
4 Level Funnel Diagram Template for PowerPoint & Google Slides
Funnel
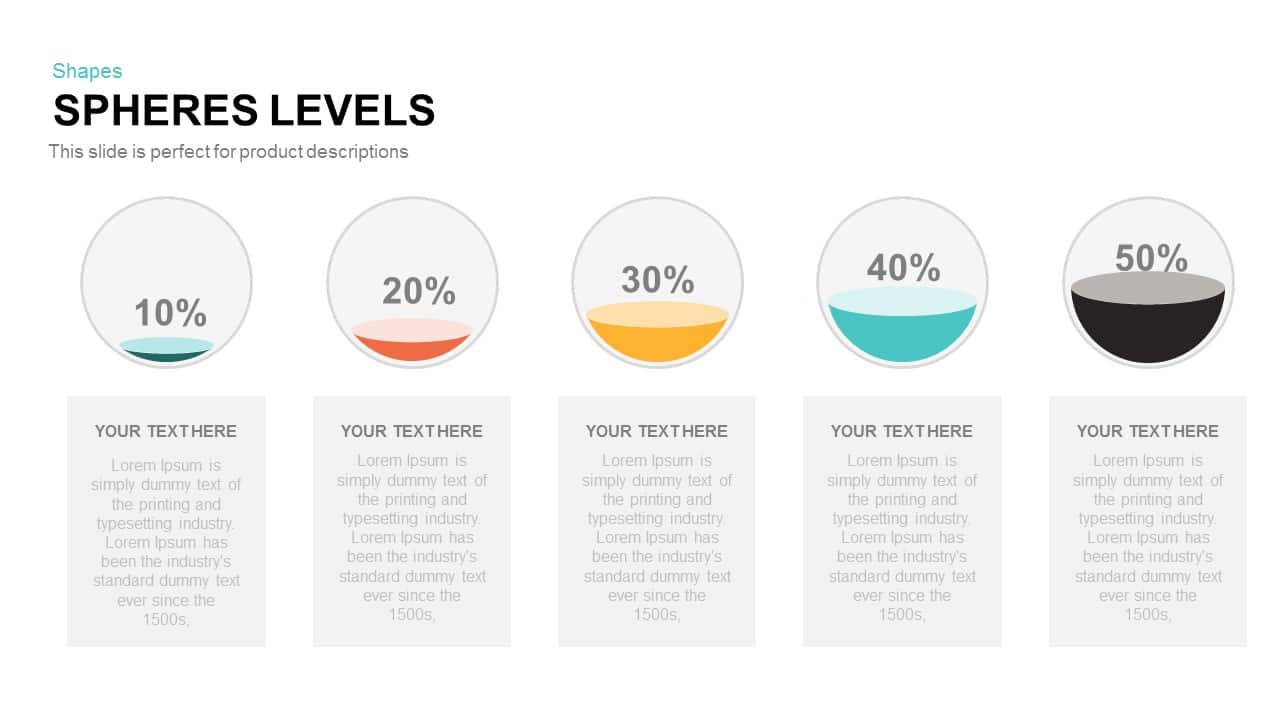
Five-Level Sphere Indicators Diagram template for PowerPoint & Google Slides
Infographics
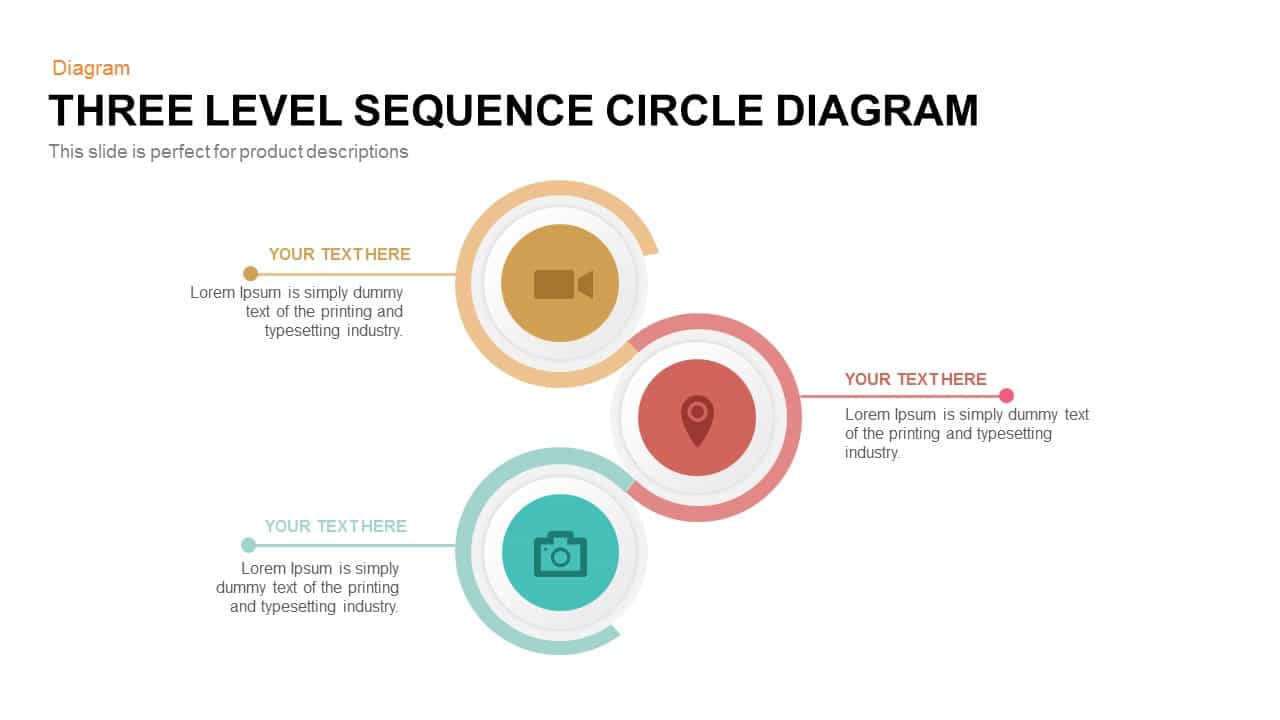
Three-Level Sequence Circle Diagram Template for PowerPoint & Google Slides
Circular
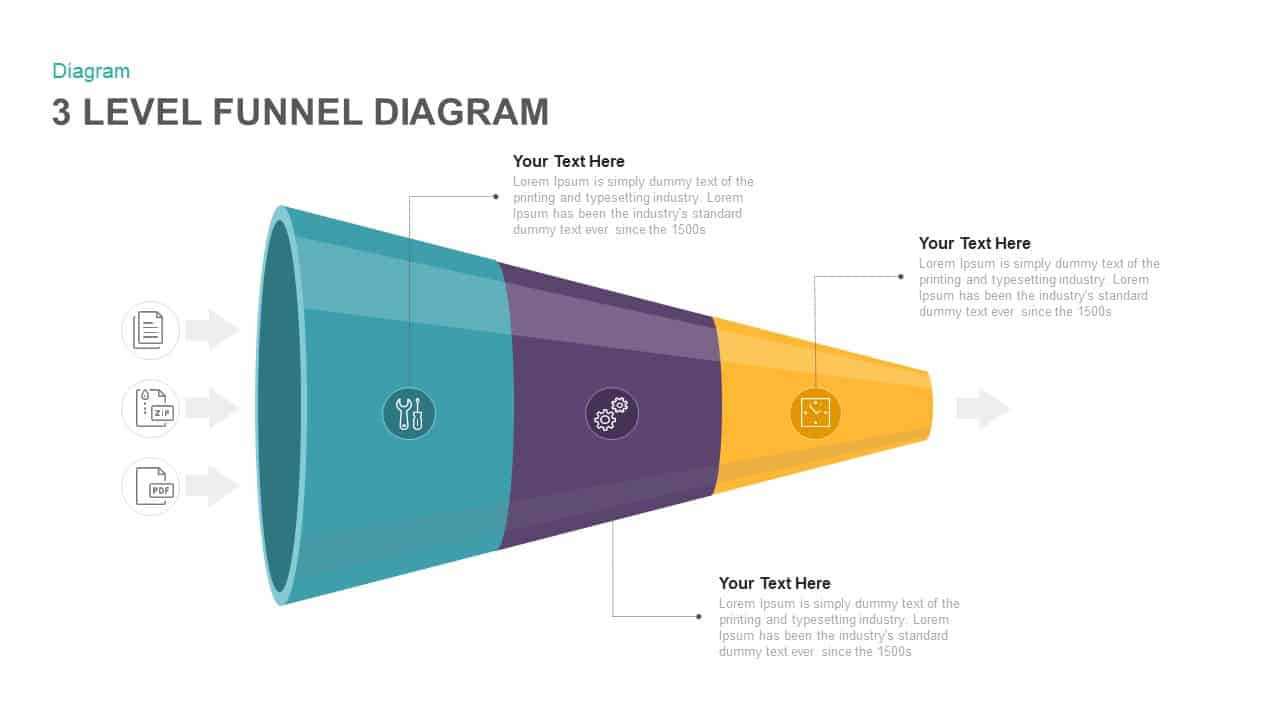
Three Level Funnel Process Diagram Template for PowerPoint & Google Slides
Funnel
Multi-Level Wheel Chart Diagram template for PowerPoint & Google Slides
Pie/Donut
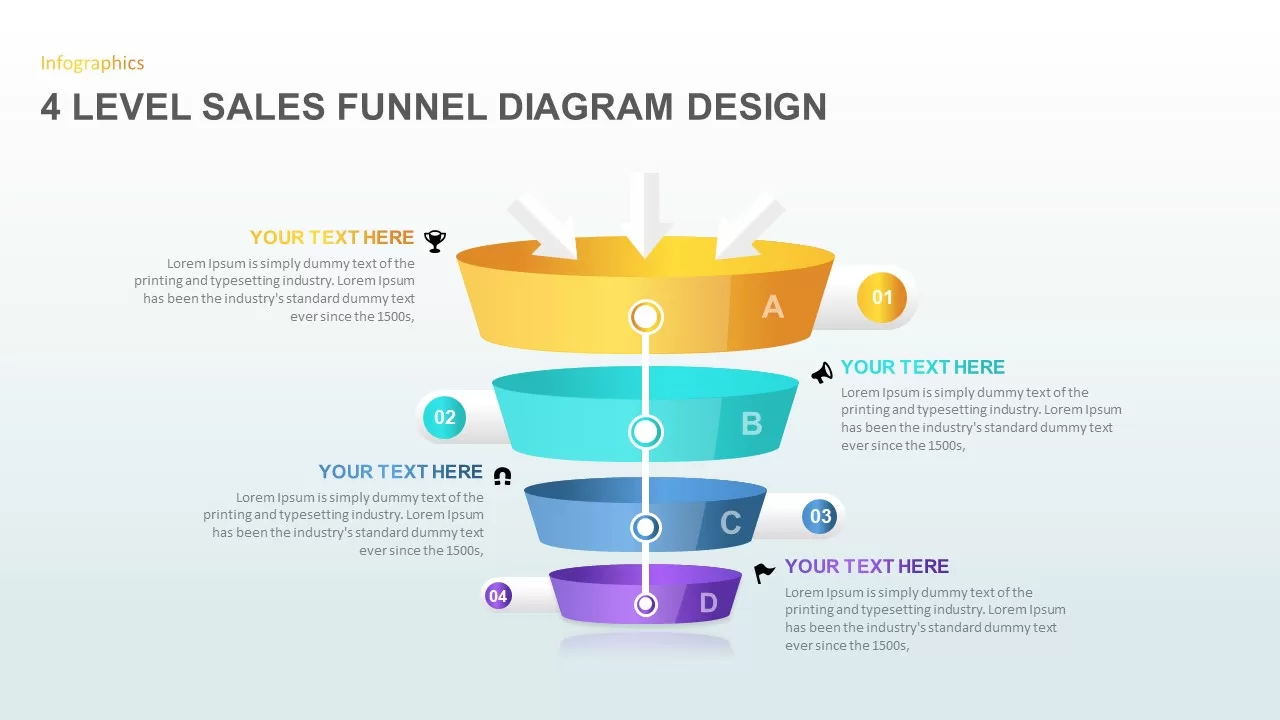
4 Level Sales Funnel Diagram Design for PowerPoint & Google Slides
Marketing Funnel
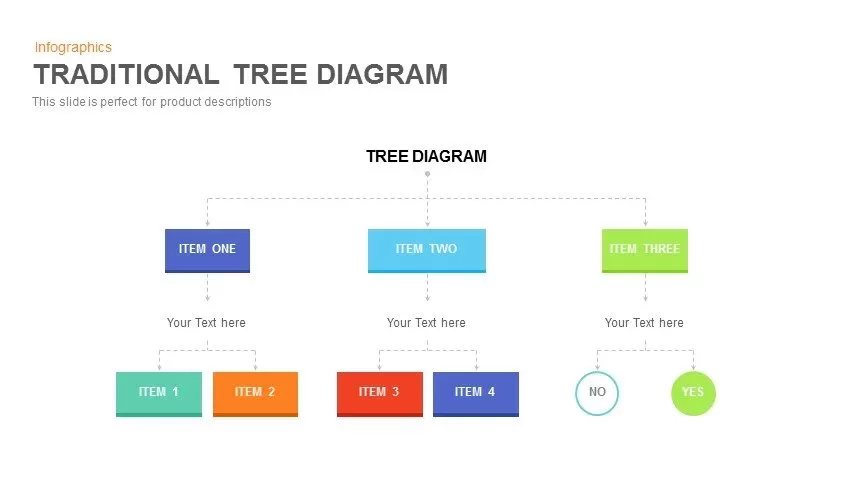
Editable Hierarchical Tree Diagram Template for PowerPoint & Google Slides
Decision Tree
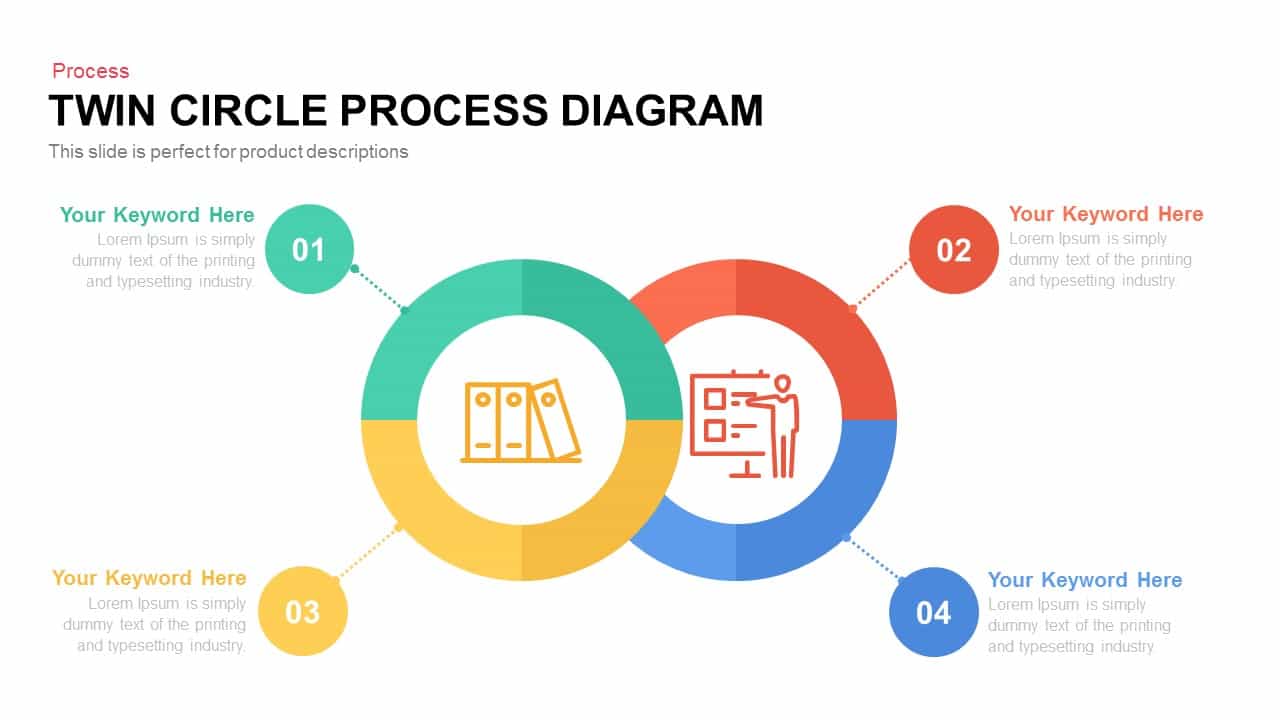
Editable Twin Circle Process Diagram Template for PowerPoint & Google Slides
Process
Editable Force Field Analysis Diagram Template for PowerPoint & Google Slides
Business Plan
Editable Four-Section 3D Shape Diagram Template for PowerPoint & Google Slides
Comparison
Editable Plant Growth Stages Diagram Template for PowerPoint & Google Slides
Process

Editable SIPOC Process Diagram Deck Template for PowerPoint & Google Slides
Pitch Deck
Free Editable Family Tree Genealogy Diagram Template for PowerPoint & Google Slides
Org Chart
Free
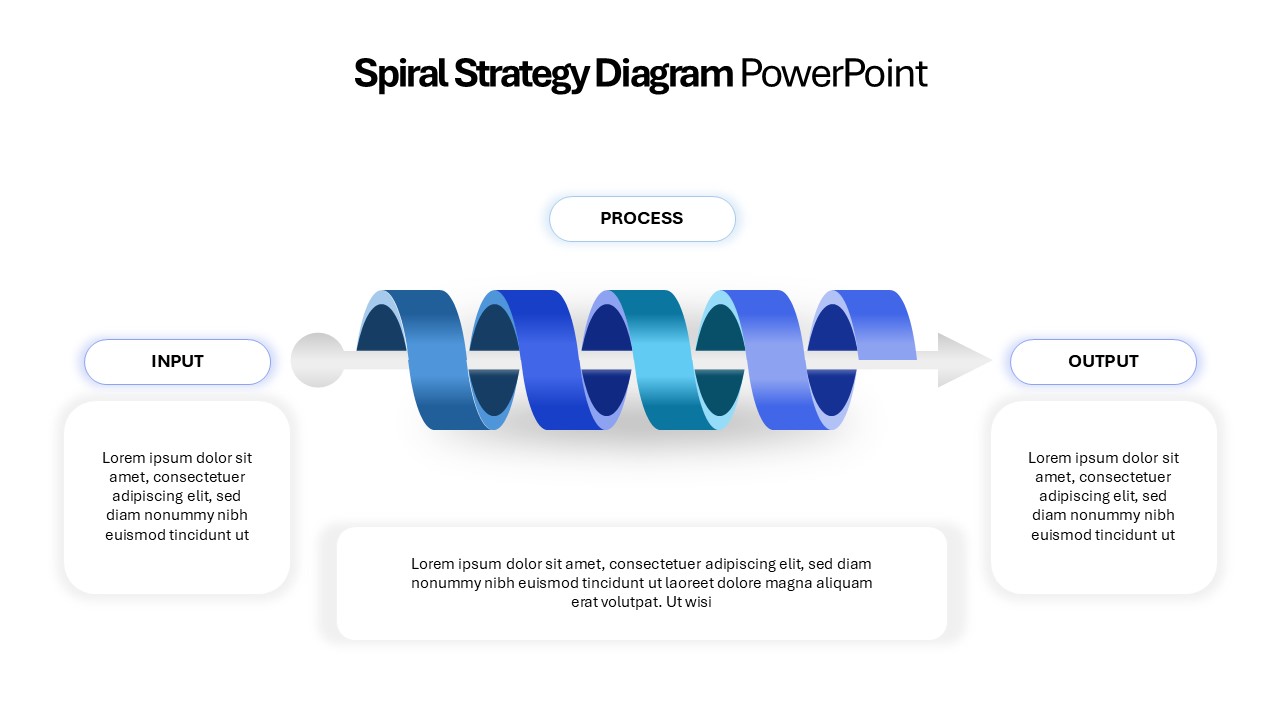
Editable 3D Spiral Strategy Diagram Template for PowerPoint & Google Slides
Process
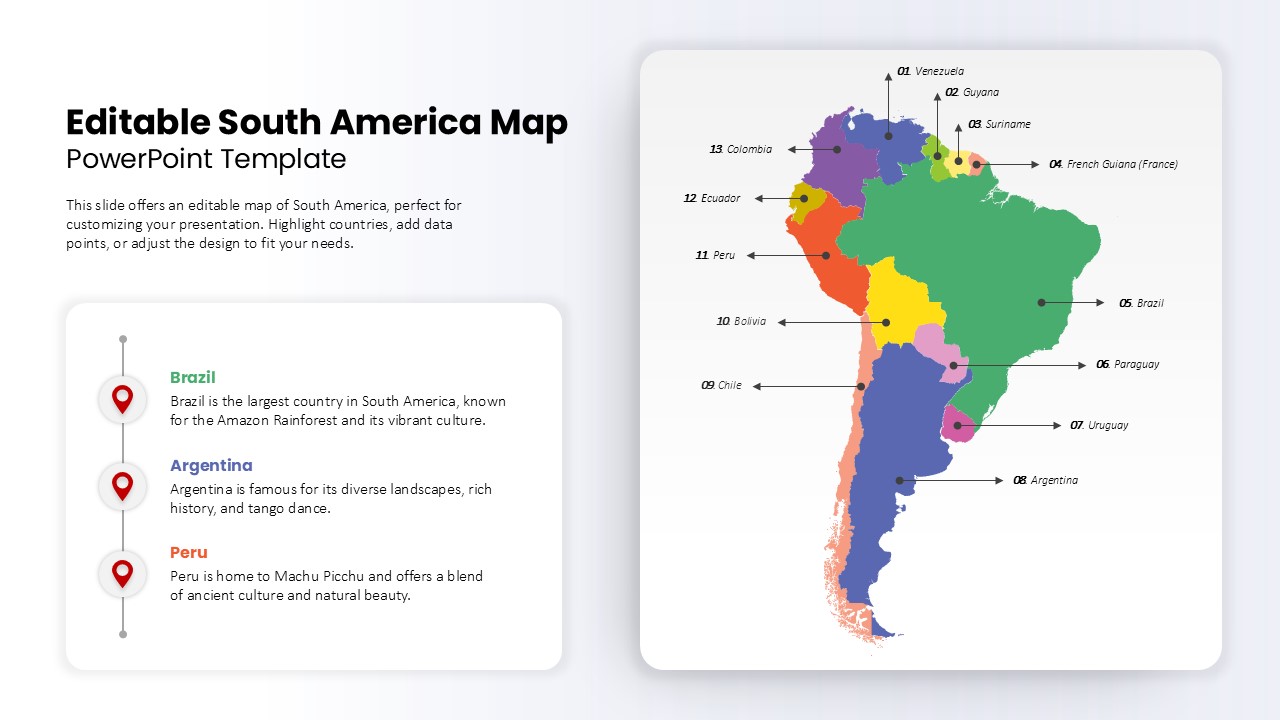
Editable South America Map Diagram Template for PowerPoint & Google Slides
Maps
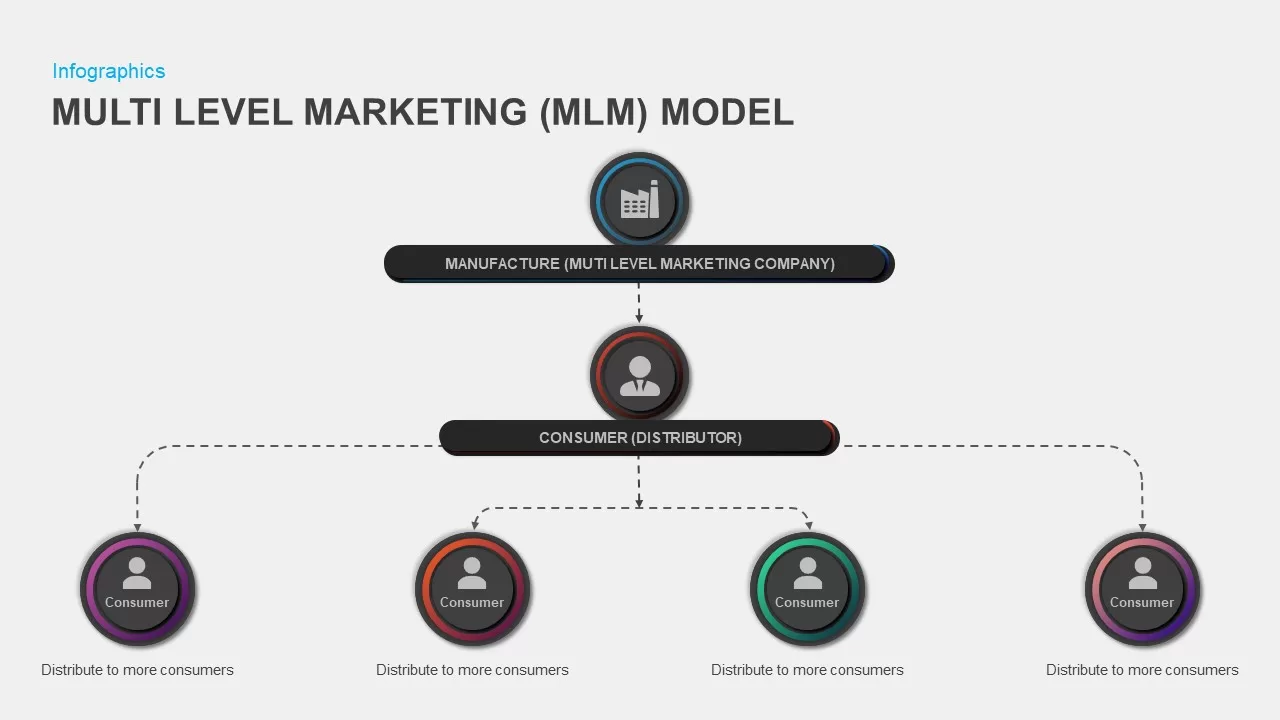
Multi-Level Marketing PowerPoint Template for PowerPoint & Google Slides
Business Models
Horizontal Multi-Level Hierarchy Chart template for PowerPoint & Google Slides
Org Chart
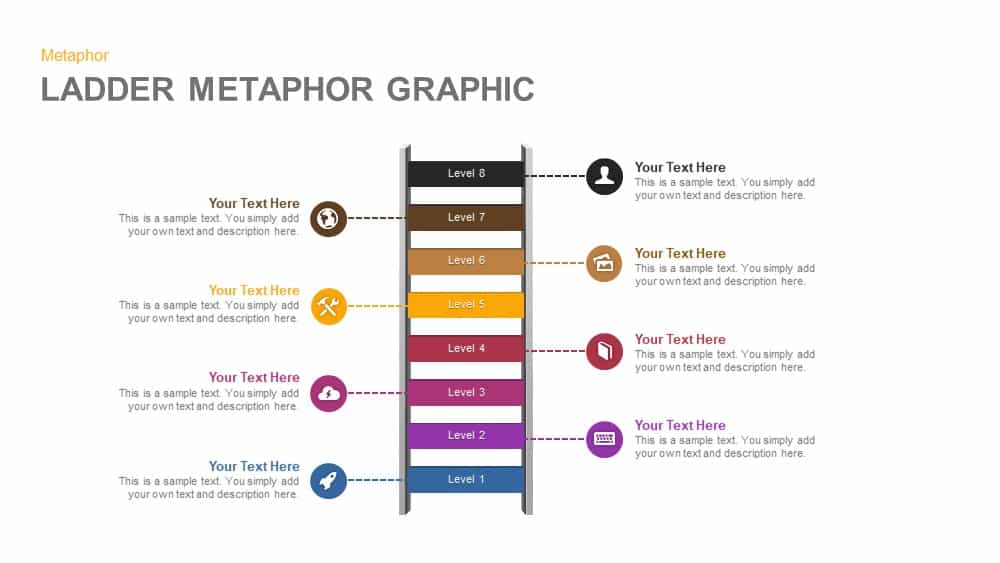
Eight-Level Ladder Metaphor Graphic Template for PowerPoint & Google Slides
Process
Five-Level Puzzle House Infographic Template for PowerPoint & Google Slides
Pyramid
3D Spheres Fill Level Infographic Deck Template for PowerPoint & Google Slides
Comparison
3 Level Funnel Design Visualization Template for PowerPoint & Google Slides
Funnel
Corporate Level Strategy Overview template for PowerPoint & Google Slides
Business Strategy

Free Multi-Level Roadmap Infographic Template for PowerPoint & Google Slides
Roadmap
Free
Vendor Comparison Matrix with High-Level Requirements template for PowerPoint & Google Slides
Comparison Chart
High-Level Timeline Infographic Template for PowerPoint & Google Slides
Timeline
Risk Level Gauge Comparison Dashboard Template for PowerPoint & Google Slides
Comparison
Editable Colorful Daily Agenda Slides Template for PowerPoint & Google Slides
Agenda
Editable Colombia Map PowerPoint Template for PowerPoint & Google Slides
Business Models

Fully Editable Gantt Chart Timeline template for PowerPoint & Google Slides
Gantt Chart
Editable Four-Point Timeline Agenda Template for PowerPoint & Google Slides
Agenda
Editable Tajikistan Provinces Map Pack Template for PowerPoint & Google Slides
Maps
Editable Pillars Infographics Pack Template for PowerPoint & Google Slides
Infographics
Editable Four-Quadrant TOWS Matrix Template for PowerPoint & Google Slides
Opportunities Challenges
Free Editable Check Box Icon Set Presentation Template for PowerPoint & Google Slides
Infographics
Free
Fully Editable World Map Infographic Template for PowerPoint & Google Slides
World Maps
Editable World Map Callout Infographic Template for PowerPoint & Google Slides
World Maps
Editable World Map Callout Infographic Template for PowerPoint & Google Slides
World Maps
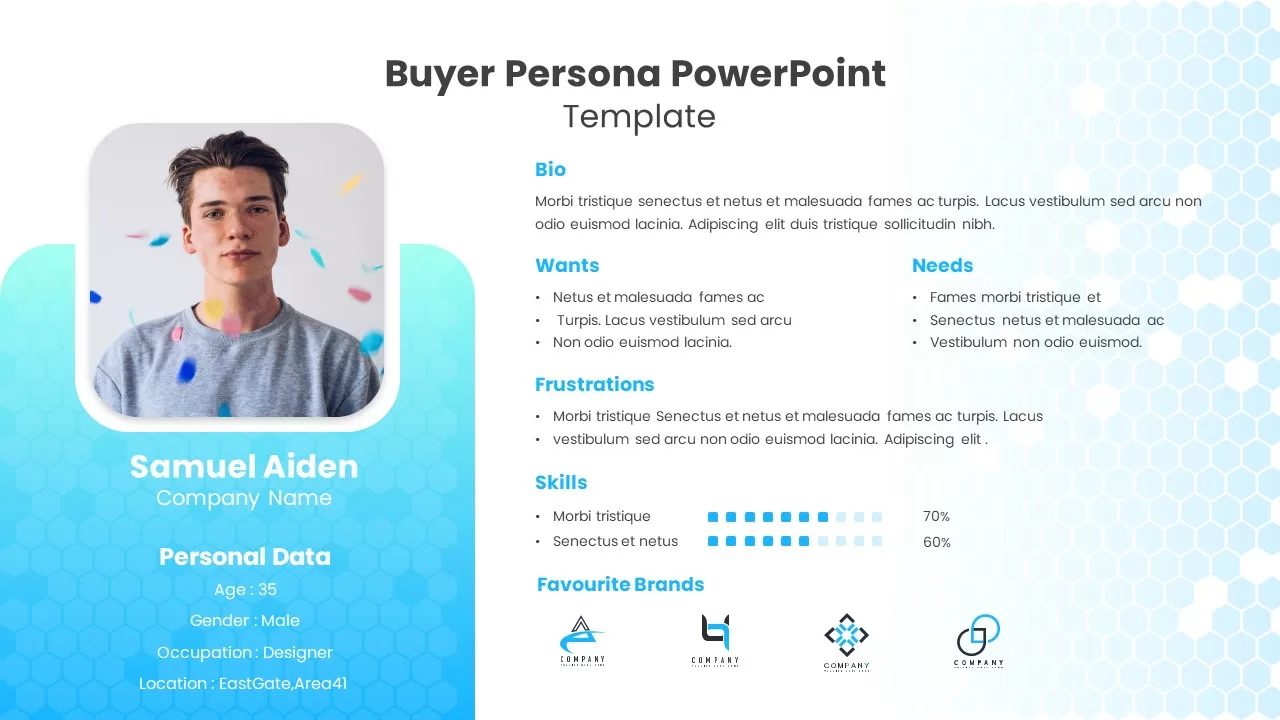
Editable Buyer Persona Profile Slide Template for PowerPoint & Google Slides
Customer Journey

Editable 2024 Calendar Yearly Overview Template for PowerPoint & Google Slides
Decks
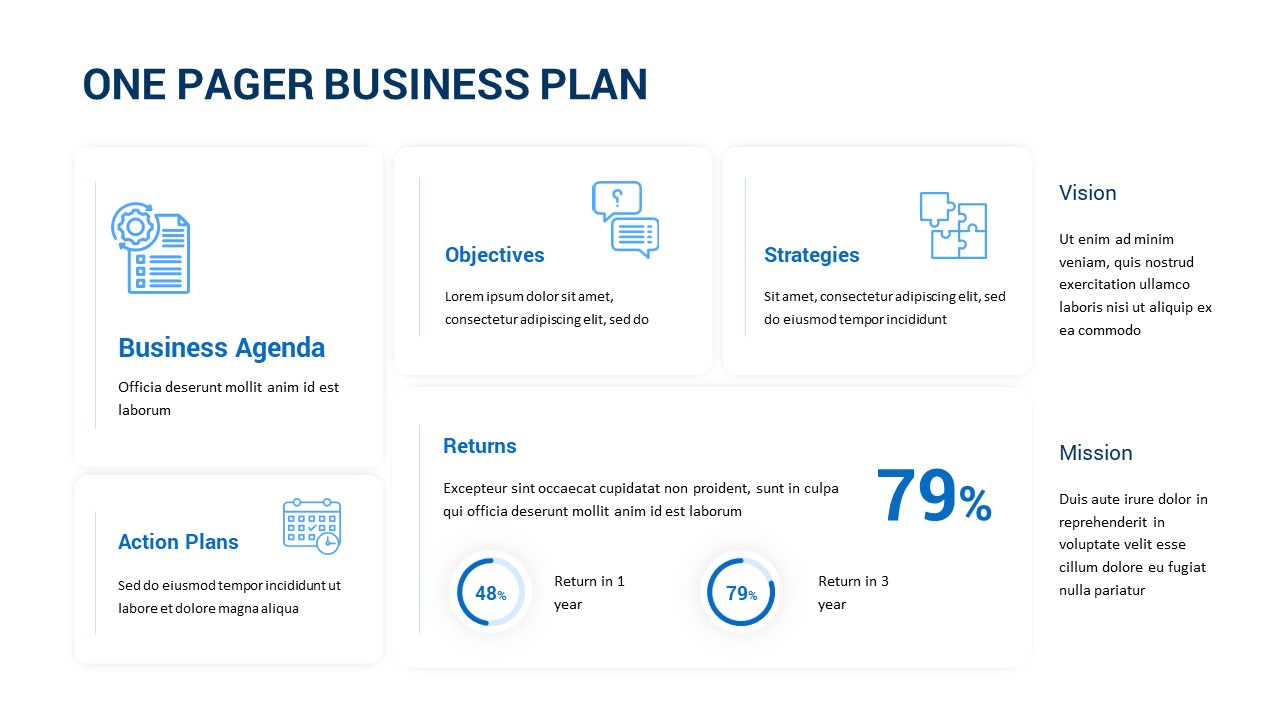
Editable One-Pager Business Plan Slide Template for PowerPoint & Google Slides
Business Plan
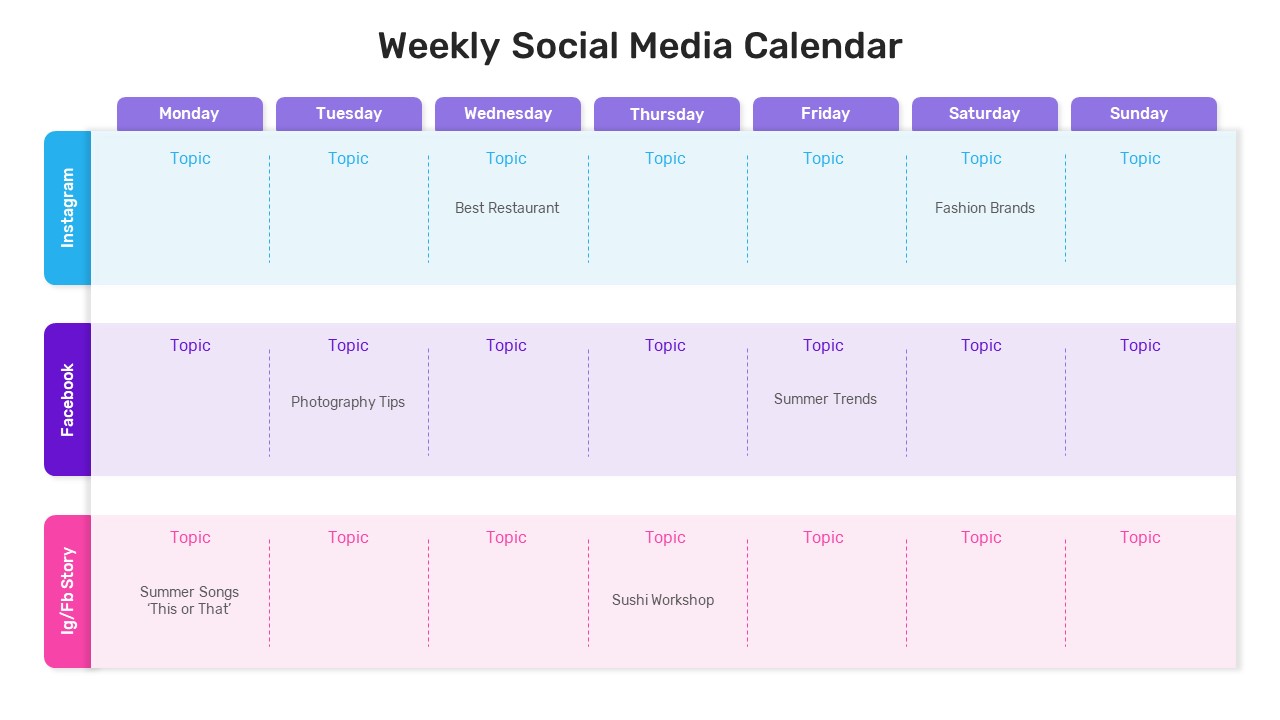
Weekly Social Media Calendar Editable Template for PowerPoint & Google Slides
Digital Marketing
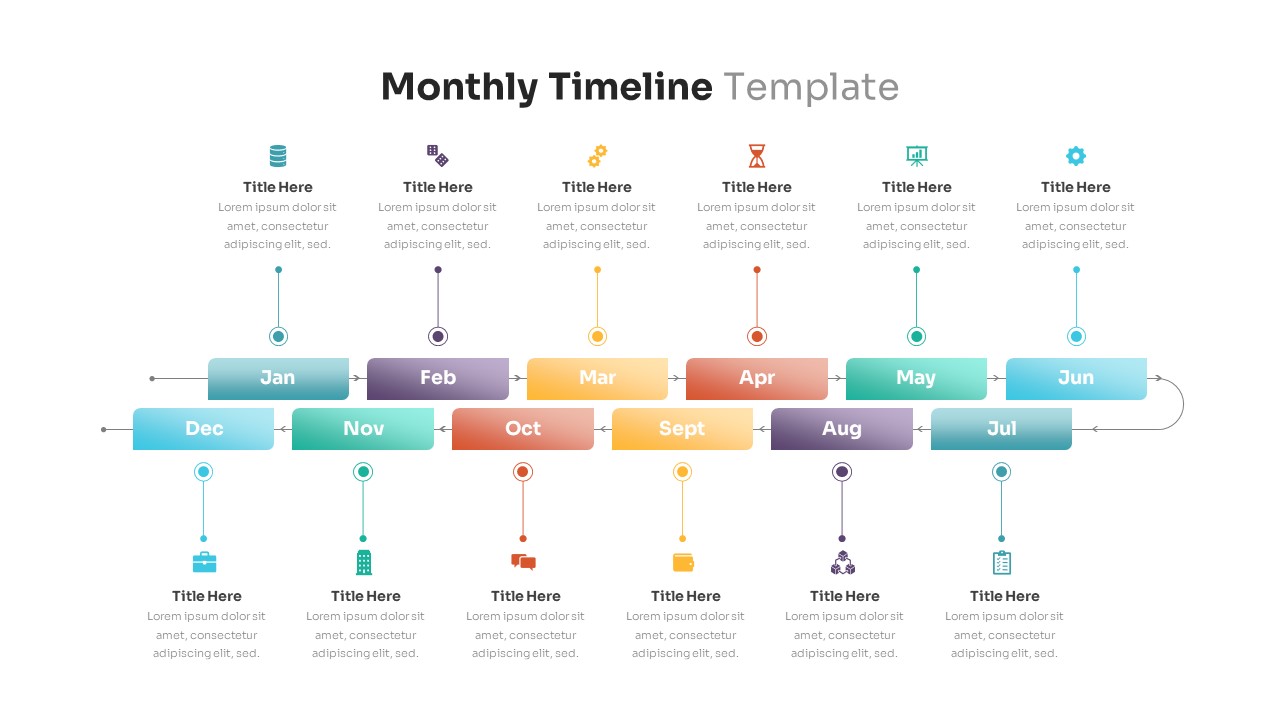
Editable Monthly Timeline Infographic Template for PowerPoint & Google Slides
Timeline
Professional Editable 6 Month Timeline Template for PowerPoint & Google Slides
Timeline
Editable C-Suite Organizational Chart Template for PowerPoint & Google Slides
Org Chart
Free Editable Saudi Arabia Map Template for PowerPoint & Google Slides
World Maps
Free Editable U.S. Map with Regional Metrics Template for PowerPoint & Google Slides
World Maps
Free
Free Editable Simple Column Chart Slide Template for PowerPoint & Google Slides
Bar/Column
Free
Editable Sales Pitch Deck Presentation Template for PowerPoint & Google Slides
Pitch Deck
Editable Multi-Series Peak Line Chart Template for PowerPoint & Google Slides
Comparison Chart
Arrow Types Shape Library Editable Template for PowerPoint & Google Slides
Arrow
Editable Africa Map Infographic Data Template for PowerPoint & Google Slides
World Maps
Free Editable Multi-Step Ribbon Agenda Slide Template for PowerPoint & Google Slides
Agenda
Free
Editable Ireland Map Infographic Slide Template for PowerPoint & Google Slides
World Maps
Free
Fully Editable Retro Vintage Theme Deck Template for PowerPoint & Google Slides
Company Profile
Fully Editable Career Journey Roadmap Template for PowerPoint & Google Slides
Customer Journey
Free
Fully Editable Watercolor Theme Deck Template for PowerPoint & Google Slides
Pitch Deck
Editable Greece Map for PowerPoint & Google Slides
Maps
Six Step Creative Circular Diagram Template for PowerPoint & Google Slides
Circular
Six Steps Circular CRM Diagram Template for PowerPoint & Google Slides
Customer Journey
Six Hexagon Stages Process Flow Diagram Template for PowerPoint & Google Slides
Process
Six Section Circular Infographic Diagram Template for PowerPoint & Google Slides
Circular
Six-Step Hexagon Process Diagram Template for PowerPoint & Google Slides
Process
Free Six Stage Bubble Process Diagram template for PowerPoint & Google Slides
Process
Free
Six Staged Circle Diagram template for PowerPoint & Google Slides
Circular
Six Hexagon Hub-and-Spoke Diagram Template for PowerPoint & Google Slides
Process
Six-Step Hexagonal Diagram Slide Template for PowerPoint & Google Slides
Circular
Six-Step Vertical Process Diagram Template for PowerPoint & Google Slides
Process
Free Six-Stage Arrow Process Diagram Template for PowerPoint & Google Slides
Process
Free
Six-Step Linear Arrow Process Diagram Template for PowerPoint & Google Slides
Process
Six-Stage Circular Diagram Process Template for PowerPoint & Google Slides
Circular
Six-Step Hexagon Process Flow Diagram Template for PowerPoint & Google Slides
Process
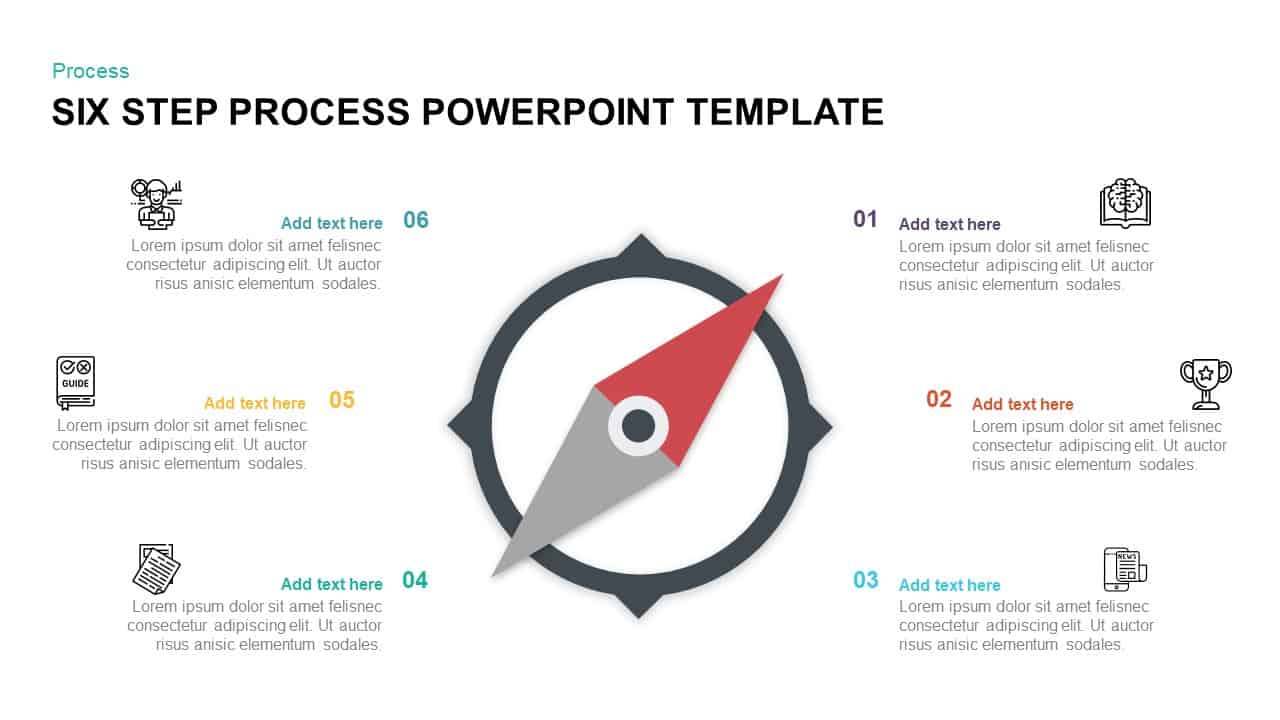
Compass-Themed Six-Step Process Diagram Template for PowerPoint & Google Slides
Process
Greiner Growth Model Six-Phase Diagram Template for PowerPoint & Google Slides
Business Models
Six-Stage Circular Flow Diagram Template for PowerPoint & Google Slides
Circular
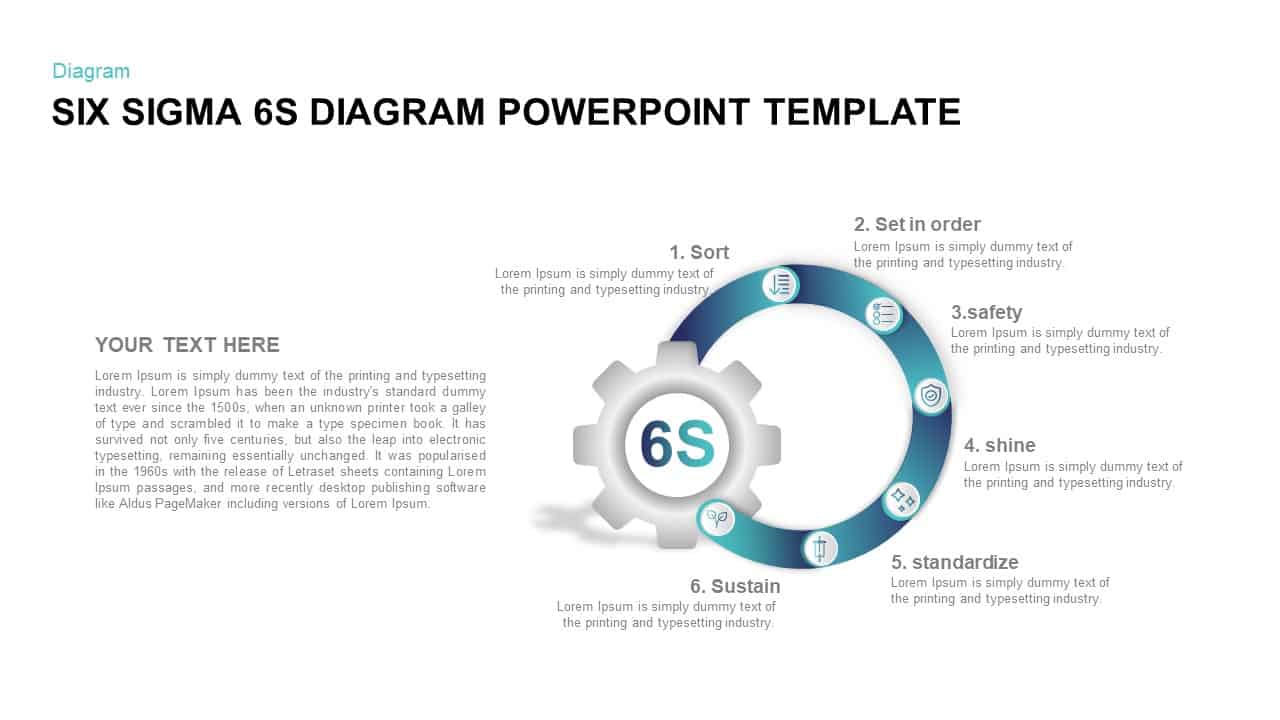
Six Sigma 6S Process Infographic Diagram Template for PowerPoint & Google Slides
Process
Six Sigma 6S Process Diagram Template for PowerPoint & Google Slides
Process
Six-Circle Process Infographic Diagram Template for PowerPoint & Google Slides
Circular
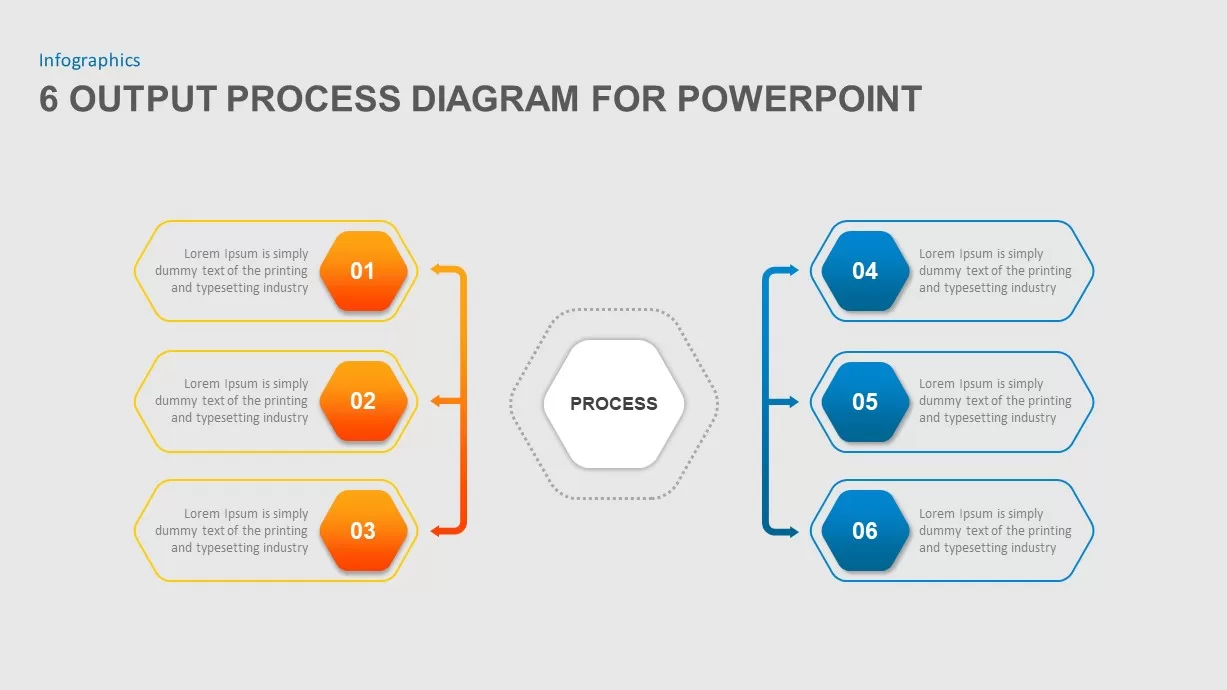
Six-Step Output Process Diagram Template for PowerPoint & Google Slides
Process
Circular 3D Cube Six-Segment Diagram Template for PowerPoint & Google Slides
Infographics
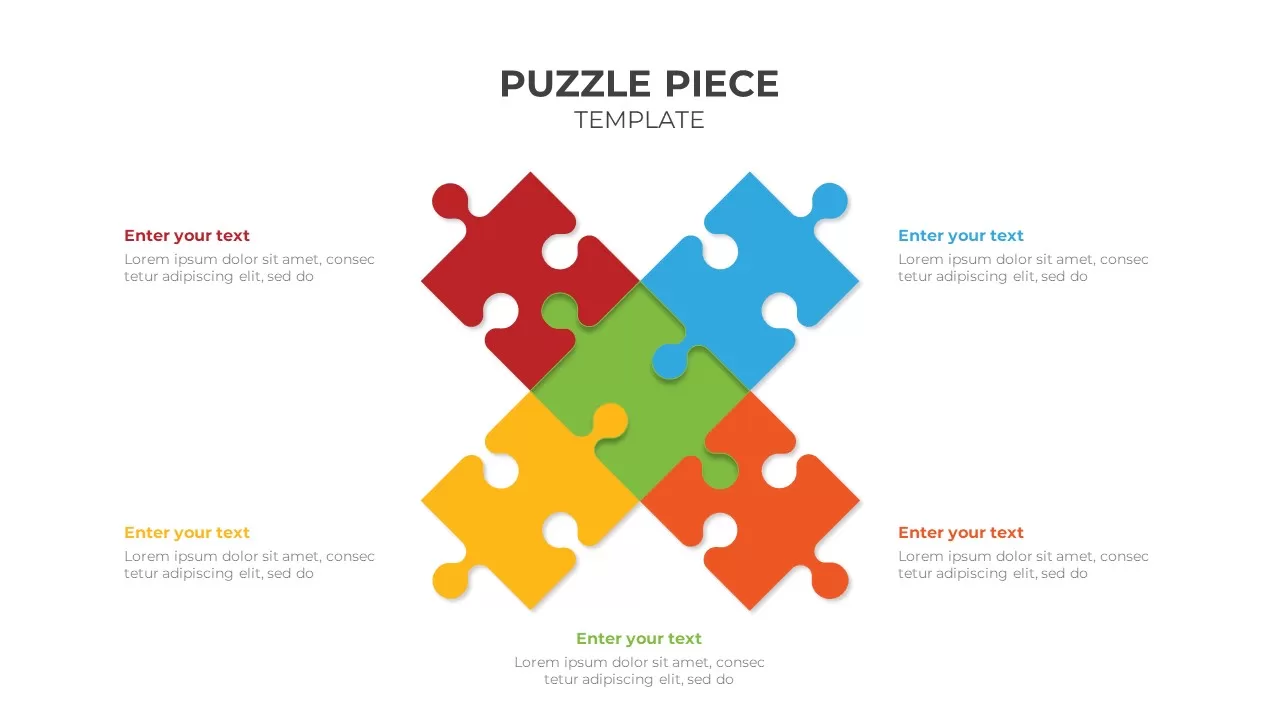
Six-Piece Puzzle Diagram Template for PowerPoint & Google Slides
Process