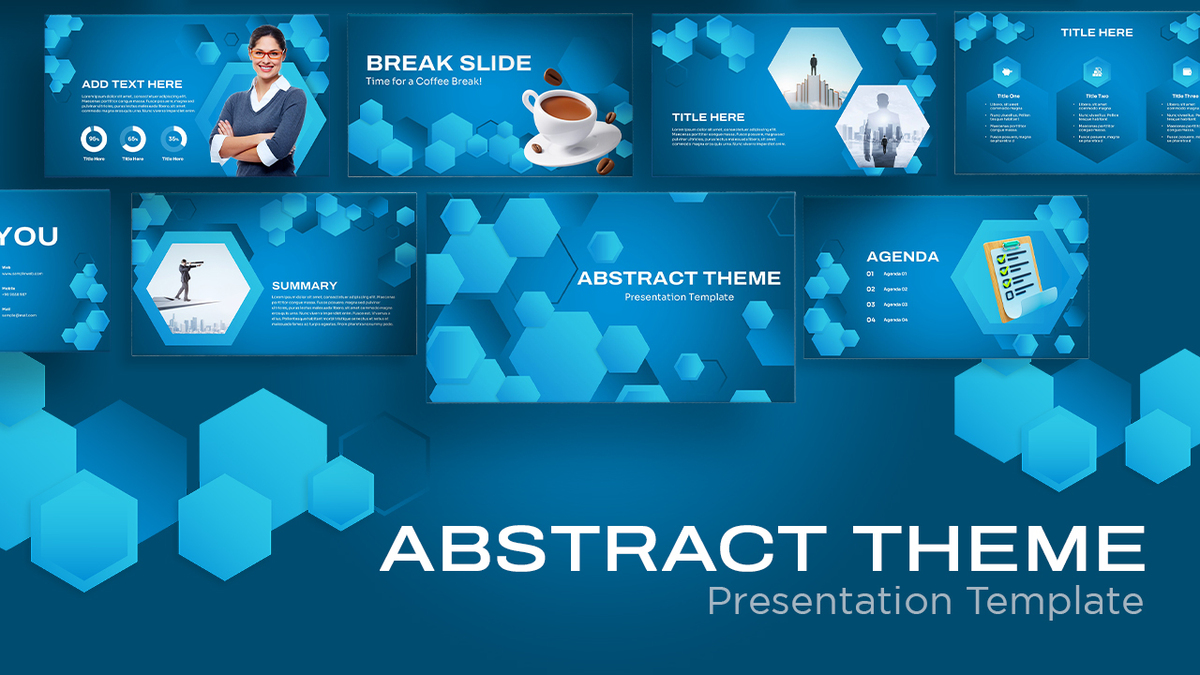
Abstract 3D Hexagonal 4-Step Infographic Template for PowerPoint & Google Slides
Description
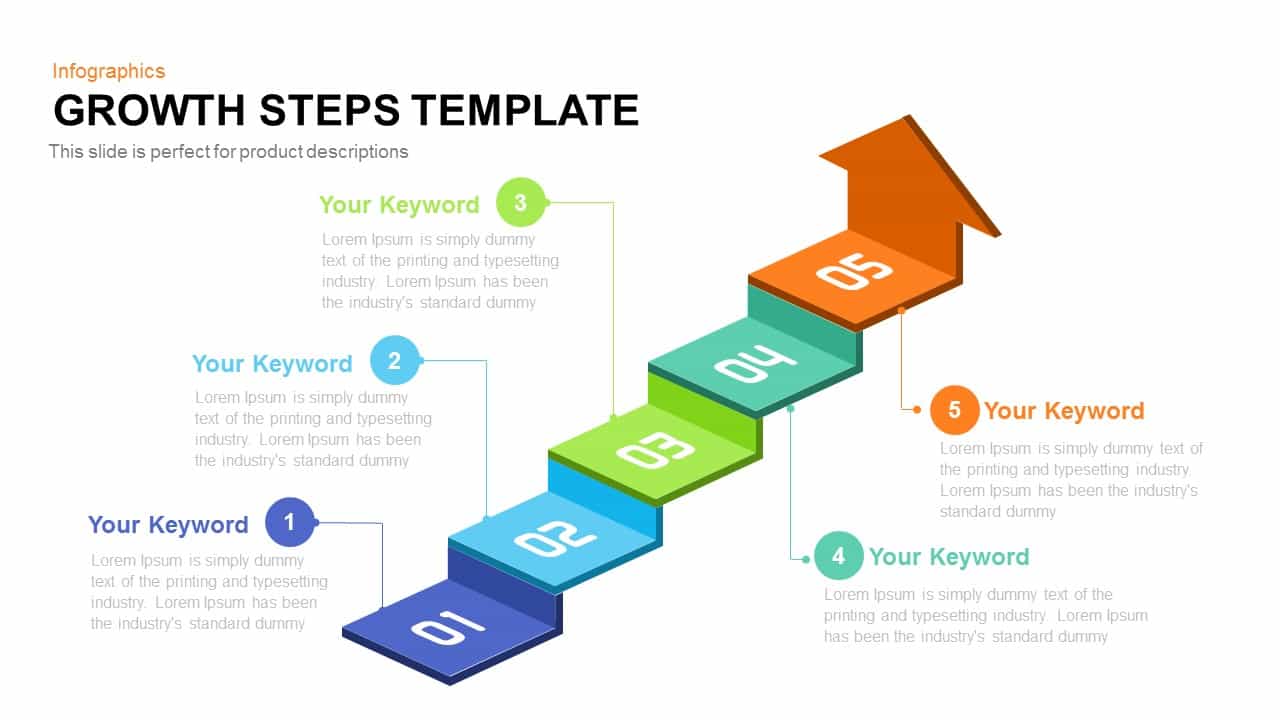
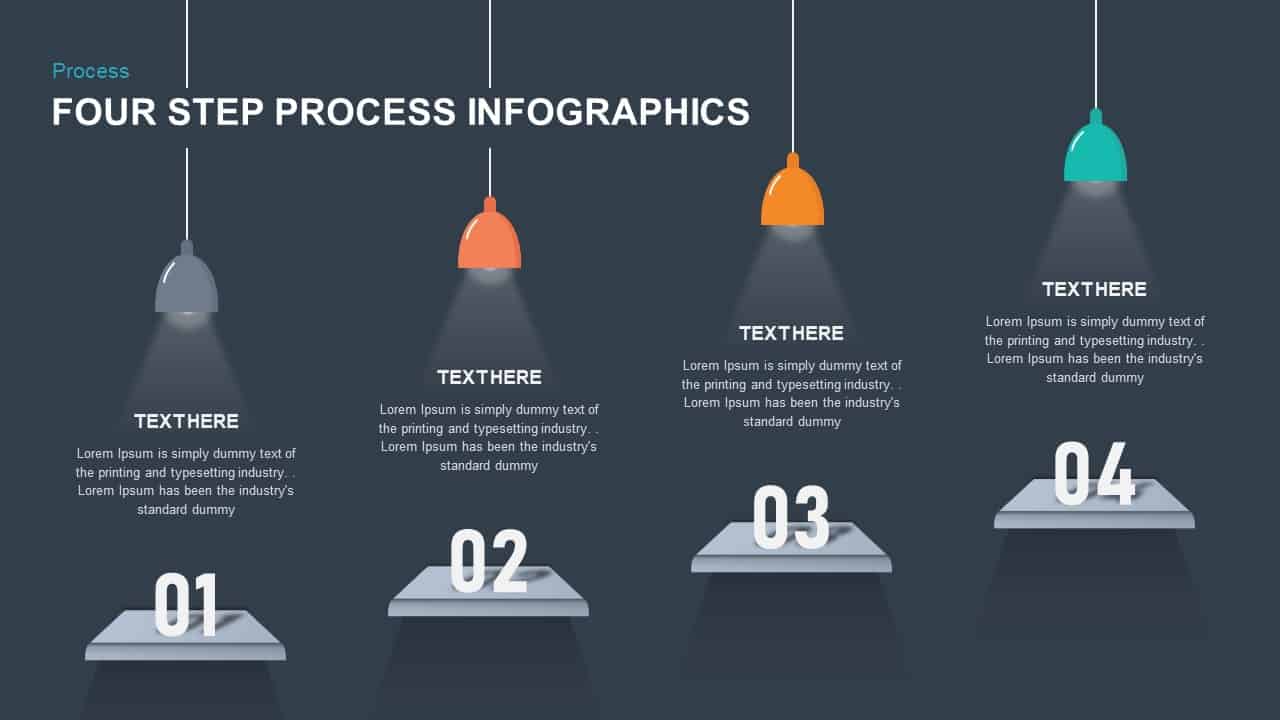
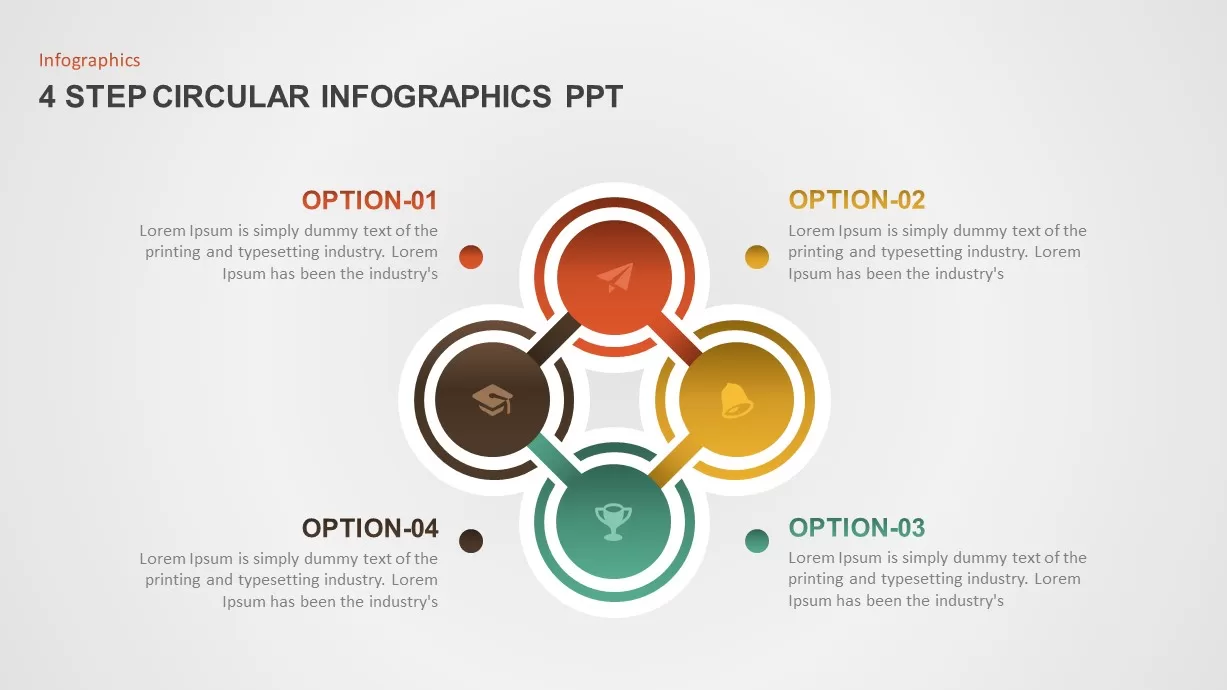
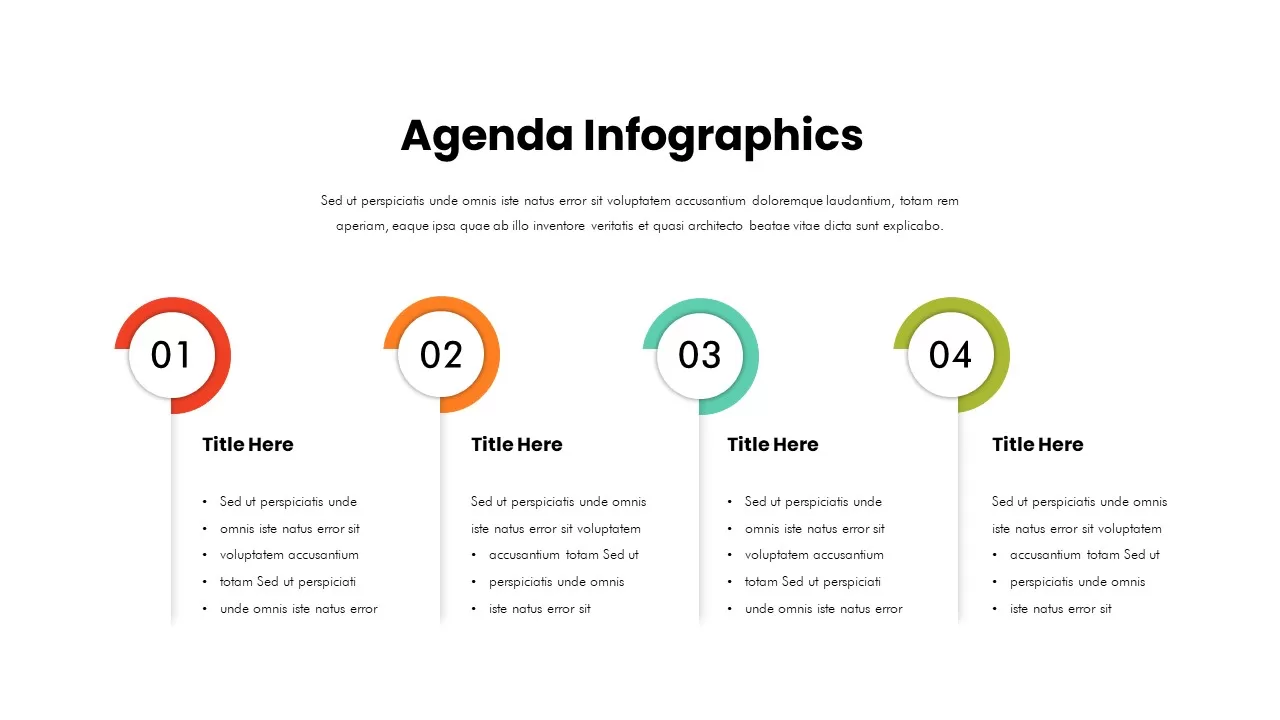
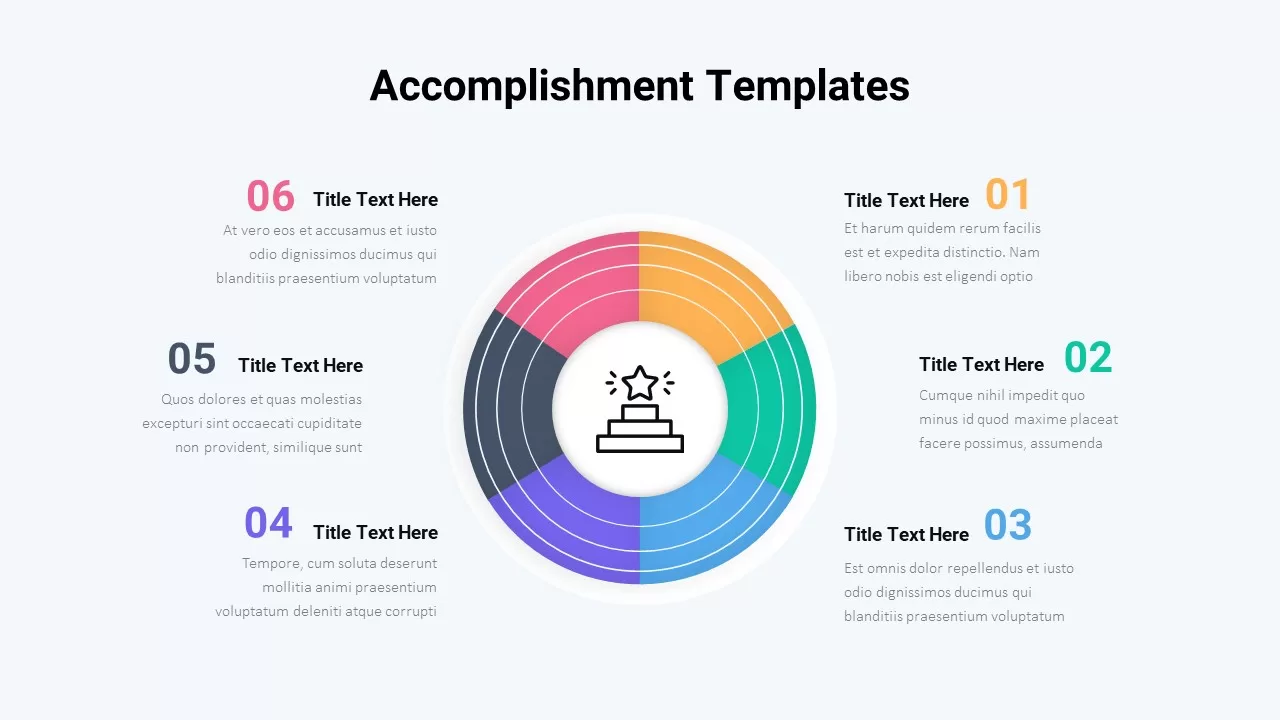
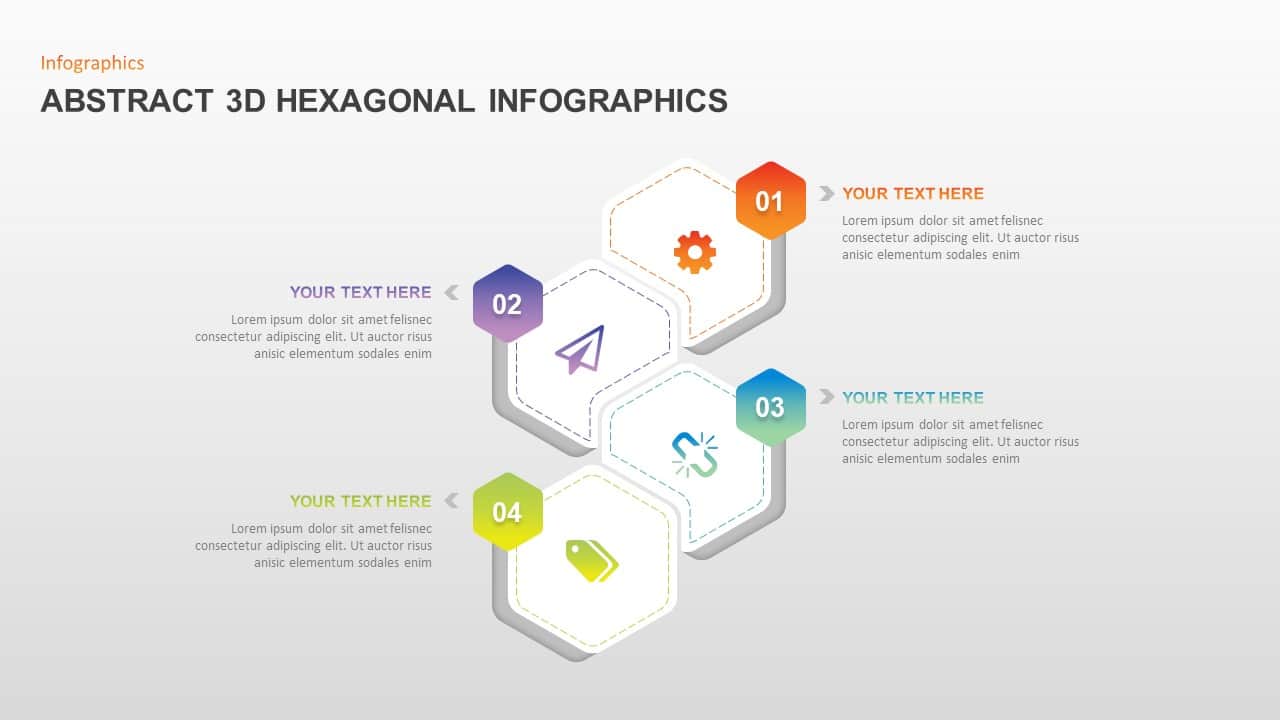
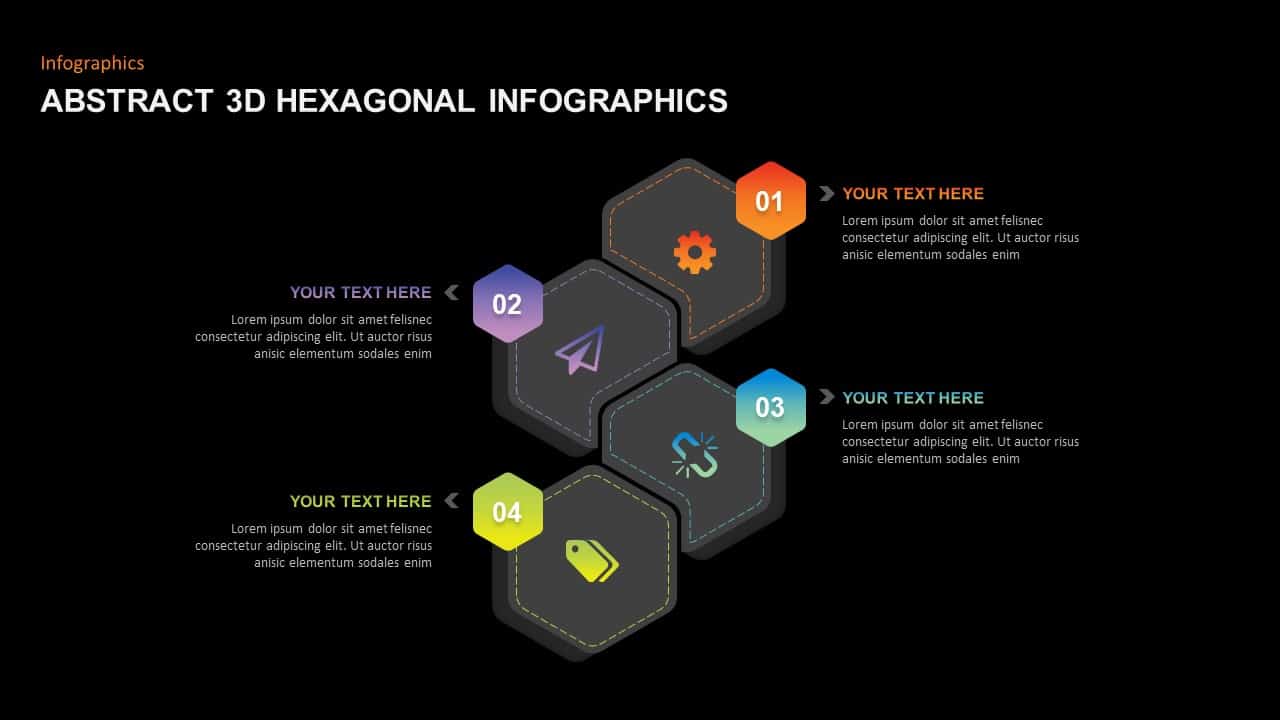
Showcase sequential concepts with this abstract 3D hexagonal infographic slide, designed to present four related points in a dynamic, multi-dimensional layout. Featuring four extruded vector hexagons connected diagonally, each numbered and color-coded (orange, purple, cyan-green, and lime-yellow), this slide delivers a visually compelling framework for process flows, project phases, or step-by-step guides. Editable icons sit at the center of each hexagon, while adjacent text blocks are anchored by matching color accent markers. The design leverages master slides for consistent styling, enabling global edits to colors, typography, and iconography. All hexagon shapes and arrow markers are vector objects, ensuring crisp scaling at any resolution. The layout includes dashed outlines for depth contrast, subtle drop shadows for 3D realism, and ample white (gradient gray) space to maintain focus on content. Users can easily swap icons, adjust hexagon gradients, or reposition text placeholders in seconds via PowerPoint or Google Slides. This template supports both light and dark backgrounds, preserving contrast and legibility across lighting conditions. With pre-defined placeholder formatting and intuitive structure, it accelerates deck creation and streamlines collaborative editing. Ideal for workshops, strategic reviews, and operational presentations, this infographic slide transforms complex sequences into an engaging, easy-to-understand visual narrative. Combine with additional steps or duplicate the layout to expand your process map, or extract individual hexagons as standalone visuals for dashboards or reports. Built on editable slide masters, the template also includes customizable animation placeholders for subtle entrance effects and integrates seamlessly with corporate branding palettes. Use the 3D hexagon infographic to visualize timelines, feature comparisons, performance metrics, or sales funnels with minimal design effort.
Who is it for
Strategy consultants, project managers, and product teams seeking a dynamic way to visualize four-step processes, project phases, or workflow stages in a presentation.
Other Uses
Use this 3D hexagon infographic to highlight feature comparisons, milestone timelines, sales funnel stages, performance metrics, or marketing objectives with striking visual impact and minimal design effort.
Login to download this file

Item ID
SB01640
Related Templates

Free Blue Hexagonal Abstract Presentation Template for PowerPoint & Google Slides
Pitch Deck
Free

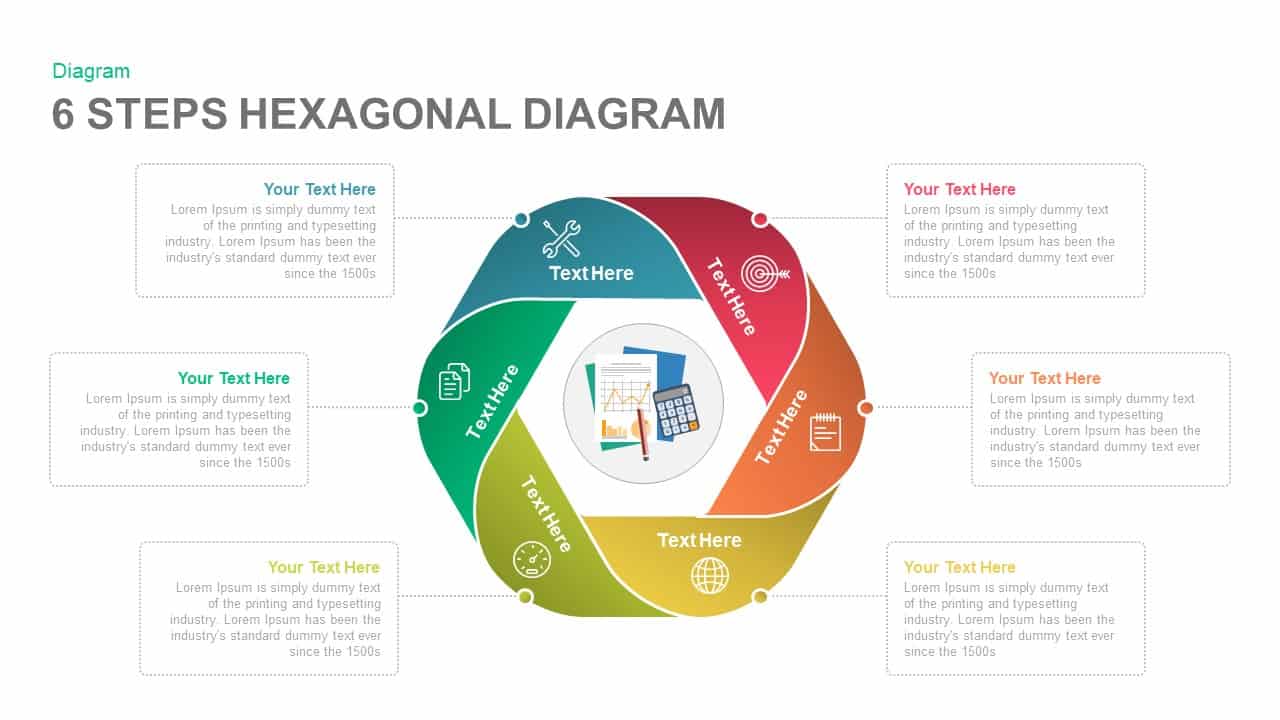
Six-Step Hexagonal Diagram Slide Template for PowerPoint & Google Slides
Circular
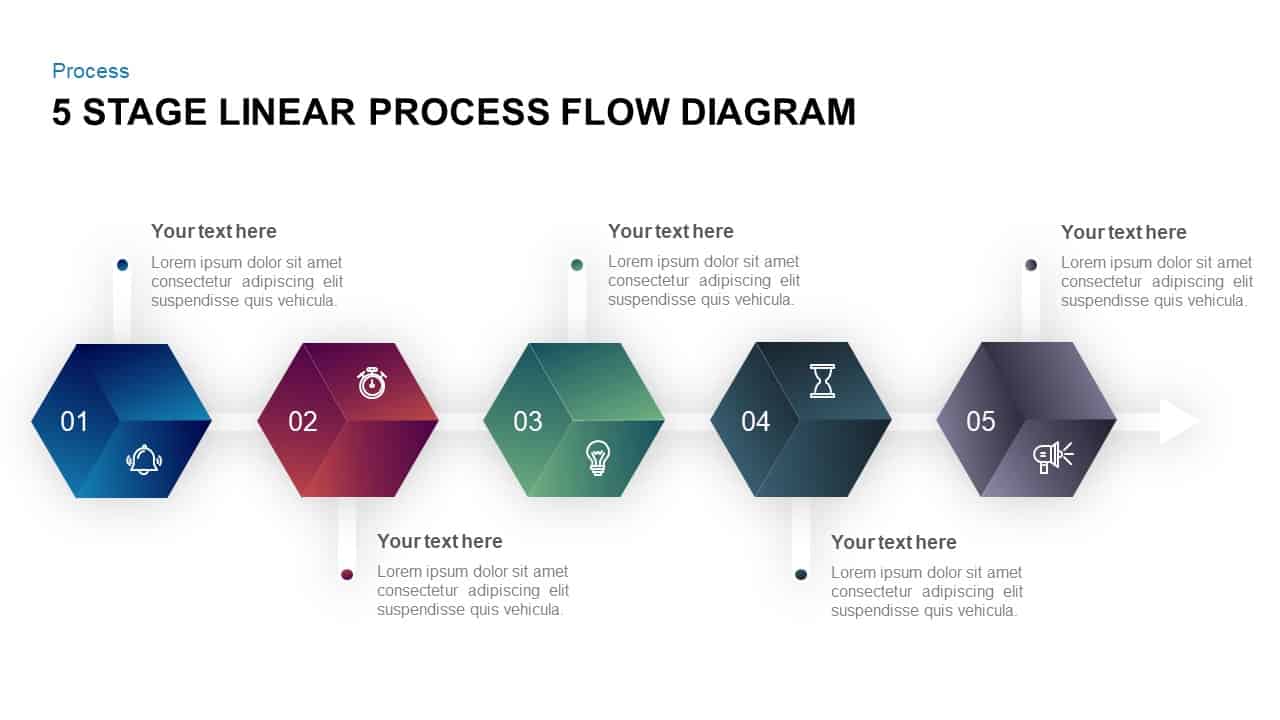
Five-Step Hexagonal Process Flow Template for PowerPoint & Google Slides
Process
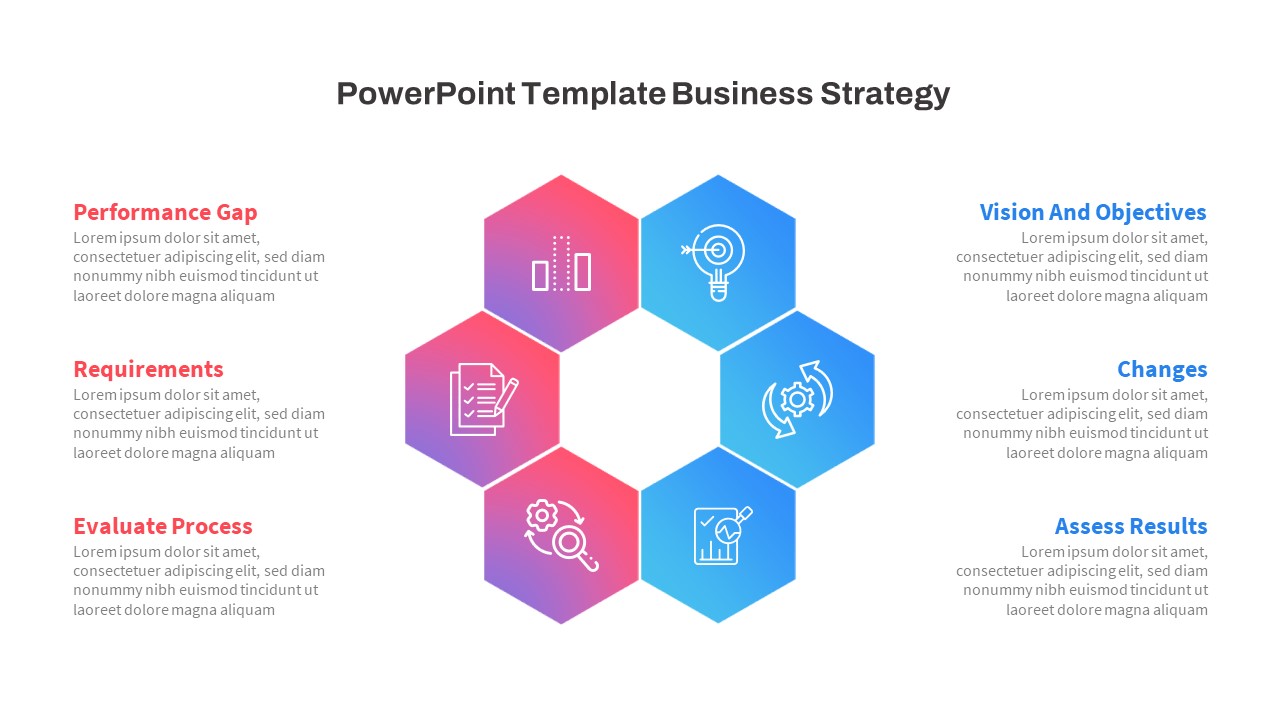
Free Hexagonal Six-Step Business Strategy Template for PowerPoint & Google Slides
Process
Free
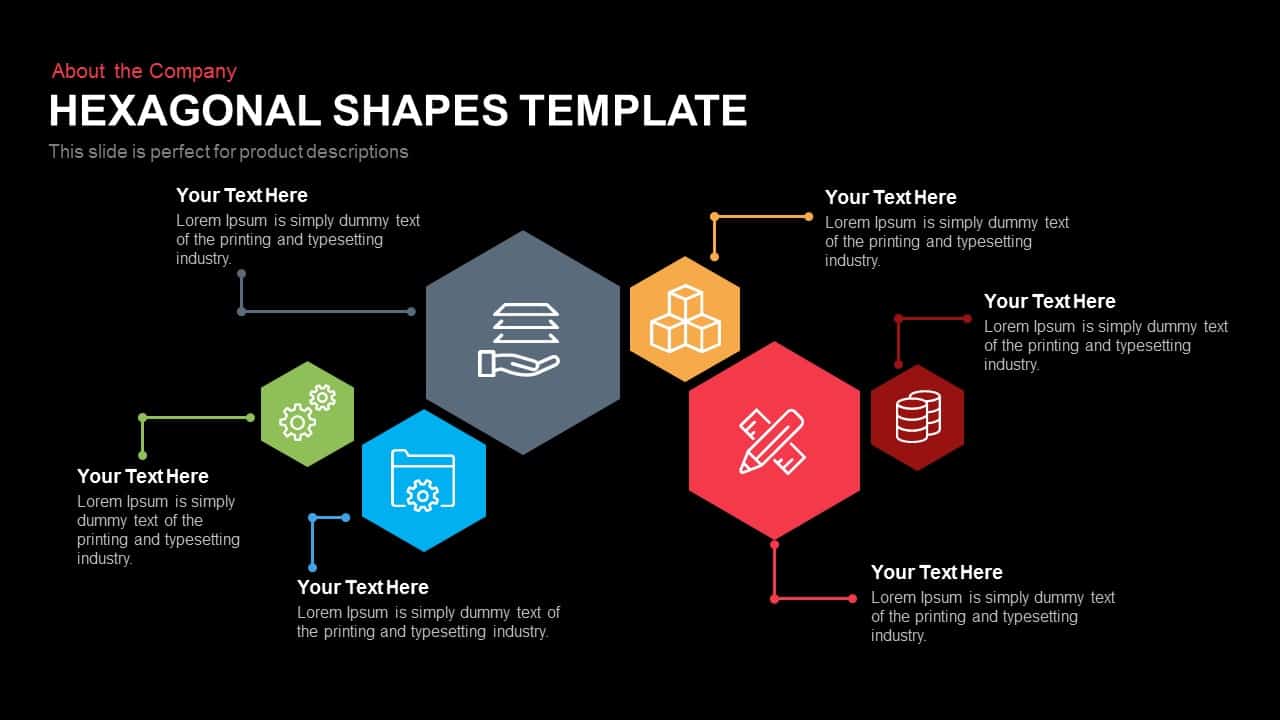
Hexagonal Shapes Infographic Diagram Template for PowerPoint & Google Slides
Process
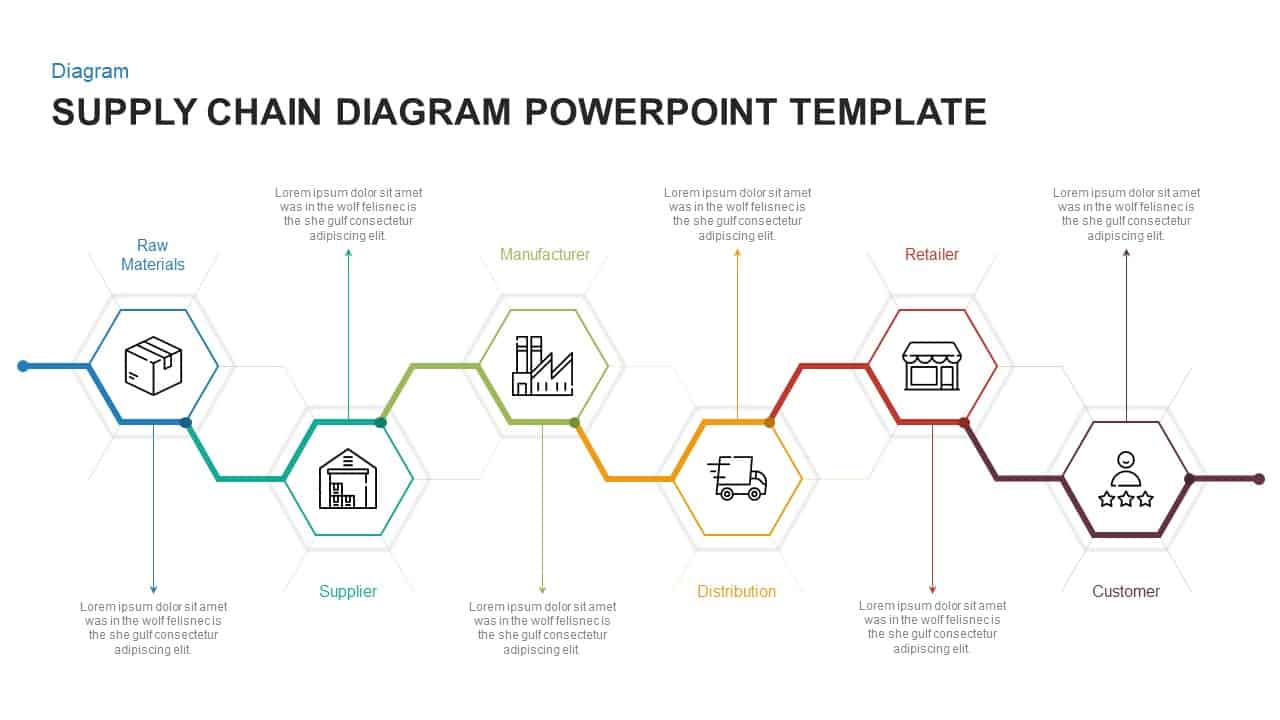
Hexagonal Supply Chain Diagram Template for PowerPoint & Google Slides
Process
Hexagonal Process Flow Template for PowerPoint & Google Slides
Process
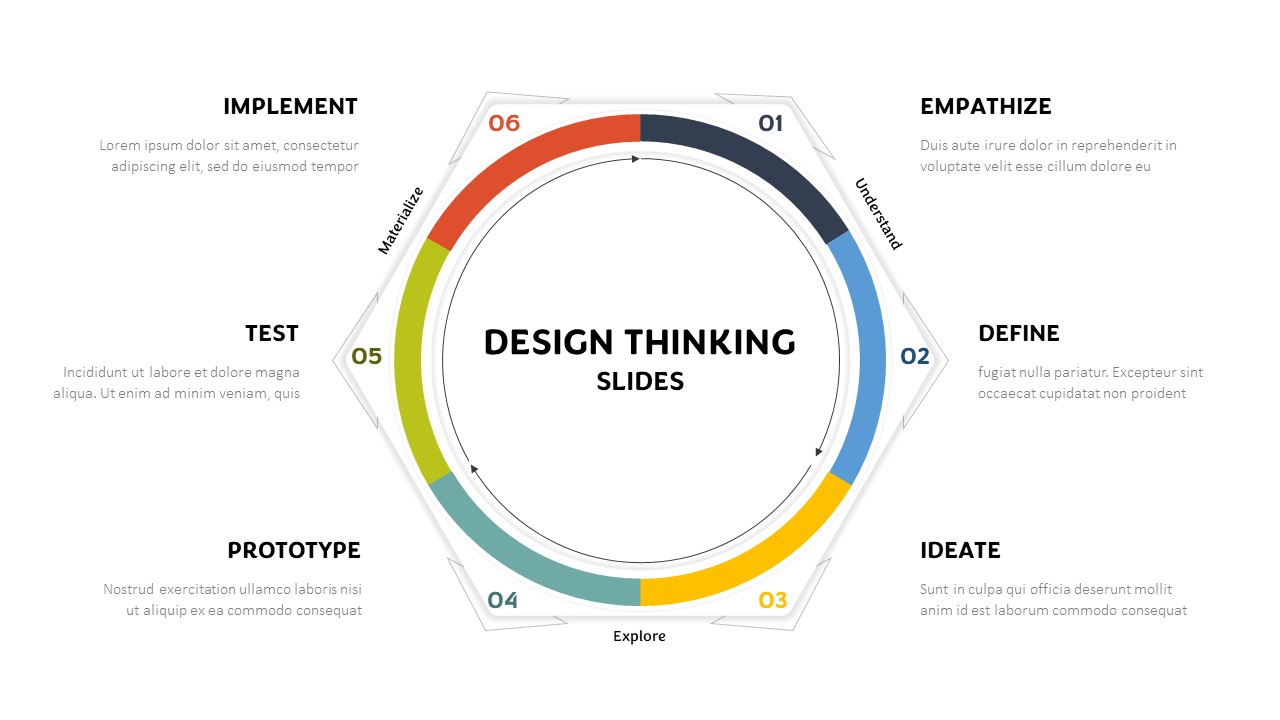
Hexagonal Design Thinking Cycle Template for PowerPoint & Google Slides
Process
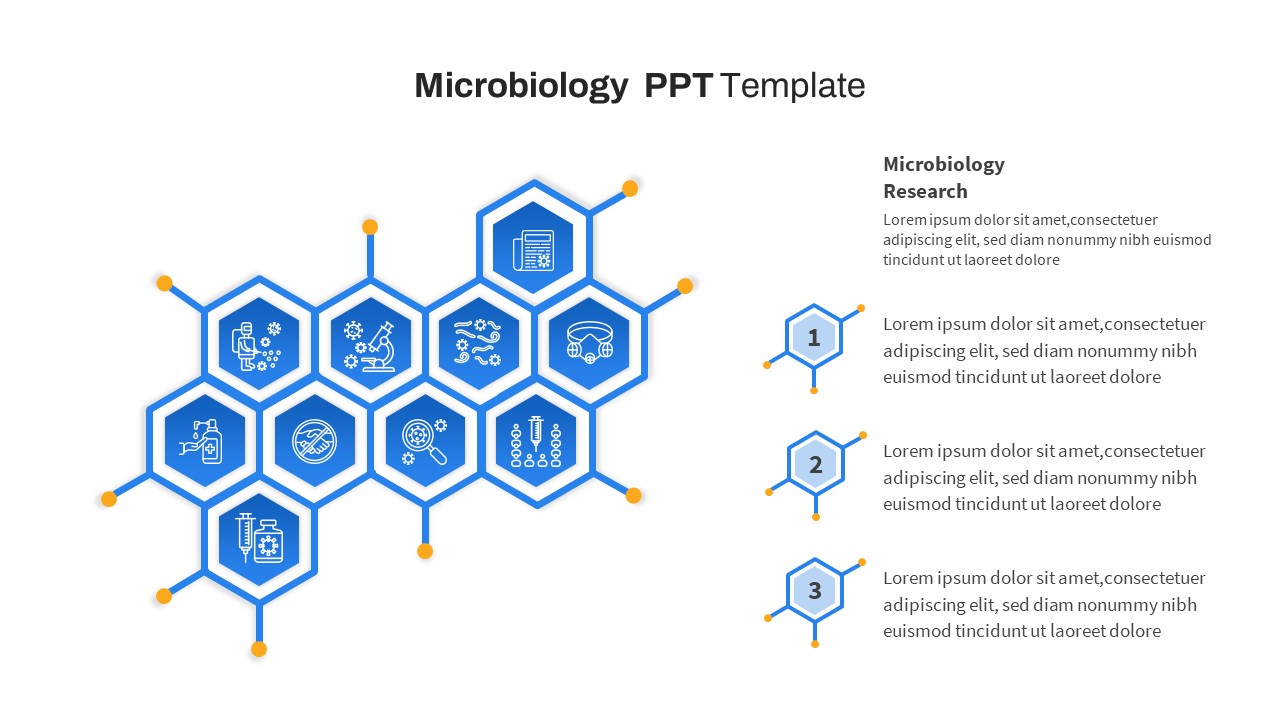
Free Hexagonal Microbiology Research Process Template for PowerPoint & Google Slides
Process
Free
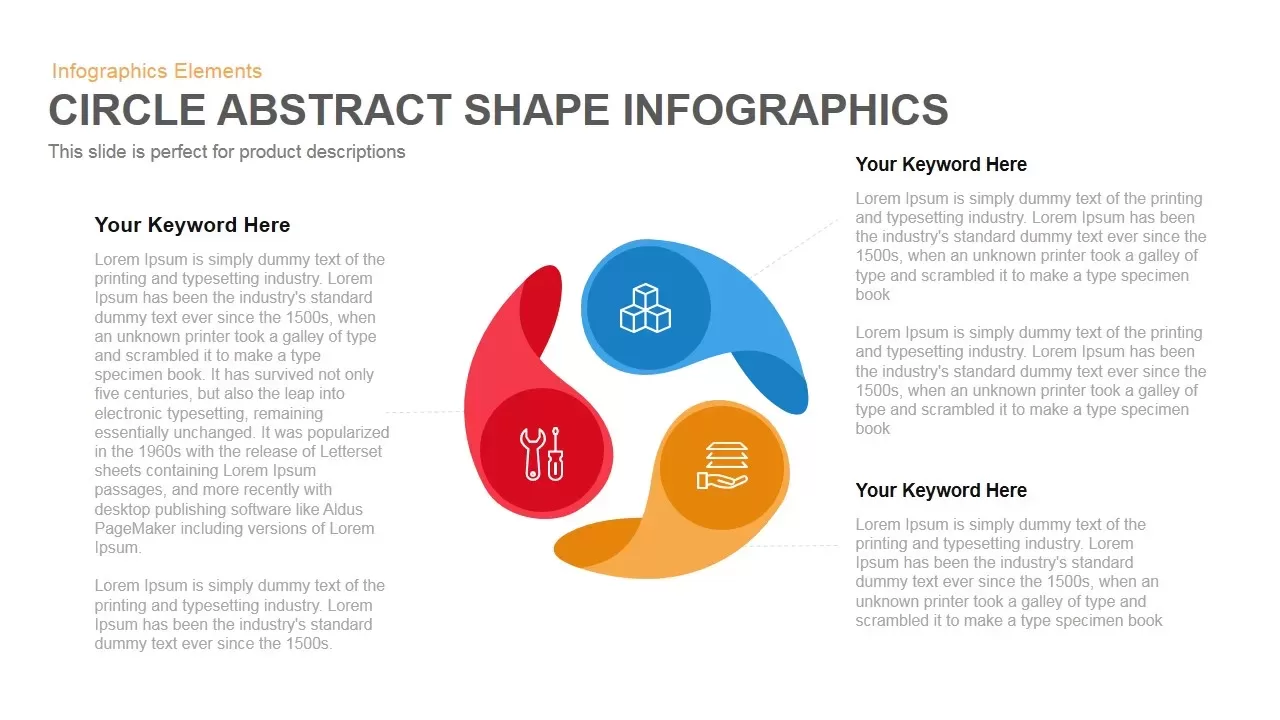
Circle Abstract Shape Infographics Template for PowerPoint & Google Slides
Circular
Create Your Own Abstract Photo Mask Template for PowerPoint & Google Slides
Pitch Deck
Creative Blue Blobs Abstract Title Slide Template for PowerPoint & Google Slides
Company Profile
Free Black & White Abstract Backgrounds Template for PowerPoint & Google Slides
Pitch Deck
Free
Abstract Geometric Gradient Presentation Template for PowerPoint & Google Slides
Pitch Deck
Abstract Gradient Presentation Template for PowerPoint & Google Slides
Pitch Deck
Dynamic Abstract Corporate Theme Template for PowerPoint & Google Slides
Decks

Modern Abstract Blue Wave Theme Template for PowerPoint & Google Slides
Decks
Abstract Dark Gradient Presentation Template for PowerPoint & Google Slides
Pitch Deck
Soft Abstract Minimal Background Theme for PowerPoint & Google Slides
Company Profile
Vibrant Abstract Gradient Theme for PowerPoint & Google Slides
Decks
Abstract Neon Slide Deck for PowerPoint & Google Slides
Decks

Gradient Abstract Business Deck for PowerPoint & Google Slides
Decks
Creative Abstract Theme for PowerPoint & Google Slides
Decks
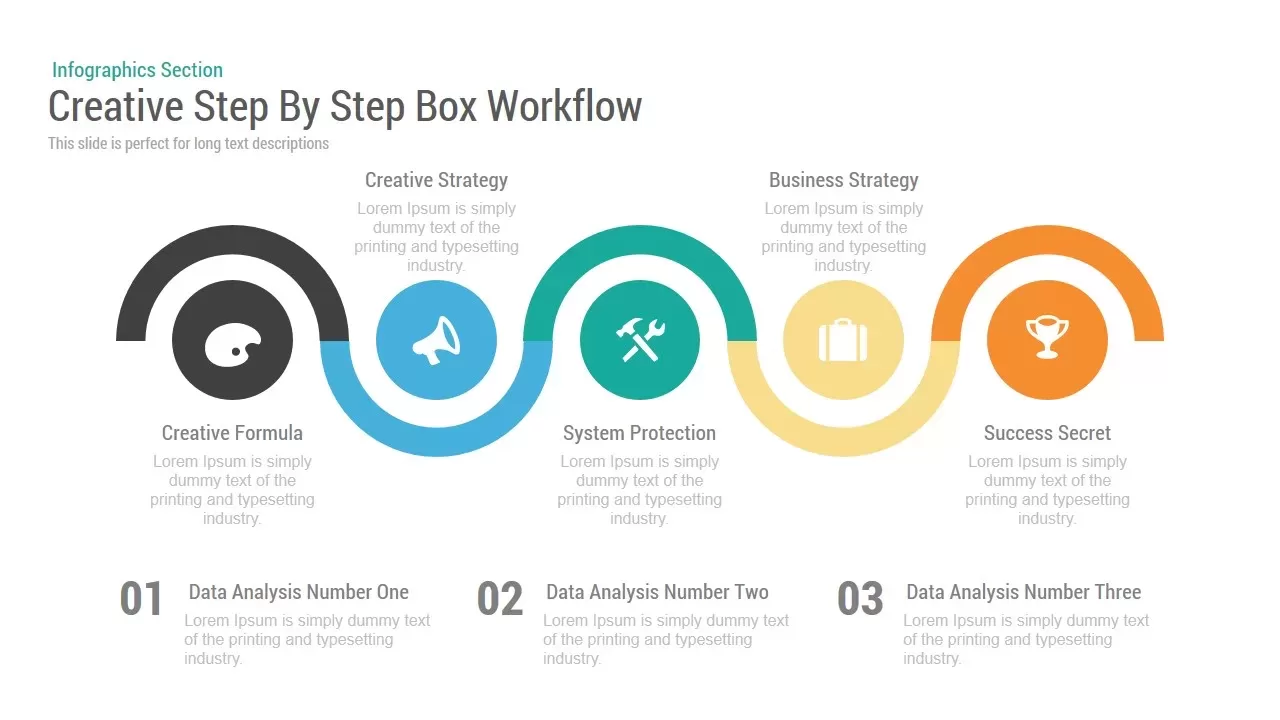
Creative Step By Step Workflow template for PowerPoint & Google Slides
Process
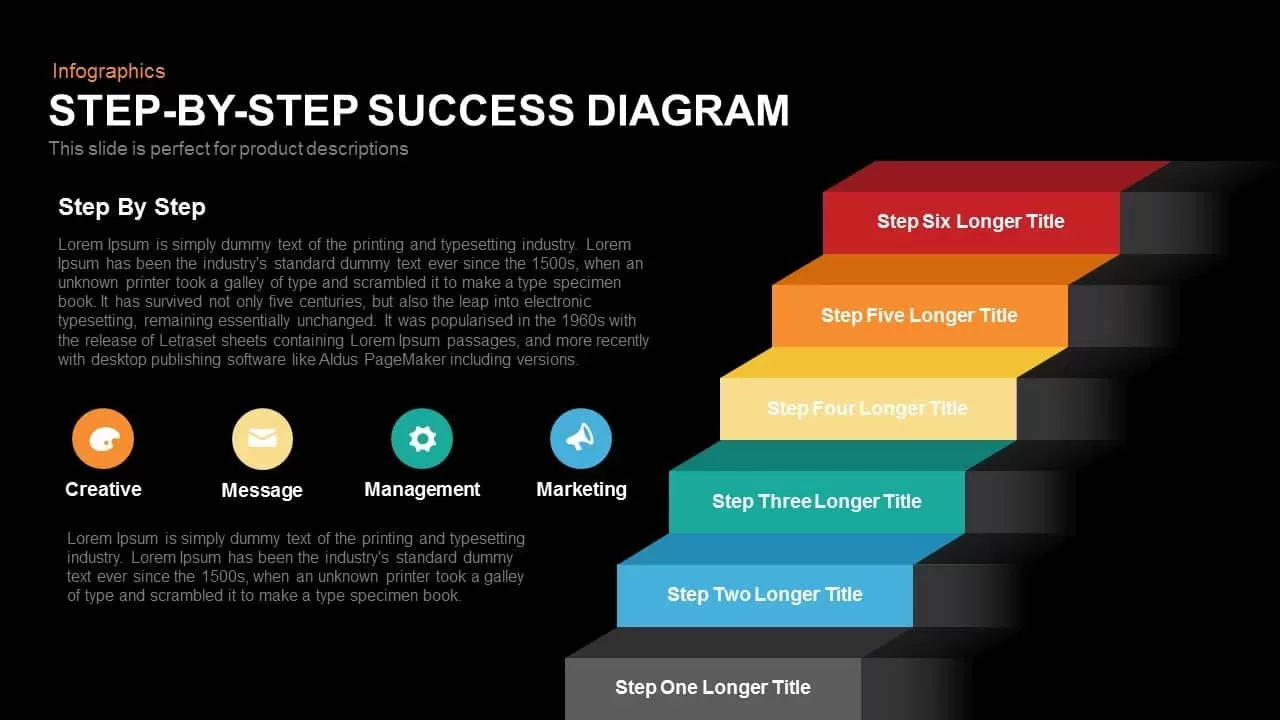
Step-by-Step Success Staircase Diagram template for PowerPoint & Google Slides
Process
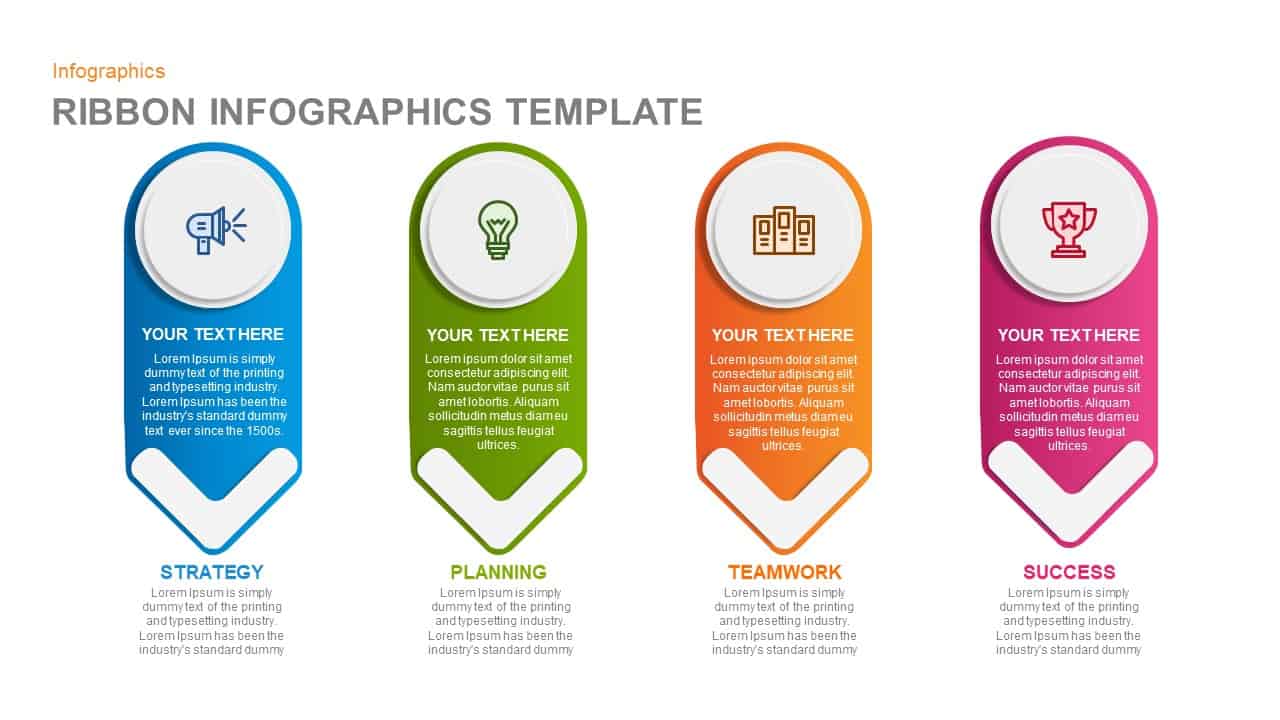
Ribbon Infographics Step-by-Step Process Template for PowerPoint & Google Slides
Process
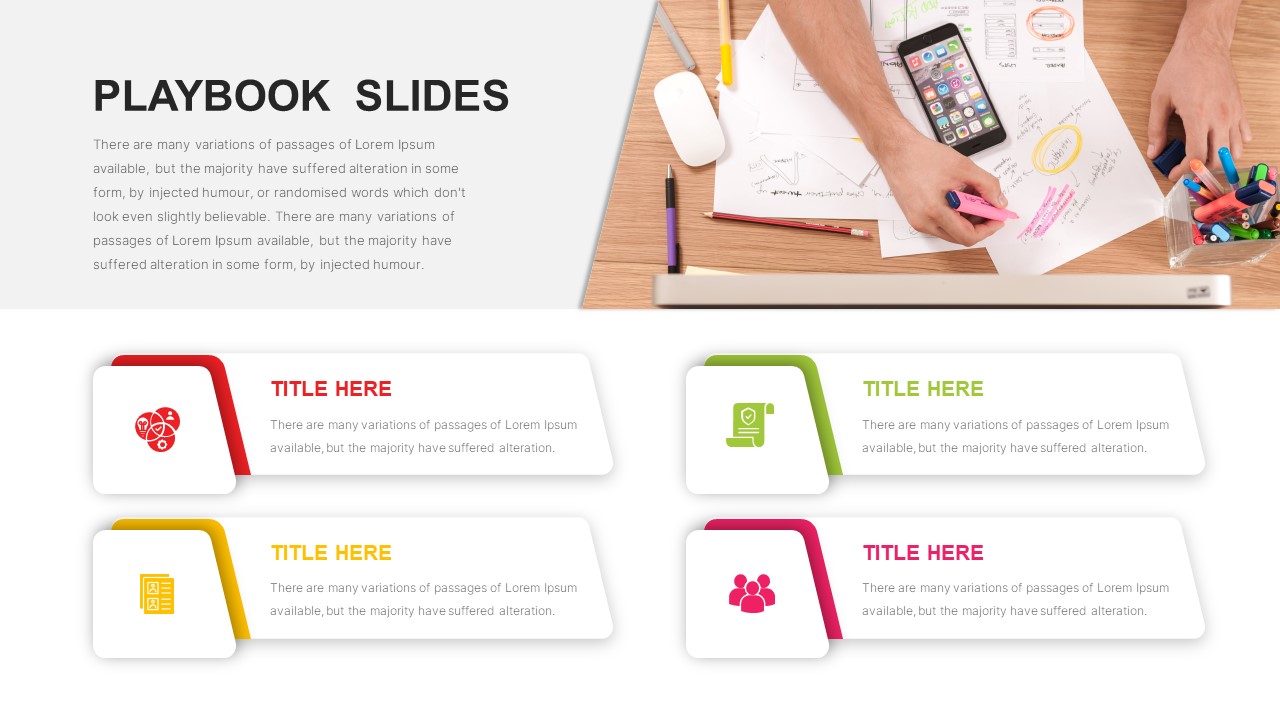
Sales Playbook Step-by-Step Process Template for PowerPoint & Google Slides
Process
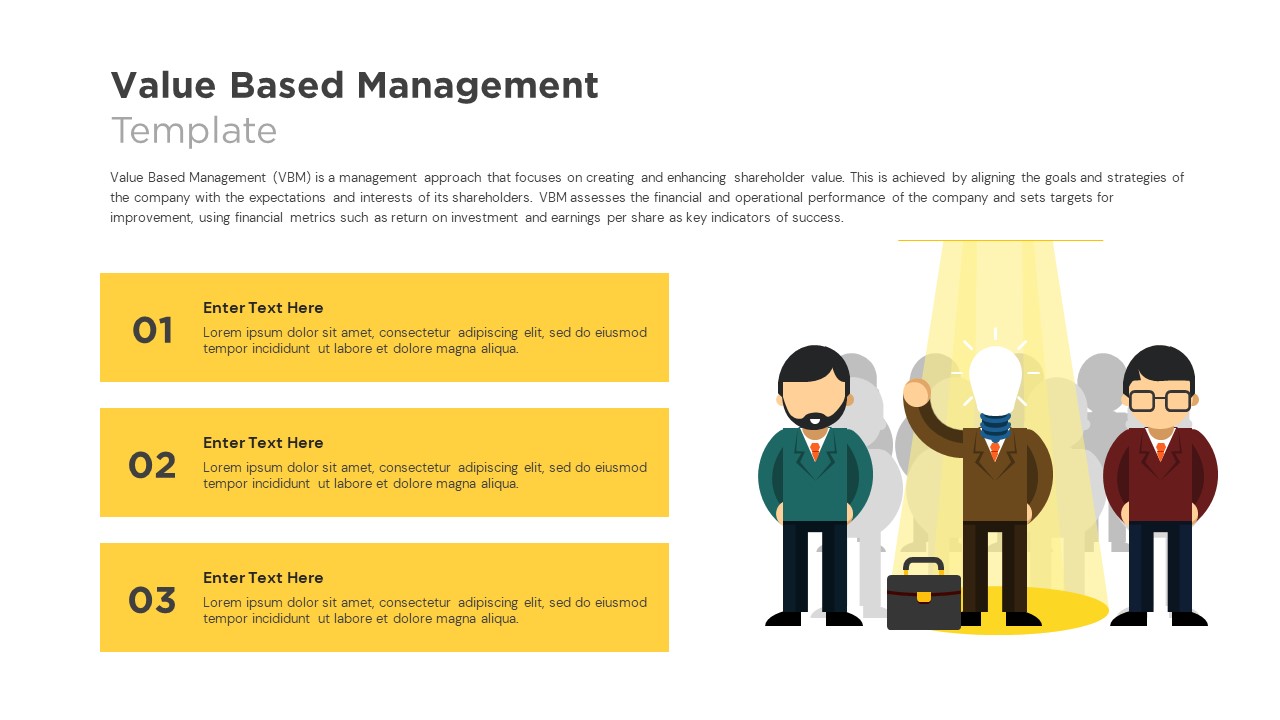
Value Based Management Step-by-Step Template for PowerPoint & Google Slides
Business Strategy
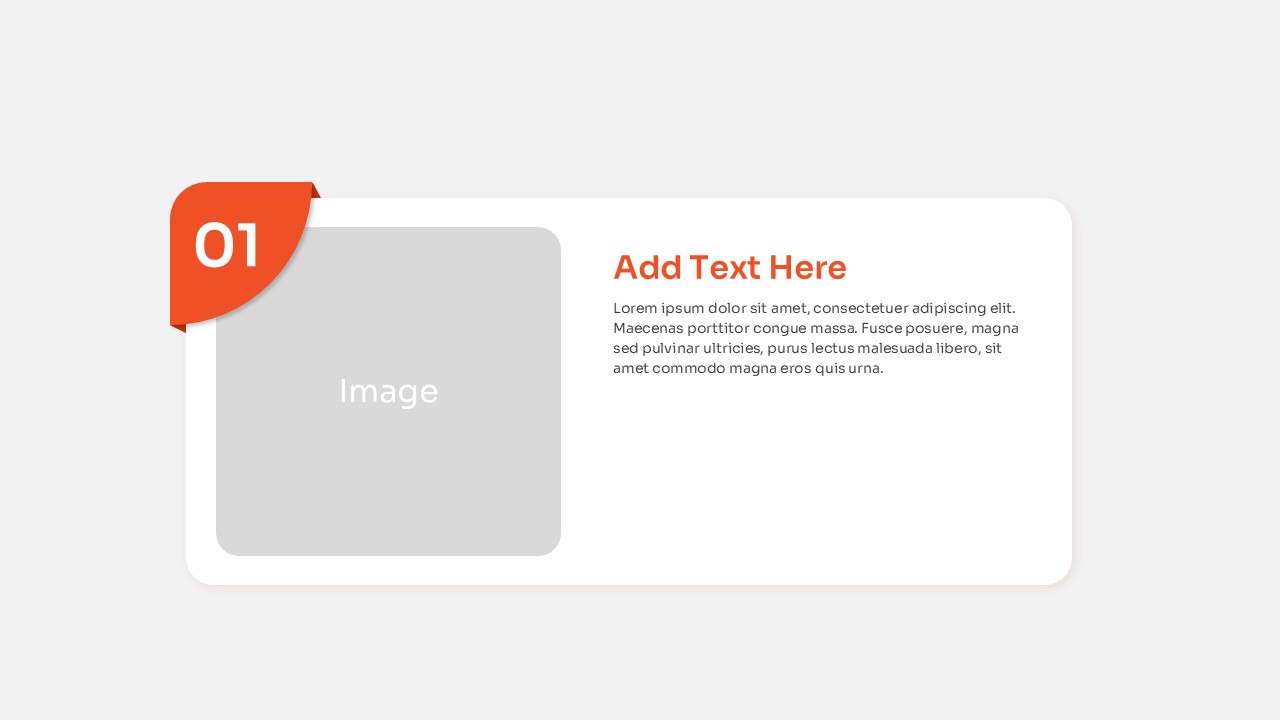
Top 10 Step-by-Step Image & Text Layouts Template for PowerPoint & Google Slides
Graphics
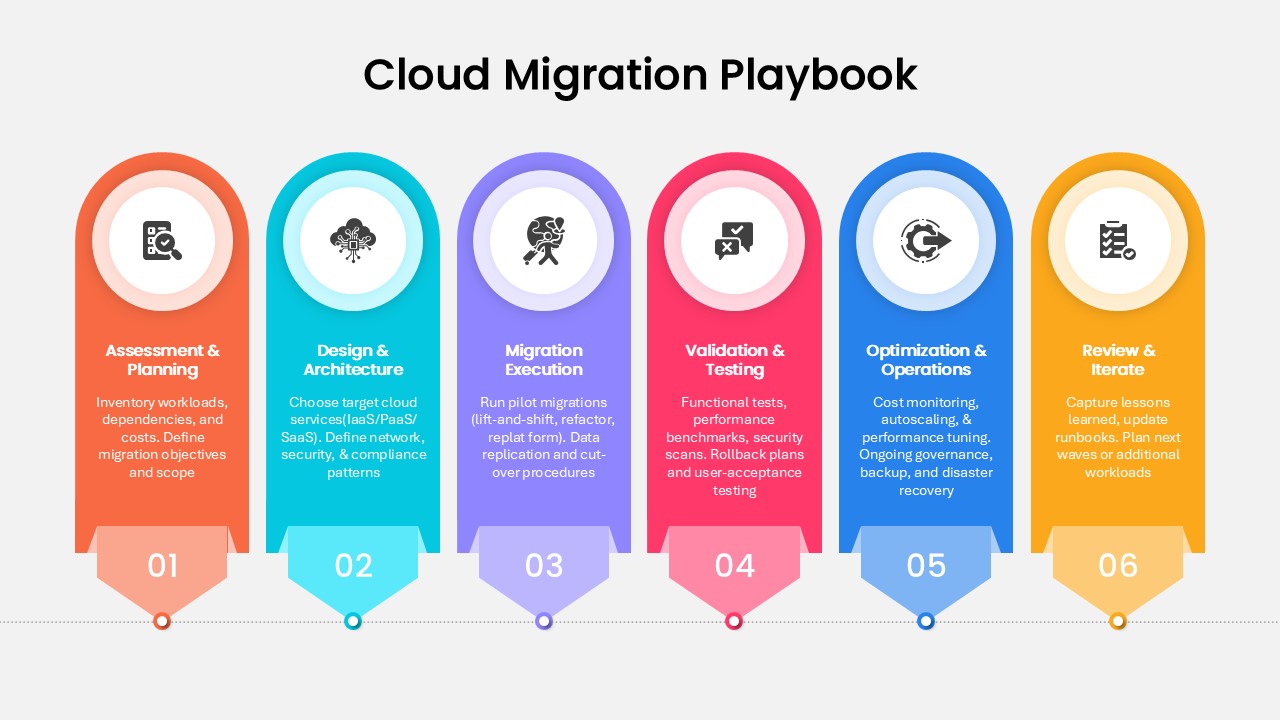
Step-by-Step Cloud Migration Playbook Template for PowerPoint & Google Slides
Cloud Computing
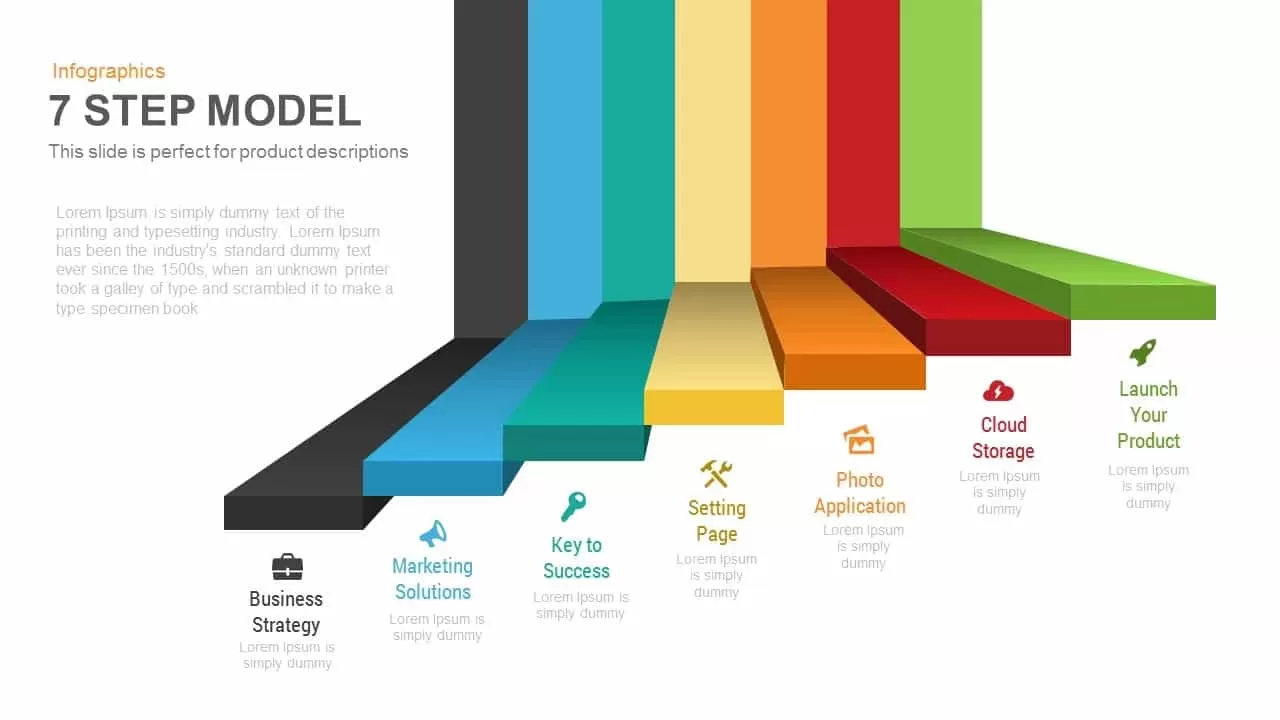
7-Step 3D Process Infographic Model template for PowerPoint & Google Slides
Process
5-Step Growth Staircase Infographic Template for PowerPoint & Google Slides
Process
Dual-Side Three-Step Ribbon Infographic Template for PowerPoint & Google Slides
Comparison
Eight-Step Circular Diagram Infographic Template for PowerPoint & Google Slides
Circular
Four-Step Arrow Process Infographic Template for PowerPoint & Google Slides
Arrow
Four-Option 4-Step Arrow Infographic Template for PowerPoint & Google Slides
Arrow
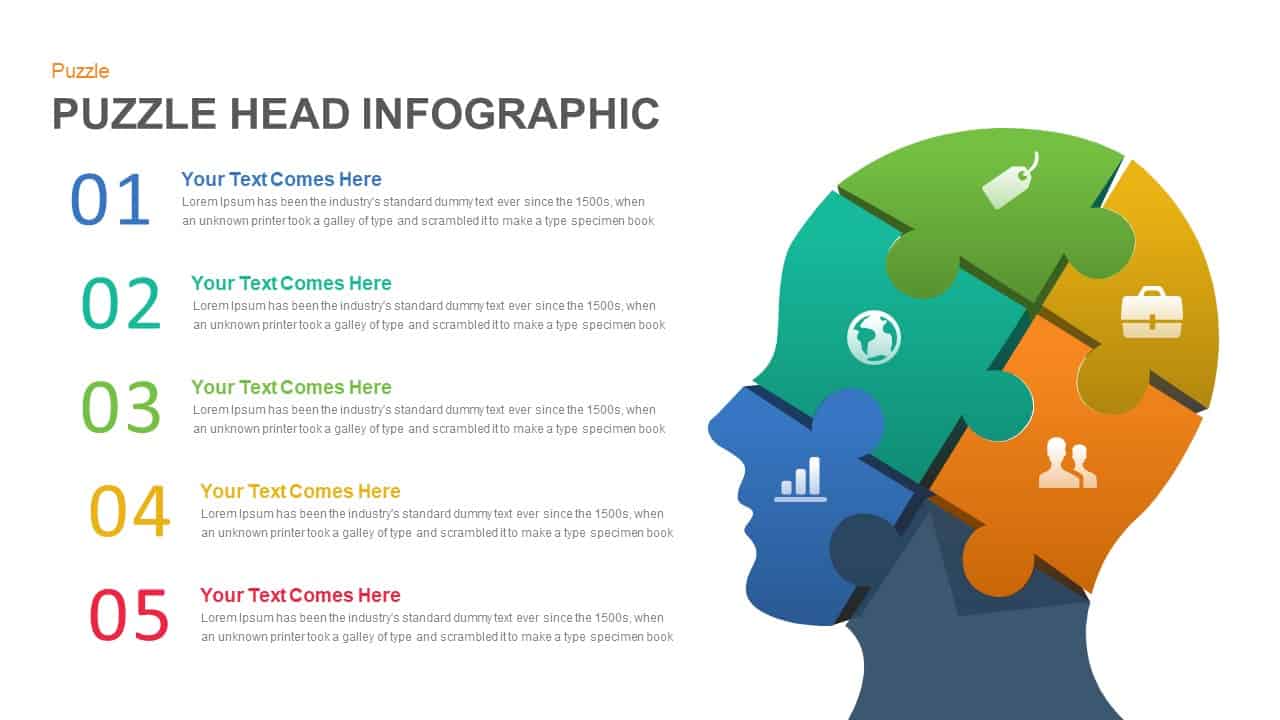
Five-Step Puzzle Head Infographic Template for PowerPoint & Google Slides
Process
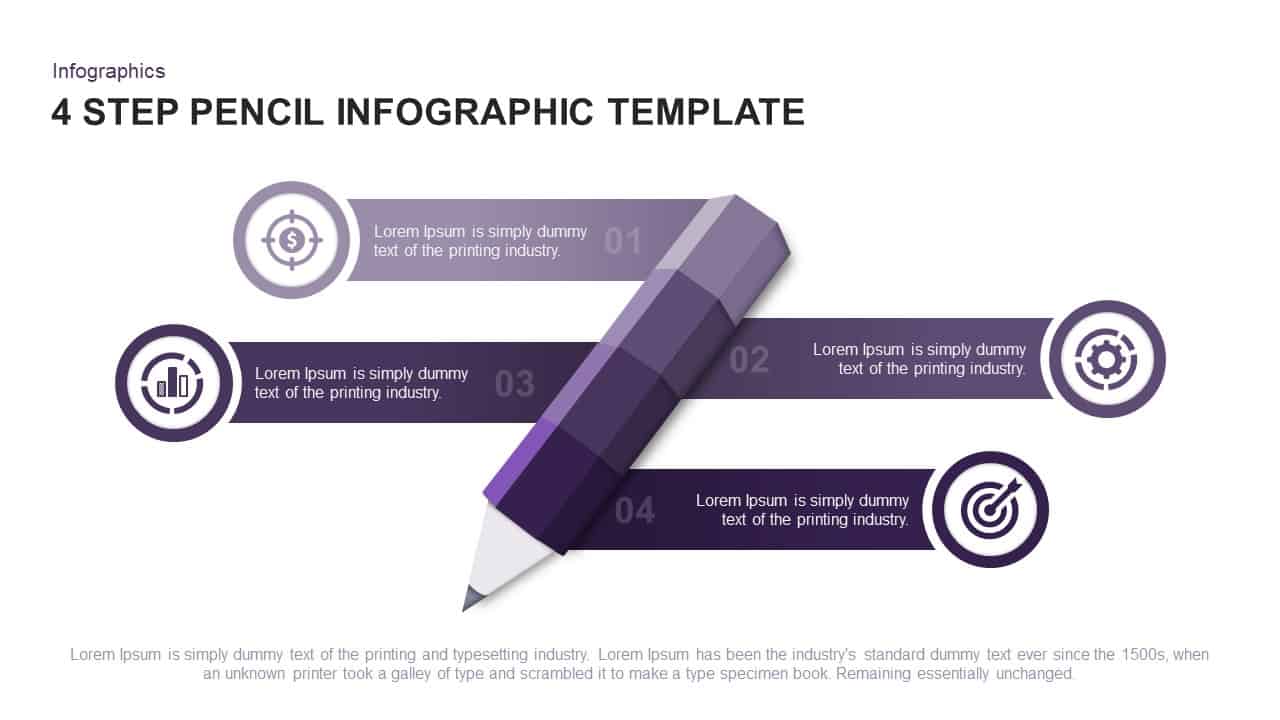
Four-Step Pencil Infographic Process Template for PowerPoint & Google Slides
Process
Dynamic Growth Arrow Step Infographic Template for PowerPoint & Google Slides
Process
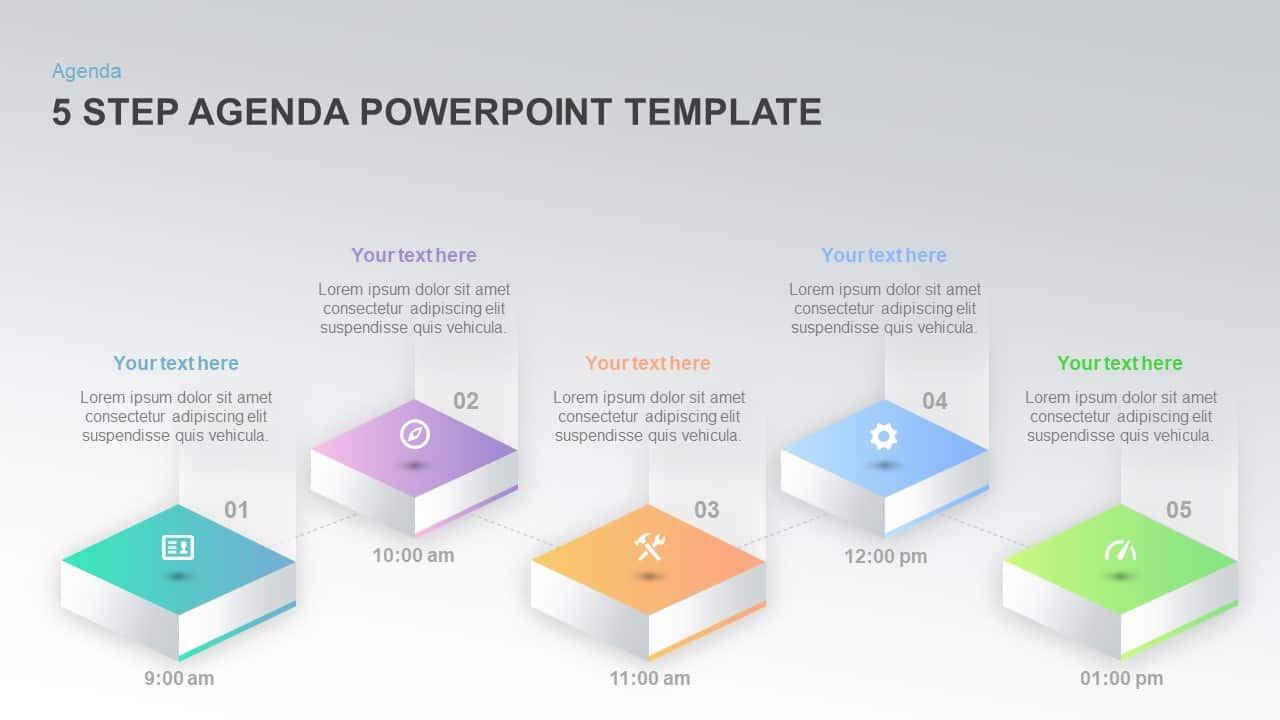
Five-Step Agenda Infographic Template for PowerPoint & Google Slides
Agenda
Five-Step Growth Infographic Slide Template for PowerPoint & Google Slides
Process
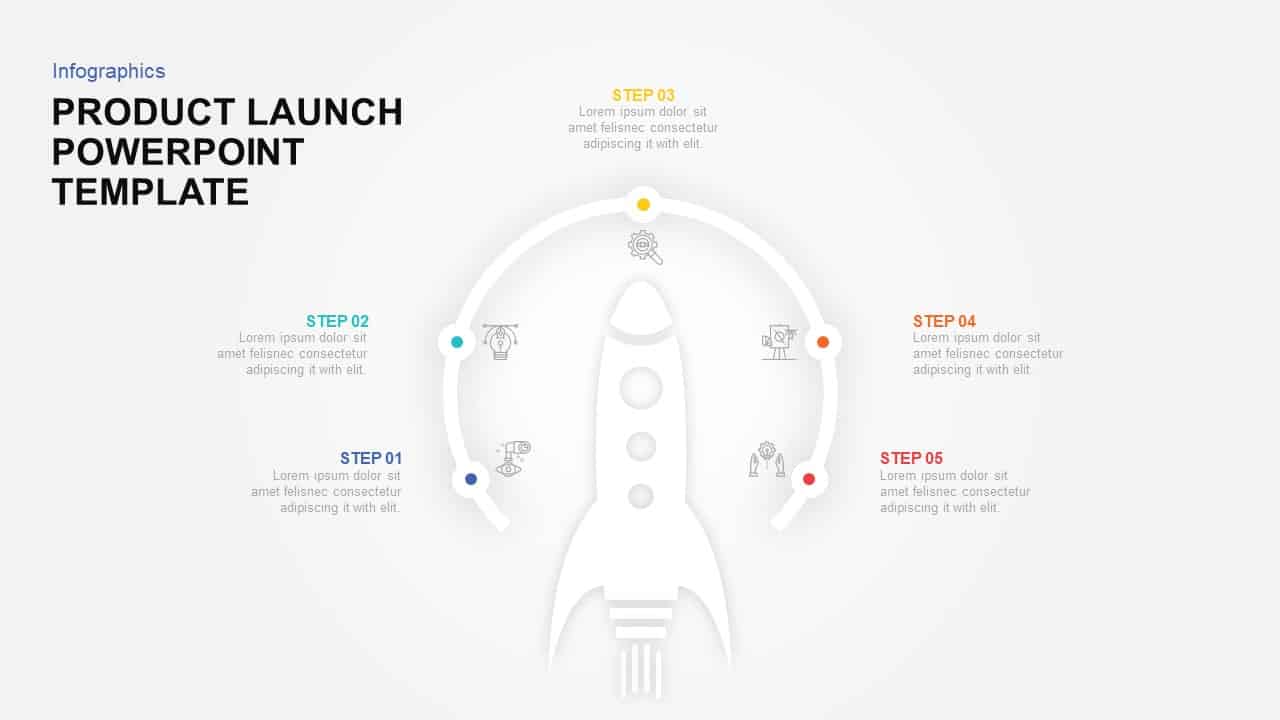
Product Launch 5-Step Rocket Infographic Template for PowerPoint & Google Slides
Process
Circular Three-Step Infographic Diagram Template for PowerPoint & Google Slides
Circular
Five-Step Growth Timeline Infographic Template for PowerPoint & Google Slides
Timeline
Vertical Four-Step Process Infographic Template for PowerPoint & Google Slides
Process
Gradient 5-Step Infographic Process Template for PowerPoint & Google Slides
Process
Shape Loop Four-Step Infographic Slide Template for PowerPoint & Google Slides
Process
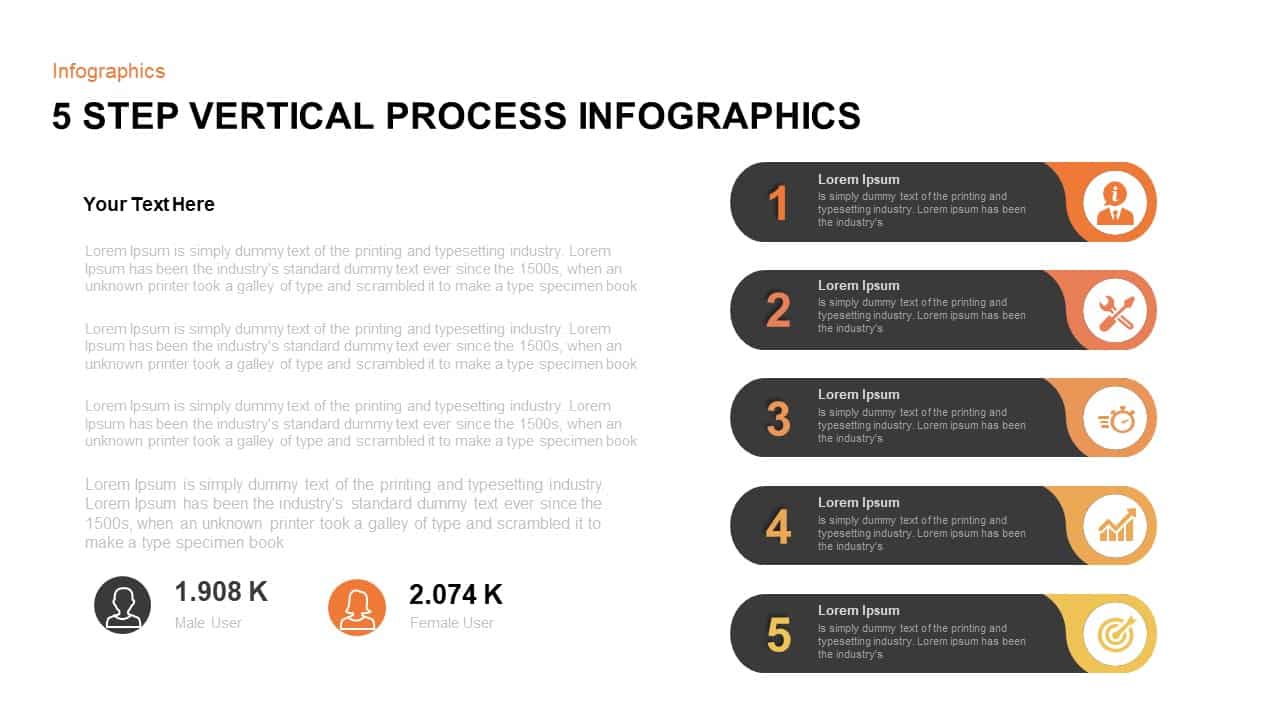
Five-Step Vertical Process Infographic Template for PowerPoint & Google Slides
Process
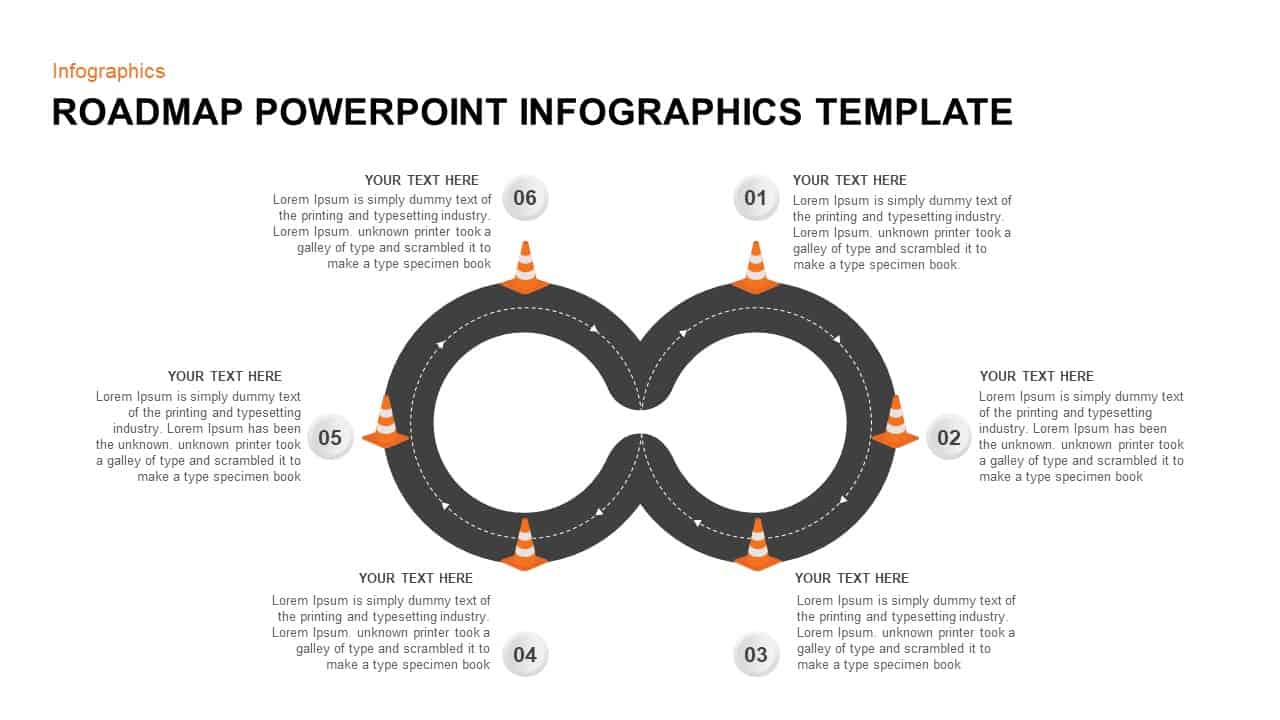
Six-Step Roadmap Infographic Template for PowerPoint & Google Slides
Roadmap
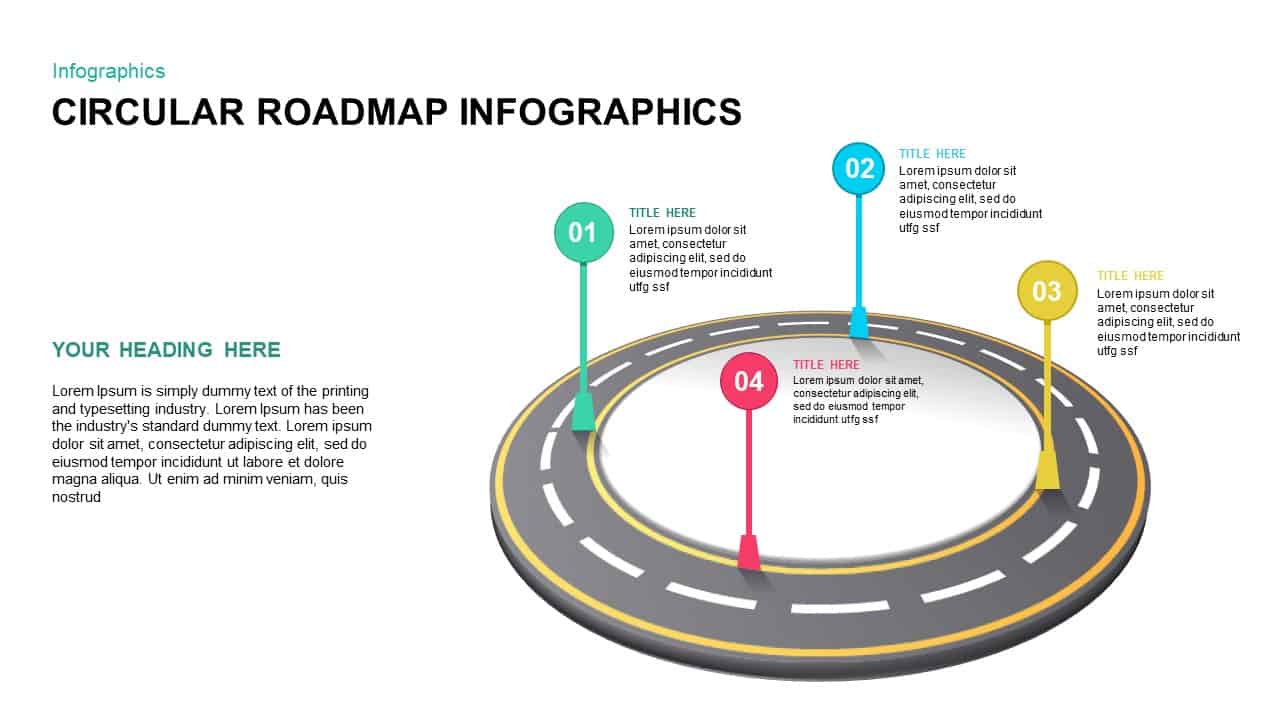
4-Step Circular Roadmap Infographic Template for PowerPoint & Google Slides
Roadmap
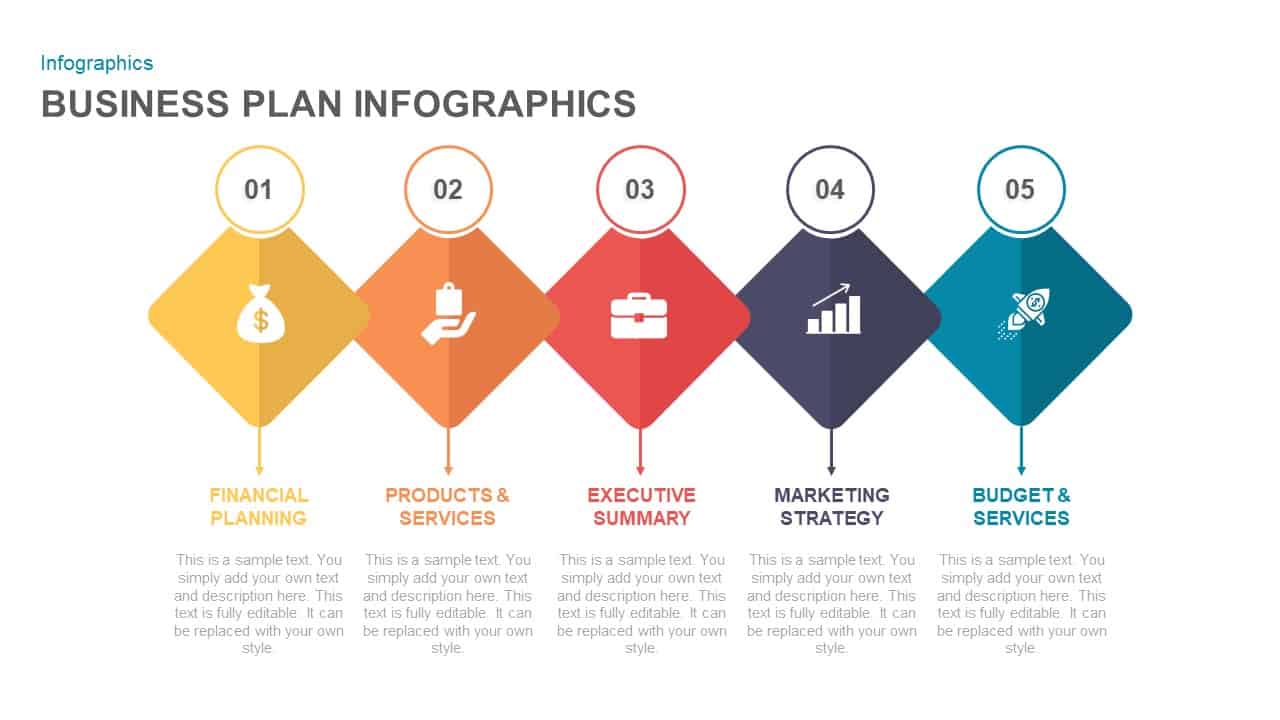
Five-Step Business Plan Infographic Template for PowerPoint & Google Slides
Business Plan
Four Step Process Infographic Slide Template for PowerPoint & Google Slides
Process
Four-Step Hexagon Process Infographic Template for PowerPoint & Google Slides
Process
6-Step Circular Diagram Infographic Template for PowerPoint & Google Slides
Circular
8-Step Circular Gear Infographic Diagram Template for PowerPoint & Google Slides
Circular
Six-Step Tree Diagram Infographic Template for PowerPoint & Google Slides
Infographics
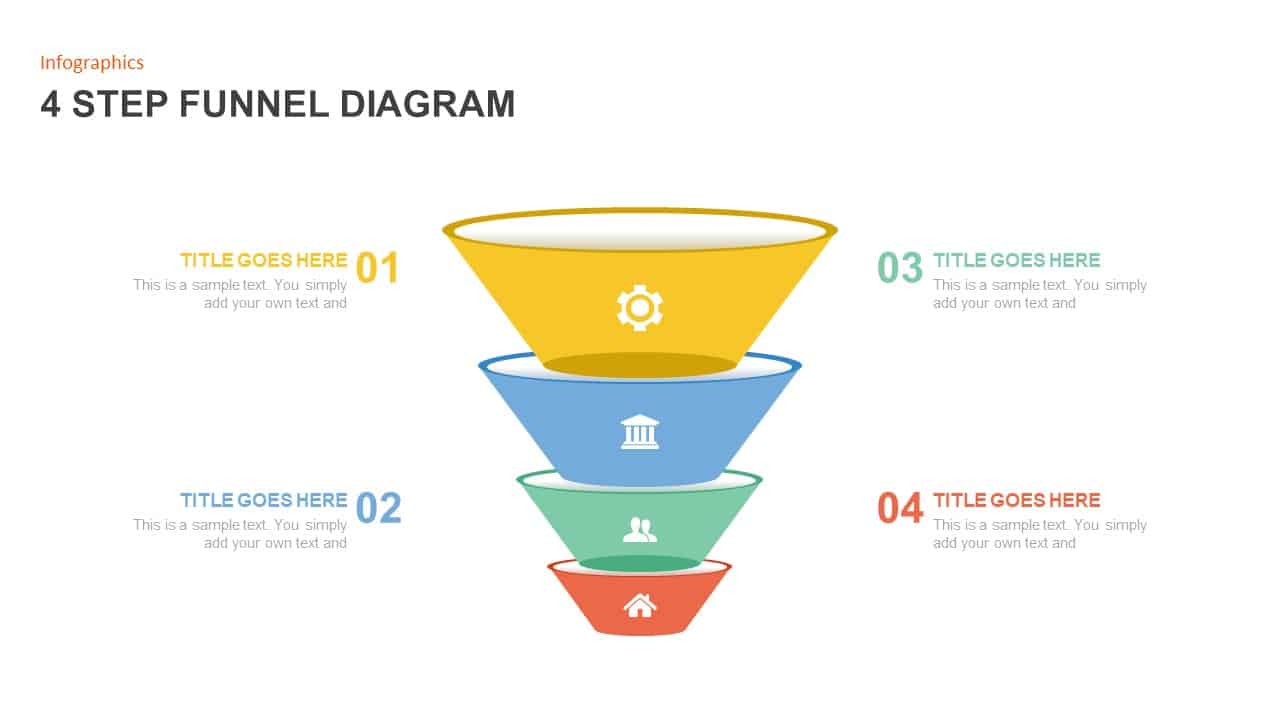
Four-Step Funnel Infographic Pack Template for PowerPoint & Google Slides
Funnel
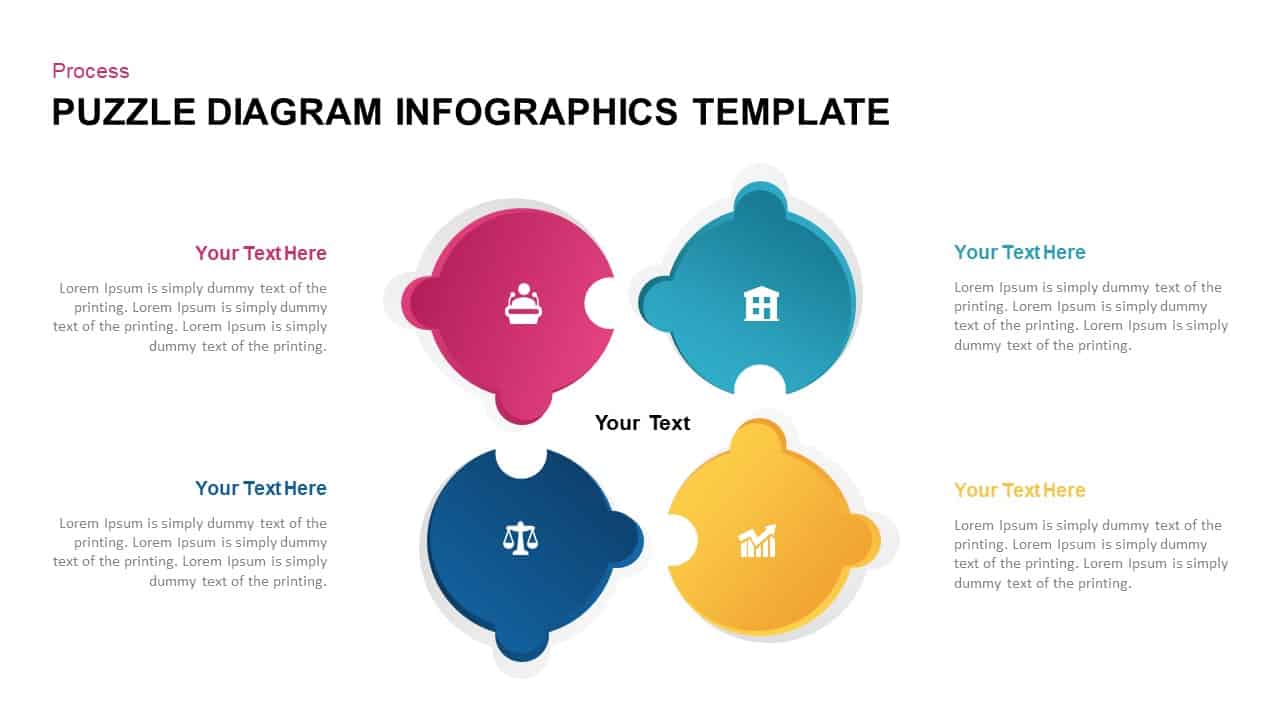
Four-Step Puzzle Diagram Infographic Template for PowerPoint & Google Slides
Process
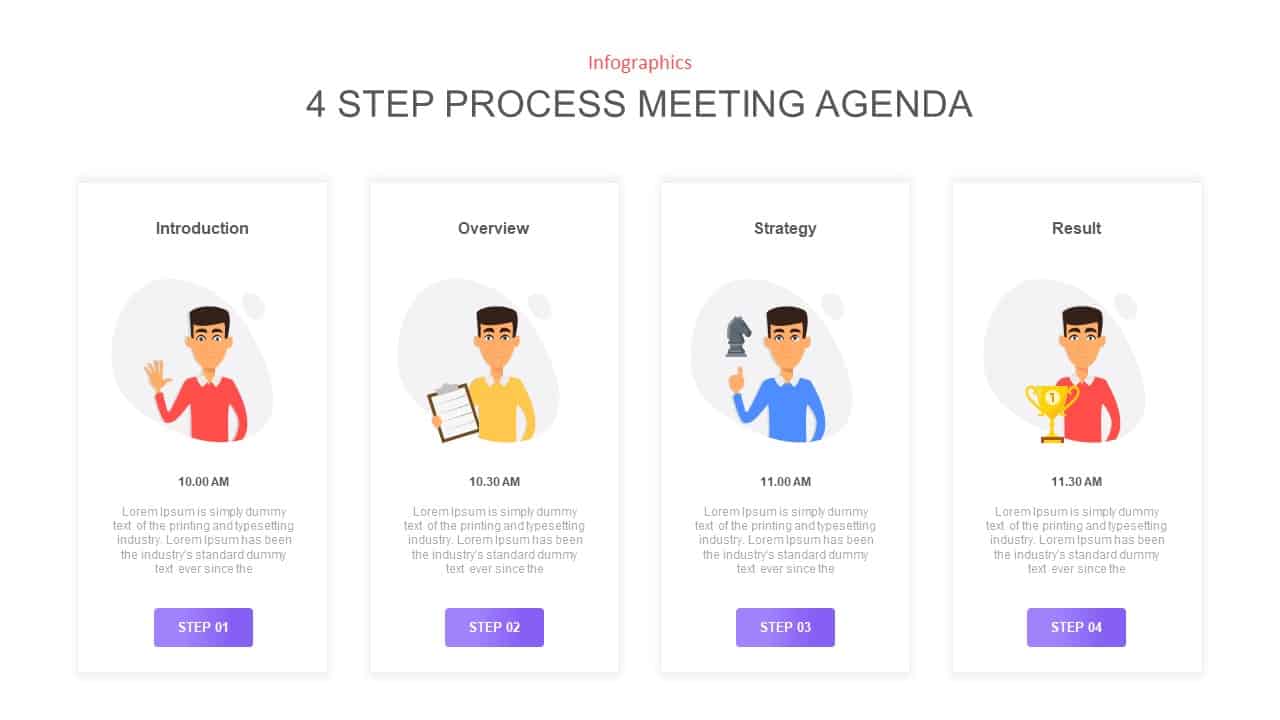
Four-Step Meeting Agenda Infographic Template for PowerPoint & Google Slides
Agenda
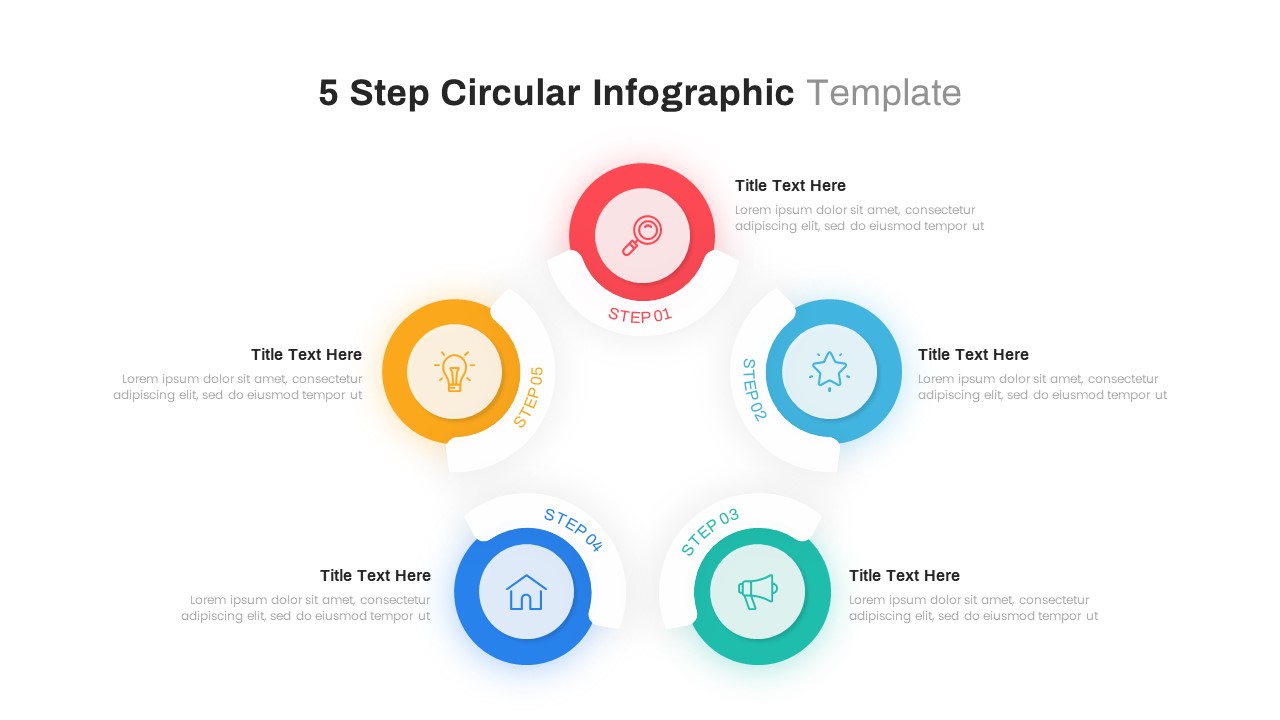
Five-Step Infographic Process and Agenda Template for PowerPoint & Google Slides
Process

4-Step Circular Infographic Diagram Template for PowerPoint & Google Slides
Circular
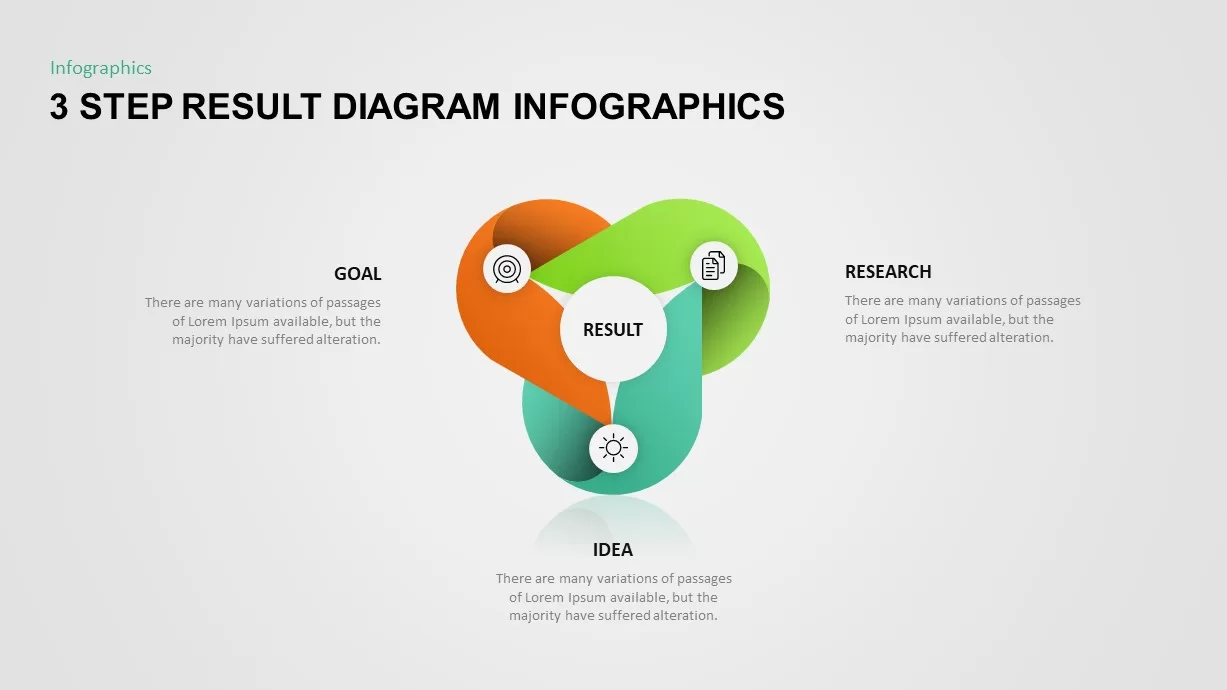
Three-Step Result Diagram Infographic Template for PowerPoint & Google Slides
Process
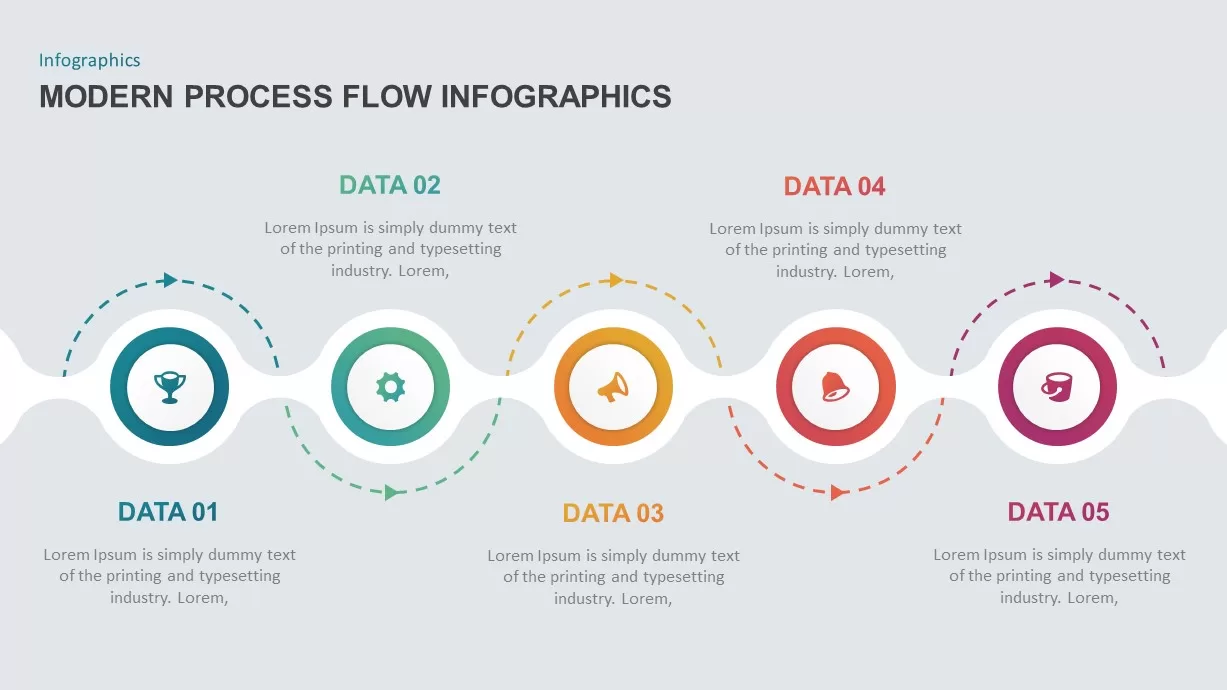
Modern 5-Step Process Flow Infographic Template for PowerPoint & Google Slides
Process
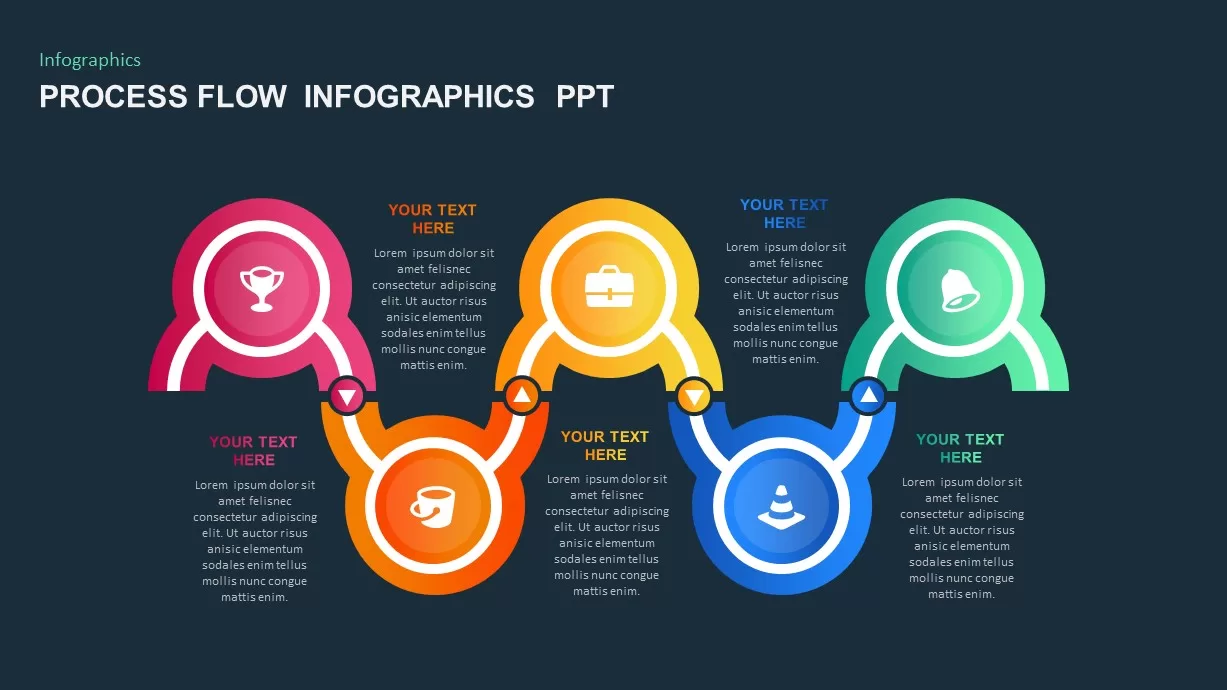
Five-Step Process Flow Infographic Template for PowerPoint & Google Slides
Process
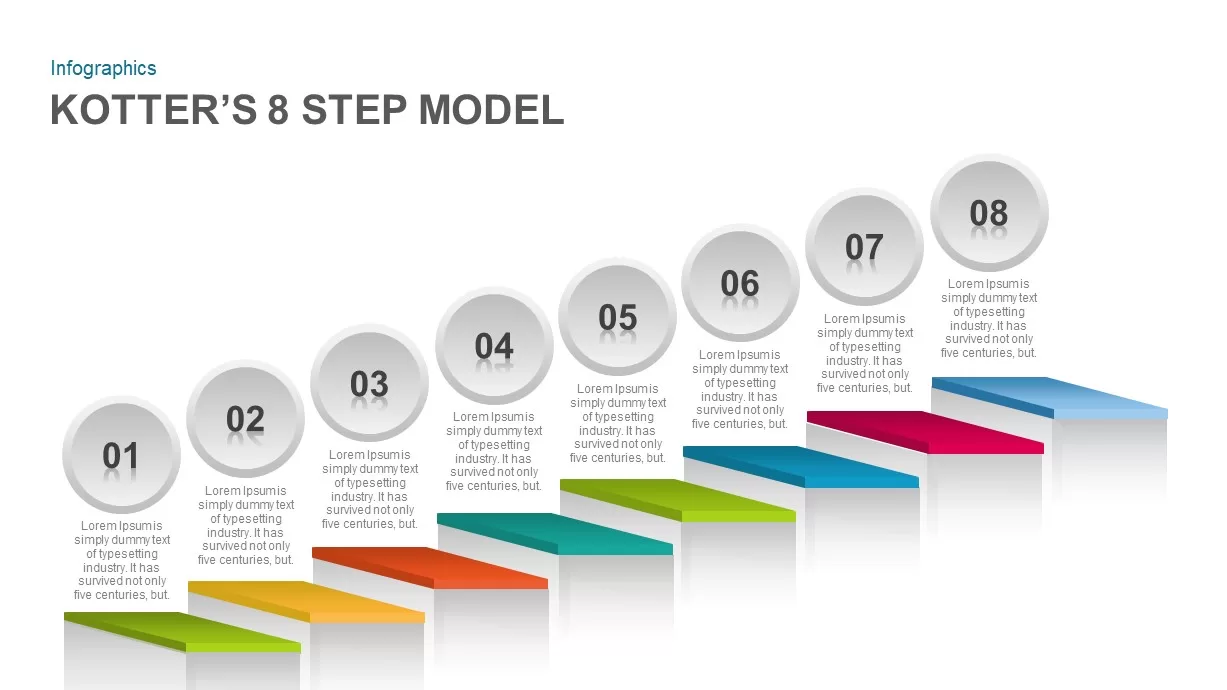
Kotter’s 8-Step Model Infographic Template for PowerPoint & Google Slides
Process
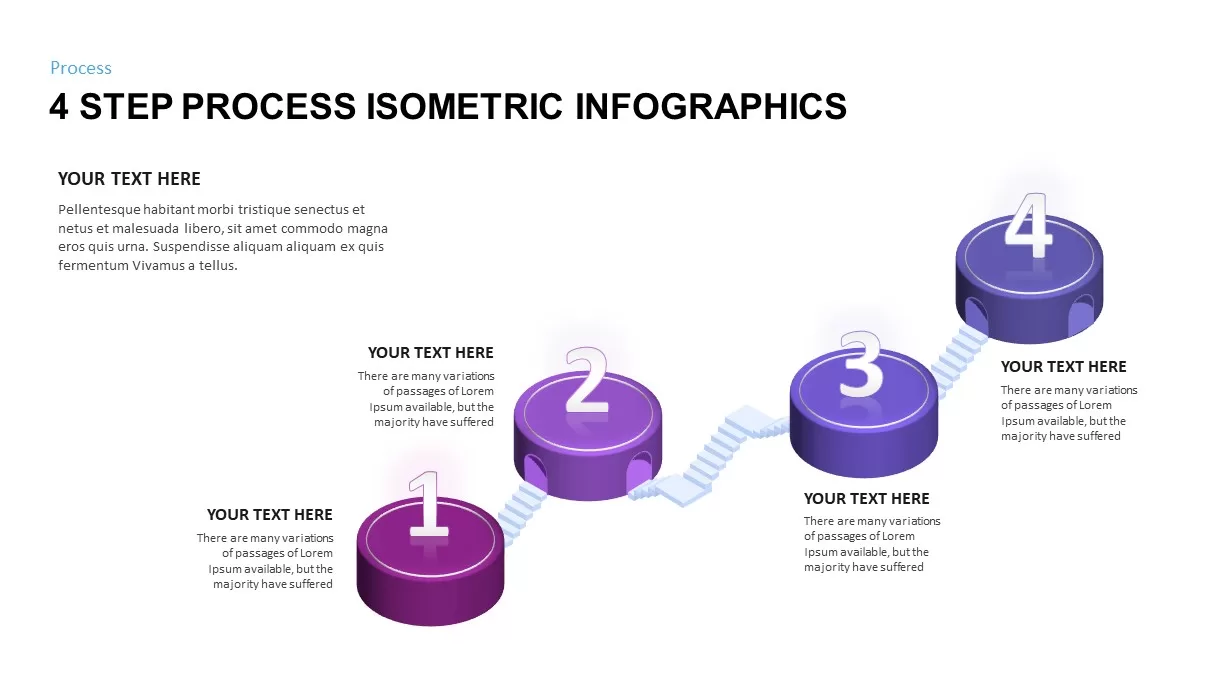
Four-Step Isometric Process Infographic Template for PowerPoint & Google Slides
Process
3, 4, 5 Step Infographic Template for PowerPoint & Google Slides
Business Proposal
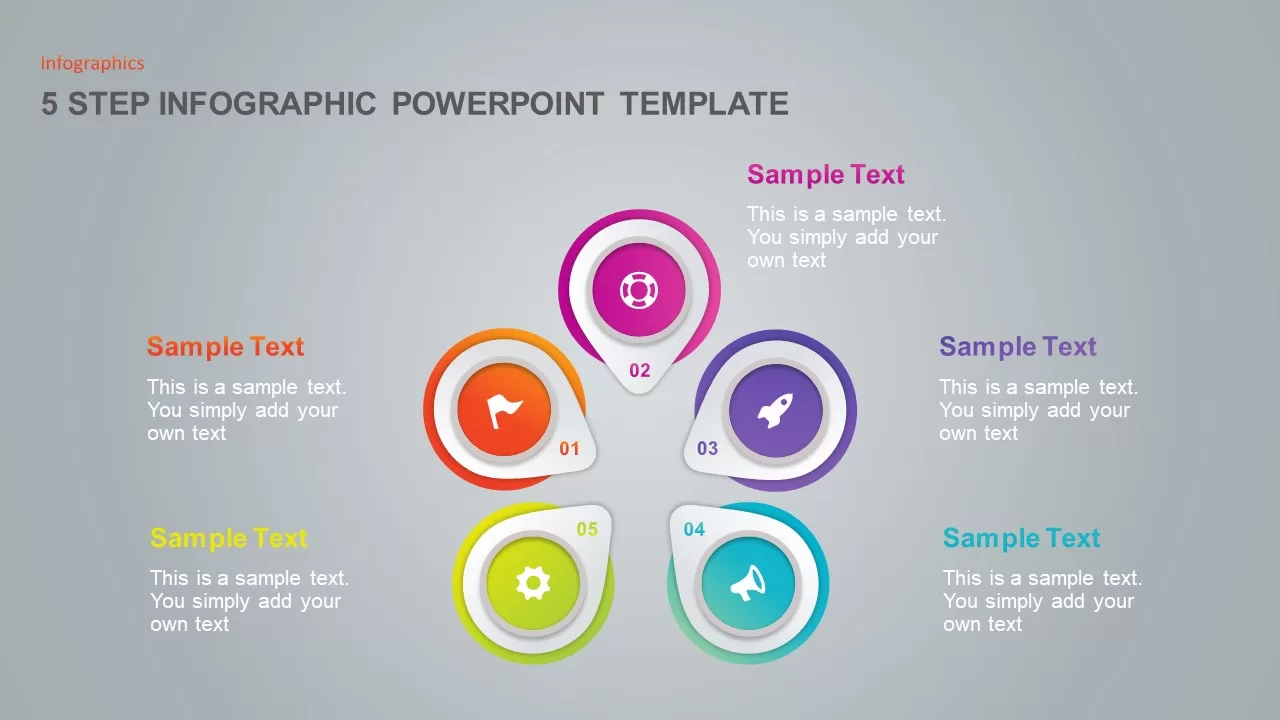
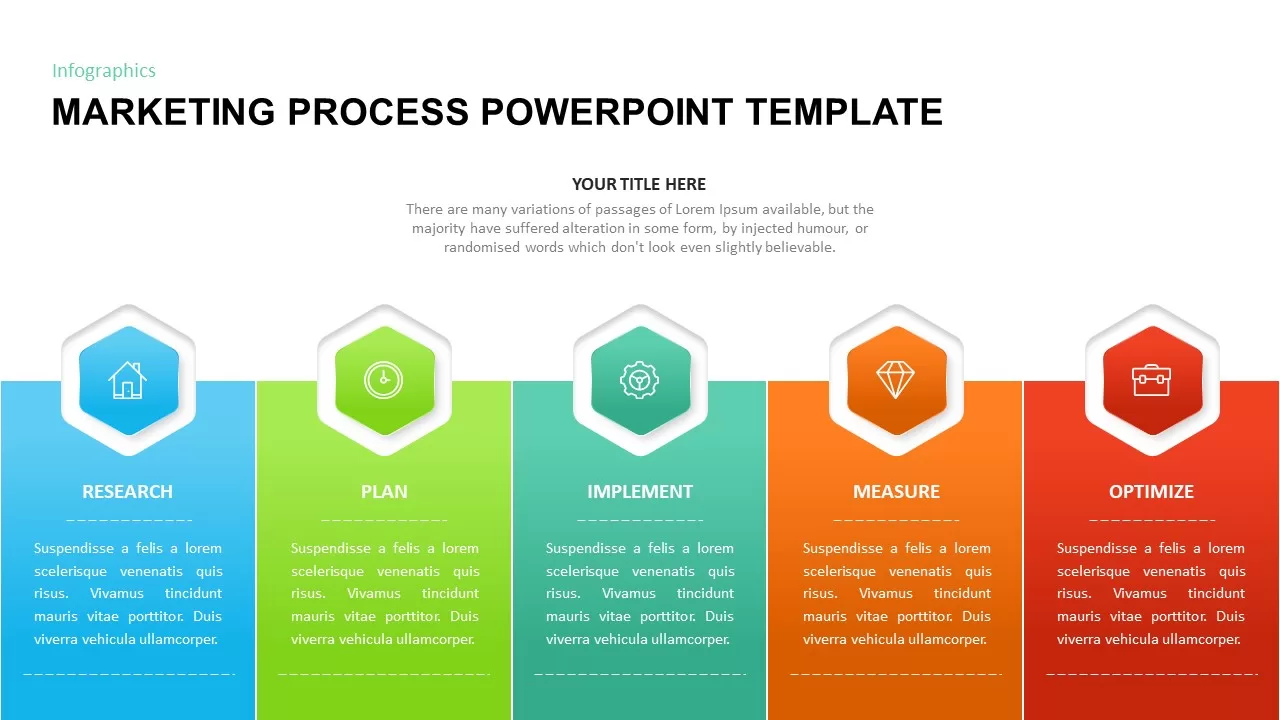
Five-Step Marketing Process Infographic Template for PowerPoint & Google Slides
Process
3 & 4 Step Circular Process Infographic Template for PowerPoint & Google Slides
Process
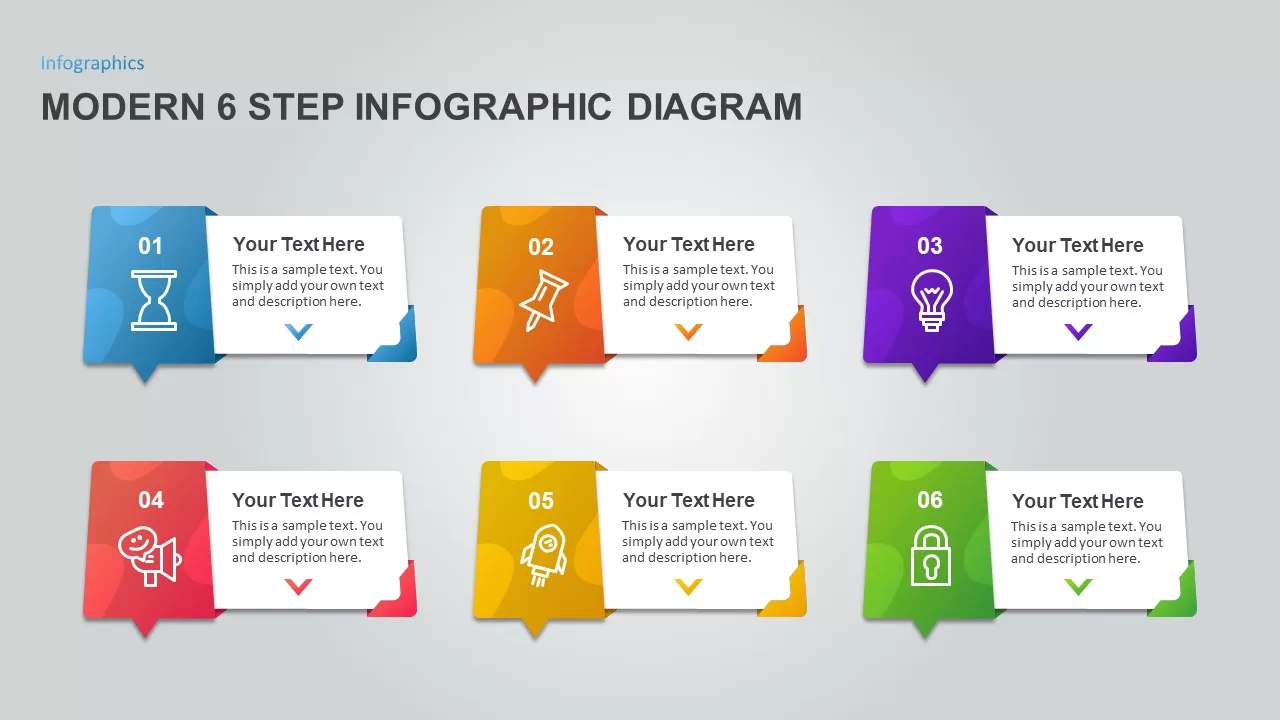
Modern 6 Step Infographic Diagram template for PowerPoint & Google Slides
Process
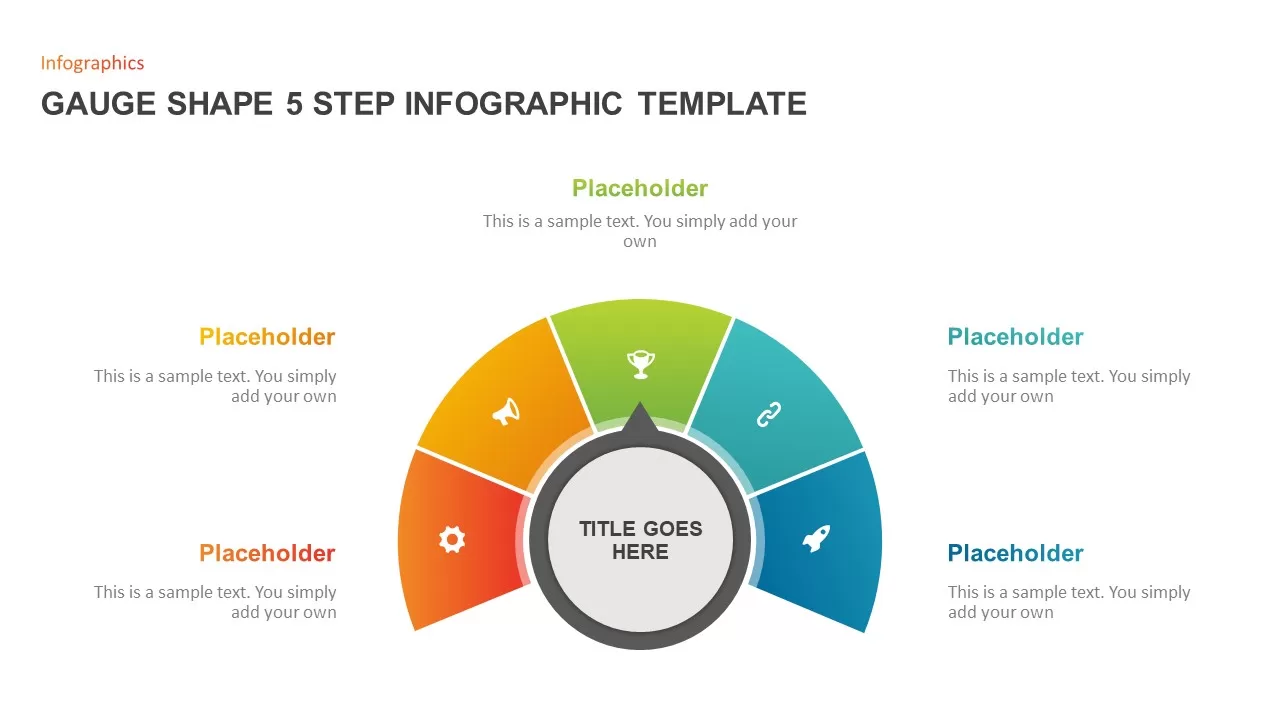
Gauge Shape 5-Step Infographic Diagram Template for PowerPoint & Google Slides
Process
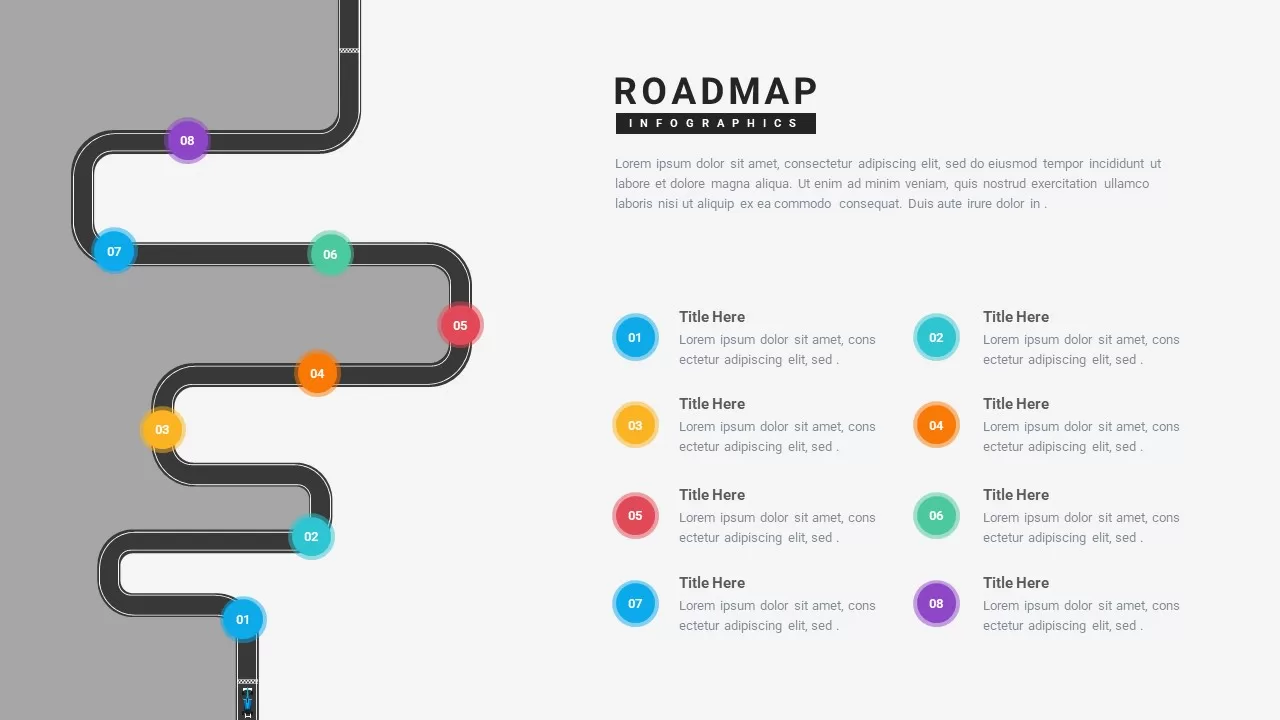
Eight-Step Winding Roadmap Infographic Template for PowerPoint & Google Slides
Roadmap

Free Five-Step Circular Timeline Infographic Template for PowerPoint & Google Slides
Timeline
Free
Free Modern Four-Step Agenda Infographic Template for PowerPoint & Google Slides
Agenda
Free
Six-Step Table of Contents Infographic Template for PowerPoint & Google Slides
Agenda
Multi-Step Infographic Process Layout Template for PowerPoint & Google Slides
Process
5-Step Curved Arrow Infographic Template for PowerPoint & Google Slides
Arrow
Six-Step Accomplishment Radial Infographic Template for PowerPoint & Google Slides
Accomplishment
Six-Step Hexagon Infographic Layout Template for PowerPoint & Google Slides
Infographics
Five-Step Hexagon Infographic Process Template for PowerPoint & Google Slides
Process
Three-Step Hexagon Infographic Process Template for PowerPoint & Google Slides
Process
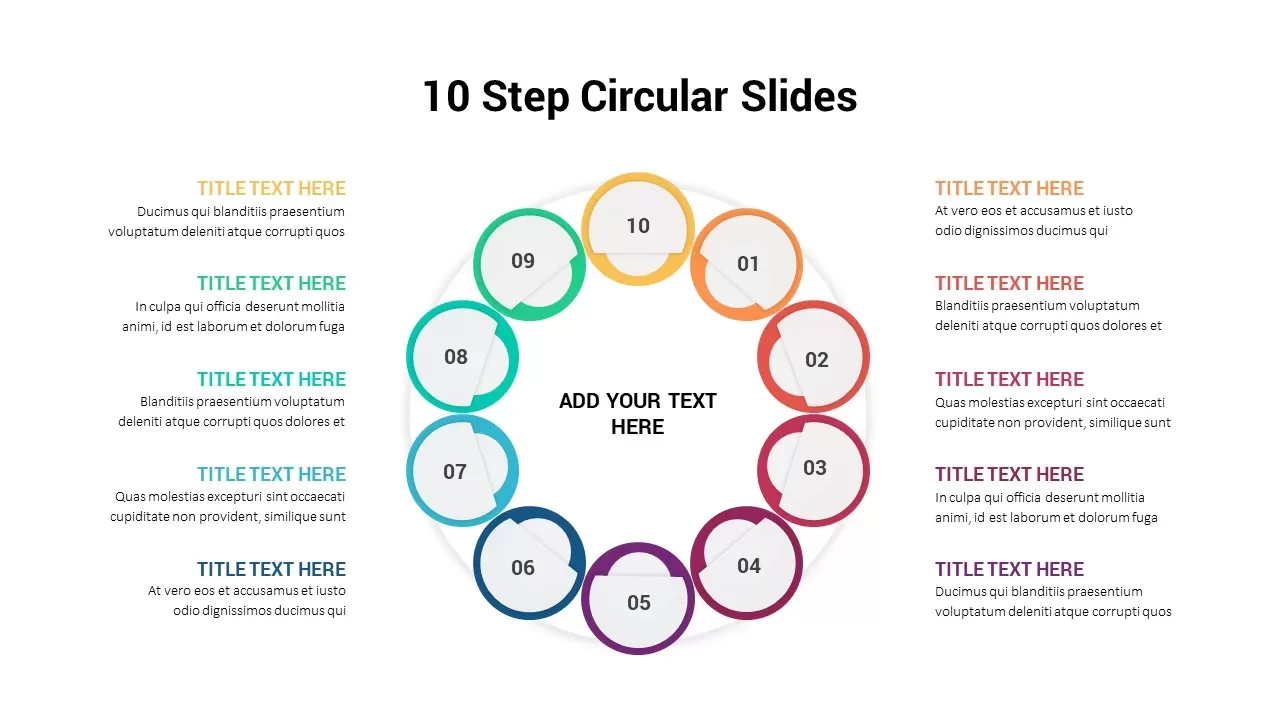
Ten Step Circular Process Infographic Template for PowerPoint & Google Slides
Process
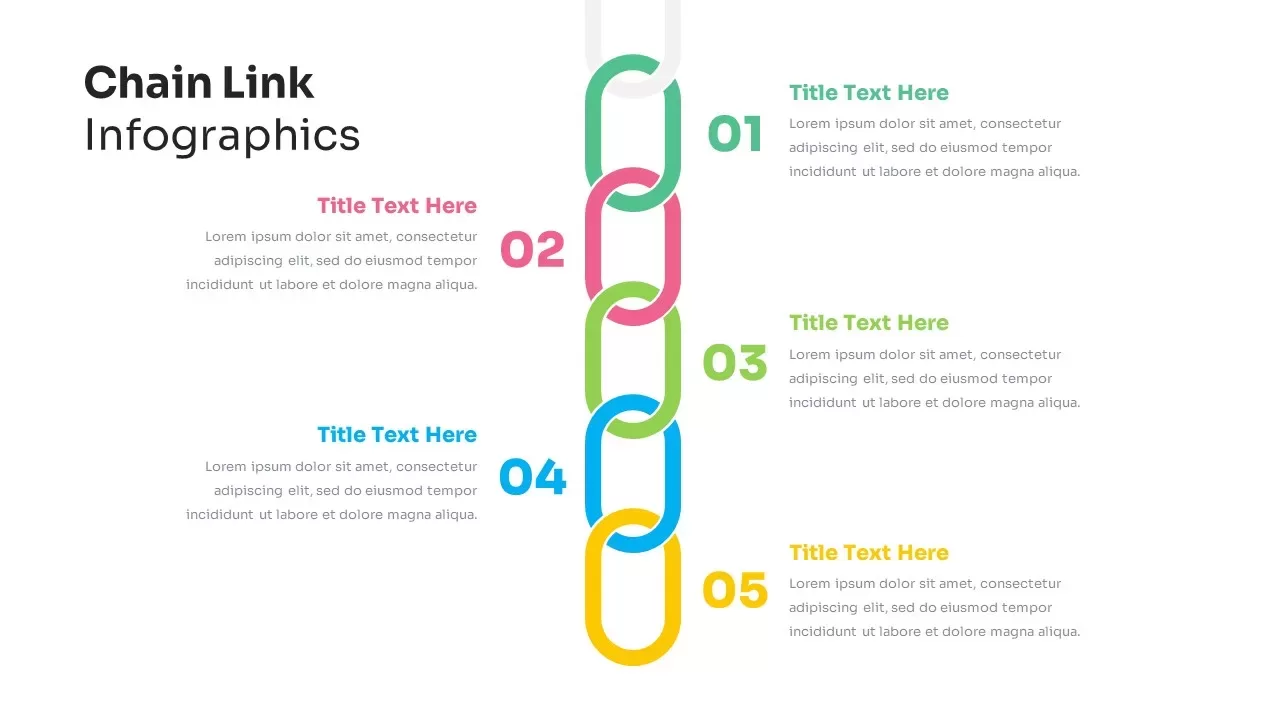
Five-Step Chain Link Process Infographic Template for PowerPoint & Google Slides
Process
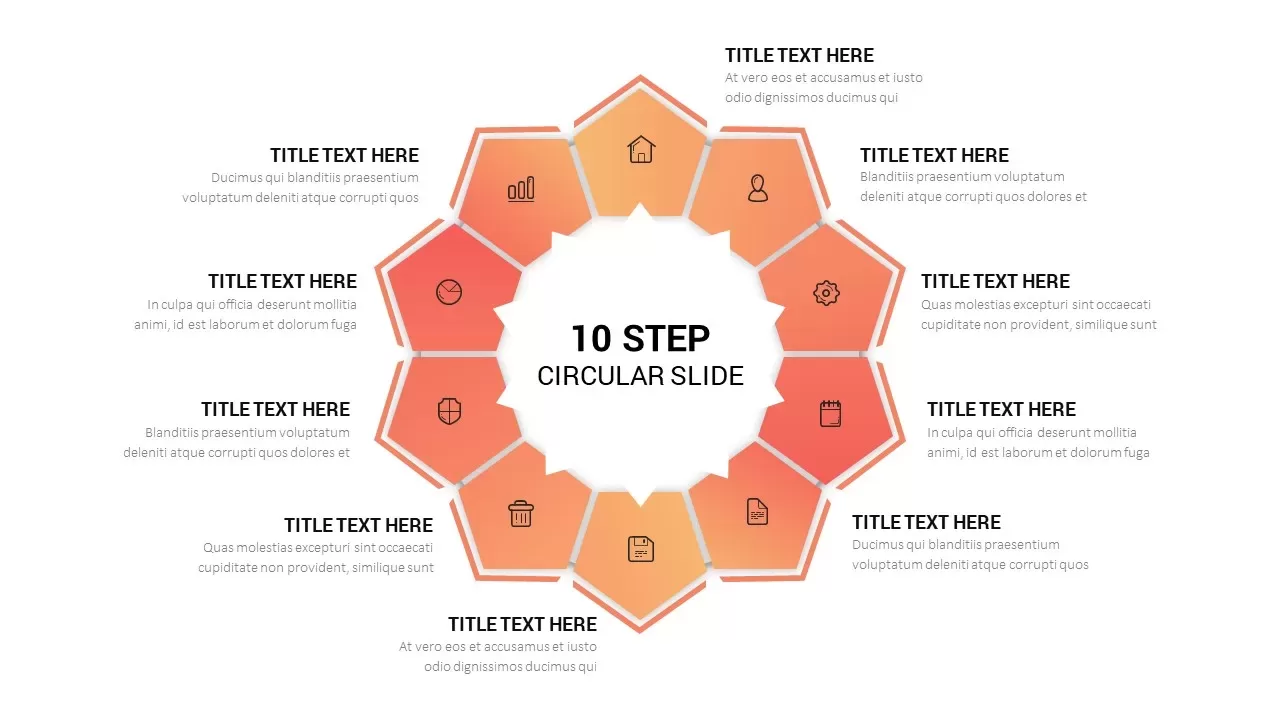
Ten-Step Circular Process Infographic Template for PowerPoint & Google Slides
Circular
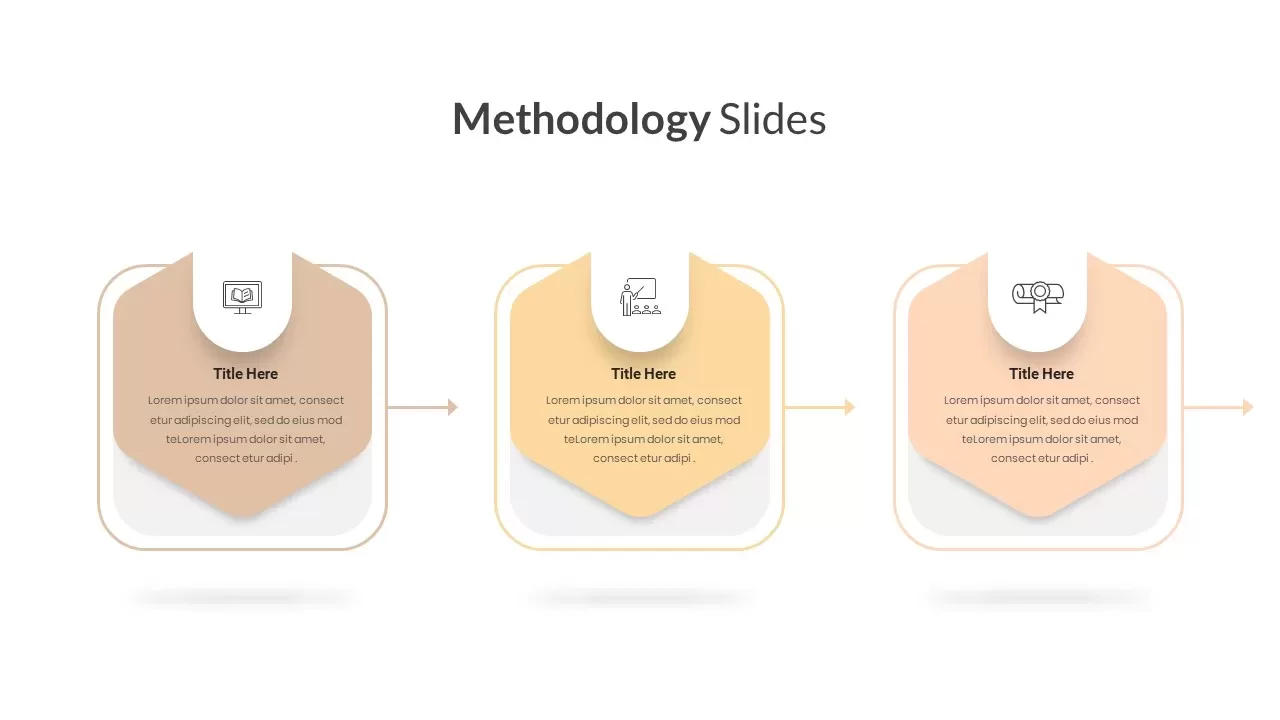
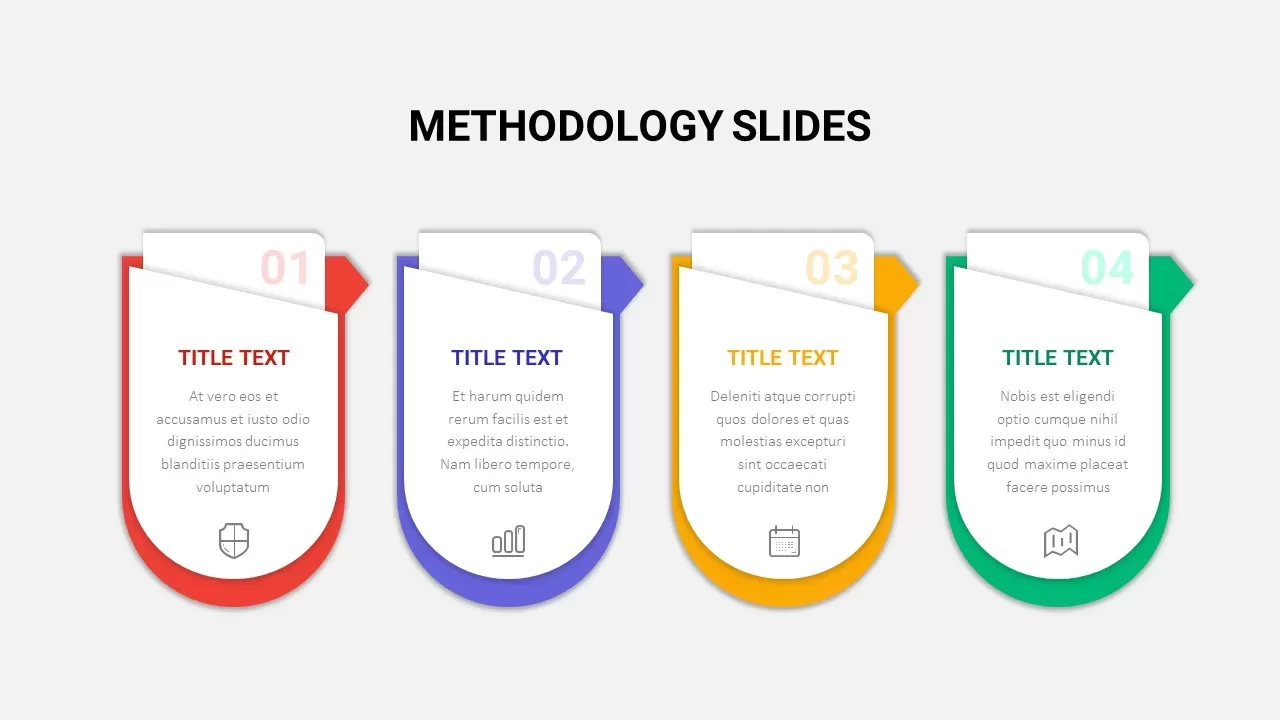
4 Step Methodology Infographic Template for PowerPoint & Google Slides
Process
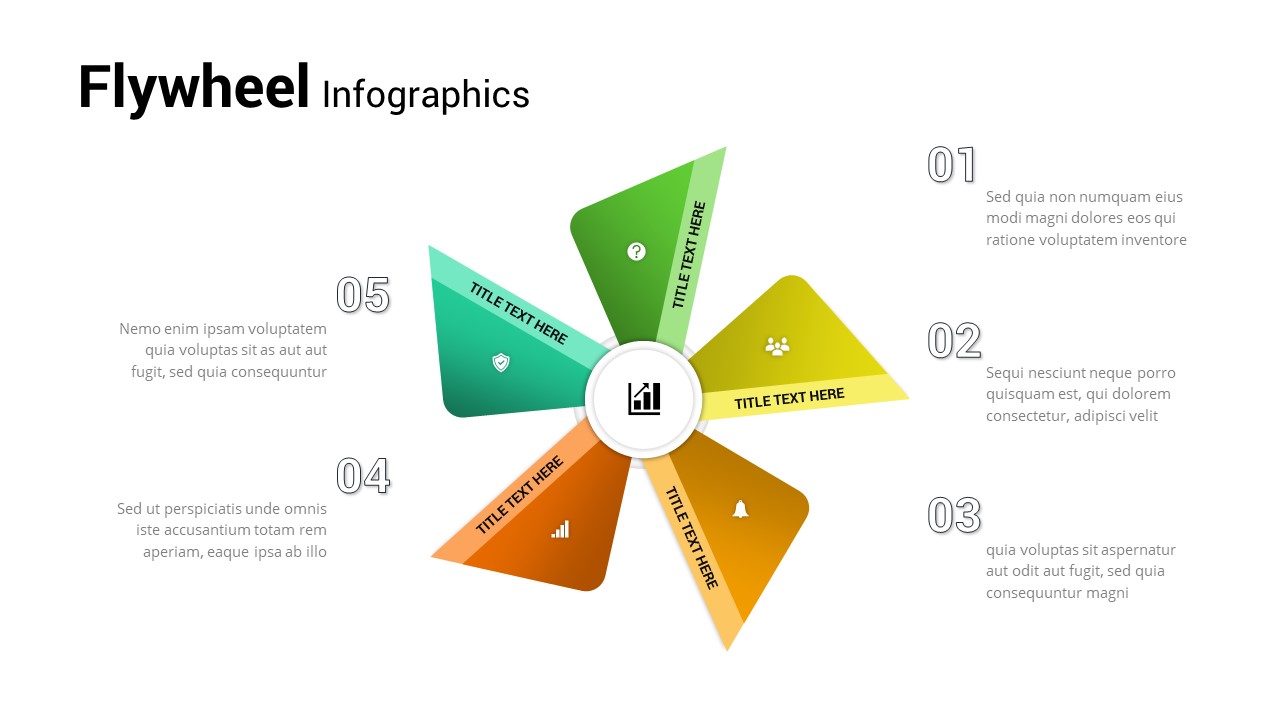
Five-Step Flywheel Infographic Diagram Template for PowerPoint & Google Slides
Process
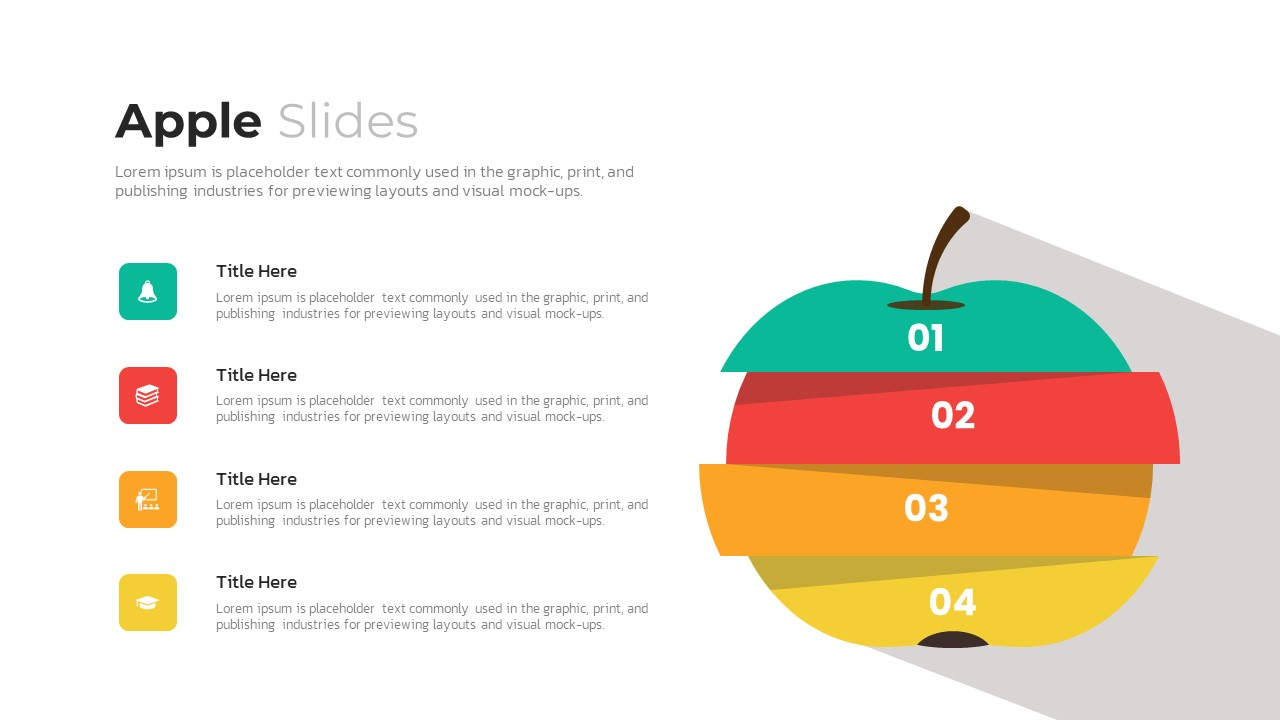
Apple Four-Step Process Infographic Template for PowerPoint & Google Slides
Process
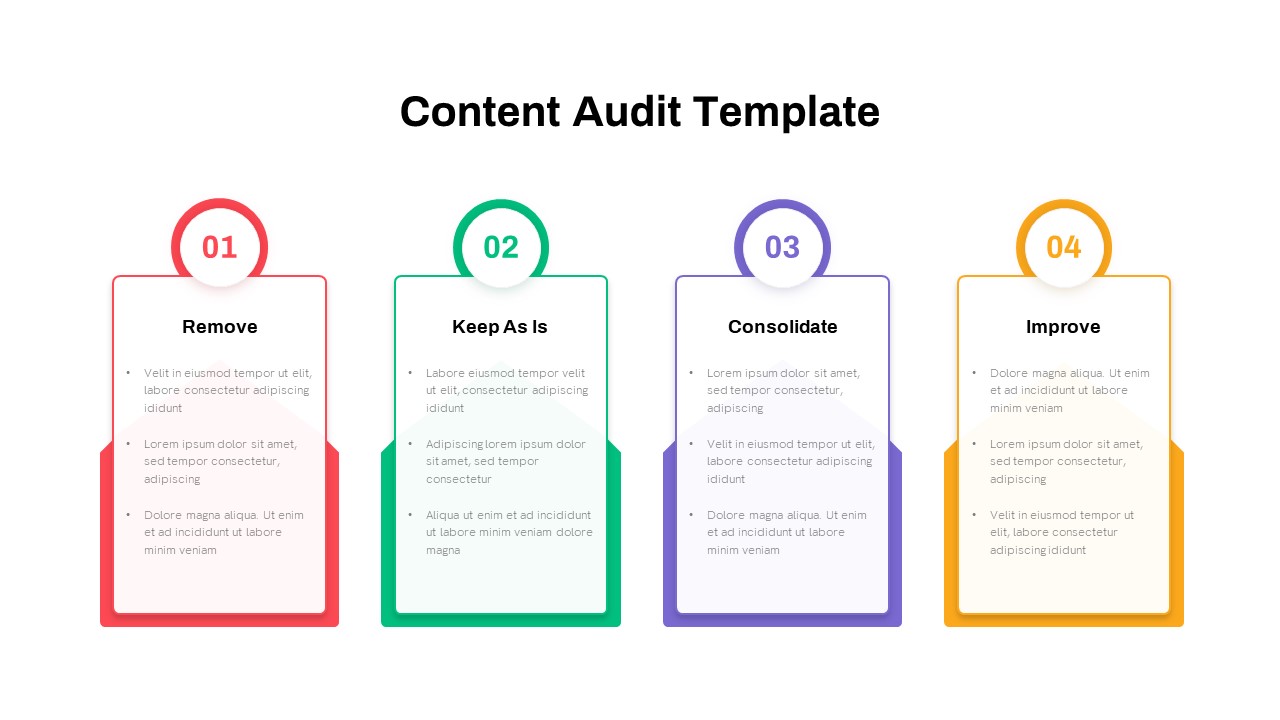
Four-Step Content Audit Infographic Template for PowerPoint & Google Slides
Process
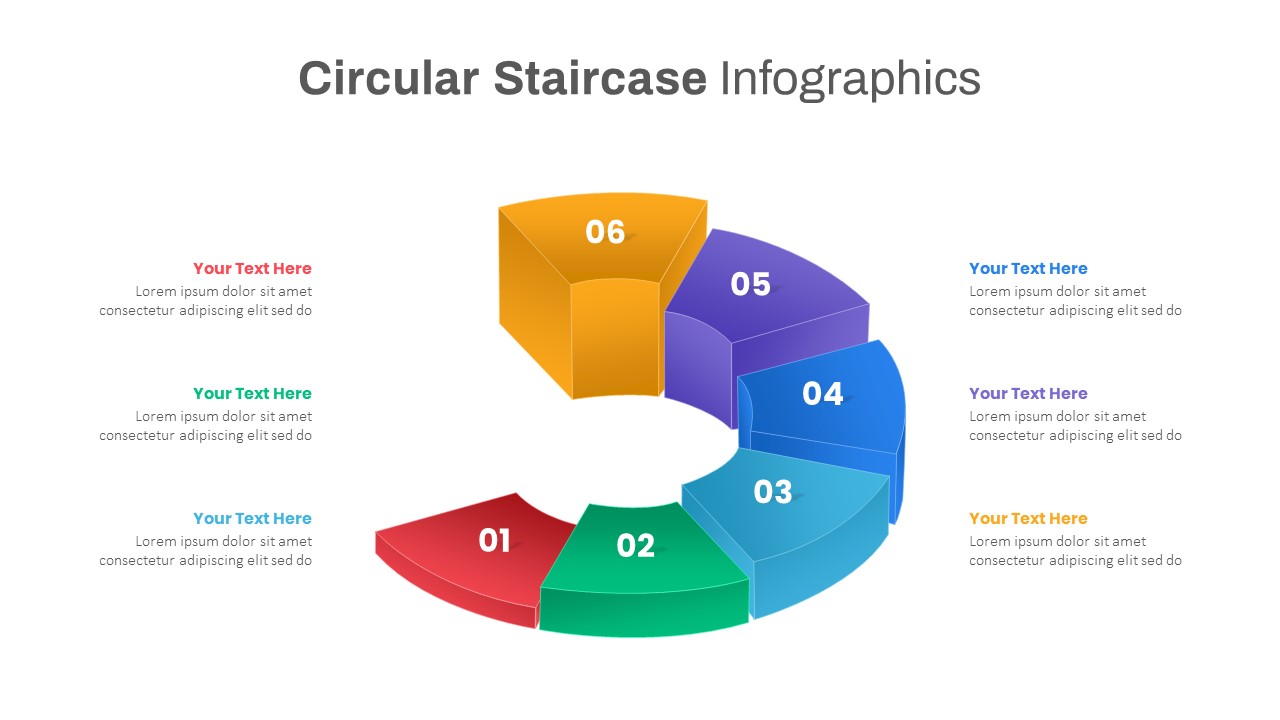
Six-Step Staircase Infographic Template for PowerPoint & Google Slides
Circular
Free Multi-Step Funnel Infographic Slide Pack Template for PowerPoint & Google Slides
Funnel
Free
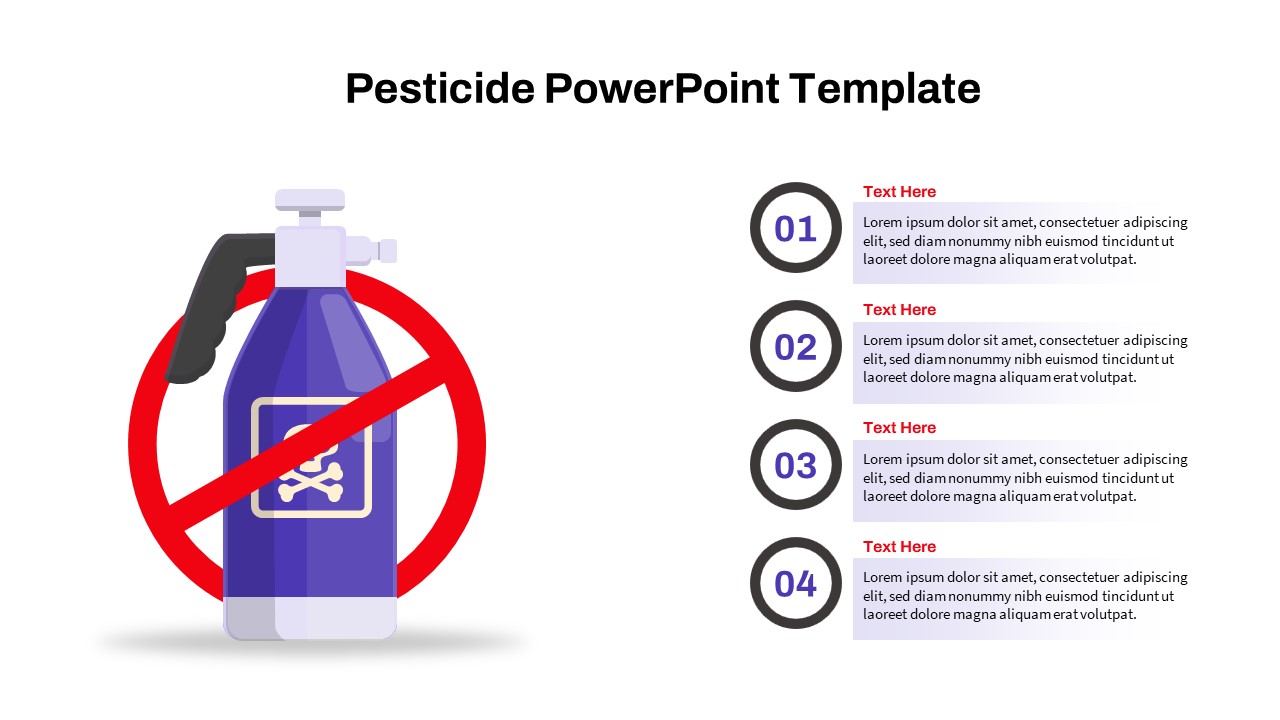
Pesticide Four-Step Process Infographic Template for PowerPoint & Google Slides
Process
4 Step Process PowerPoint & Google Slides Template for PowerPoint & Google Slides
Process
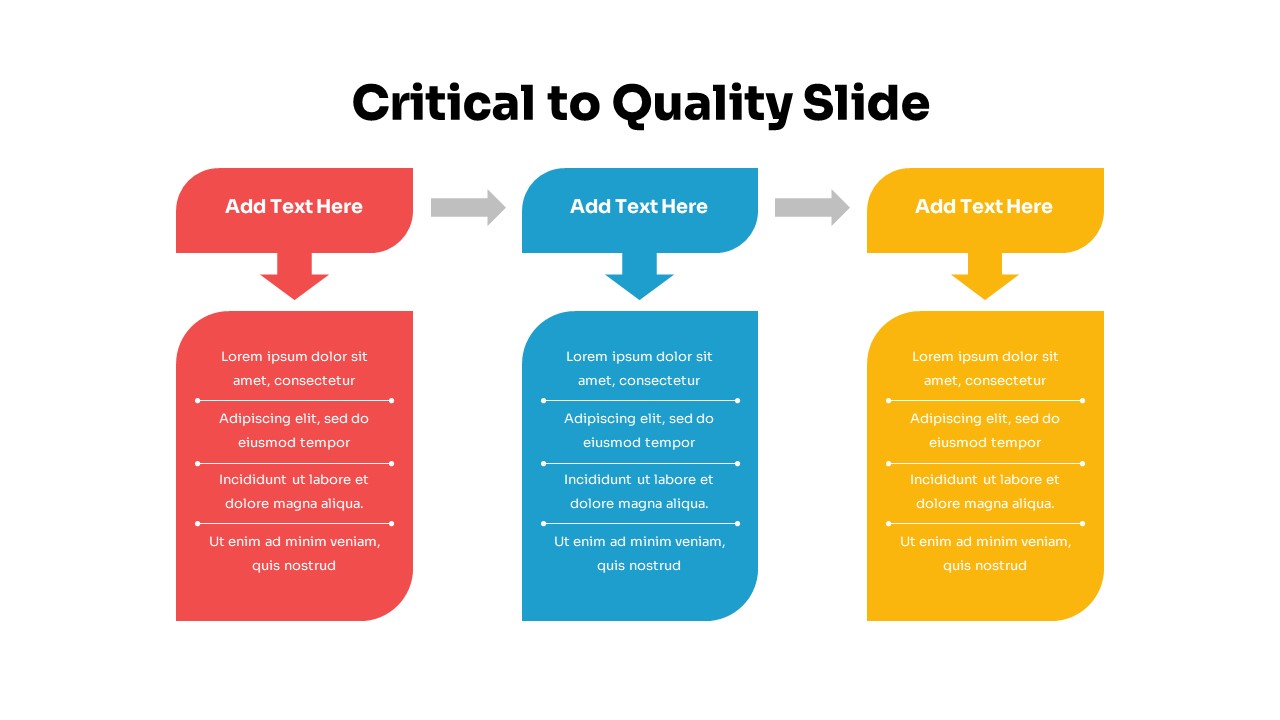
Three-Step Critical to Quality Slides Template for PowerPoint & Google Slides
Process
4 Step Problem Solving PowerPoint Diagram for PowerPoint & Google Slides
Process
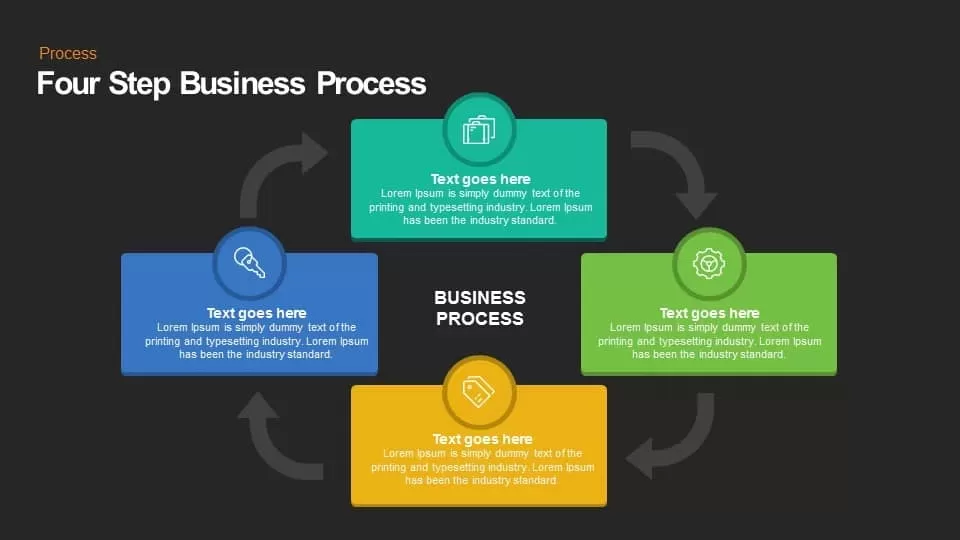
Four Step Business Process template for PowerPoint & Google Slides
Process
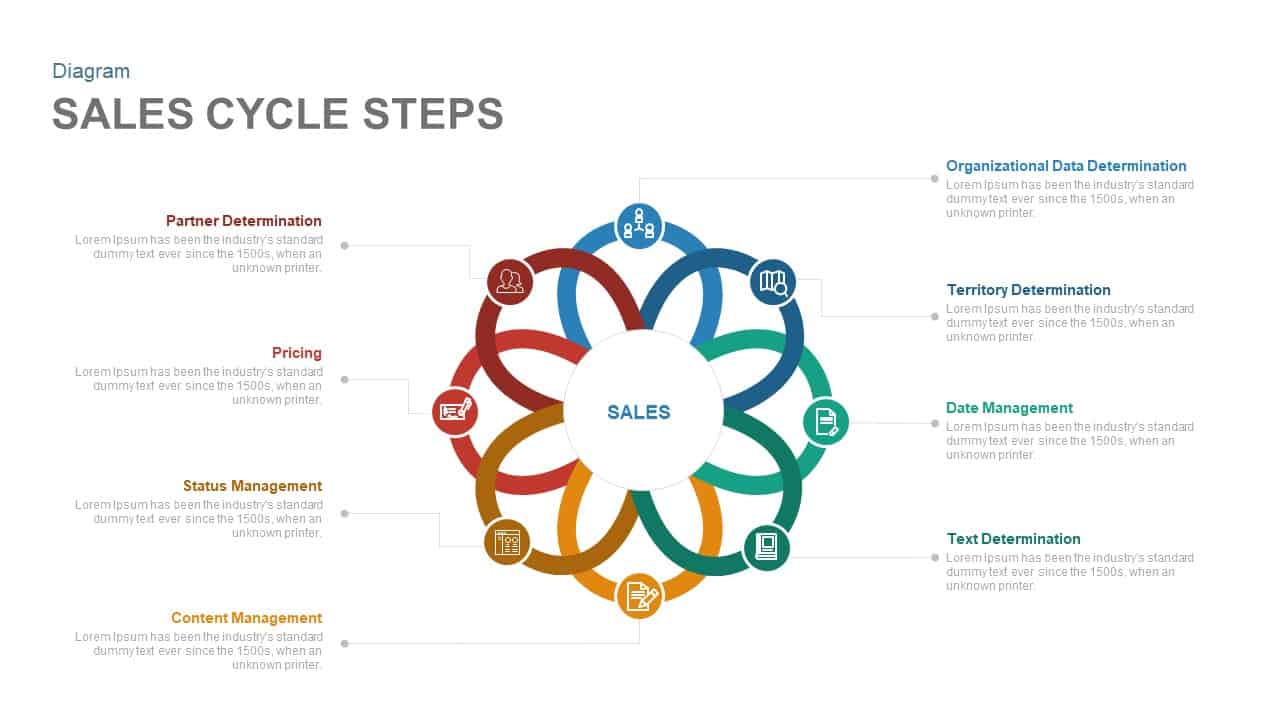
Eight-Step Sales Cycle Diagram Template for PowerPoint & Google Slides
Process
5-Step Circular Puzzle Diagram Template for PowerPoint & Google Slides
Circular
Elegant PDCA Four-Step Process Diagram Template for PowerPoint & Google Slides
Process
Machine Learning Three-Step Process Template for PowerPoint & Google Slides
Machine Learning
Four Step Sales Playbook Guide Template for PowerPoint & Google Slides
Marketing