3D Arrow Infographics Circular Flow Template for PowerPoint & Google Slides
Description
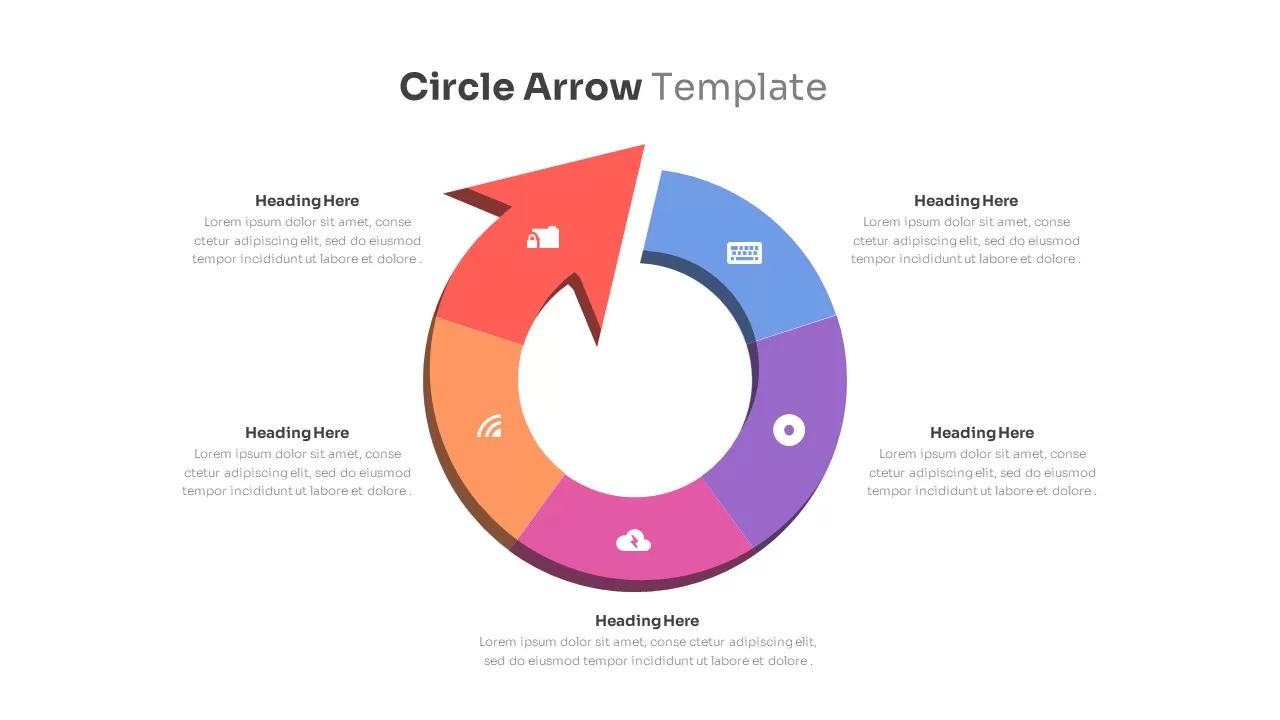
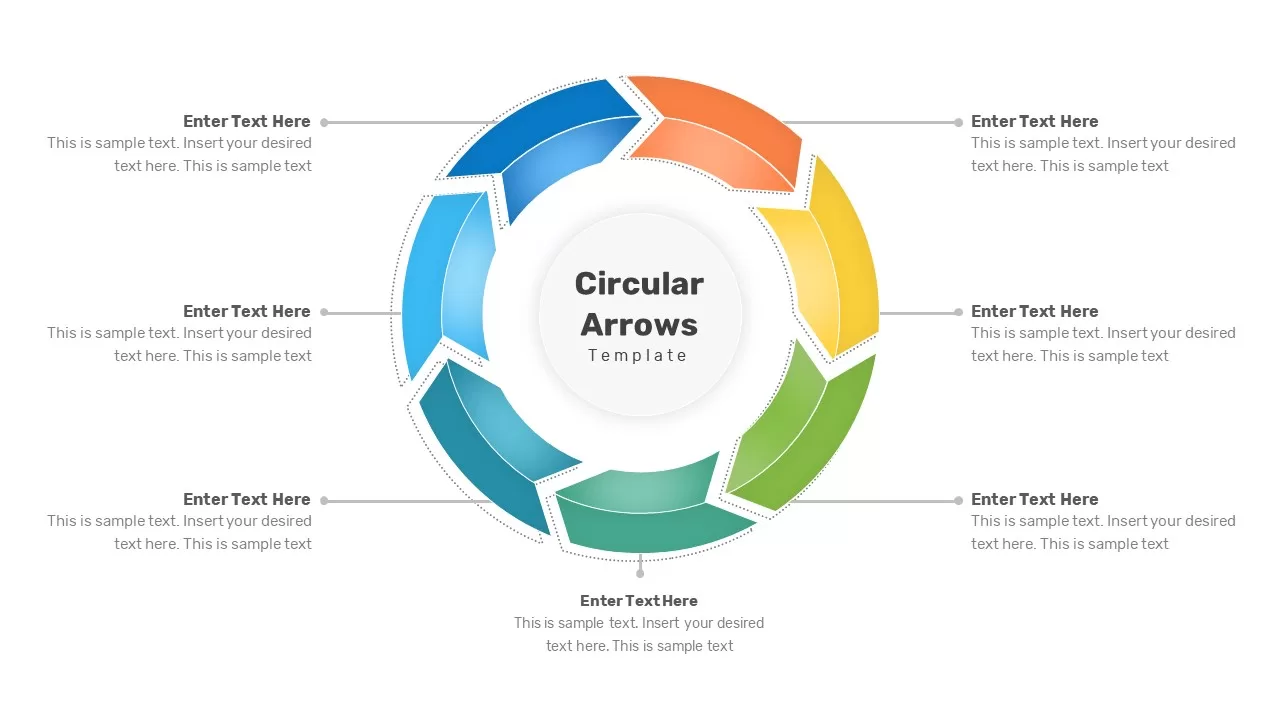
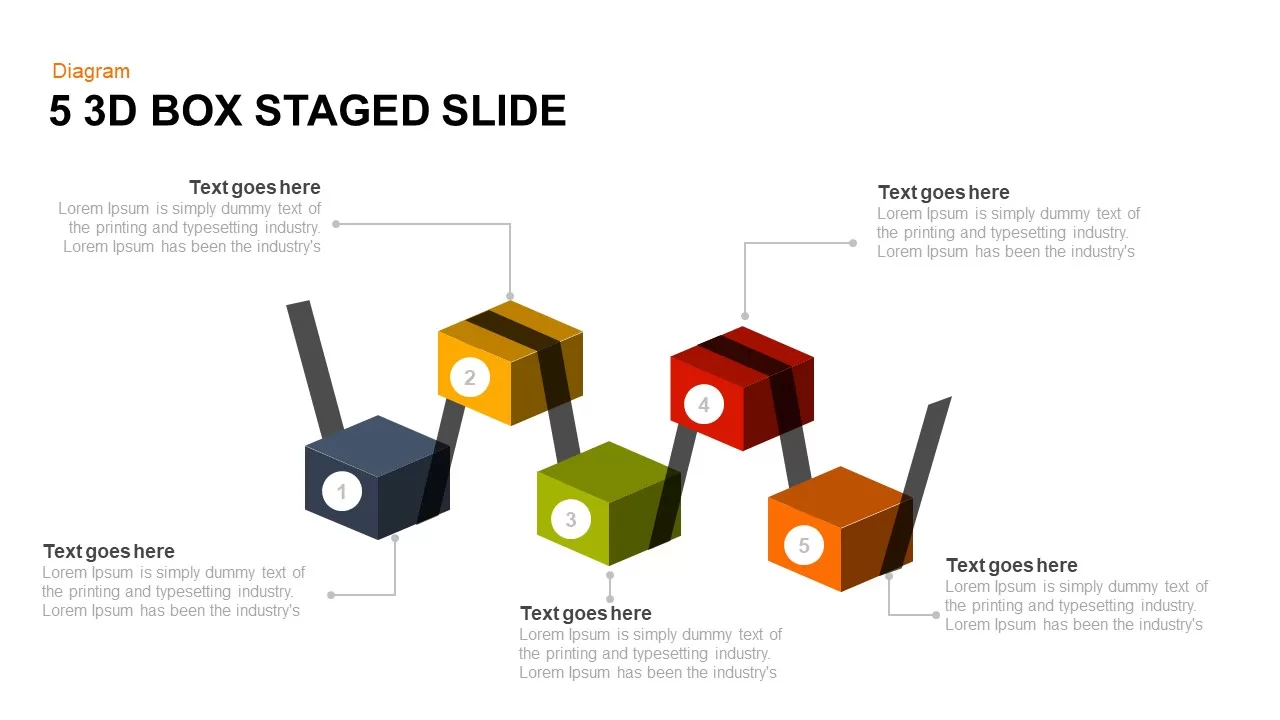
This slide presents a dynamic 3D circular arrow infographic composed of five segmented arrow blocks arranged in a ring to illustrate cyclical processes or stages with high visual impact. Each arrow segment is rendered in bold vector style—dark gray, sky blue, green, yellow-orange, and red—to ensure clear differentiation between steps. Subtle depth shading and beveled edges reinforce the 3D effect, while connector markers between segments highlight relationships and flow direction. A spacious title area accommodates a prominent headline and subtitle, and a large content placeholder supports long-form explanations, stage descriptions, or calls to action.
Built on fully editable master slides for PowerPoint and Google Slides, this infographic offers complete customization: simply swap segment colors, update section titles, or adjust text placeholders to match your narrative. Use the align and distribute tools to expand the ring with additional segments or reposition arrows for alternative layouts. The clean white background and professional sans-serif fonts maintain readability and keep focus on the process visualization. For enhanced storytelling, apply sequential entrance animations to each arrow block, guiding your audience through complex workflows step by step. Compatibility with standard 16:9 and 4:3 aspect ratios ensures consistent presentation across screens, projectors, and printed materials.
This template’s flexible layout supports multiple aspect ratios and can be seamlessly integrated into larger presentation decks. You can enrich each arrow segment with icons, numerical data labels, or progress indicators to convey metrics and milestones at a glance. Connector circles are fully editable—they can be resized, recolored, or replaced with custom icons to stress key transition points. Master slide controls guarantee consistent styling and effortless theme updates across all slides.
Who is it for
Project managers, process engineers, and consultants will find this infographic invaluable for mapping workflows, illustrating project phases, or outlining continuous improvement cycles. Marketing teams and strategists can adapt it to showcase campaign lifecycles or customer journeys.
Other Uses
Repurpose the design for product roadmaps, training modules, or strategic frameworks. Replace arrow segments with icons or metrics to visualize key performance indicators, milestone achievements, or resource allocation cycles, making this slide a versatile asset across industries.
Login to download this file

Item ID
SB00101
Related Templates

Five Circular Flow Arrow Diagram for PowerPoint & Google Slides
Arrow

5-Stage Arrow Infographics Process Flow Template for PowerPoint & Google Slides
Arrow
Five-Stage Direct Flow Arrow Process Template for PowerPoint & Google Slides
Arrow
Curved Arrow Process Flow Infographic Template for PowerPoint & Google Slides
Process
Curved Arrow Process Flow Diagram Template for PowerPoint & Google Slides
Process
Curved Arrow Process Flow Diagram Template for PowerPoint & Google Slides
Arrow
Curved Arrow Flow Diagram template for PowerPoint & Google Slides
Business
Curved Arrow Flow Template for PowerPoint & Google Slides
Process
Three-Step Wavy Arrow Flow Template for PowerPoint & Google Slides
Process
Curved Arrow Process Flow template for PowerPoint & Google Slides
Process
Curved Arrow Process Flow template for PowerPoint & Google Slides
Process
Circle Arrow Process Flow template for PowerPoint & Google Slides
Process
Circle Arrow Process Flow template for PowerPoint & Google Slides
Process
Arrow Circle Flow Diagram for PowerPoint & Google Slides
Infographics
Circular Flow Diagram Template for PowerPoint & Google Slides
Infographics
Four-Stage Circular Process Flow Template for PowerPoint & Google Slides
Process
Five-Stage Circular Process Flow Diagram Template for PowerPoint & Google Slides
Circular
Five-Stage Circular Flow Diagram Template for PowerPoint & Google Slides
Circular
Four-Stage Circular Flow Diagram Template for PowerPoint & Google Slides
Circular
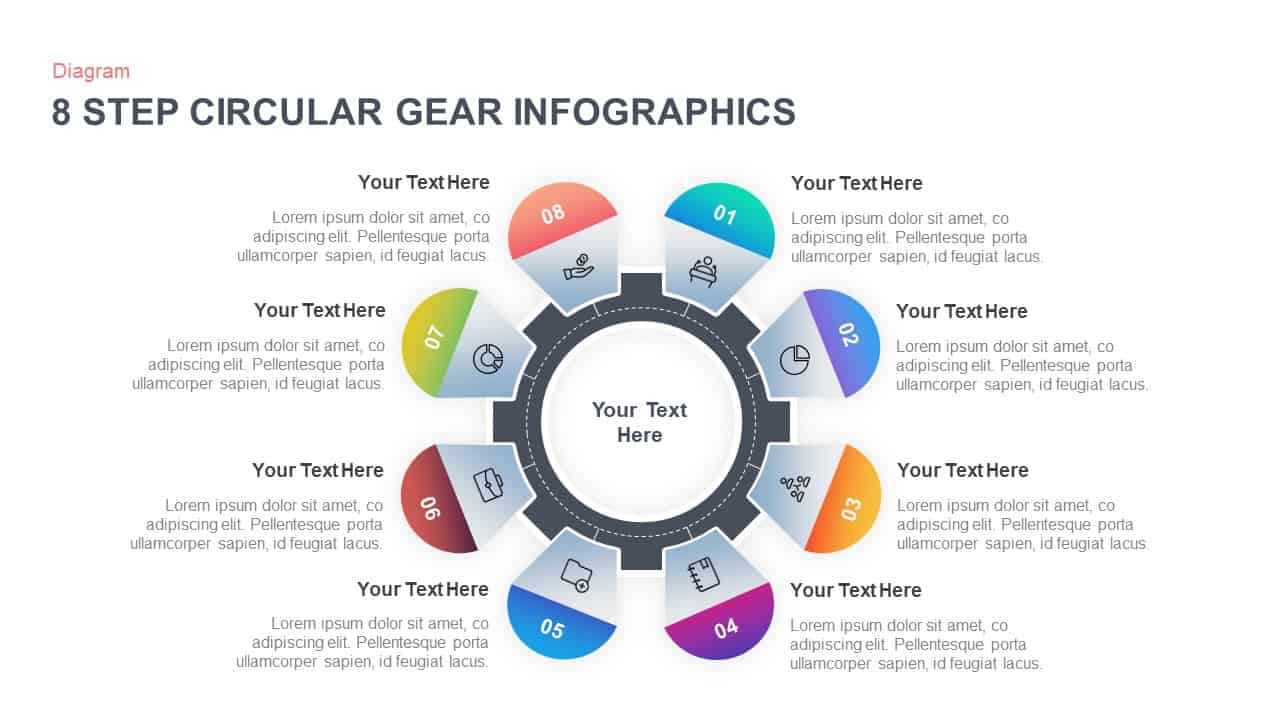
8 Step Circular Process Flow Diagram Template for PowerPoint & Google Slides
Process
6-Step Circular Process Flow Diagram Template for PowerPoint & Google Slides
Process
Six-Stage Circular Flow Diagram Template for PowerPoint & Google Slides
Circular
5-Step Circular Gradient Process Flow Template for PowerPoint & Google Slides
Process
Free Circular Multi-Step Flow Chart Diagram Template for PowerPoint & Google Slides
Flow Charts
Free
Circular Arrows Process Flow template for PowerPoint & Google Slides
Process
Circular Arrows Process Flow template for PowerPoint & Google Slides
Process
Circular Arrows Process Flow template for PowerPoint & Google Slides
Process
Five-Section Circular Arrow Diagram Template for PowerPoint & Google Slides
Circular
Seven-Segment Circular Arrow Diagram Template for PowerPoint & Google Slides
Arrow

8-Step Circular Arrow Diagram Template for PowerPoint & Google Slides
Arrow
Six-Process Circular Arrow Diagram Template for PowerPoint & Google Slides
Circular
Five Stage Circular Arrow Diagram Template for PowerPoint & Google Slides
Process
Concentric Circular Arrow Cycle Diagram Template for PowerPoint & Google Slides
Process
Dual-Stage Circular Arrow Cycle Template for PowerPoint & Google Slides
Process
Three-Segment Circular Arrow Cycle Template for PowerPoint & Google Slides
Circular
Four-Segment Circular Arrow Cycle Template for PowerPoint & Google Slides
Circular
Six-Segment Circular Arrow Cycle Template for PowerPoint & Google Slides
Circular
Five-Stage Circular Arrow Infographic Template for PowerPoint & Google Slides
Circular
Six-Segment Circular Arrow Infographic Template for PowerPoint & Google Slides
Circular
Circular Arrow Process Diagram Template for PowerPoint & Google Slides
Circular
Funnel Flow Stage Infographics template for PowerPoint & Google Slides
Funnel
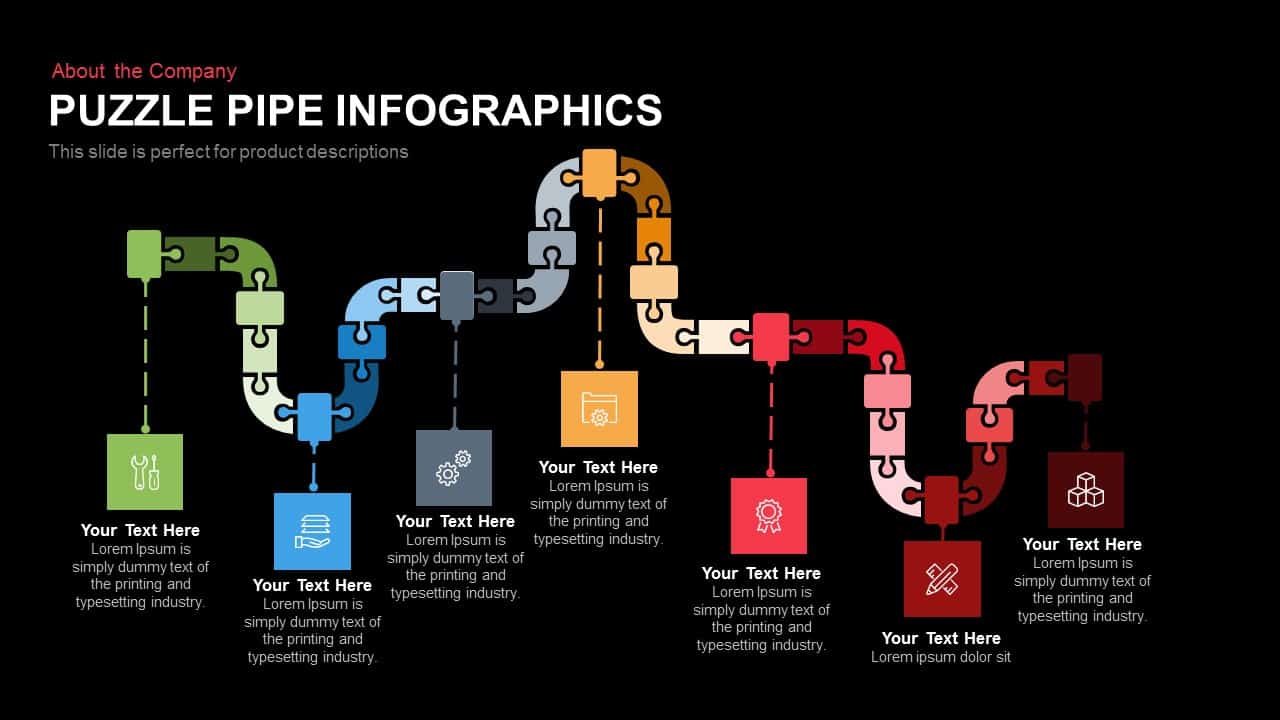
Puzzle Pipe Infographics Process Flow Template for PowerPoint & Google Slides
Process
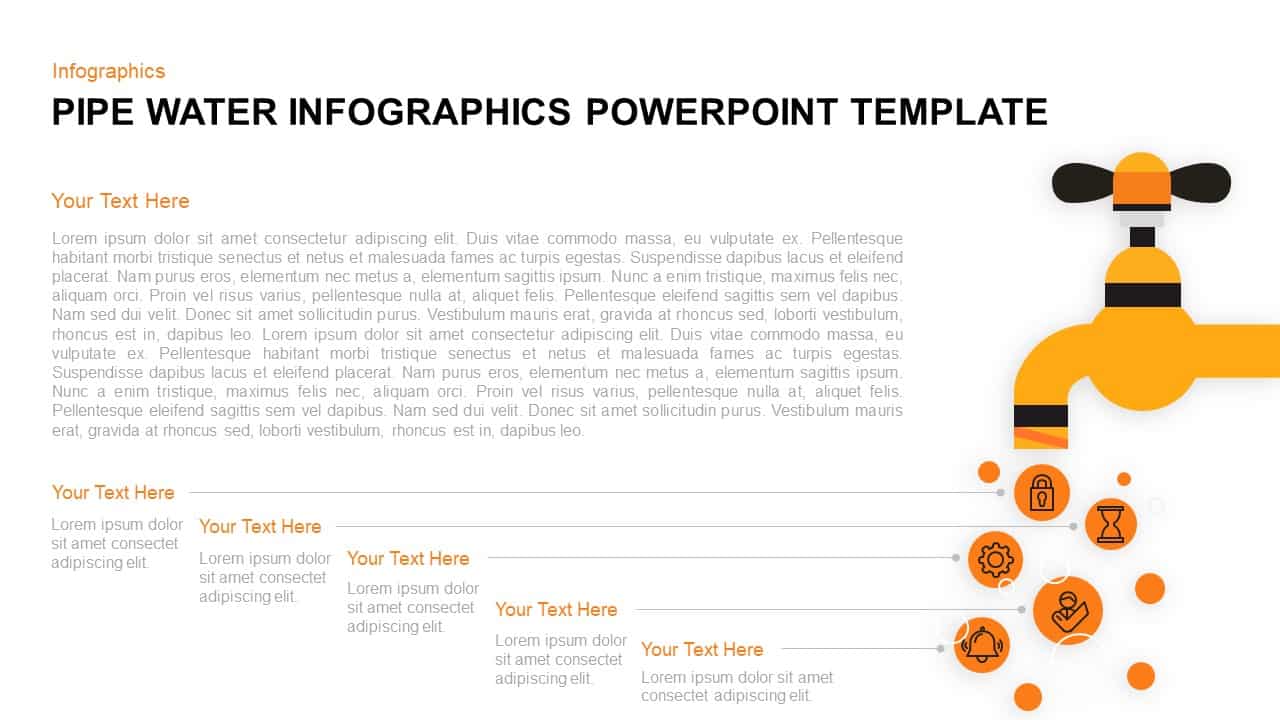
Pipe Water Infographics Flow Diagram Template for PowerPoint & Google Slides
Process

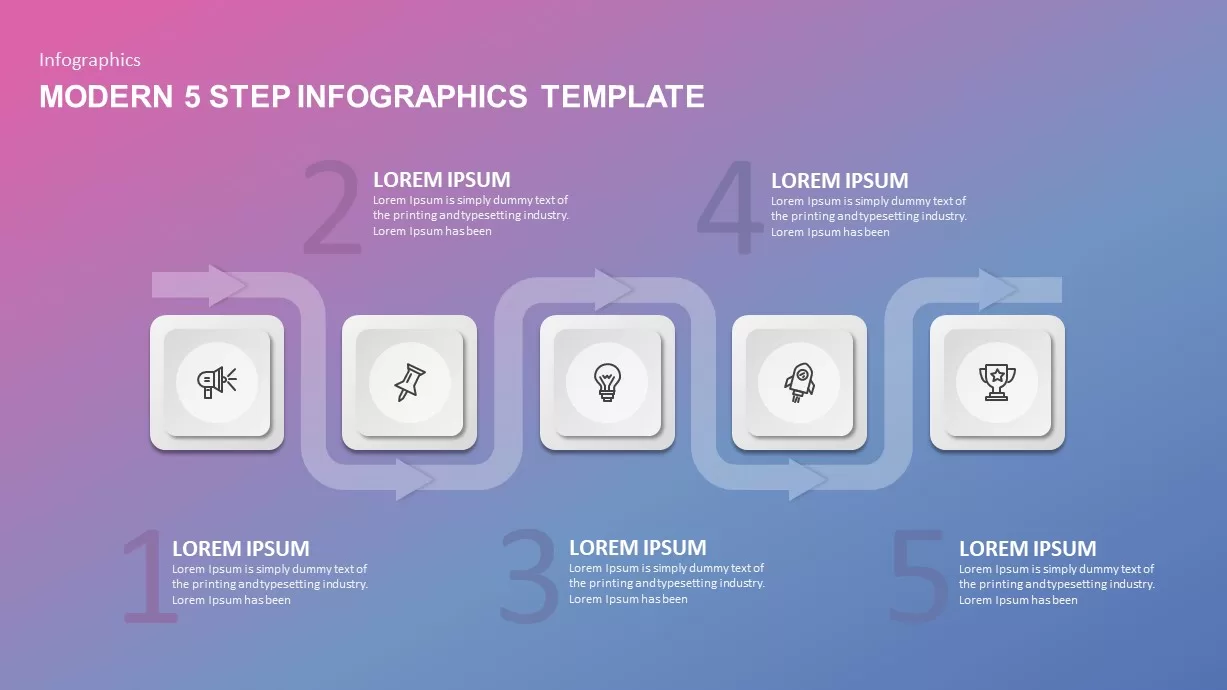
Modern 5-Step Flow Infographics Template for PowerPoint & Google Slides
Process

Free Colorful Process Flow Infographics Template for PowerPoint & Google Slides
Process
Free
Colorful Process Flow Infographics Template for PowerPoint & Google Slides
Process

DevOps Infographics & Process Flow Template for PowerPoint & Google Slides
Information Technology
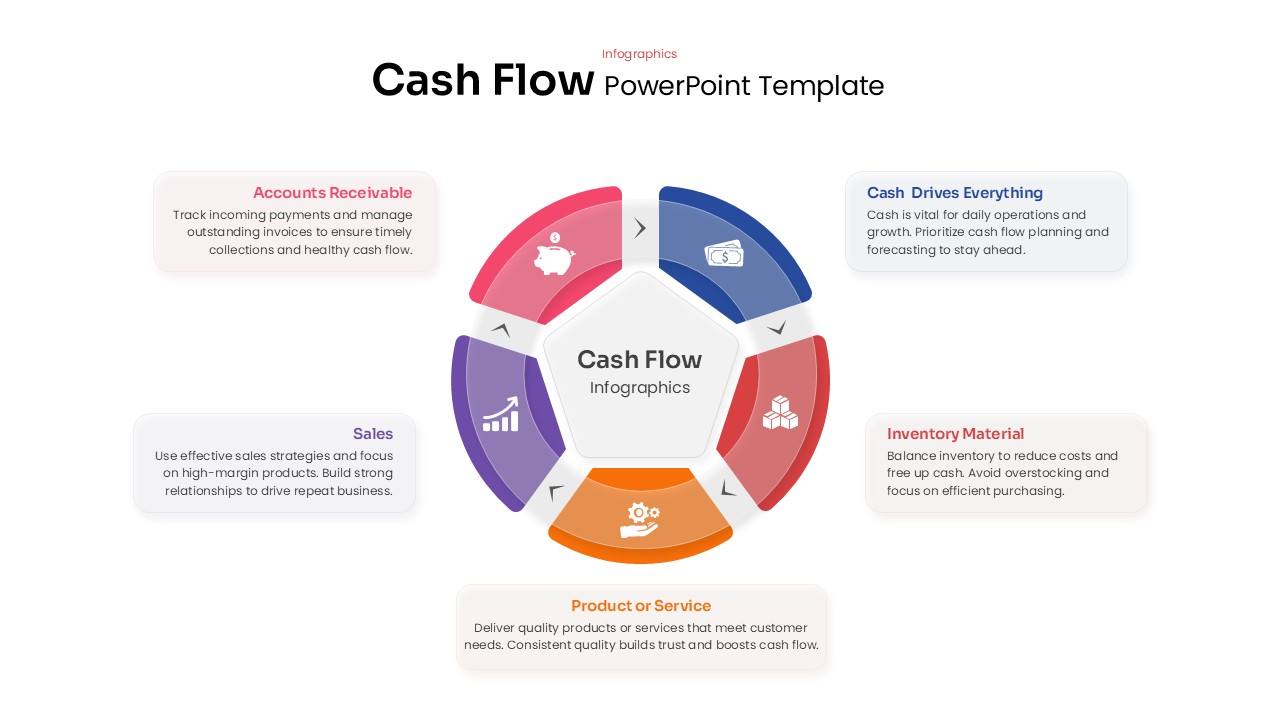
Cash Flow Infographics template for PowerPoint & Google Slides
Business
Arrow Infographics template for PowerPoint & Google Slides
Infographics
3D Four Arrow Infographics Diagram Template for PowerPoint & Google Slides
Arrow
Four Arrow Square Infographics Template for PowerPoint & Google Slides
Arrow
Four Swoosh Arrow Infographics template for PowerPoint & Google Slides
Arrow
Arrow Step Infographics Workflow Template for PowerPoint & Google Slides
Arrow
Eight-Segment 3D Arrow Infographics Template for PowerPoint & Google Slides
Arrow
Five Arrow Infographics Diagram Template for PowerPoint & Google Slides
Arrow
3D Four-Directional Arrow Infographics Template for PowerPoint & Google Slides
Arrow
Five-Stage Arrow Infographics Timeline Template for PowerPoint & Google Slides
Arrow
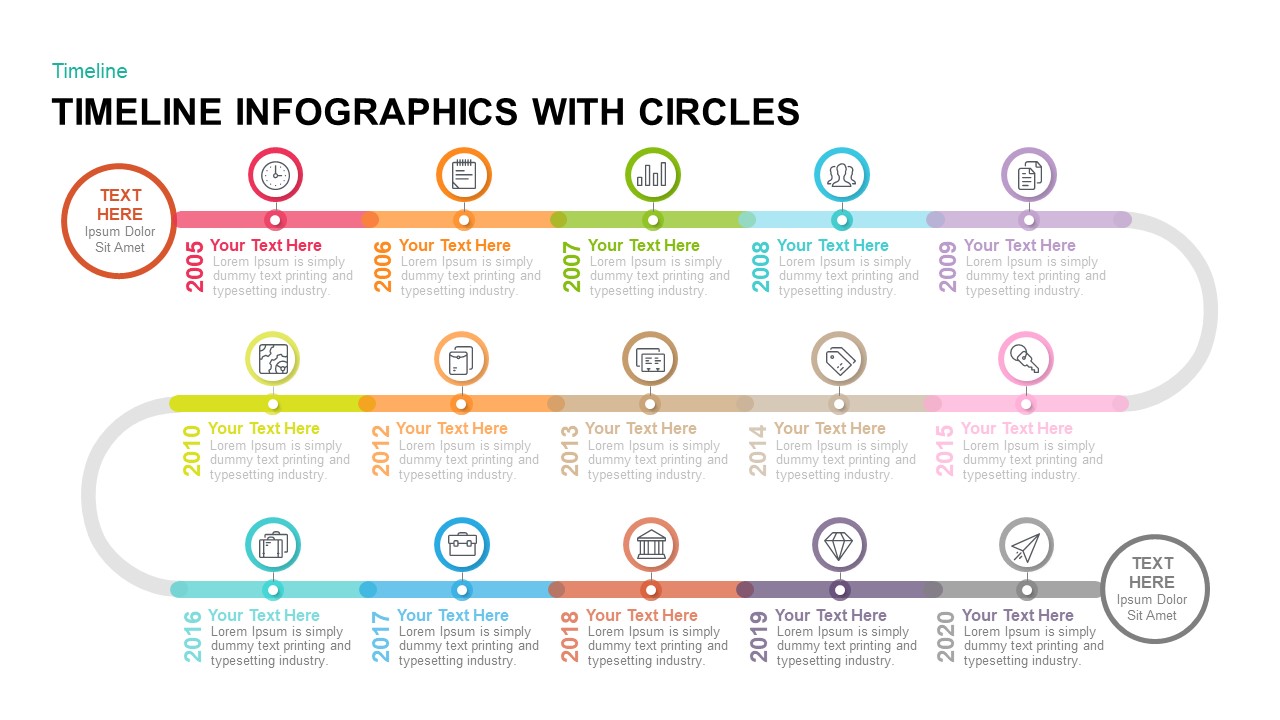
Timeline Arrow Infographics Diagram Template for PowerPoint & Google Slides
Timeline
Six-Stage Time Arrow Infographics Template for PowerPoint & Google Slides
Arrow
3D Arrow Infographics template for PowerPoint & Google Slides
Arrow
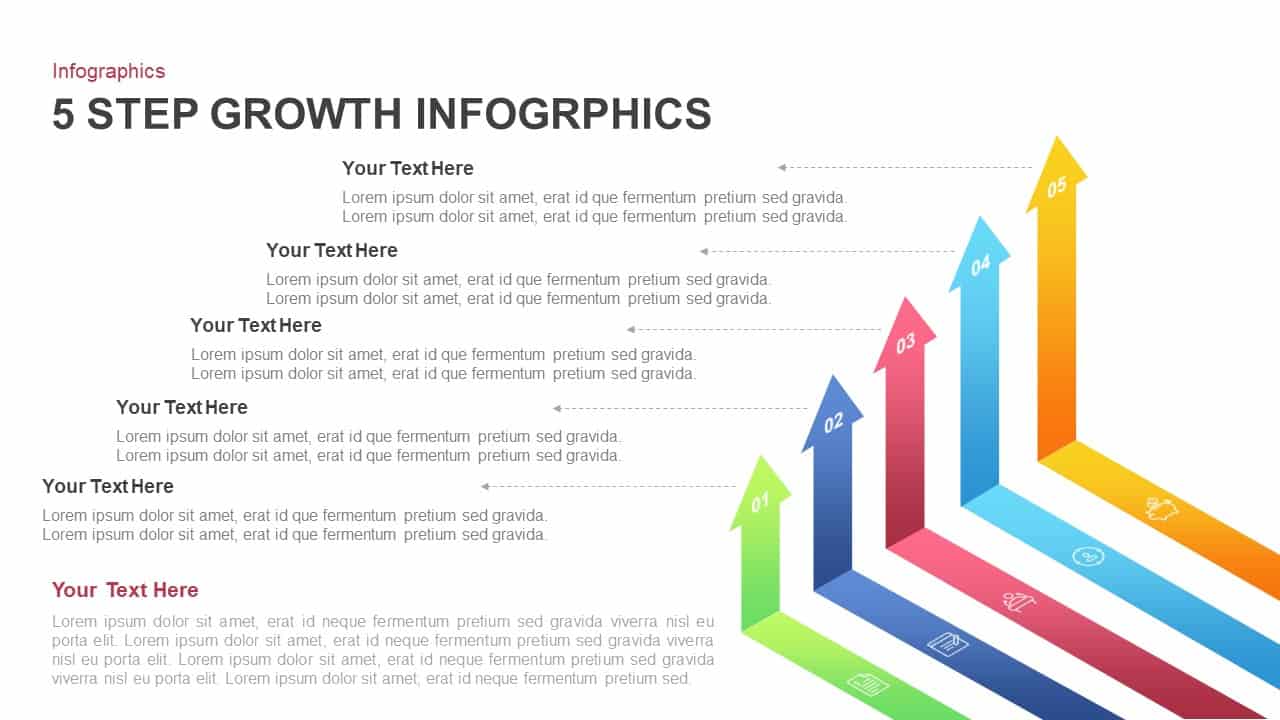
5-Step Growth Arrow Infographics Template for PowerPoint & Google Slides
Arrow
Circular Timeline Infographics Template for PowerPoint & Google Slides
Timeline
Four-Step Circular Process Infographics Template for PowerPoint & Google Slides
Circular
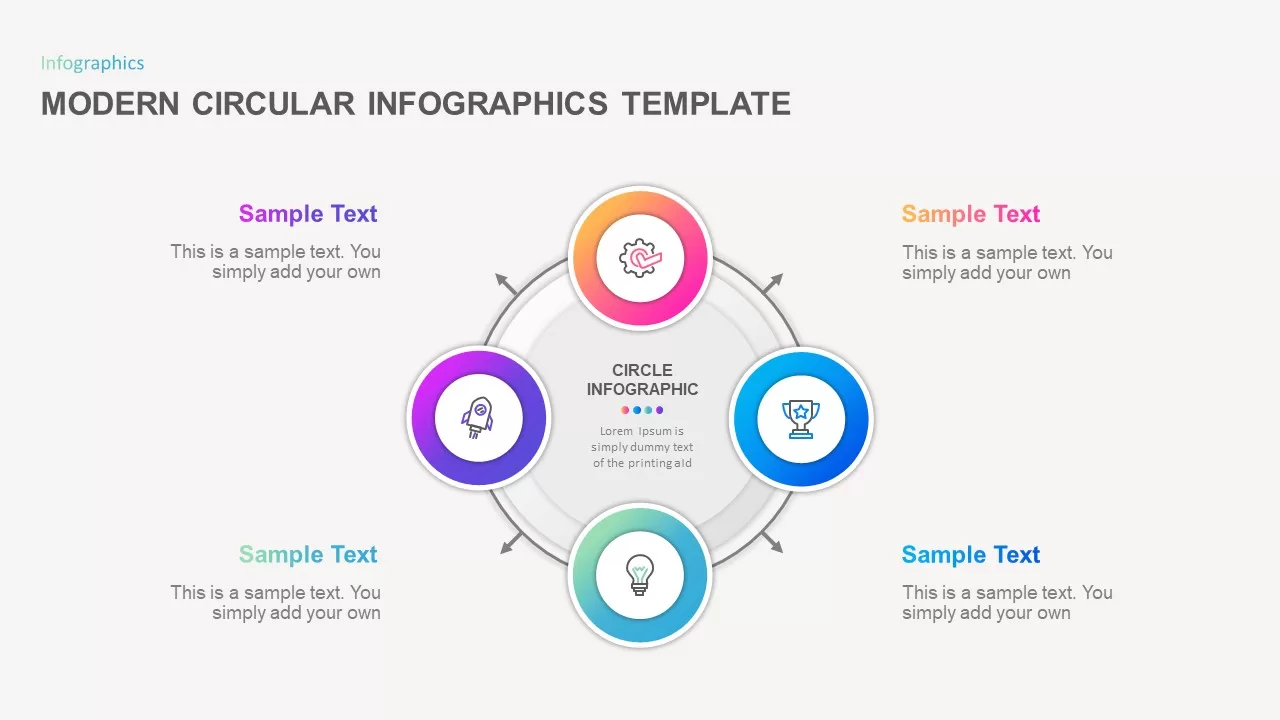
Modern Circular Infographics Template for PowerPoint & Google Slides
Circular
Five-Step Circular Badge Infographics Template for PowerPoint & Google Slides
Circular
Six-Step Circular Diagram Infographics Template for PowerPoint & Google Slides
Circular
8-Step Circular Diagram Infographics Template for PowerPoint & Google Slides
Circular
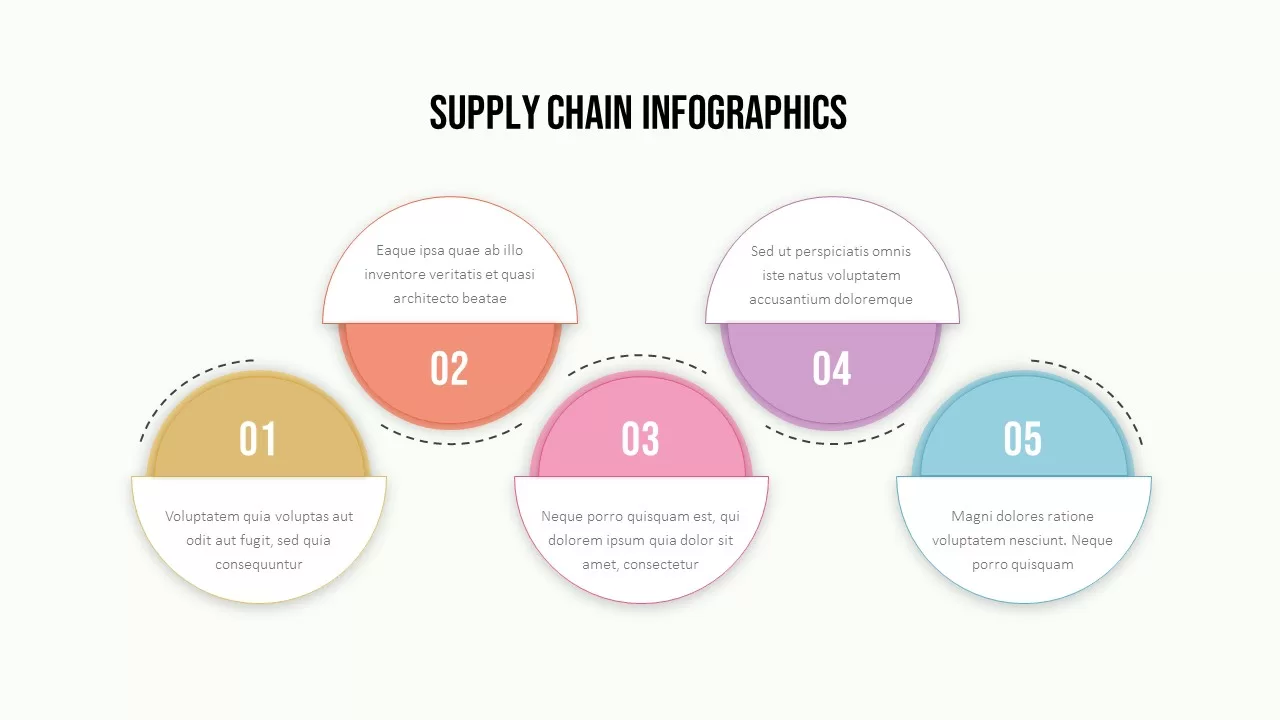
Supply Chain Circular Process Infographics Template for PowerPoint & Google Slides
Business Strategy
8-Step Circular Gear Infographics Diagram for PowerPoint & Google Slides
Process
Budget Flow Representation template for PowerPoint & Google Slides
Process
Six Hexagon Stages Process Flow Diagram Template for PowerPoint & Google Slides
Process
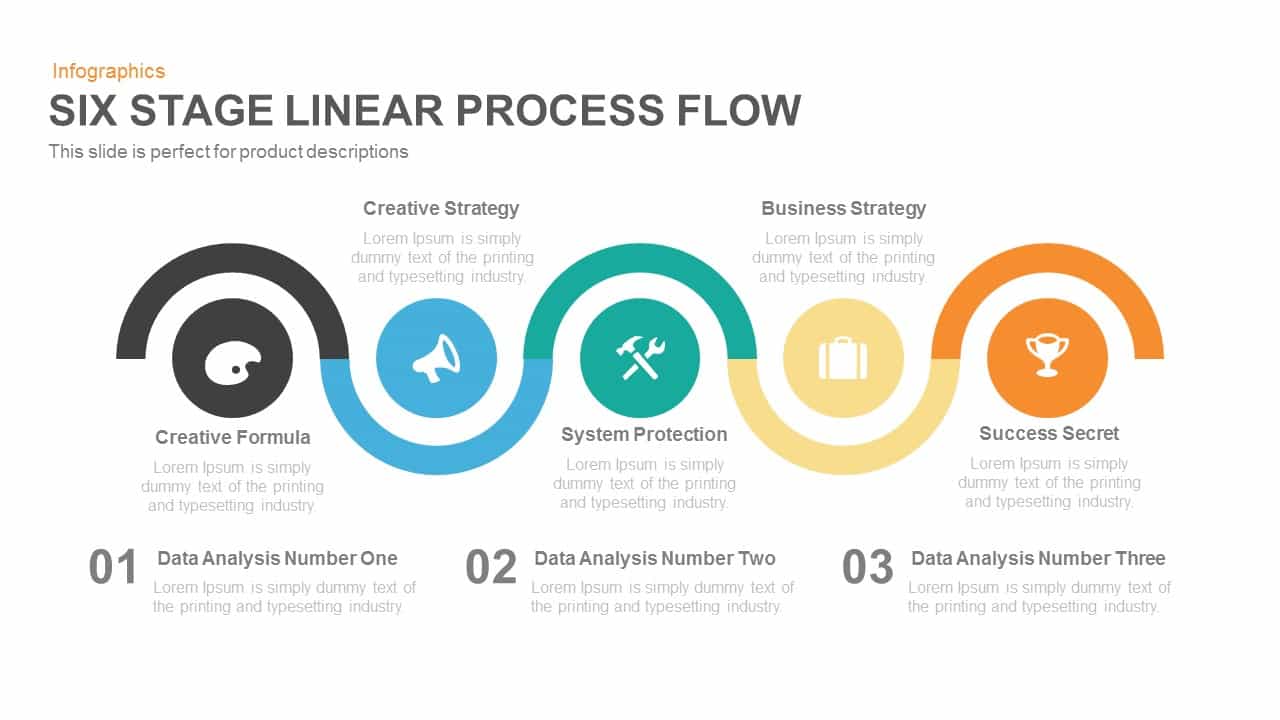
Five Stage Linear Process Flow Template for PowerPoint & Google Slides
Process
Process Flow Diagram template for PowerPoint & Google Slides
Infographics
Five-Stage 3D Box Flow Diagram Template for PowerPoint & Google Slides
Process
Business Strategy Flow template for PowerPoint & Google Slides
Process
10 Stages Business Flow Process Diagram template for PowerPoint & Google Slides
Business
Gear Flow Diagram template for PowerPoint & Google Slides
Process
Eight-Stage Radial Process Flow Diagram Template for PowerPoint & Google Slides
Process
Five-Step Hexagonal Process Flow Template for PowerPoint & Google Slides
Process
Six-Step Hexagon Process Flow Diagram Template for PowerPoint & Google Slides
Process
3D Seven-Stage Process Flow Diagram Template for PowerPoint & Google Slides
Process
5 Stage Linear Process Flow Diagram Template for PowerPoint & Google Slides
Process
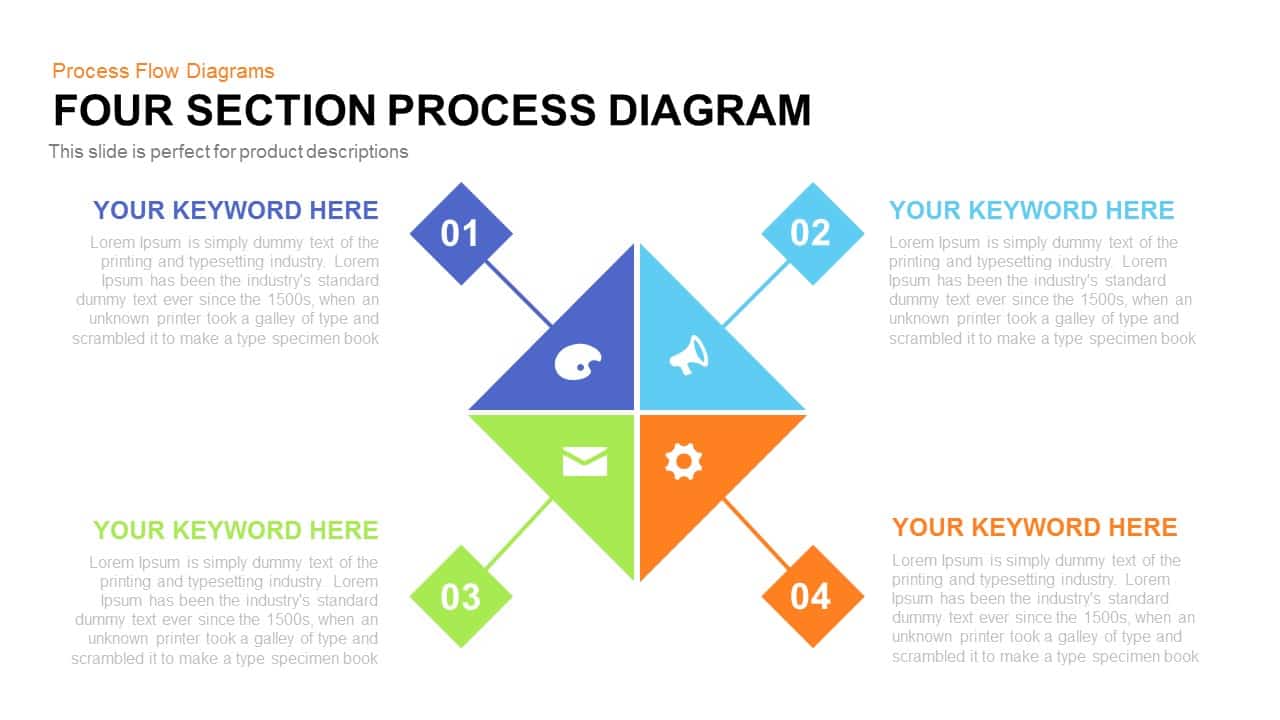
4 Stage Linear Process Flow Diagram Template for PowerPoint & Google Slides
Process
6-Step Business Process Flow Diagram Template for PowerPoint & Google Slides
Process
Business Process Management Flow Diagram Template for PowerPoint & Google Slides
Process
Process Flow Steps template for PowerPoint & Google Slides
Business Plan
Flow Chart Template for PowerPoint & Google Slides
Flow Charts
4 stage Process Flow template for PowerPoint & Google Slides
Process
Circle Arrows Process Flow template for PowerPoint & Google Slides
Process
Hexagonal Process Flow Template for PowerPoint & Google Slides
Process
3D Conveyor Belt Process Flow Diagram Template for PowerPoint & Google Slides
Process
Current vs Future Process Flow Template for PowerPoint & Google Slides
Comparison
Comprehensive Process Flow Diagram Template for PowerPoint & Google Slides
Process
Animated Gears Process Flow Diagram Template for PowerPoint & Google Slides
Process
Wastewater Treatment Process Flow Chart Template for PowerPoint & Google Slides
Flow Charts
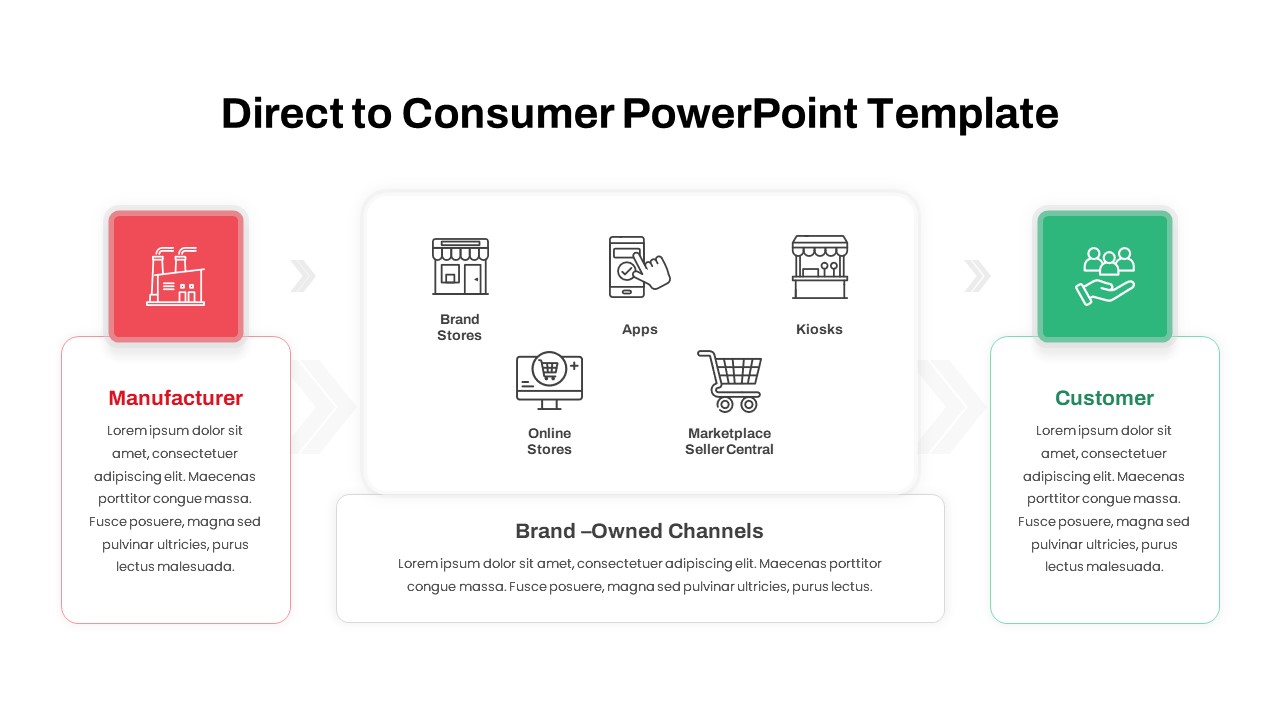
Direct to Consumer Brand Channels Flow Template for PowerPoint & Google Slides
Business Models
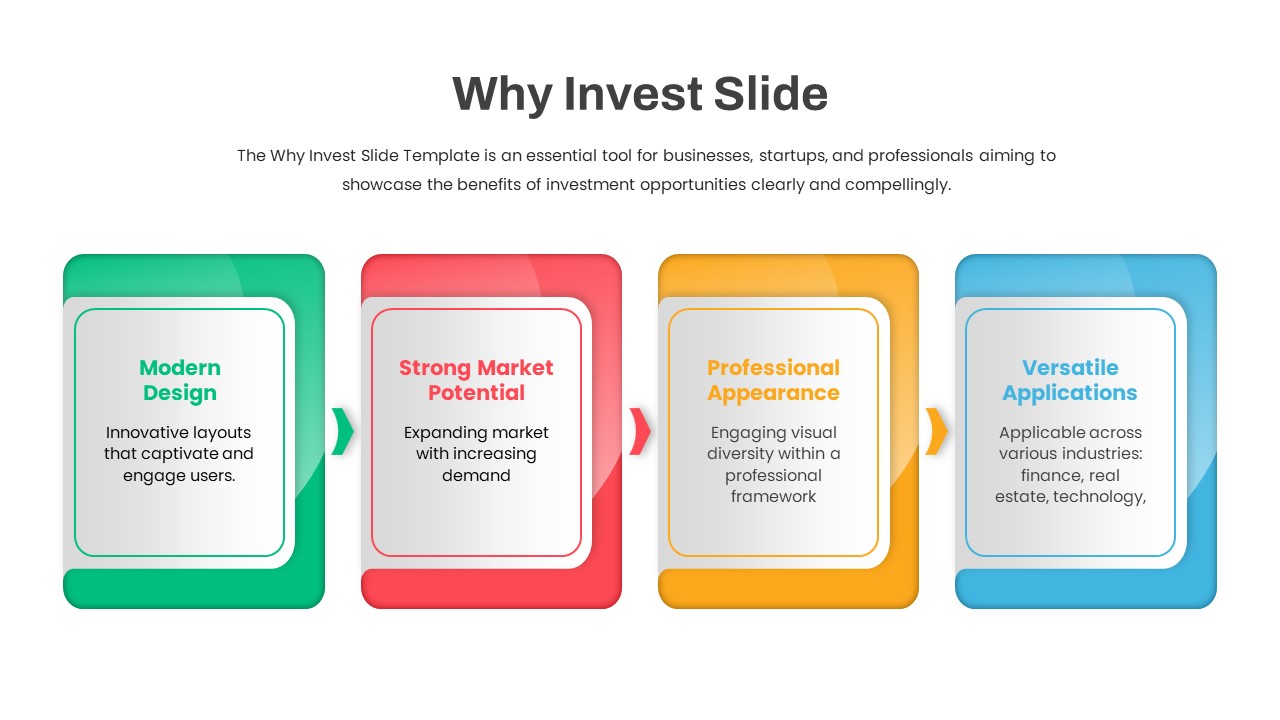
Why Invest Slide Four-Step Benefits Flow Template for PowerPoint & Google Slides
Business Plan
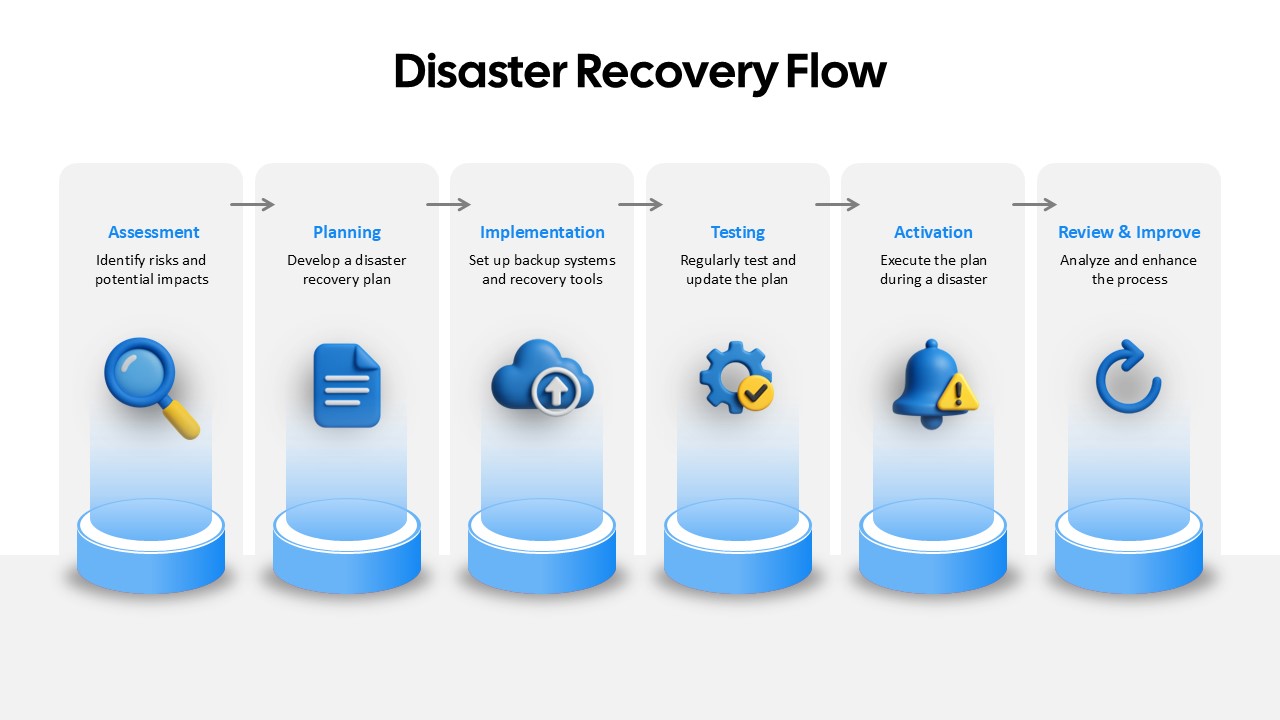
Disaster Recovery Flow Diagram Template for PowerPoint & Google Slides
Process
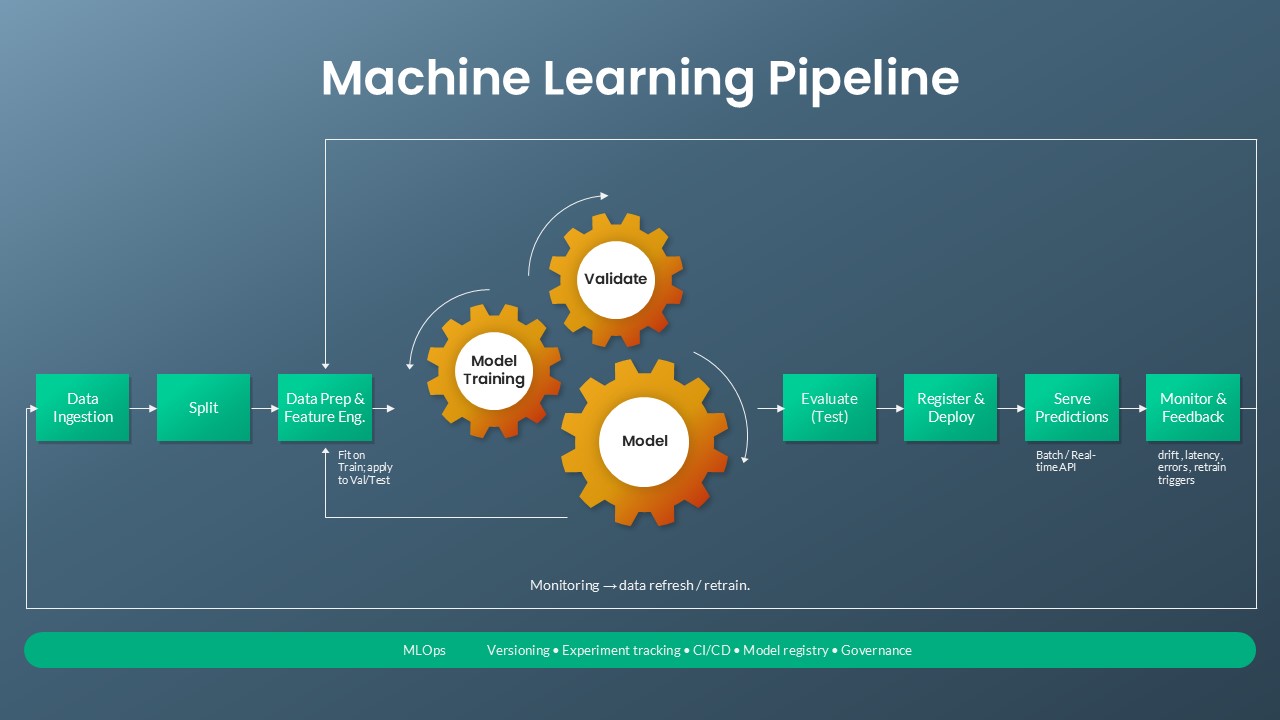
Machine Learning Pipeline & MLOps Flow Template for PowerPoint & Google Slides
Machine Learning
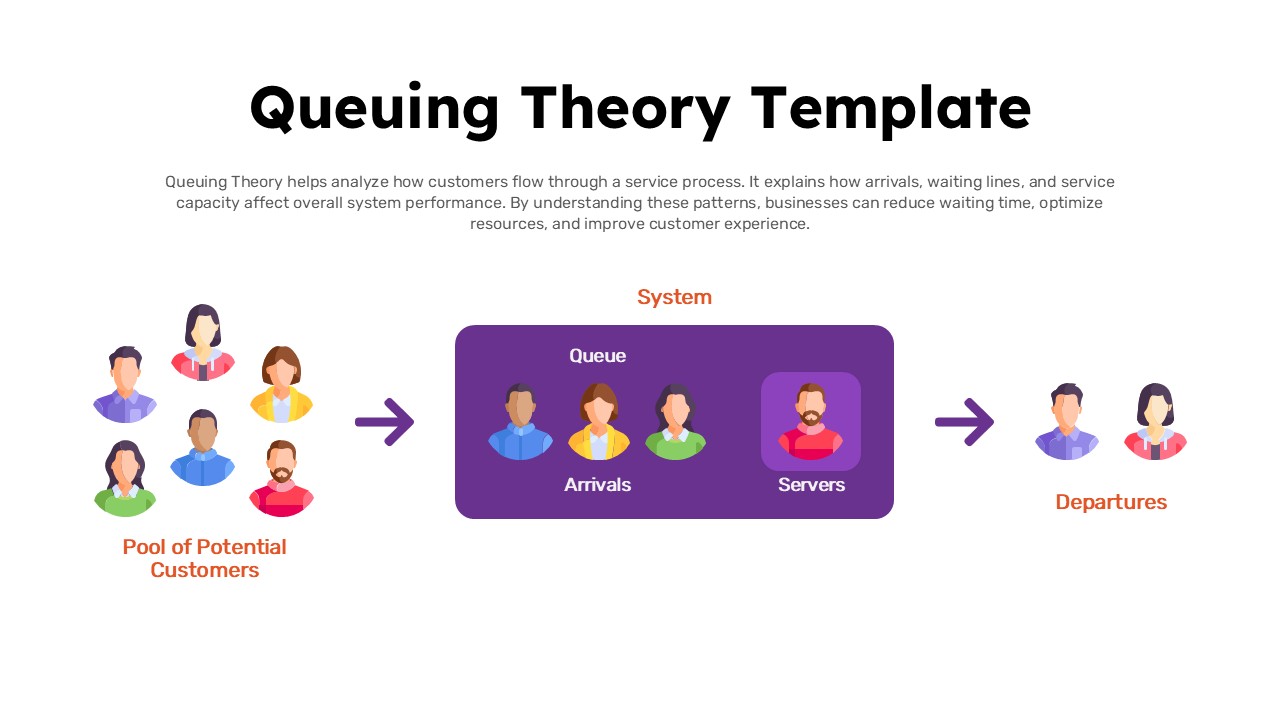
Queuing Theory System Flow Diagram Template for PowerPoint & Google Slides
Process