Website Performance Dashboard
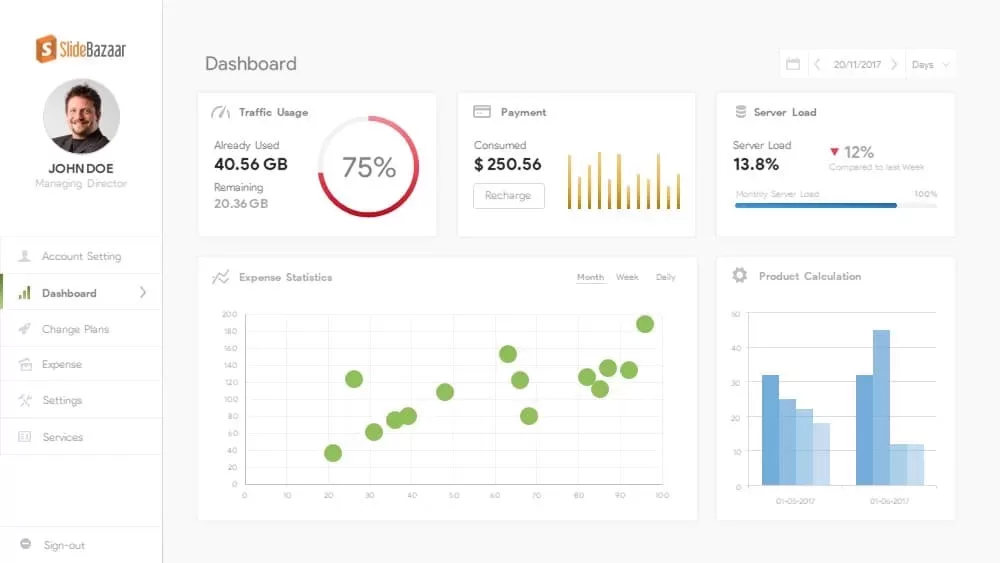
If you want to share companies’ performance in a summarized view, choose statistics dashboards. The website performance dashboard is a data-driven powerpoint chart that helps present the sales process and development in a comprehensive tool. Dashboards are integrated devices that combine different statistical measurement diagrams in a single slide. This website performance ppt dashboard is compiled with line graphs, demographic distribution charts, pie charts, bar chart, and times showing templates. It is designed for website analytics, email, and digital marketing analytics. However, it is useful for other business metrics with slight changes in the template design. For example, you can show your research findings if you are a teacher or a student. Statistical reports show that it can be precise with powerpoint graphs and diagrams.
Dashboard powerpoint will monitor performance, business processes, and its analytics. Based on these Key performance indicators, businesses can take improvement measures. In website performance, the dashboard will display the reports of visitors, organic traffic, timestamp, and lead conversions. This data is vital for creating a high-performing marketing strategy. The powerpoint dashboard allows viewers to compare statistics and make quick examinations based on the data. As a professional template, this is created for qualified presenters engaged with research in digital marketing or business management. However, being a common presentation model, website performance can be used for any report presentation that needs the support of statistics.
The website performance dashboard powerpoint template is a two-slide presentation on a black-and-white background. It is a multiple presentation design that allows website performance presentation, sales presentation, financial data presentation, business KPI presentation, and presenting any analytics-related business and research. Presenters can customize data and modify the graphics to fit the purpose. Besides, you can change background colors according to your color sense. Download alternative dashboard templates from our gallery and accurately show your business data and reports.
Login to download this file


